1st Century Bancshares — Investor Presentation (September 2010)
27 slides from 1st Century Bancshares's investor presentation, Sep 14, 2010
Slide 1: 1st Century Bancshares, Inc.
Exhibit 99.1 1st Century Bancshares, Inc. Alan. Rothenberg Chairman and Chief Executive Officer 4 Century Baneshares, Inc
Slide 2: Safe Harbor Statement
Safe Harbor Statement Certainmatters discussed in this presentationmay constitute fonvard-looking statements within hemeaning of the “safe harbor” provisions ofthe Private Secunties/tigationRefom Act of 1995. You can find many (but not all of these statements by looking forwords such as “approximate
Slide 3: 1st Century Bank
1st Century Bank Founded by business people for business people in 2004, 1st Century Bank meets the specific needs of entrepreneurs, professionals, high net worth individuals and small businesses. Our success has been achieved by providing an extraordinary level of personal service and serving as ad
Slide 4: Bank Profile
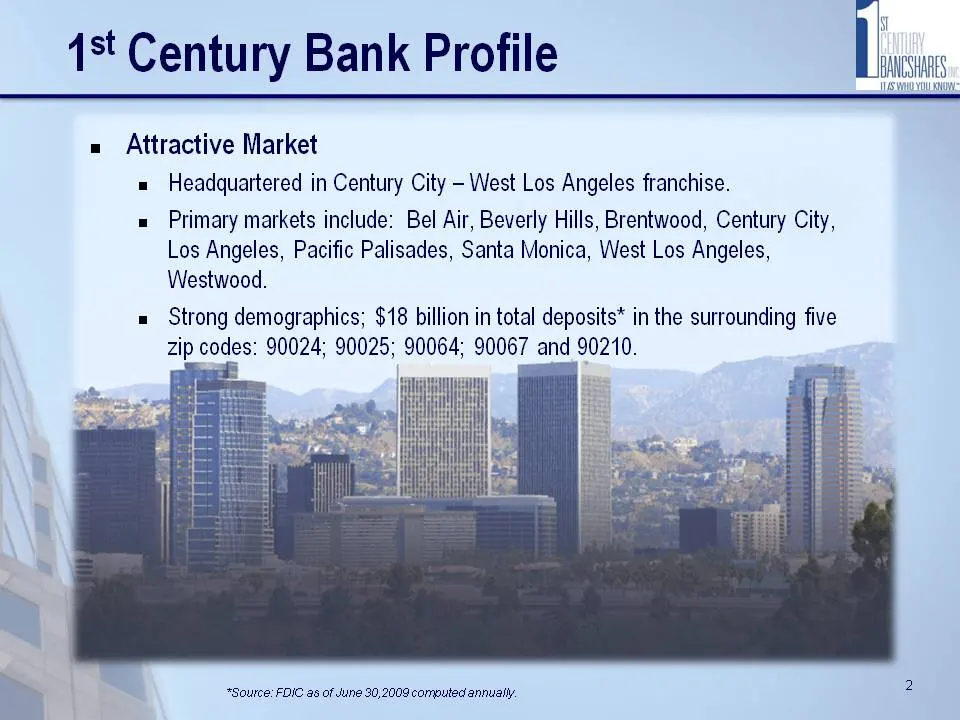
1st Century Bank Profile « Attractive Market = Headquartered in Century City - West Los Angeles franchise. = Primary markets include: Bel Air, Beverly Hills, Brentwood, Century City, Los Angeles, Pacific Palisades, Santa Monica, West Los Angeles, Westwood. = Strong demographics; $18 billion in total
Slide 5: Bank Profile (cont.)
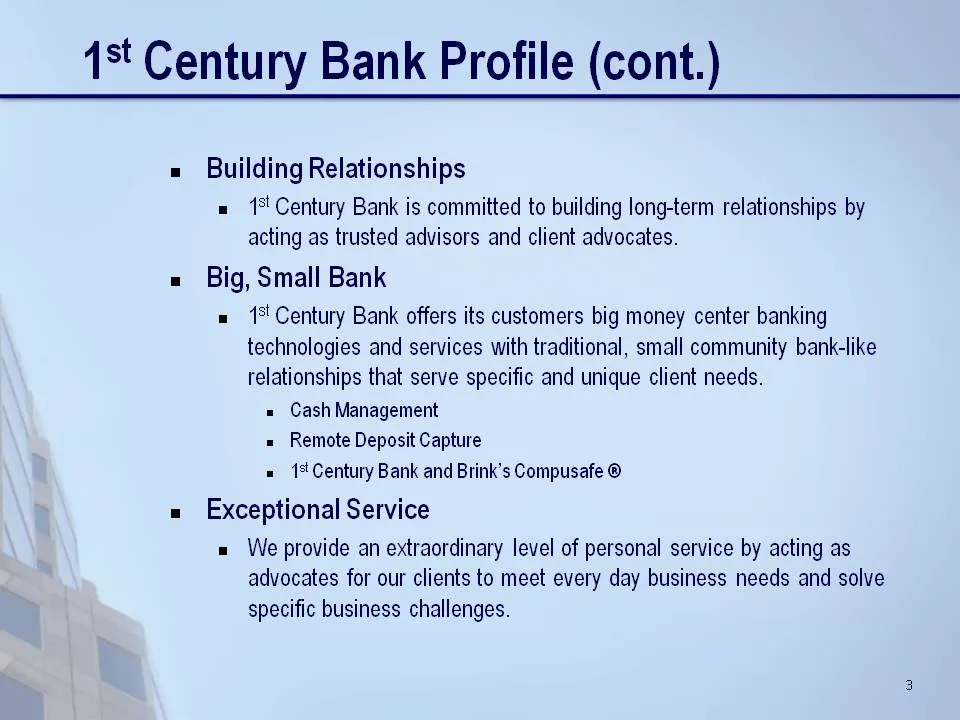
1st Century Bank Profile (cont.) = Building Relationships = 1% Century Bank is committed to building long-term relationships by acting as trusted advisors and client advocates. = Big, Small Bank = 1% Century Bank offers its customers big money center banking technologies and services with traditiona
Slide 6: Bank Strategy for 2010
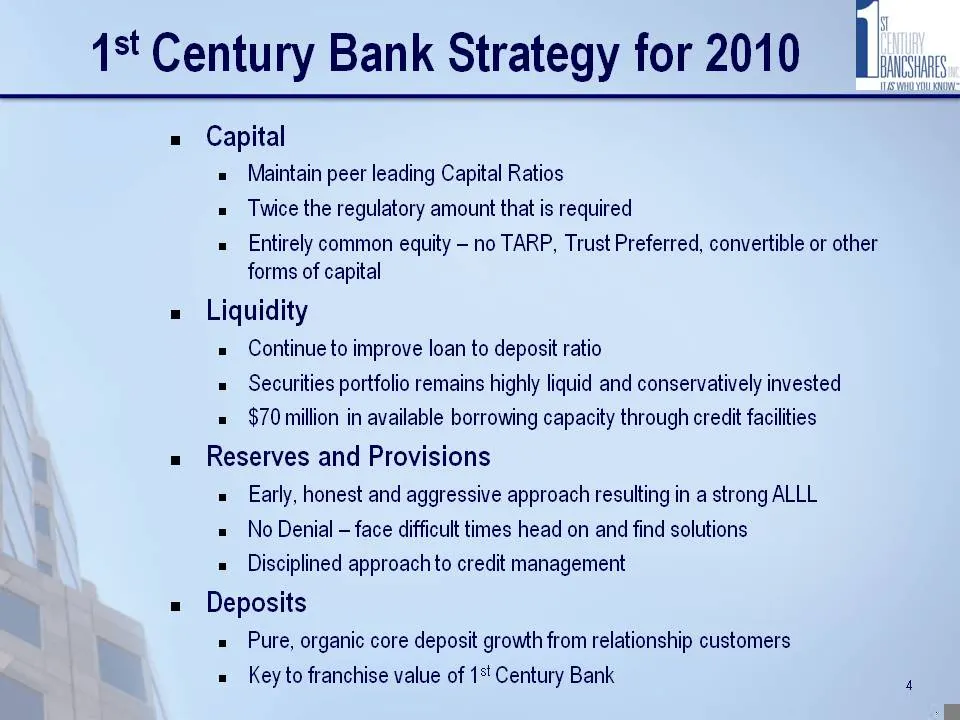
1st Century Bank Strategy for 2010 l = Capital = Maintain peer leading Capital Ratios = Twice the regulatory amount that is required = Entirely common equity - no TARP, Trust Preferred, convertible or other forms of capital = Liquidity = Continue to improve loan to deposit ratio = Securities portfol
Slide 7: Bank Strategy for 2010 (cont.)
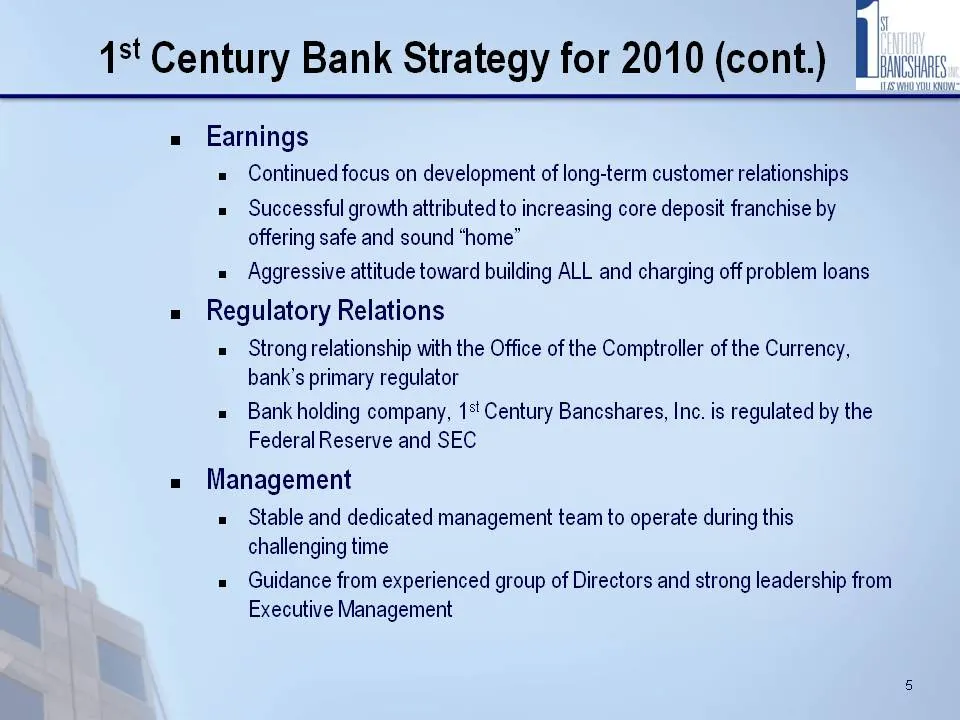
1st Century Bank Strategy for 2010 (cont.) li = Earnings Continued focus on development of long-term customer relationships Successful growth attributed to increasing core deposit franchise by offering safe and sound “home” Aggressive attitude toward building ALL and charging off problem loans = Reg
Slide 8: 2010 Mid-Year Highlights
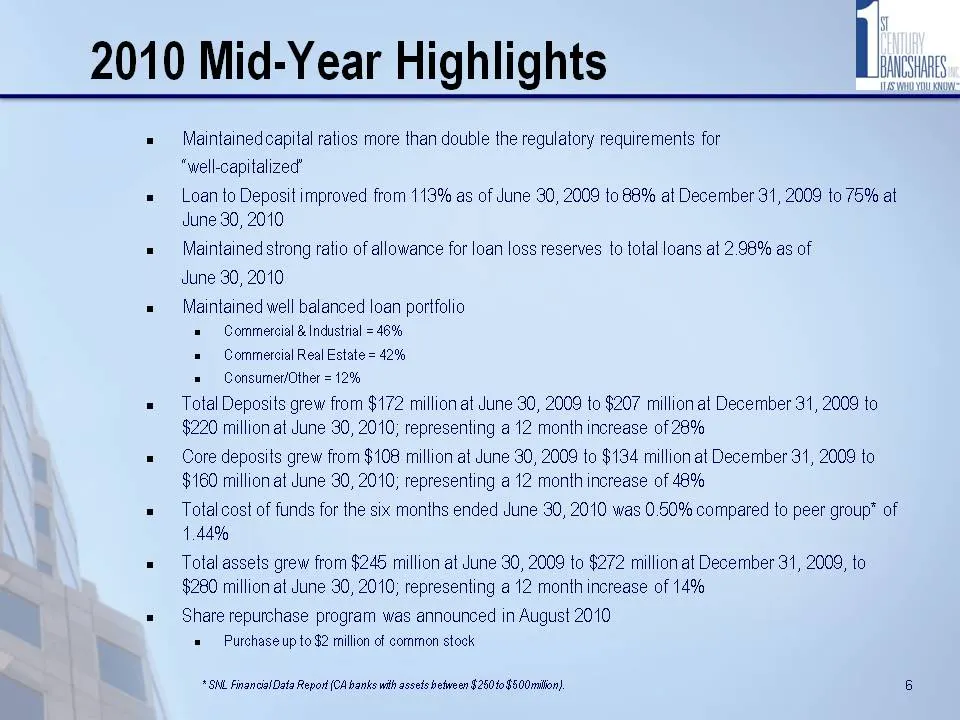
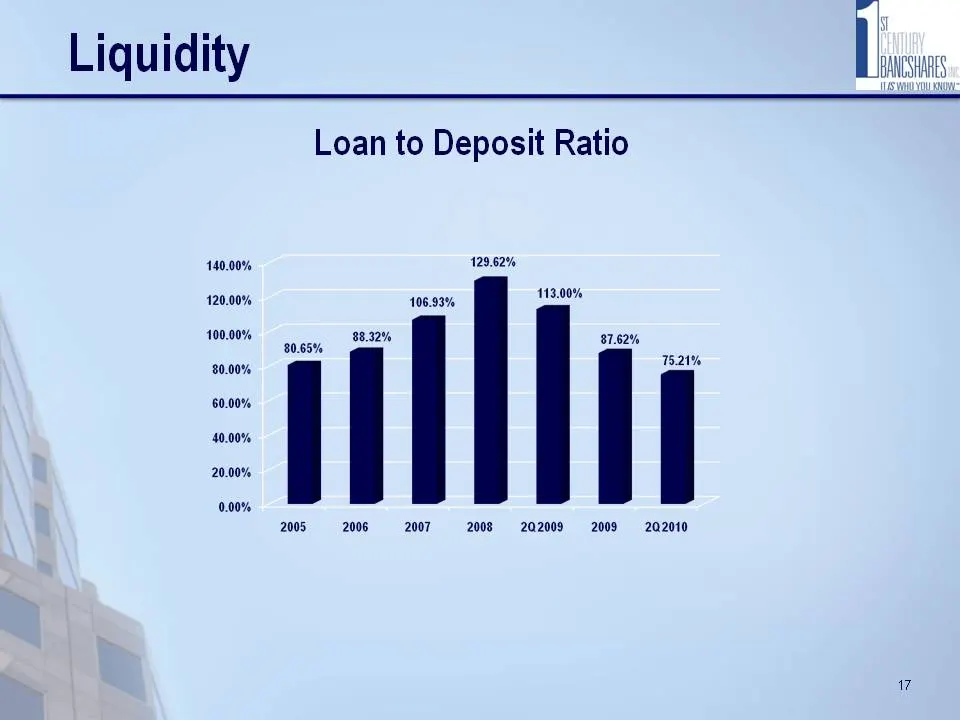
2010 Mid-Year Highlights Maintained capital ratios more than double the regulatory requirements for “well-capitalized’ Loan to Deposit improved from 113% as of June 30, 2009 to 88% at December 31, 2009 to 75% at dune 30, 2010. Maintained strong ratio of allowance for loan loss reserves to total loan
Slide 9: 2010 Mid-Year Highlights (cont.)
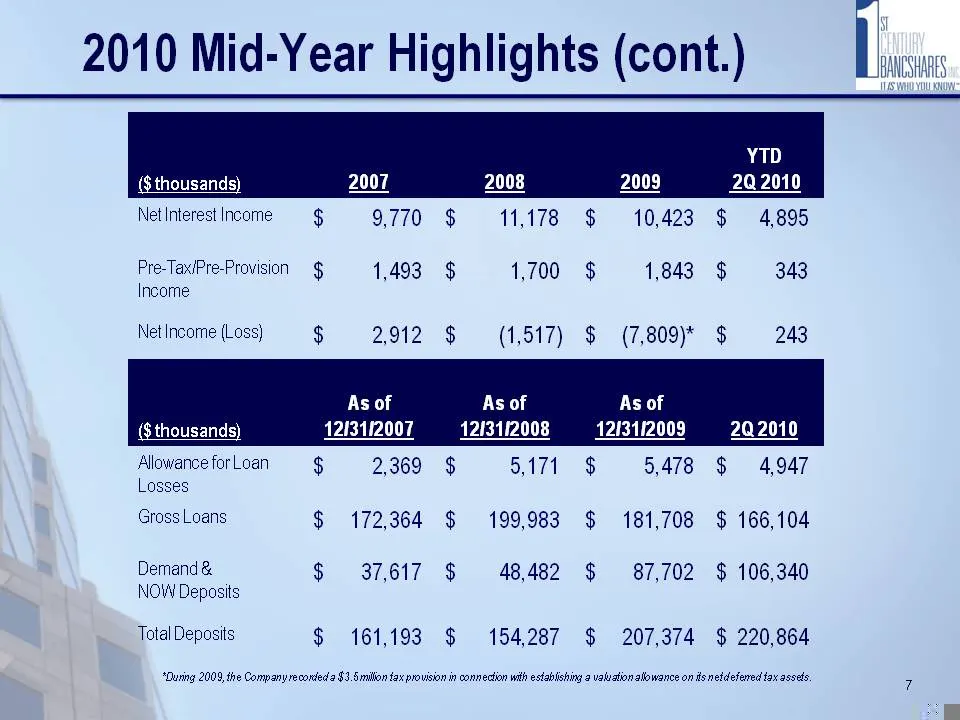
2010 Mid-Year Highlights (cont.) YTD ($ thousands) 2007 2008 2009 2Q 2010 Net Interest Income $ 9,770 $ 11,178 $ 10,423 $ 4,895 Pre-TaxiPre-Provision —$ 1,493 $ 1,700 $ 1,843 $ 343 Income NetIncome (Loss) § «= « 2.912 $ (1,517) $ (7,809)* $ 243 As of As of As of ($ thousands) 1213112007 1213112008 1
Slide 10: Bank Outlook
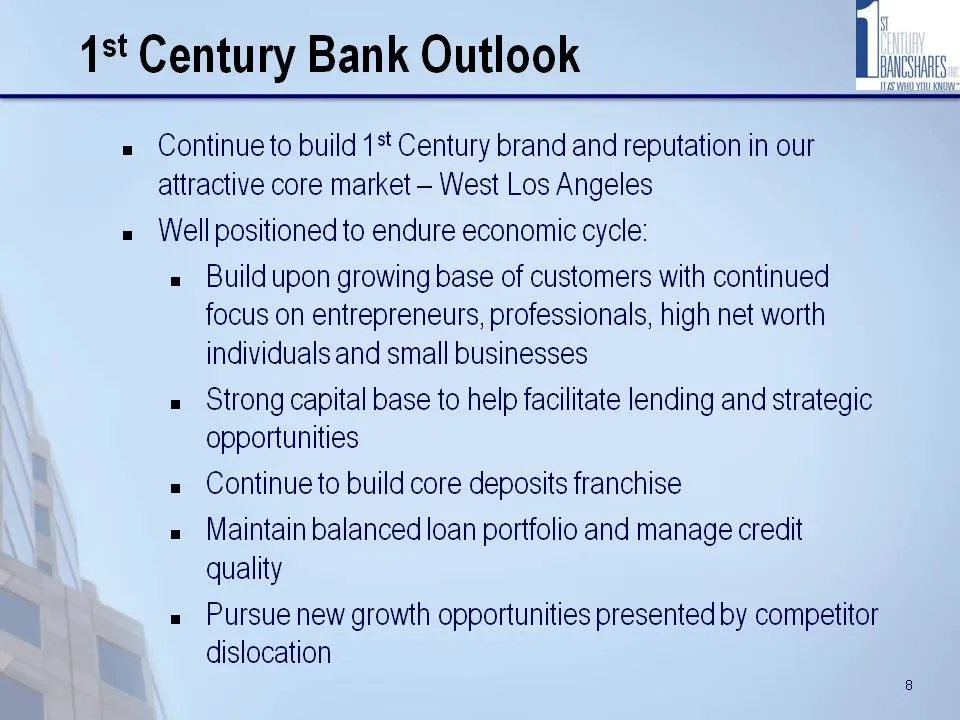
1st Century Bank Outlook » Continue to build 1% Century brand and reputation in our attractive core market - West Los Angeles « Well positioned to endure economic cycle: Build upon growing base of customers with continued focus on entrepreneurs, professionals, high net worth individuals and small bu
Slide 11: Financial Overview
l. SINSHRES Tus yng UO: Financial Overview
Slide 12: Well Capitalized
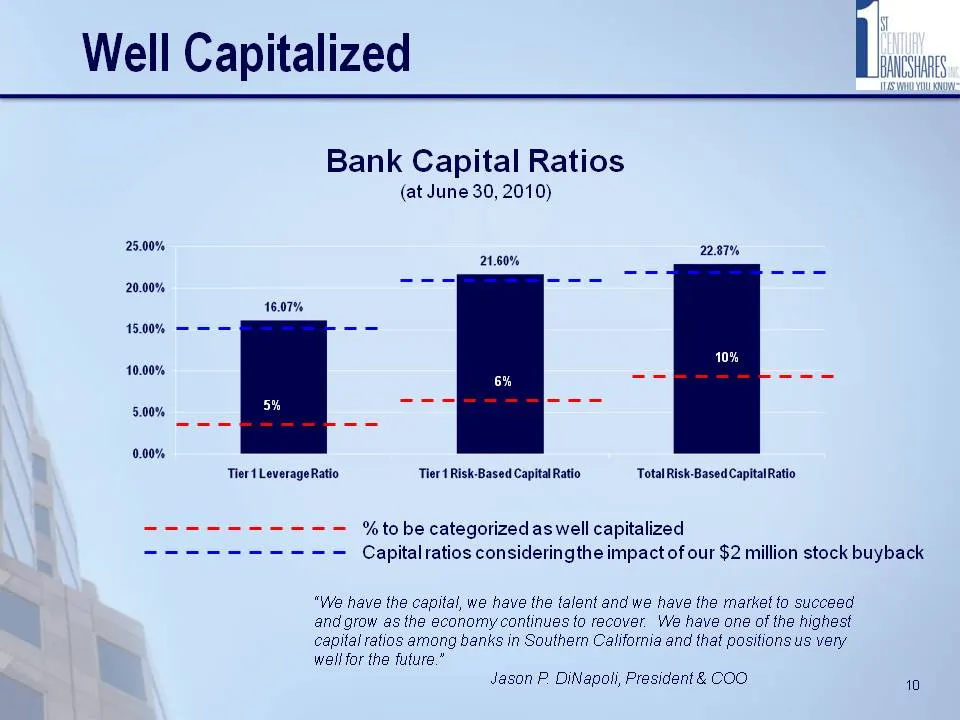
Well Capitalized 25.00% 20.00% 15.00% 10.00% 5.00% 0.00% . be | Bank Capital Ratios (at June 30, 2010) 22.87% 21.60% Tier t Leverage Ratio Tier 4 Risk-Based Capital Ratio Total Risk-Based CapitalRatio Sa Sees % to be categorized as well capitalized \werr---- Capital ratios consideringthe impact of o
Slide 13: Well Capitalized (cont.)
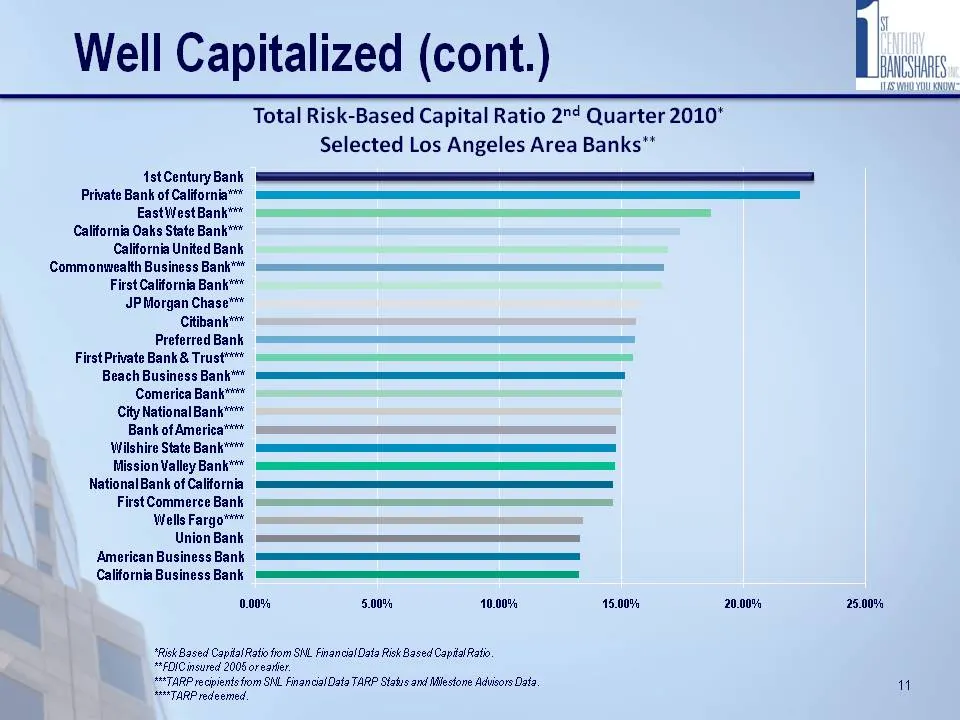
Well Capitalized (cont.) Total Risk-Based Capital Ratio 2"4 Quarter 2010° 4st Century Bank Private Bank of California"™* EastWestBankt** California Oaks State Bank'** California United Bank Commonwealth Business Bank" First California Bank*** JPMorgan Chase*** Citihank*™* Preferred Bank FirstPrivate
Slide 14: Deposits — Expanding Core Deposit Base
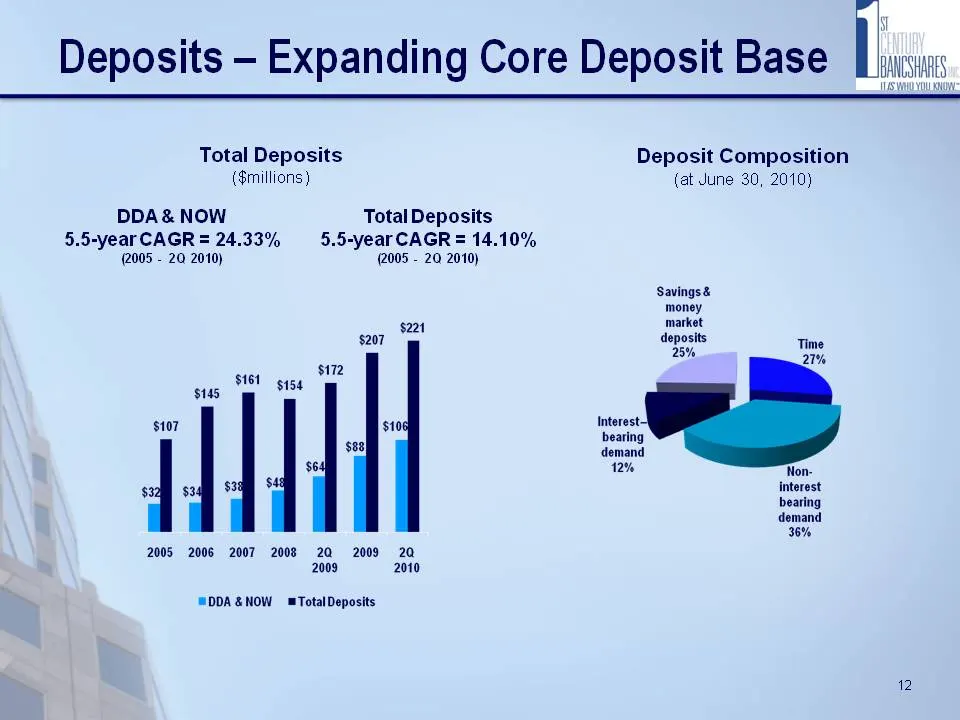
NI Deposits — Expanding Core Deposit Base J js: Total Deposits Deposit Composition ($millions) {at June 30, 2010) DDA& NOW Total Deposits 5.5-year CAGR = 24.33% 5.5-year CAGR = 14.10% (2005 - 20 2010) (2005 - 20 2010) Savings& money market $221 $207 Gipeste ES 2 21% $172 sus St sist $107 $10 Interes
Slide 15: Deposit Trends — Expanding Granularity
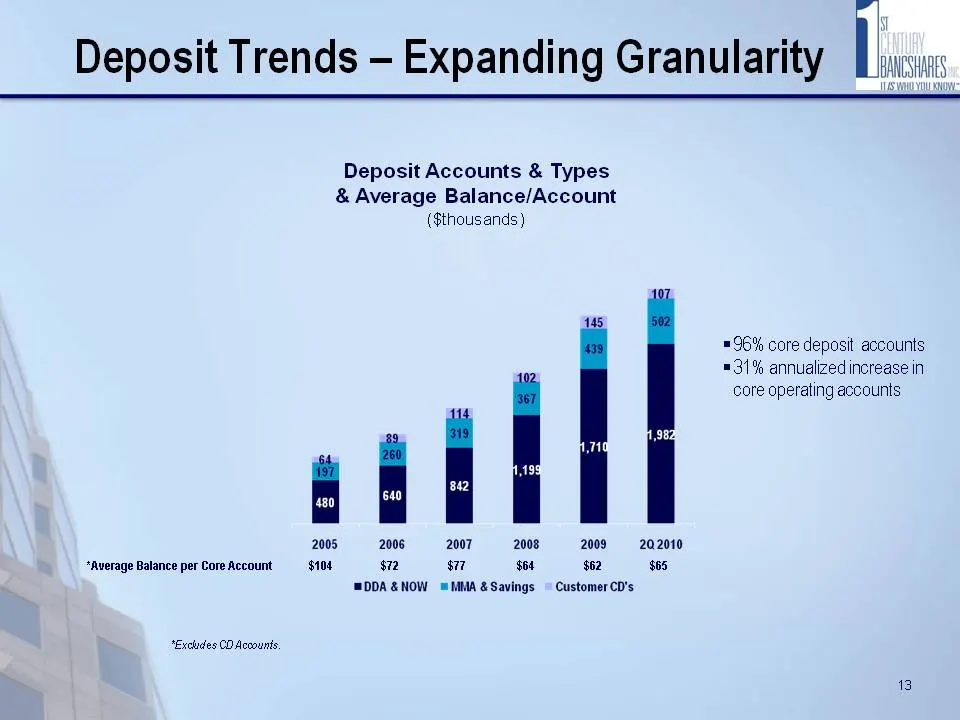
Deposit Trends — Expanding Granularity li Deposit Accounts & Types & Average Balance/Account ($thousands) 4 = 96% core deposit accounts =31% annualized increase in core operating accounts 2005 2006 2007 = 2008» 2009202010 *average Balance per CoreAccount «$104 $72 $77 $04 $62 $65 ‘MDDA &NOW =MMA &Sa
Slide 16: Deposit Growth
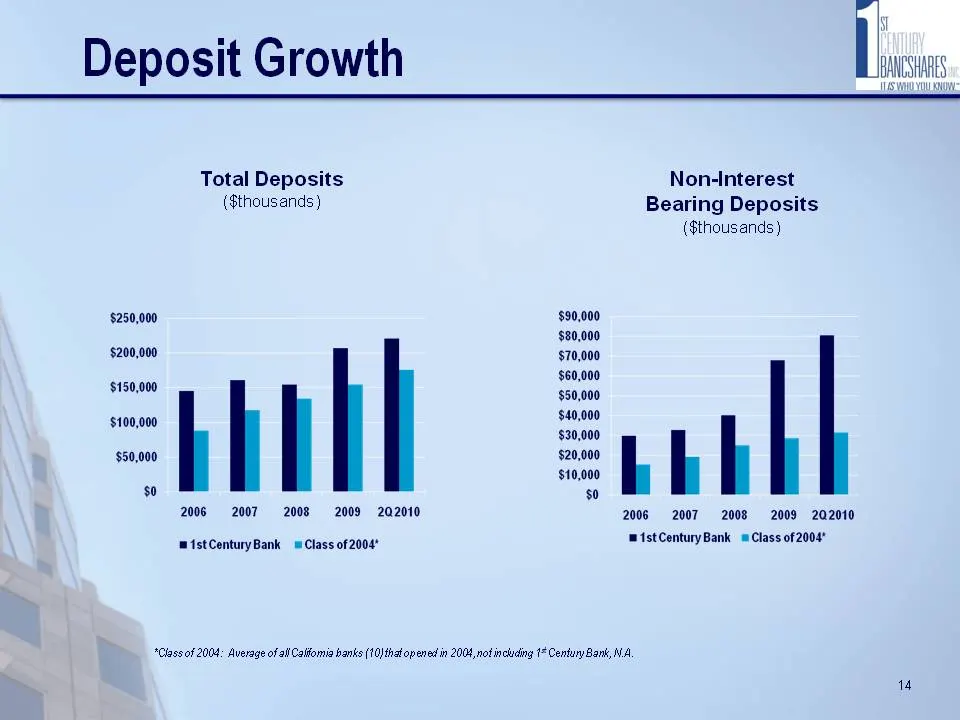
Deposit Growth Total Deposits Non-Interest ($thousands) Bearing Deposits ($thousands) $250,000 aaa) $80,000 $200,000 $70,000 $60,000 TRUS $50,000 $100,000 eee $30,000 $10,000 $0 $0 2006 = 2007 2008 = 2009 202010 2006 = 2007-2008 )= 2009202010 mist Cer mistCenturyBank Class of 2004" ity Banik Chass Z
Slide 17: Deposit Growth (cont.)
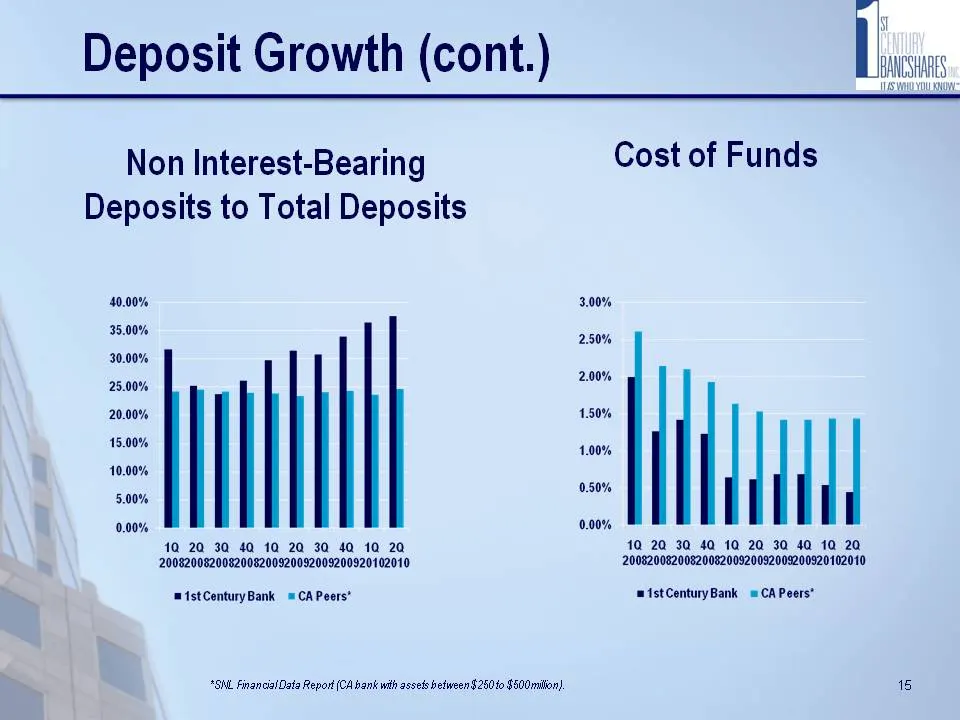
Deposit Growth (cont.) Non Interest-Bearing Cost of Funds Deposits to Total Deposits 40.00% 3.00% 35.00% a 30.00% rape 2.00% 20.00% 1.50% 15.00% Ae 10.00% 5.00% aa 0.00% 0.00% 10 20 30 40 10 20 30 40 10 20 10 20 30 40 10 20 30 40 10 20 2008200820082008200920082009200920102010 20082008200820082008200
Slide 18: Deposit Growth (cont.)
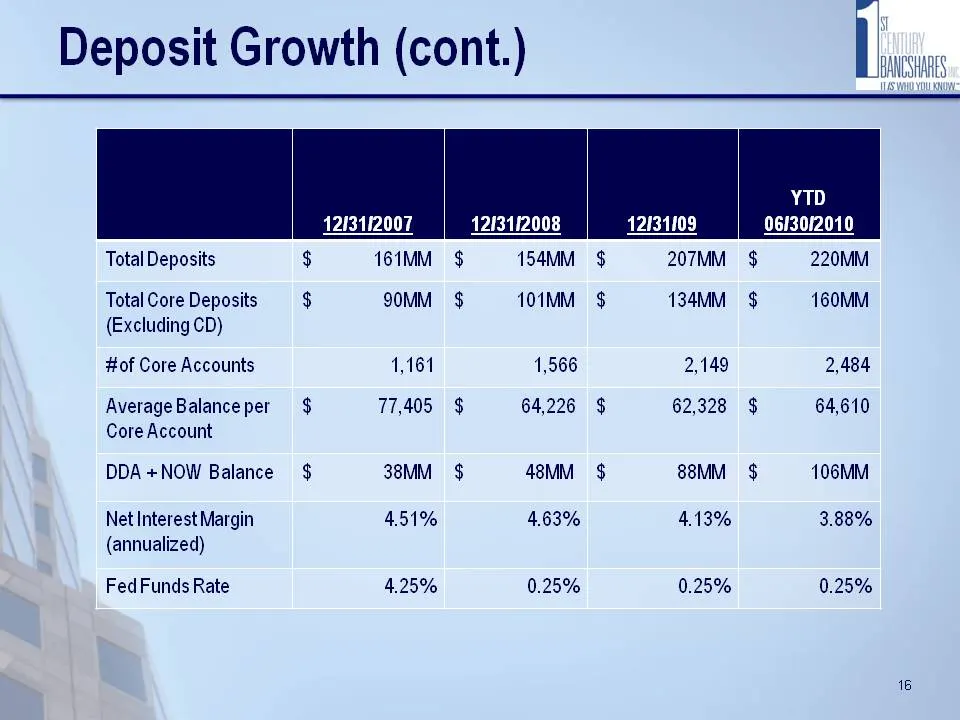
Deposit Growth (cont.) bol 12131172007 | 1213112008 “oe | a senazenn Total Deposits 161MM 154MM Total Core Deposits $ 90MM $ 101MM (Excluding CD) #of Core Accounts 1,161 1,566 AverageBalanceper $ 77,405 $ 64,226 Core Account DDA+NOW Balance $ 38MM $ 48MM Net Interest Margin 451% 4.63% (annualized) F
Slide 19: Liquidity
Liquidity Loan to Deposit Ratio 140.00% 129.62% 120.0% 06.93% 113.00% 10.00% ay, 82% a 80.00% 75.21% 60.00% 40.00% 20.00% 0.00% 2005 2006 »= 20072008» 2020092009» 202010 W7
Slide 20: Liquidity (cont.)
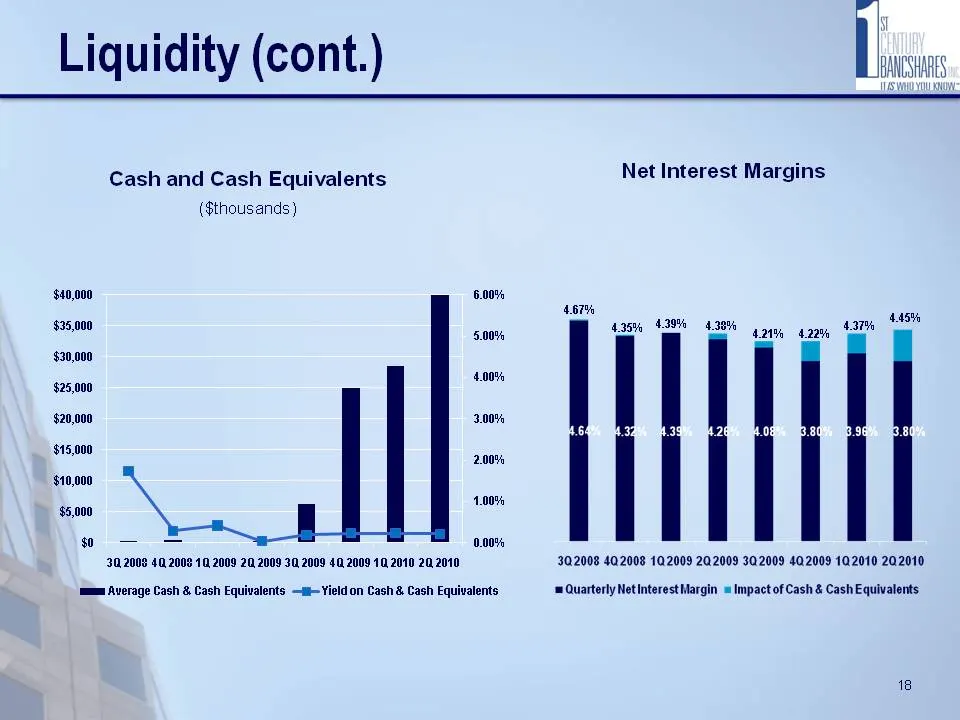
Liquidity (cont.) $40,000 $35,000 $30,000 $25,000 $20,000 $15,000 $10,000 $5,000 $0 Cash and Cash Equivalents ($thousands) 30,2008 40 2008 10 2009 20 2009 30 2009 40,2009 10,2010 20,2010 6.00% 5.00% 4.00% 3.00% 2.00% 1.00% 0.00% mms Average Cash & Cash Equivalents —a- Yield on Cash & Cash Equivalent
Slide 21: Asset Base
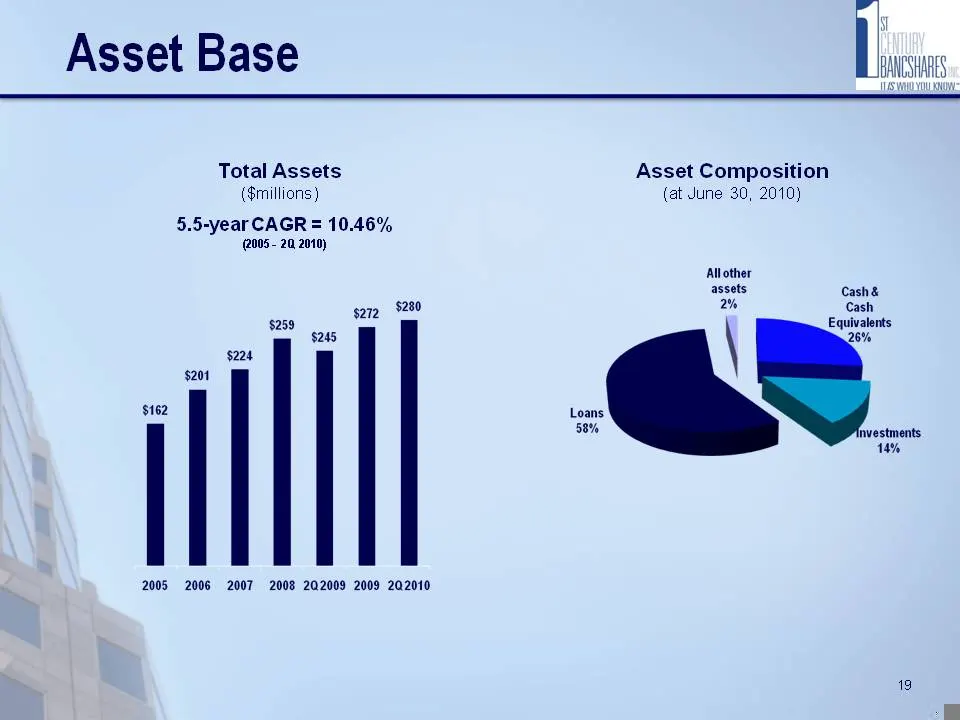
Asset Base Total Assets ($millions) 5.5-year CAGR = 10.46% (2005 - 20 2010) Rope te $259 $245 $228 $201 $162 | 2005 2006 2007 2008 202009 2009 202010 Asset Composition {at June 30, 2010) Allother assets Cash& 2h Cash Equivalents Loans 58% 19
Slide 22: Balanced Loan Portfolio
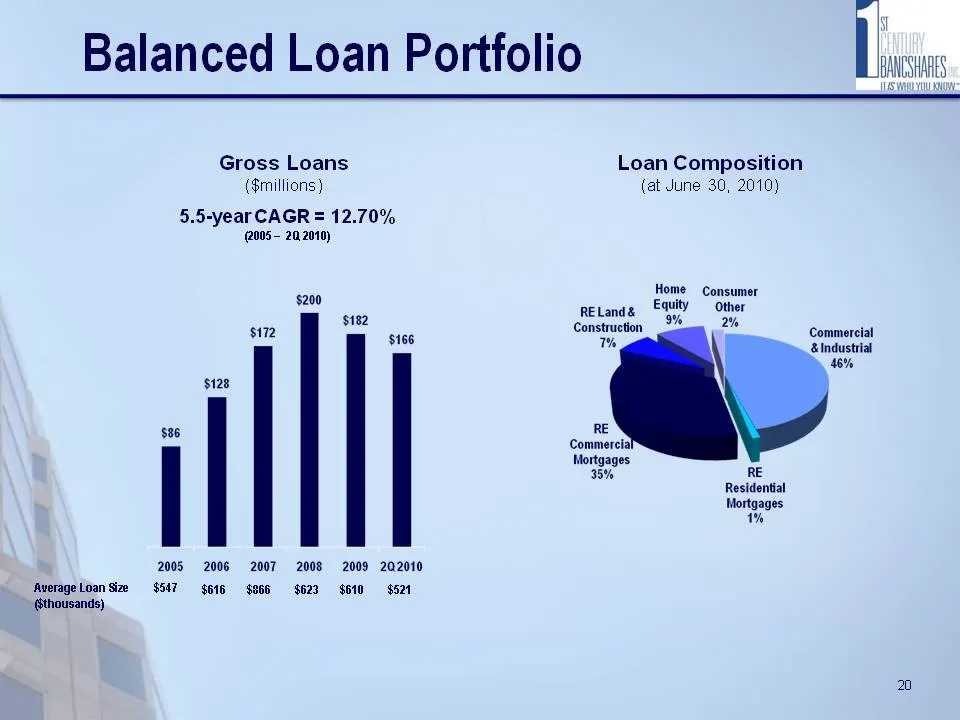
Balanced Loan Portfolio Gross Loans Loan Composition ($millions) {at June 30, 2010) 5.5-year CAGR = 12.70% (2005 - 20,2010) Home Consumer $200 RELande EAuity Other stv cm Mm $172 a Coes cator Commercial Uo} & Industrial 46% $128 $36 re Commercial Mortgages 35% RE Residential Mortgages % 2005 2006 ©
Slide 23: Loan loss reserves vs. CA peers
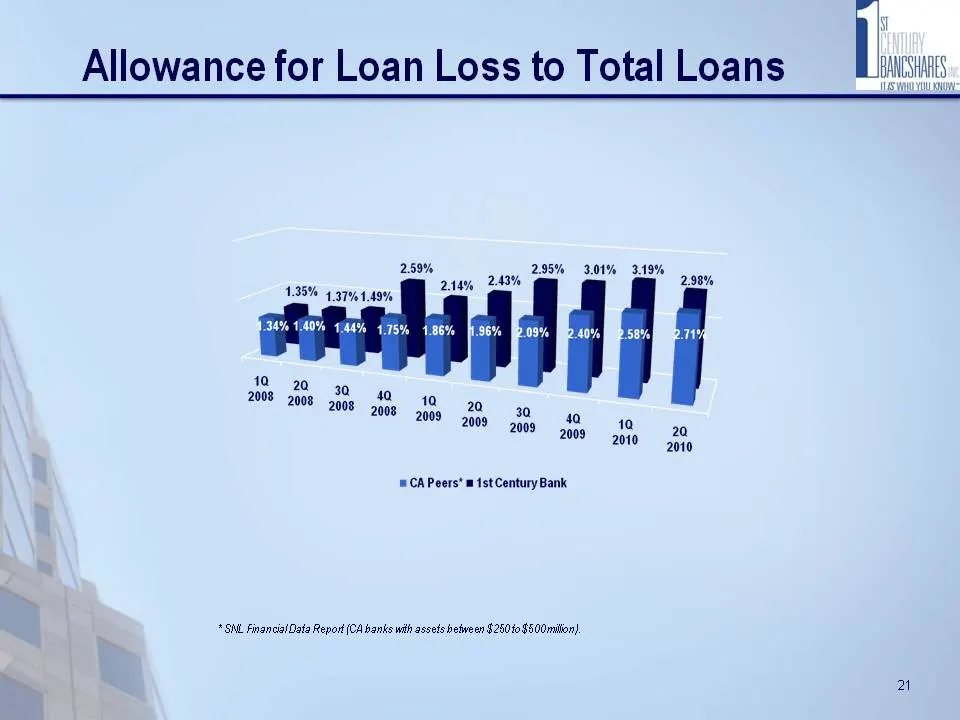
2.59% 2.95% 3.01% 3.19% 2.98% | = CA Peers’ m ist Century Bank * SNL Financial Date Report {CA banks wil assets between $2500 8500milion) 24
Slide 24: Bank Earnings
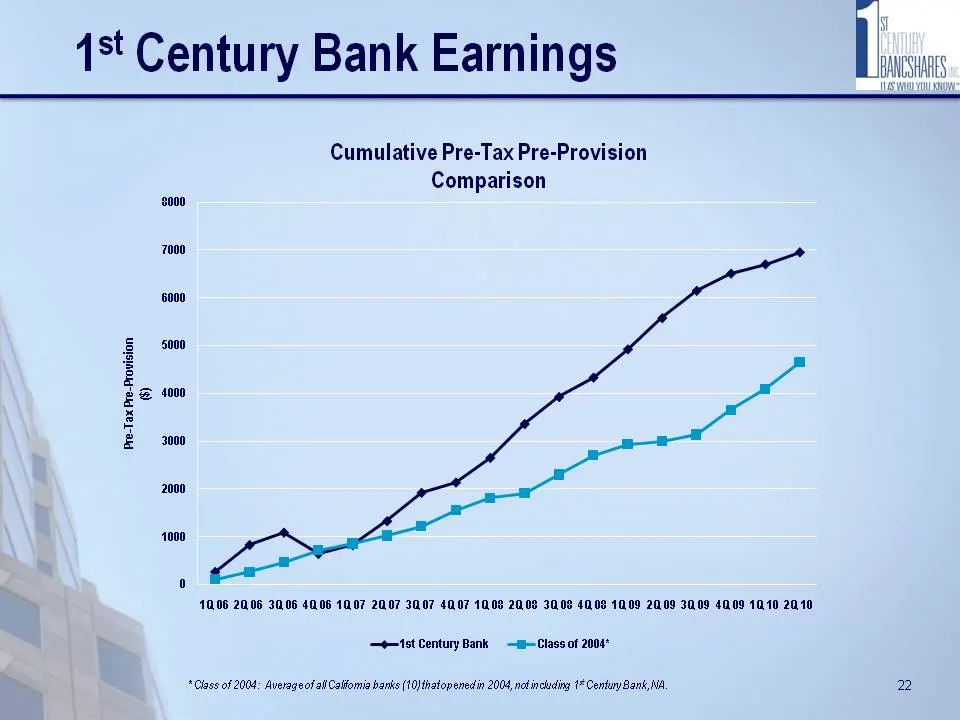
1st Century Bank Earnings Cumulative Pre-Tax Pre-Provision Comparison 2000 7000 e000 000 000 3000 2000 1000 10.06 20.06 3006 4006 1007 2007 3007 4007 1008 2008 30.08 40.03 10.09 2009 3009 4009 1010 2040 oot Century Bank = ——Class of 2008" = * Clase of 2004: AverageofallCalfomia banks (10}thatopenedi
Slide 25: Selected financial data
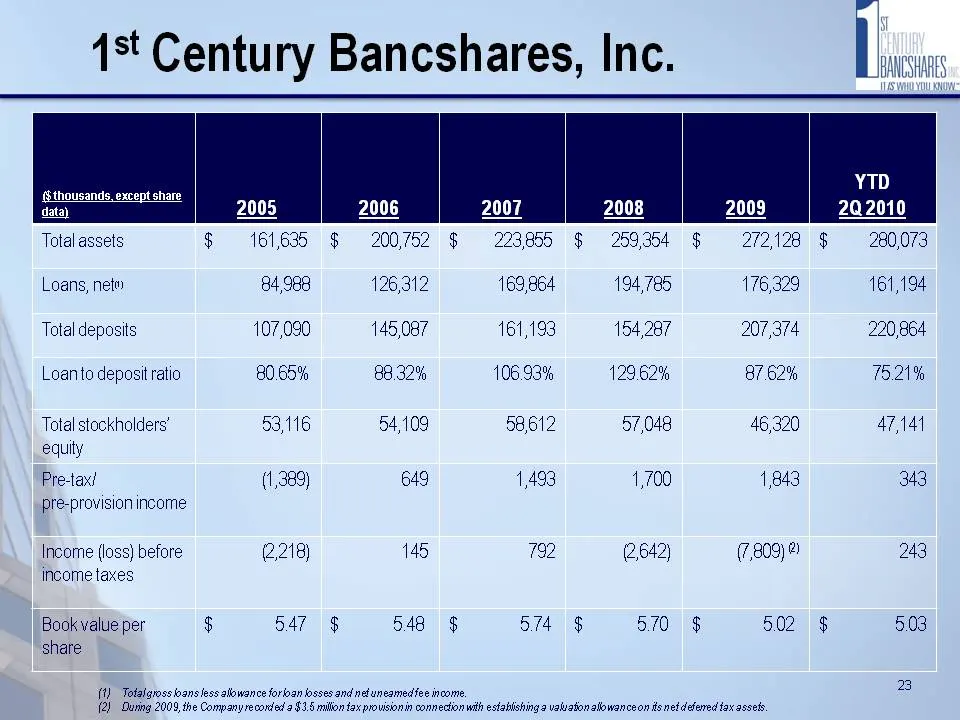
1st Century Bancshares, Inc. Gpaieeite _ 2001208 mF za201 Total assets $ 161,635 $ 200,752 § 223855 § 259,354 272128 $ 280,073 Loans, net 84,988 126,312 169,864 194,785 176,329 161,194 Total deposits 107,090 145,087 161,193 154,287 207,374 220,864 Loan to deposit ratio 80.65% 88.32% 106.93% 129.62%
Slide 26: Why 1st Century Bancshares?
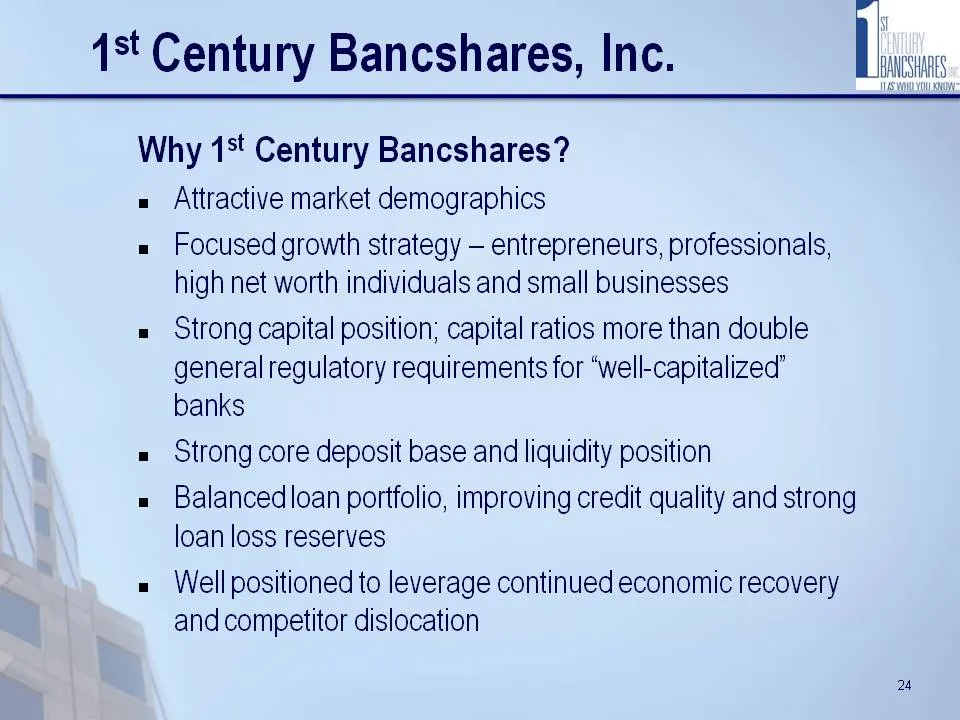
1st Century Bancshares, Inc. Why 1st Century Bancshares? Attractive market demographics Focused growth strategy — entrepreneurs, professionals, high net worth individuals and small businesses Strong capital position; capital ratios more than double general regulatory requirements for “well-capitaliz
Slide 27: Contact Us
1st Century Bancshares, Inc. Contact Us Alan |. Rothenberg Chairman & CEO [email protected] 310.270.9501 Jason DiNapoli President & COO [email protected] 310.270.9505 25
Source: SEC EDGAR · 8-K filed Sep 14, 2010
More decks from 1st Century Bancshares Inc
 Shareholder Meeting (May 2015)23 slides · May 7, 2015
 Investor Presentation (May 2014)26 slides · May 8, 2014
 Investor Presentation (May 2013)26 slides · May 8, 2013
 Investor Presentation (May 2012)24 slides · May 21, 2012
 Shareholder Meeting (May 2011)25 slides · May 26, 2011
 Investor Presentation (December 2010)27 slides · Dec 1, 2010