Einstein Noah Restaurant Group Inc
Einstein Noah Restaurant — Cowen Consumer Conference January 2008
33 slides from Einstein Noah Restaurant's conference presentation, Jan 15, 2008
Slide 1: Cowen Consumer Conference January 2008
1 Cowen Consumer Conference January 2008
Slide 2: Safe Harbor
2 Safe Harbor This presentation contains certain forward-looking statements, which reflect management's expectations regarding future events and operating performance and speak only as of the date hereof. Forward-looking statements involve a number of risks and uncertainties. A description of factor
Slide 3: Paul Murphy, CEO & President
3 Paul Murphy CEO & President
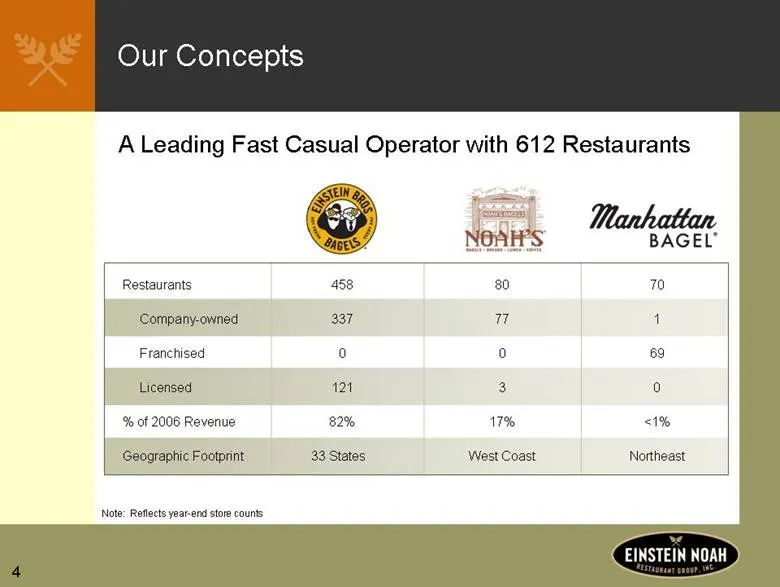
Slide 4: Our Concepts and Geographic Footprint
4 Our Concepts Northeast West Coast 33 States Geographic Footprint <1% 17% 82% % of 2006 Revenue 0 3 121 Licensed 69 0 0 Franchised 1 77 337 Company-owned 70 80 458 Restaurants A Leading Fast Casual Operator with 612 Restaurants Note: Reflects year-end store counts
Slide 5: Investment Highlights
5 Distinct Brands with Loyal Customer Following Continued Turnaround Efforts Driving Results Disciplined Management Team Accelerating Unit Growth Driven by Attractive Returns Positive Comparable Sales with Significant AUV Upside Demonstrated Financial Performance Investment Highlights
Slide 6: Our Stores
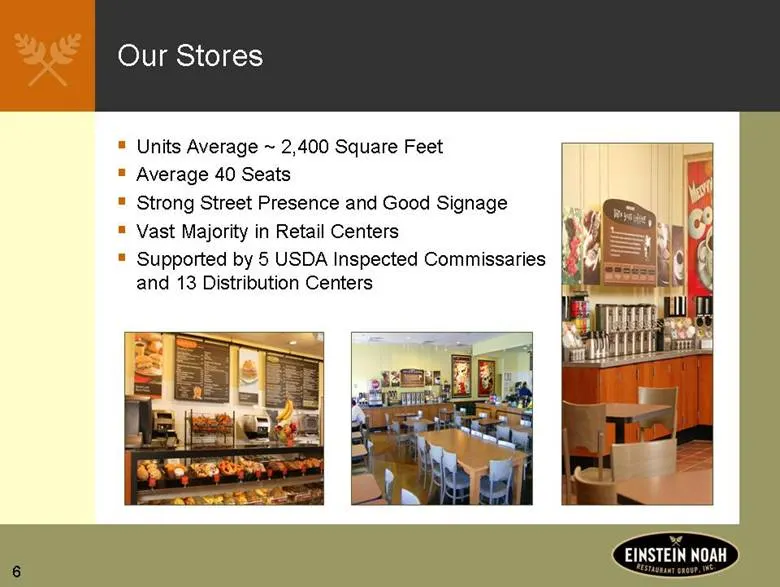
6 Our Stores Units Average ~ 2,400 Square Feet Average 40 Seats Strong Street Presence and Good Signage Vast Majority in Retail Centers Supported by 5 USDA Inspected Commissaries and 13 Distribution Centers
Slide 7: Focus on Fresh, High Quality Food
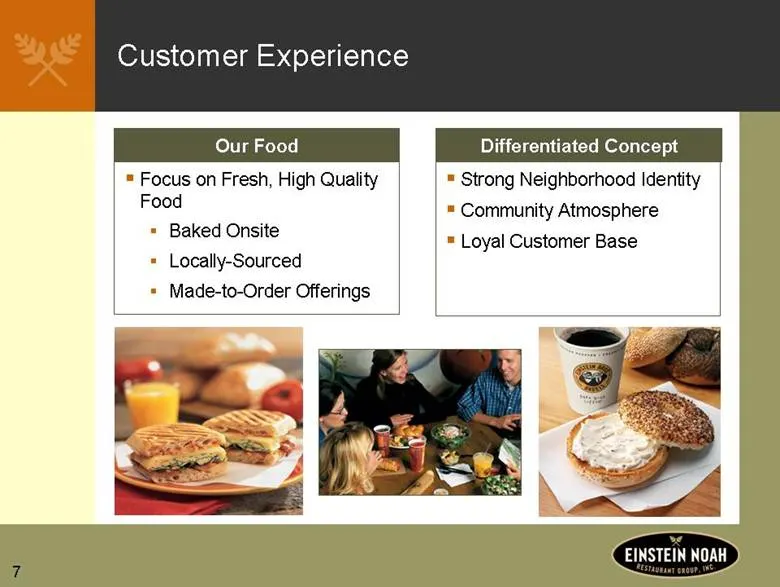
7 Focus on Fresh, High Quality Food Baked Onsite Locally-Sourced Made-to-Order Offerings Our Food Customer Experience Strong Neighborhood Identity Community Atmosphere Loyal Customer Base Differentiated Concept
Slide 8: A Leader in Breakfast Daypart
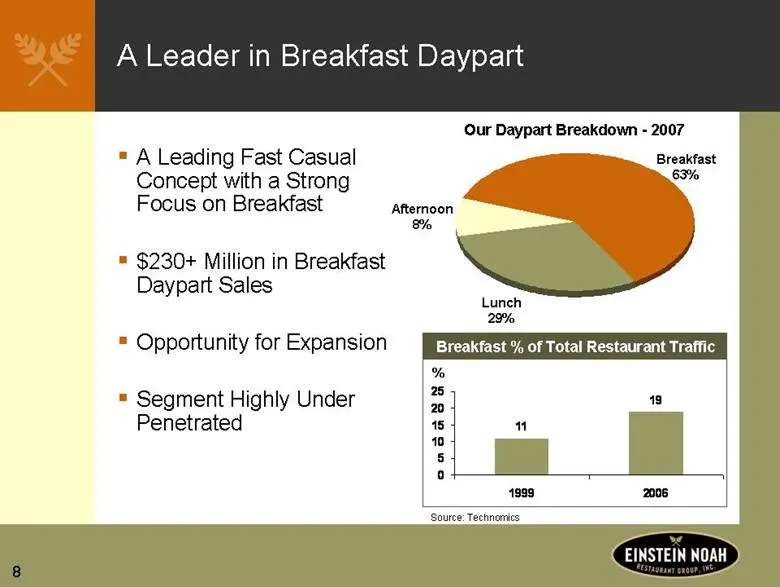
8 A Leader in Breakfast Daypart A Leading Fast Casual Concept with a Strong Focus on Breakfast $230+ Million in Breakfast Daypart Sales Opportunity for Expansion Segment Highly Under Penetrated Our Daypart Breakdown - 2007 Afternoon 8% Lunch 29% Breakfast 63% Breakfast % of Total Restaurant Traffic
Slide 9: Turnaround Driving Profitability
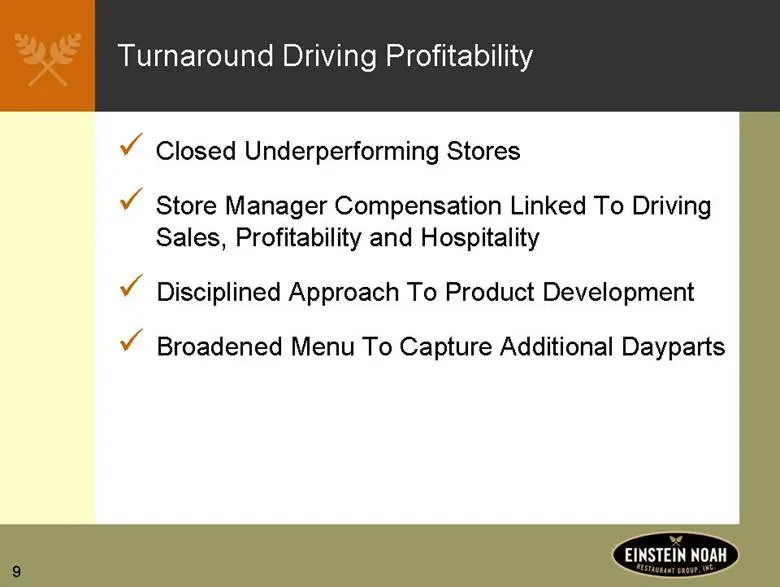
9 Turnaround Driving Profitability Closed Underperforming Stores Store Manager Compensation Linked To Driving Sales, Profitability and Hospitality Disciplined Approach To Product Development Broadened Menu To Capture Additional Dayparts
Slide 10: Store Level Turnaround
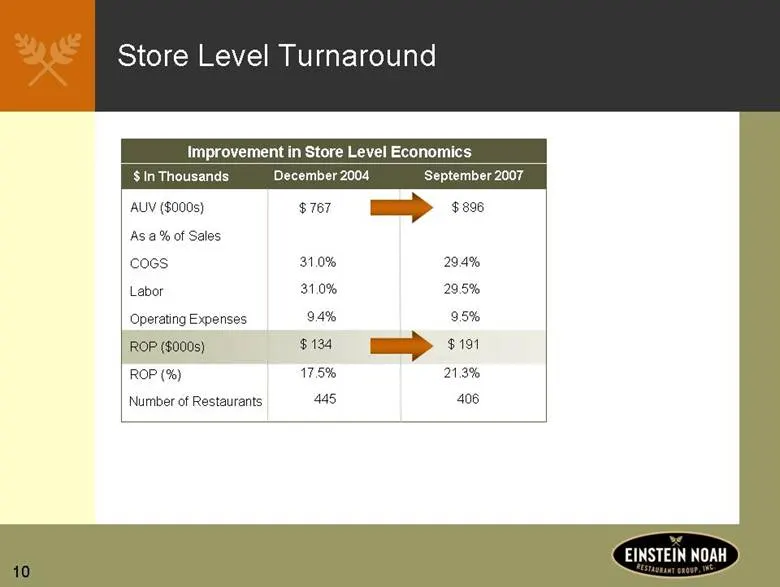
10 Store Level Turnaround Improvement in Store Level Economics AUV ($000s) As a % of Sales COGS Labor Operating Expenses ROP ($000s) ROP (%) December 2004 $ 767 31.0% 31.0% 9.4% $ 134 17.5% September 2007 $ 896 29.4% 29.5% 9.5% $ 191 21.3% Number of Restaurants 445 406 $ In Thousands
Slide 11: Thirteen Consecutive Quarters of Positive Same Store Sales Growth
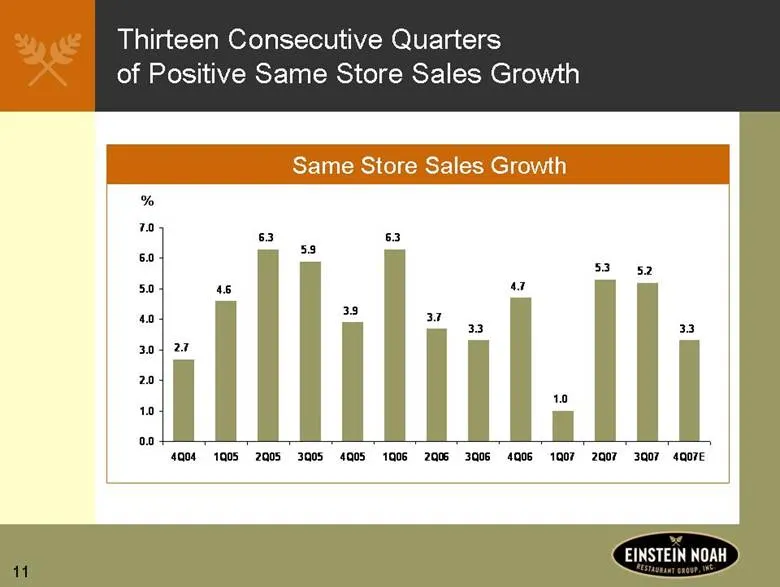
11 Thirteen Consecutive Quarters of Positive Same Store Sales Growth 3.3 5.2 5.3 1.0 4.7 3.3 3.7 6.3 4.6 6.3 5.9 3.9 2.7 0.0 1.0 2.0 3.0 4.0 5.0 6.0 7.0 4Q04 1Q05 2Q05 3Q05 4Q05 1Q06 2Q06 3Q06 4Q06 1Q07 2Q07 3Q07 4Q07E Same Store Sales Growth %
Slide 12: Demonstrated Financial Performance
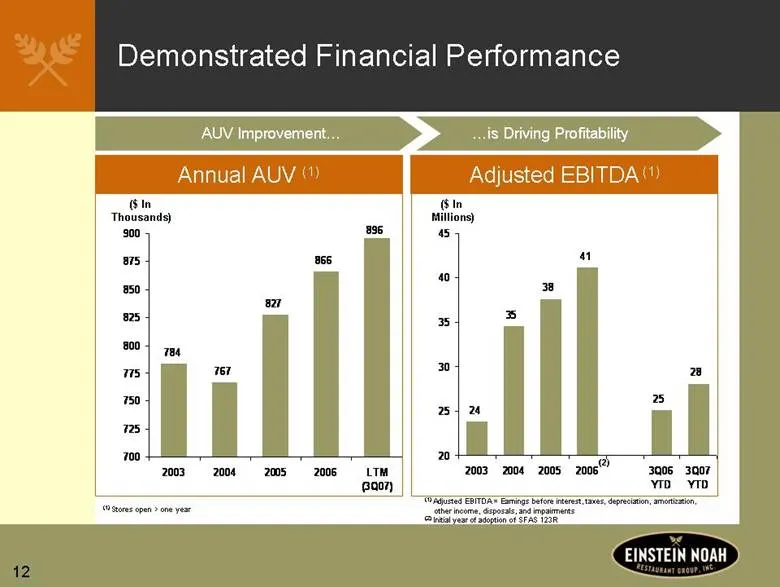
12 784 896 866 827 767 700 725 750 775 800 825 850 875 900 2003 2004 2005 2006 LTM (3Q07) Demonstrated Financial Performance Adjusted EBITDA (1) 24 41 38 35 25 28 20 25 30 35 40 45 2003 2004 2005 2006 3Q06 YTD 3Q07 YTD ($ In Millions) AUV Improvement ($ In Thousands) Annual AUV (1) is Driving Profit
Slide 13: Disciplined, Experienced Management Team
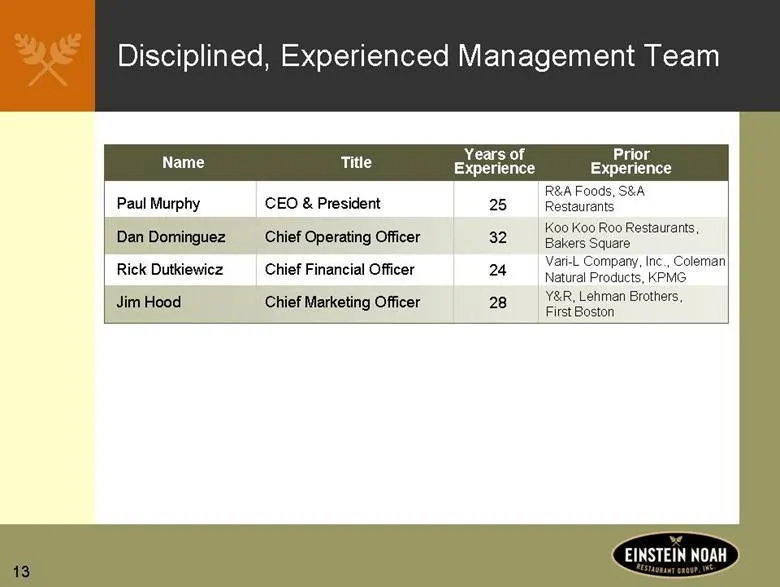
13 Disciplined, Experienced Management Team Paul Murphy Dan Dominguez Rick Dutkiewicz Jim Hood CEO & President Chief Operating Officer Chief Financial Officer Chief Marketing Officer Name Title Years of Experience Prior Experience 25 32 24 28 R&A Foods, S&A Restaurants Koo Koo Roo Restaurants, Baker
Slide 14: Multiple Growth Initiatives
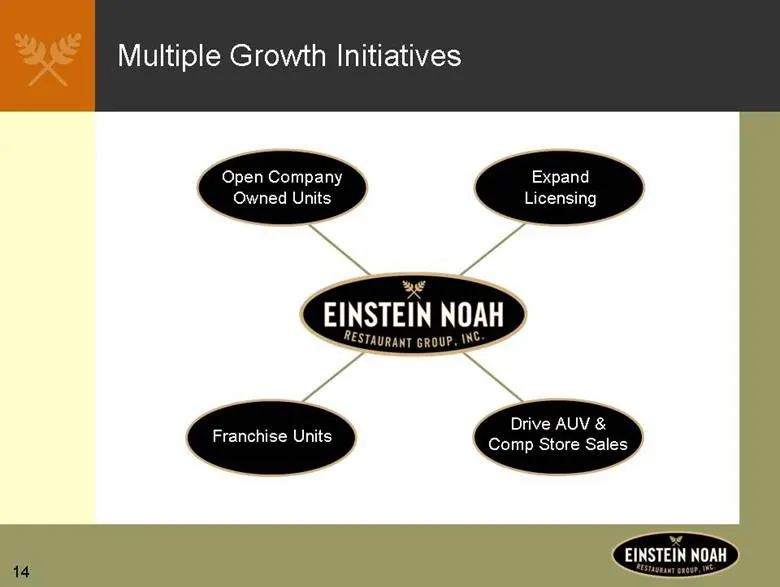
14 Multiple Growth Initiatives Open Company Owned Units Expand Licensing Drive AUV & Comp Store Sales Franchise Units
Slide 15: Under Penetrated Footprint
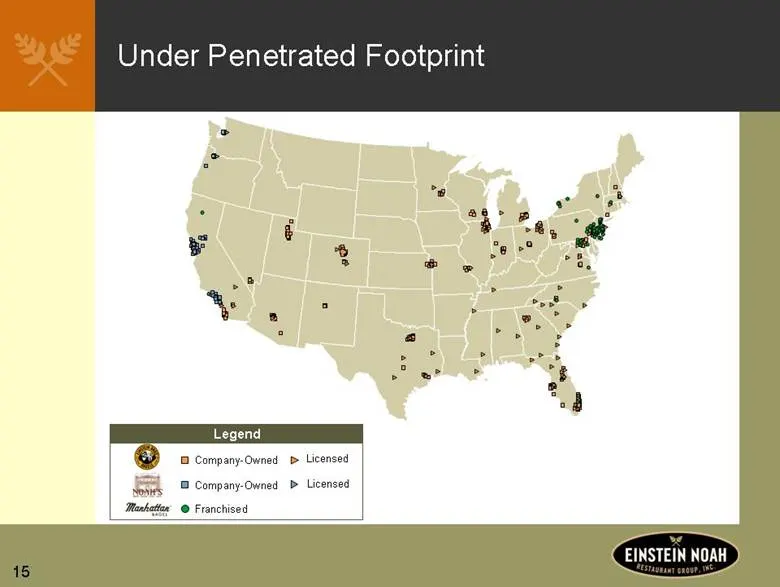
15 Under Penetrated Footprint Licensed Company-Owned Licensed Franchised Company-Owned Legend
Slide 16: Expand Company Owned Locations
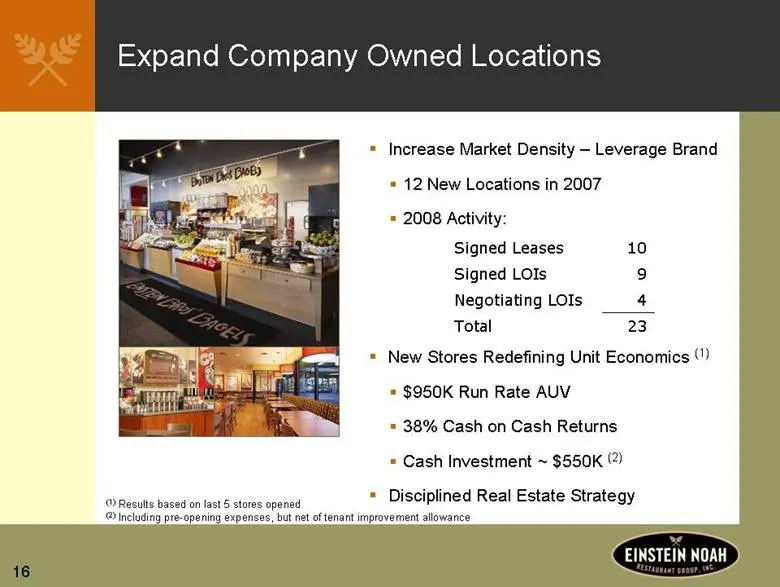
16 Expand Company Owned Locations Increase Market Density – Leverage Brand 12 New Locations in 2007 2008 Activity: New Stores Redefining Unit Economics (1) $950K Run Rate AUV 38% Cash on Cash Returns Cash Investment ~ $550K (2) Disciplined Real Estate Strategy (1) Results based on last 5 stores open
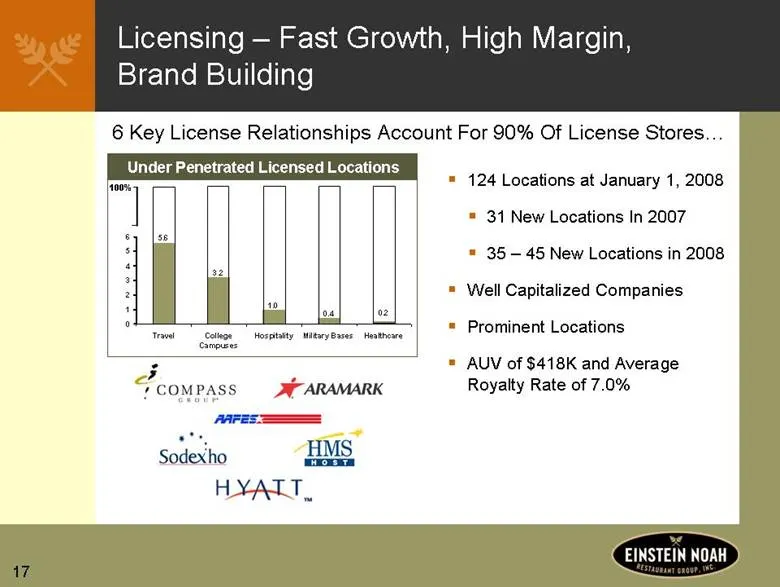
Slide 17: Licensing – Fast Growth, High Margin, Brand Building
17 Licensing – Fast Growth, High Margin, Brand Building 124 Locations at January 1, 2008 31 New Locations In 2007 35 – 45 New Locations in 2008 Well Capitalized Companies Prominent Locations AUV of $418K and Average Royalty Rate of 7.0% 6 Key License Relationships Account For 90% Of License Stores..
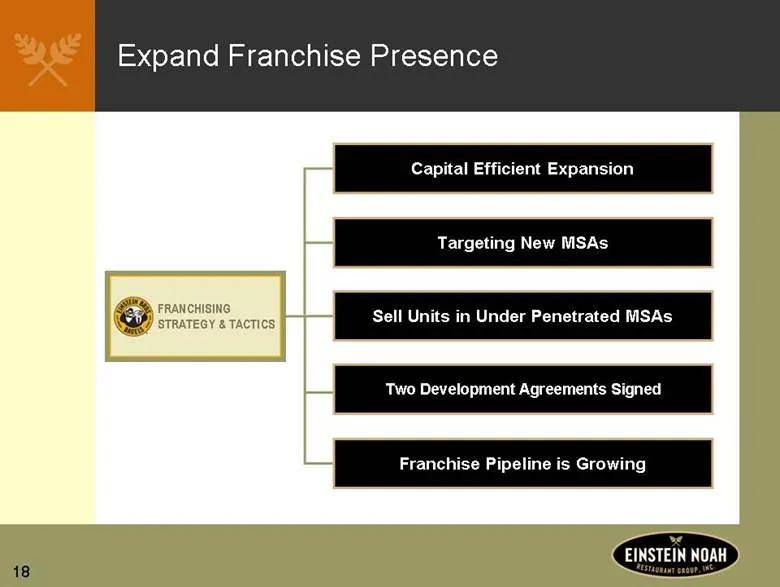
Slide 18: Franchising Strategy & Tactics
18 Capital Efficient Expansion Targeting New MSAs Sell Units in Under Penetrated MSAs Two Development Agreements Signed Franchise Pipeline is Growing Expand Franchise Presence FRANCHISING STRATEGY & TACTICS
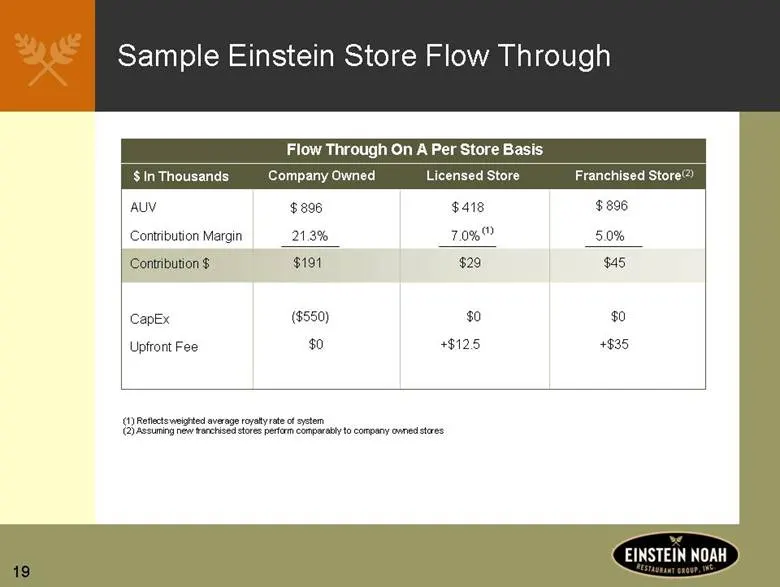
Slide 19: Sample Einstein Store Flow Through
19 Sample Einstein Store Flow Through AUV Contribution Margin Contribution $ CapEx Upfront Fee Company Owned $ 896 21.3% $191 ($550) $0 Licensed Store $ 418 7.0% $29 $0 +$12.5 $ 896 5.0% $45 $0 +$35 Franchised Store $ In Thousands Flow Through On A Per Store Basis (1) Reflects weighted average royal
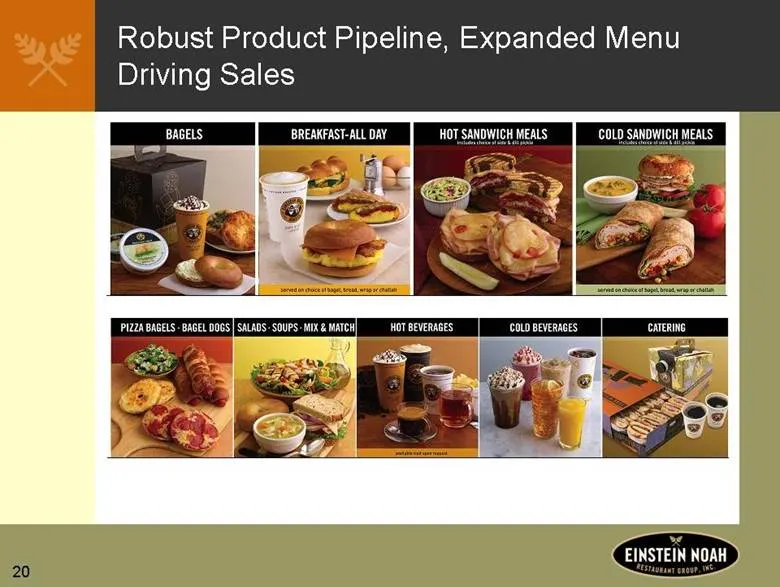
Slide 20: Robust Product Pipeline, Expanded Menu Driving Sales
20 Robust Product Pipeline, Expanded Menu Driving Sales
Slide 21: New Store Prototype – Enhancing Guest Experience
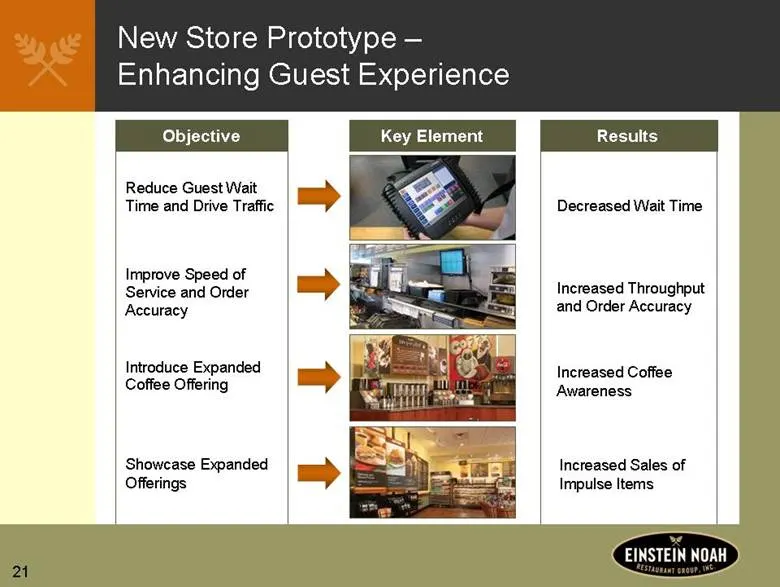
21 New Store Prototype – Enhancing Guest Experience Key Element Objective Results Reduce Guest Wait Time and Drive Traffic Improve Speed of Service and Order Accuracy Introduce Expanded Coffee Offering Showcase Expanded Offerings Decreased Wait Time Increased Throughput and Order Accuracy Increased
Slide 22: Prototype Store Format Driving AUV
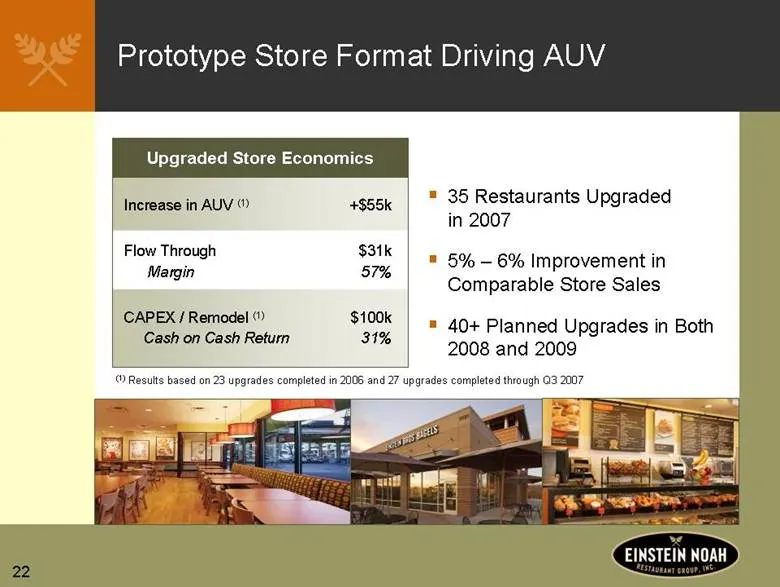
22 Prototype Store Format Driving AUV 35 Restaurants Upgraded in 2007 5% – 6% Improvement in Comparable Store Sales 40+ Planned Upgrades in Both 2008 and 2009 Upgraded Store Economics Increase in AUV (1) +$55k Flow Through $31k Margin 57% CAPEX / Remodel (1) $100k Cash on Cash Return 31% (1) Results
Slide 23: Comp Store Sales Drivers
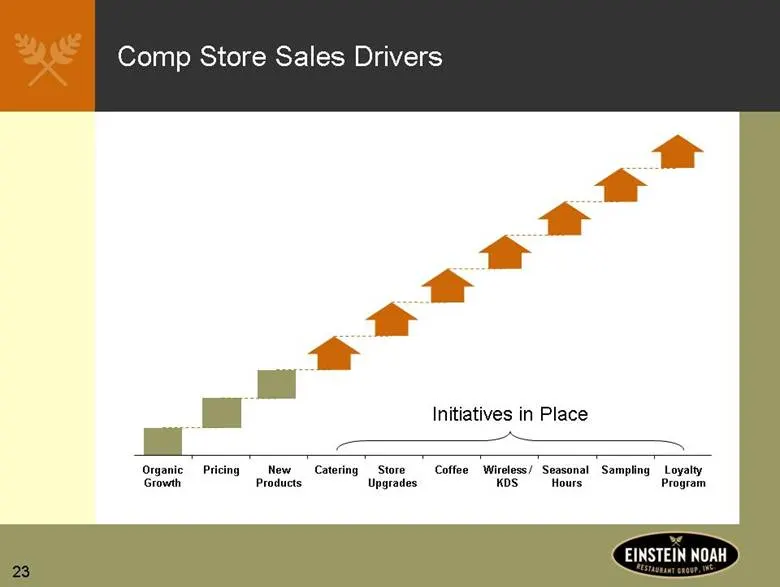
23 Organic Growth Pricing New Products Coffee Catering Store Upgrades Wireless / KDS Seasonal Hours Loyalty Program Sampling Comp Store Sales Drivers Initiatives in Place
Slide 24: Rick Dutkiewicz, Chief Financial Officer
24 Rick Dutkiewicz Chief Financial Officer
Slide 25: Historical Results
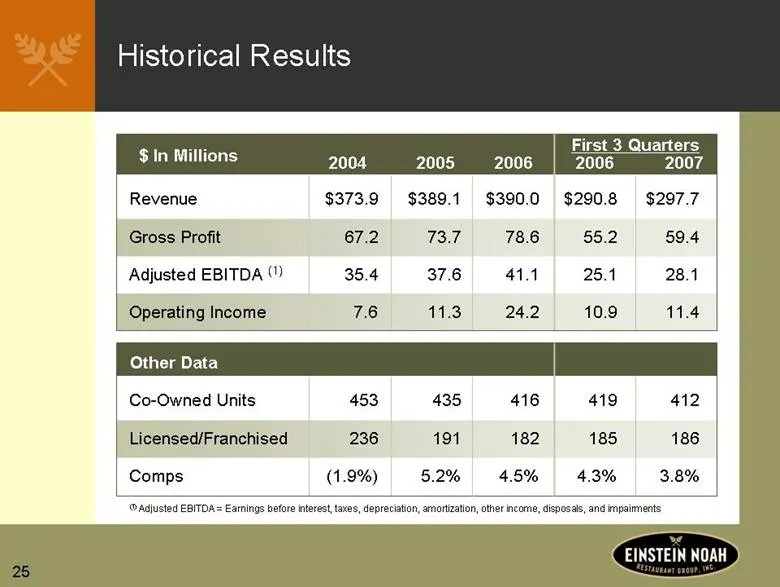
25 Historical Results Revenue $373.9 $389.1 $390.0 $290.8 $297.7 Gross Profit 67.2 73.7 78.6 55.2 59.4 Adjusted EBITDA (1) 35.4 37.6 41.1 25.1 28.1 Operating Income 7.6 11.3 24.2 10.9 11.4 2004 2005 2006 2006 2007 First 3 Quarters Co-Owned Units 453 435 416 419 412 Licensed/Franchised 236 191 182 18
Slide 26: Improved Unit Volumes
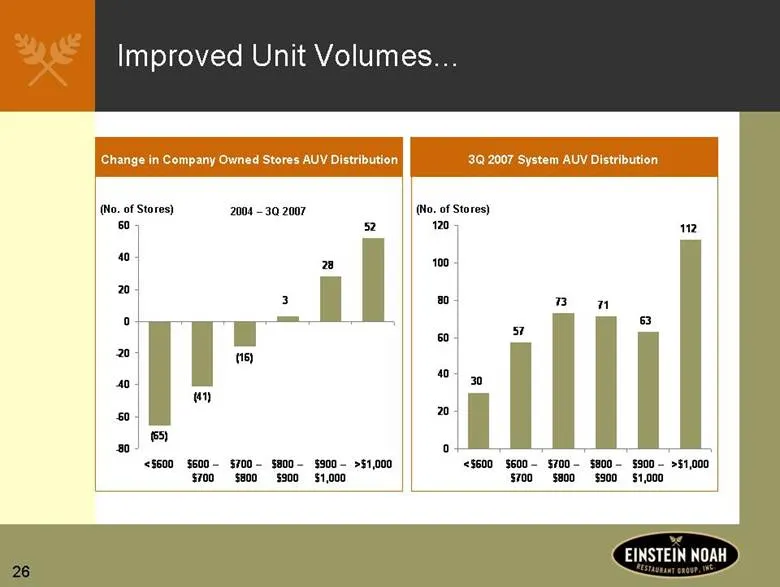
26 (65) 28 3 (16) (41) 52 -80 -60 -40 -20 0 20 40 60 <$600 $600 – $700 $700 – $800 $800 – $900 $900 – $1,000 >$1,000 Improved Unit Volumes 30 63 71 73 57 112 0 20 40 60 80 100 120 <$600 $600 – $700 $700 – $800 $800 – $900 $900 – $1,000 >$1,000 3Q 2007 System AUV Distribution (No. of Stores) Change i
Slide 27: Driving Profitability
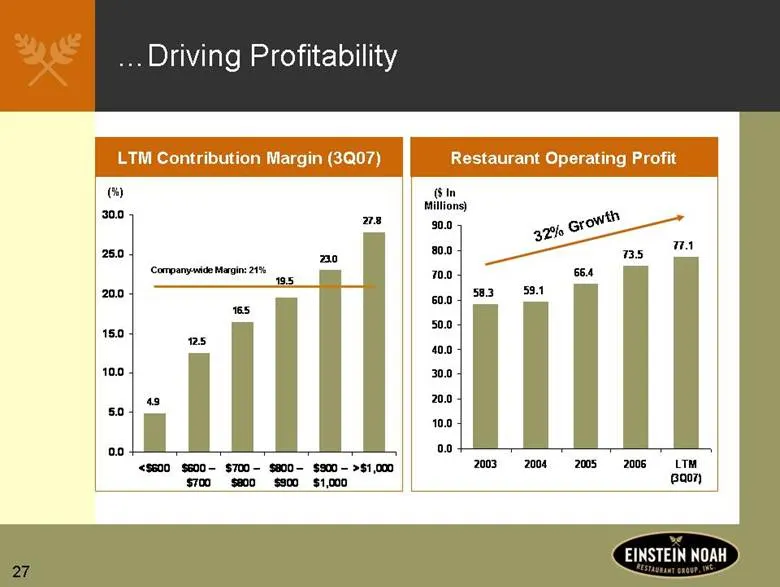
27 Driving Profitability 4.9 23.0 19.5 16.5 12.5 27.8 0.0 5.0 10.0 15.0 20.0 25.0 30.0 <$600 $600 – $700 $700 – $800 $800 – $900 $900 – $1,000 >$1,000 LTM Contribution Margin (3Q07) (%) Company-wide Margin: 21% Restaurant Operating Profit ($ In Millions) 58.3 77.1 73.5 66.4 59.1 0.0 10.0 20.0 30.0 4
Slide 28: Compelling Cash on Cash Returns
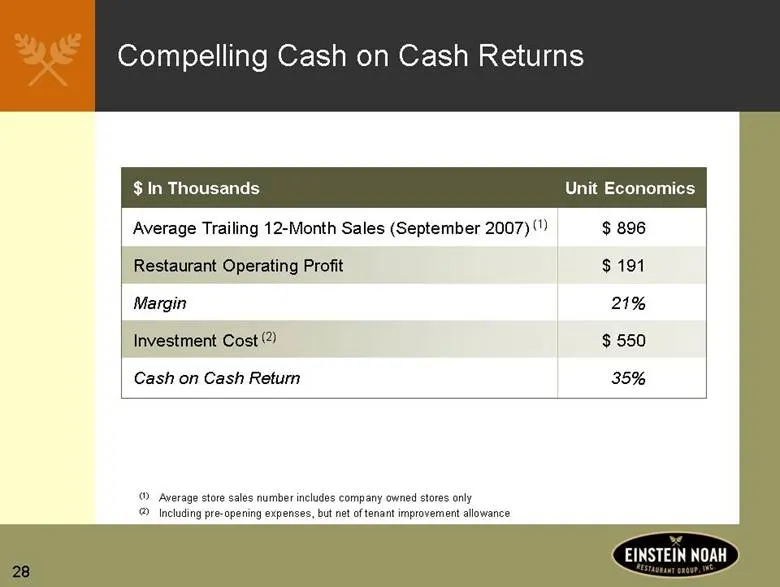
28 Compelling Cash on Cash Returns $ In Thousands Unit Economics Average Trailing 12-Month Sales (September 2007) (1) Restaurant Operating Profit Margin Investment Cost (2) Cash on Cash Return $ 896 $ 191 21% $ 550 35% (1) Average store sales number includes company owned stores only (2) Including p
Slide 29: Ongoing AUV Growth Will Drive Profitability
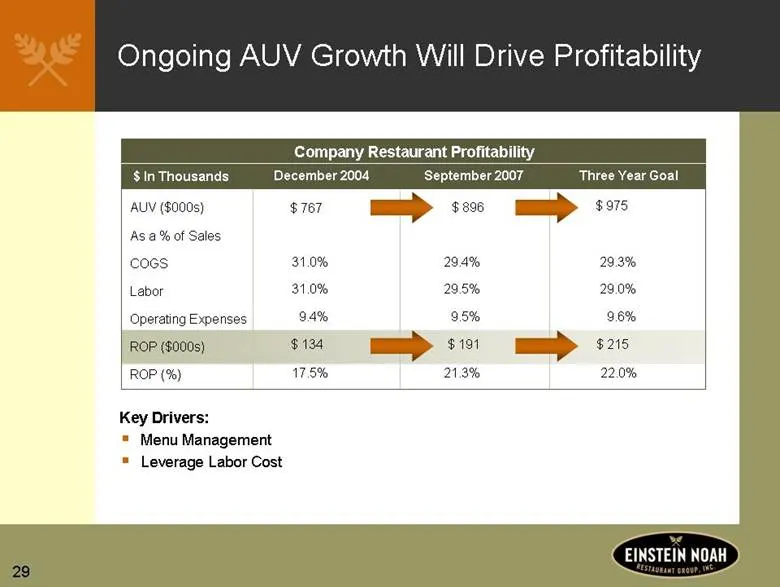
29 Ongoing AUV Growth Will Drive Profitability Company Restaurant Profitability AUV ($000s) As a % of Sales COGS Labor Operating Expenses ROP ($000s) ROP (%) December 2004 $ 767 31.0% 31.0% 9.4% $ 134 17.5% September 2007 $ 896 29.4% 29.5% 9.5% $ 191 21.3% $ 975 29.3% 29.0% 9.6% $ 215 22.0% Three Ye
Slide 30: Financial Targets and Goals
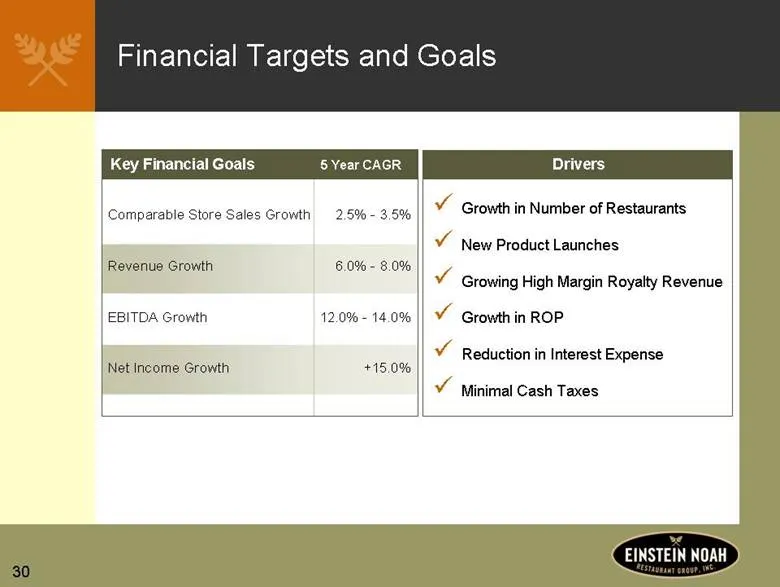
30 Financial Targets and Goals Comparable Store Sales Growth 2.5% - 3.5% Revenue Growth 6.0% - 8.0% EBITDA Growth 12.0% - 14.0% Net Income Growth +15.0% Key Financial Goals 5 Year CAGR Drivers Growth in Number of Restaurants New Product Launches Growing High Margin Royalty Revenue Growth in ROP Redu
Slide 31: Valuable Deferred Tax Assets
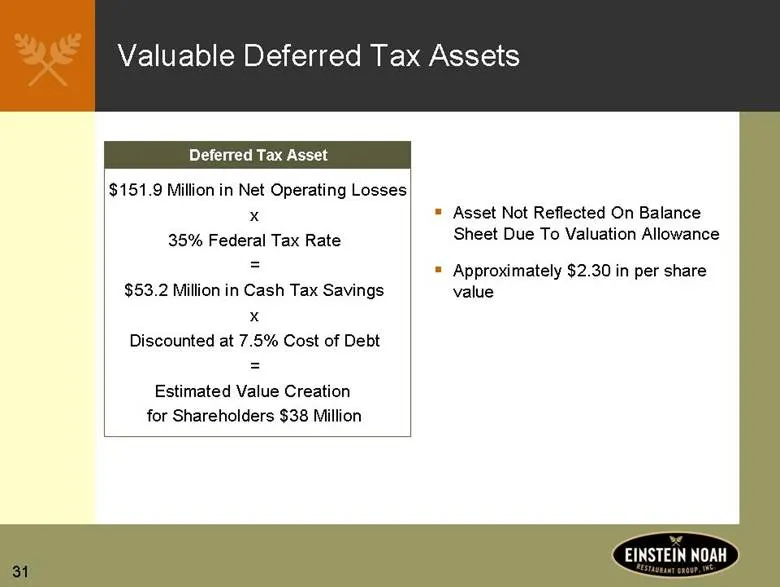
31 Valuable Deferred Tax Assets Deferred Tax Asset $151.9 Million in Net Operating Losses x 35% Federal Tax Rate = $53.2 Million in Cash Tax Savings x Discounted at 7.5% Cost of Debt = Estimated Value Creation for Shareholders $38 Million Asset Not Reflected On Balance Sheet Due To Valuation Allowan
Slide 32: Investment Highlights
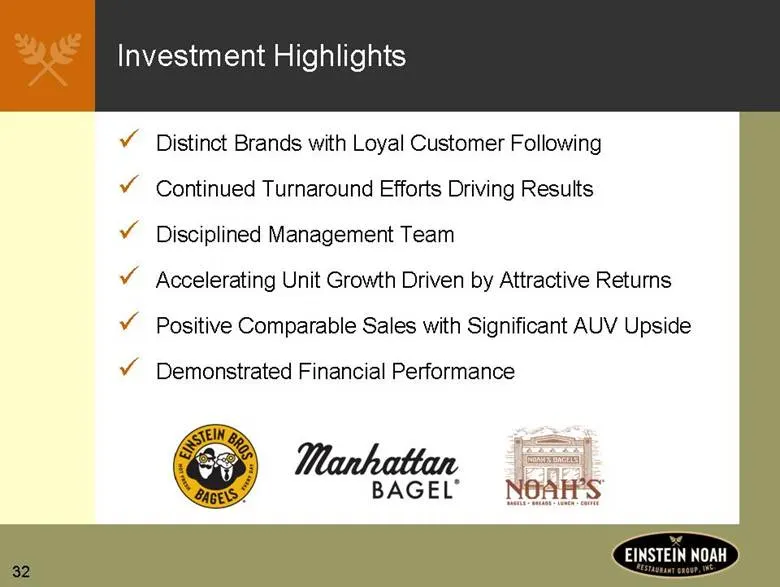
32 Investment Highlights Distinct Brands with Loyal Customer Following Continued Turnaround Efforts Driving Results Disciplined Management Team Accelerating Unit Growth Driven by Attractive Returns Positive Comparable Sales with Significant AUV Upside Demonstrated Financial Performance
Slide 33: Q&A
[EINSTEIN NOAH Q&A
Source: SEC EDGAR · 8-K filed Jan 15, 2008
More decks from Einstein Noah Restaurant Group Inc
 Investor Presentation (January 2014)41 slides · Jan 14, 2014
 Investor Presentation (January 2011)52 slides · Jan 11, 2011
 Investor Presentation (August 2008)28 slides · Aug 12, 2008
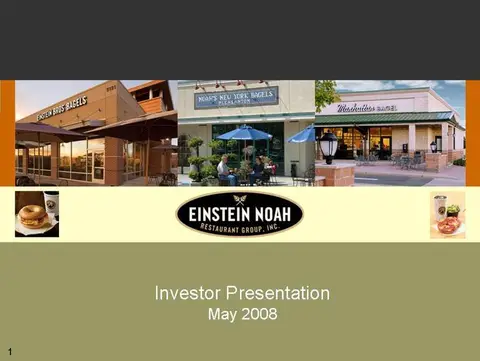 Investor Presentation (May 2008)33 slides · May 12, 2008
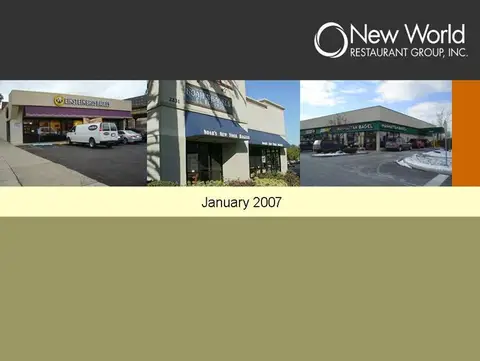 New World Restaurant Group — Investor Presentation (January 2007)29 slides · Jan 10, 2007