US Airways — Dahlman Rose & Co. 2012 Global Transportation Conference
18 slides from US Airways's conference presentation, Sep 5, 2012

Slide 1: Dahlman Rose & Co. 2012 Global Transportation Conference
Dahlman Rose & Co. 2012 Global Transportation Conference September 5, 2012 Scott Kirby President US Airways Group, Inc.
Slide 2: Forward Looking Statements
Forward Looking Statements Certain of the statements contained or referred to herein are "forward-looking statements" within the meaning of the Private Securities Litigation Reform Act of 1995. These forward-looking statements may be identified by words such as "may," "will," "expect," "intend," "an
Slide 3: Overview
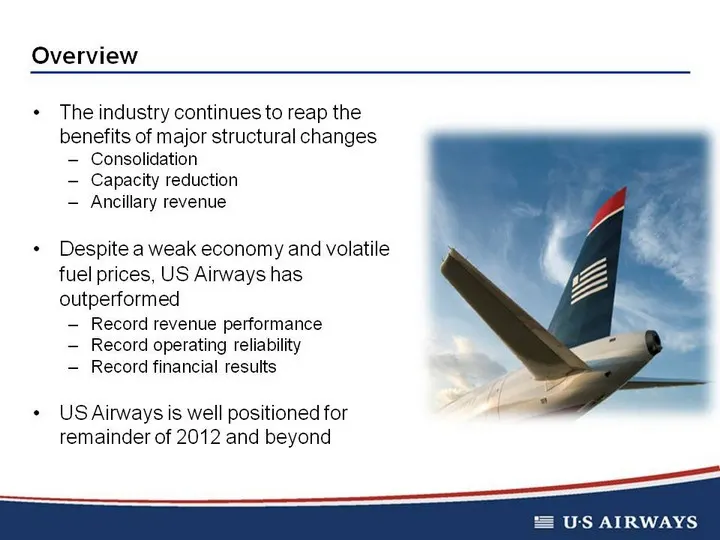
Overview The industry continues to reap the benefits of major structural changes Consolidation Capacity reduction Ancillary revenue Despite a weak economy and volatile fuel prices, US Airways has outperformed Record revenue performance Record operating reliability Record financial results US Airways
Slide 4: Passenger Revenue as a Percent of GDP
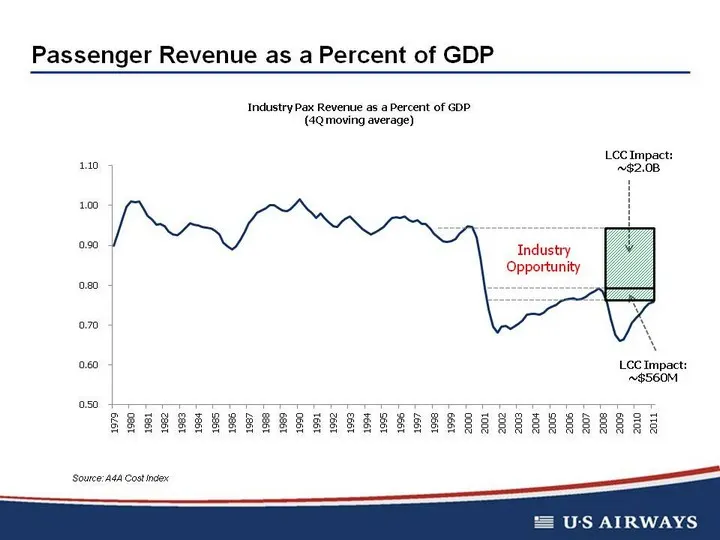
Passenger Revenue as a Percent of GDP Source: A4A Cost Index Industry Opportunity LCC Impact: ~$2.0B LCC Impact: ~$560M
Slide 5: Passenger RASM vs. Fuel Price (Historic: '80 - '04)
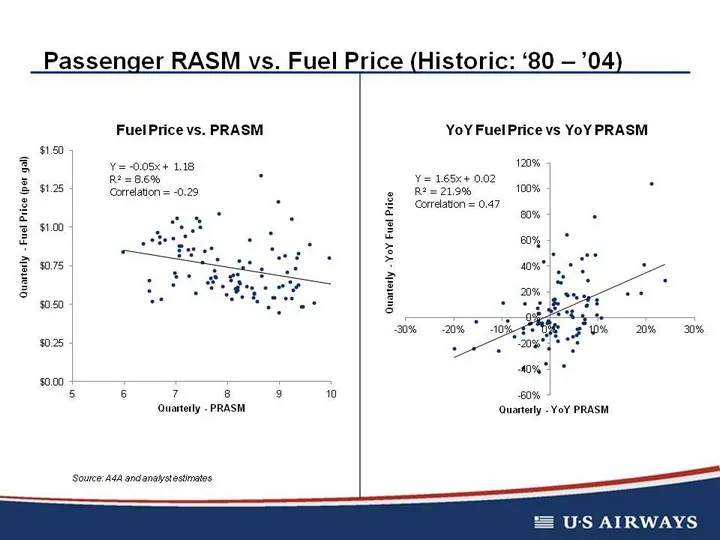
Passenger RASM vs. Fuel Price (Historic: '80 - '04) Source: A4A and analyst estimates
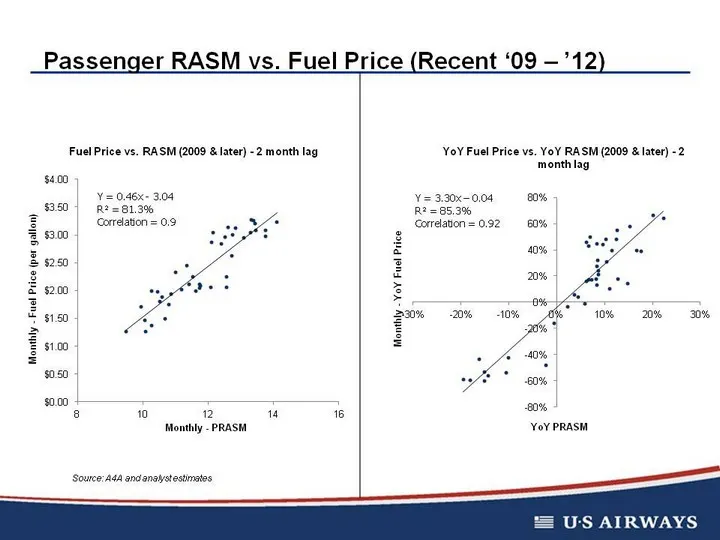
Slide 6: Passenger RASM vs. Fuel Price (Recent '09 - '12)
Passenger RASM vs. Fuel Price (Recent '09 - '12) Source: A4A and analyst estimates Y = 0.46x - 3.04 R2 = 81.3% Correlation = 0.9 Y = 3.30x - 0.04 R2 = 85.3% Correlation = 0.92
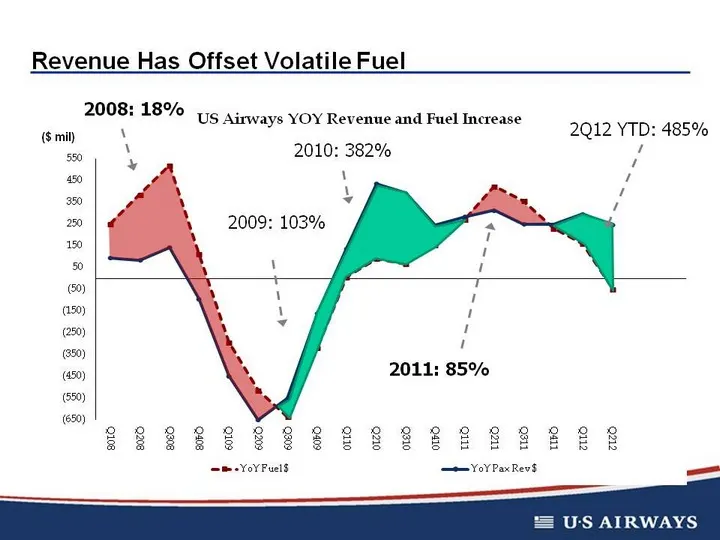
Slide 7: Revenue Has Offset Volatile Fuel
Revenue Has Offset Volatile Fuel 2010: 382% 2Q12 YTD: 485% 2011: 85% 2009: 103% 2008: 18%
Slide 8: US Airways Relative Performance
US Airways Relative Performance
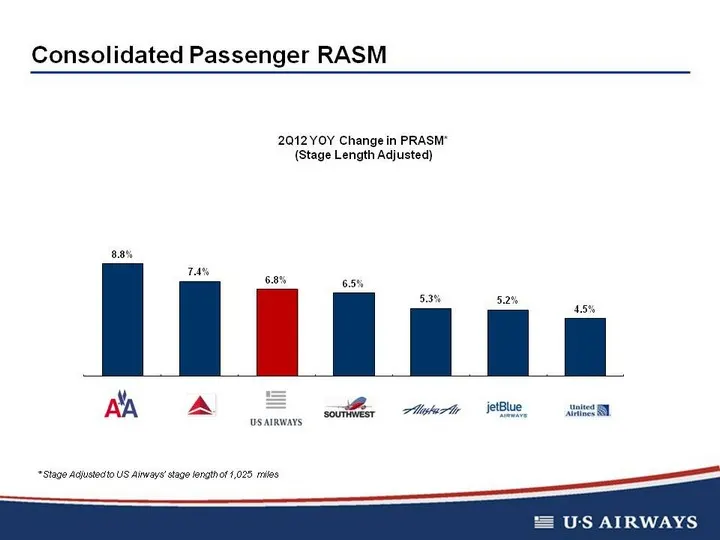
Slide 9: Consolidated Passenger RASM
Consolidated Passenger RASM * Stage Adjusted to US Airways' stage length of 1,025 miles
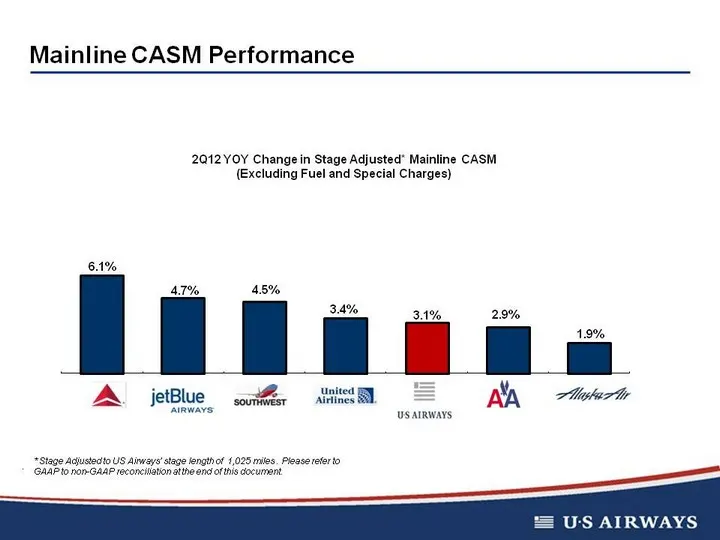
Slide 10: Mainline CASM Performance
Mainline CASM Performance . * Stage Adjusted to US Airways' stage length of 1,025 miles . Please refer to GAAP to non-GAAP reconciliation at the end of this document.
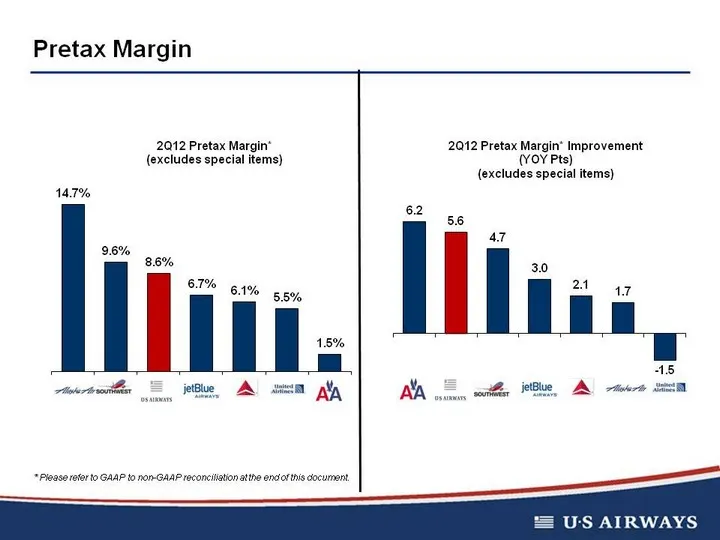
Slide 11: Pretax Margin
Pretax Margin * Please refer to GAAP to non-GAAP reconciliation at the end of this document.
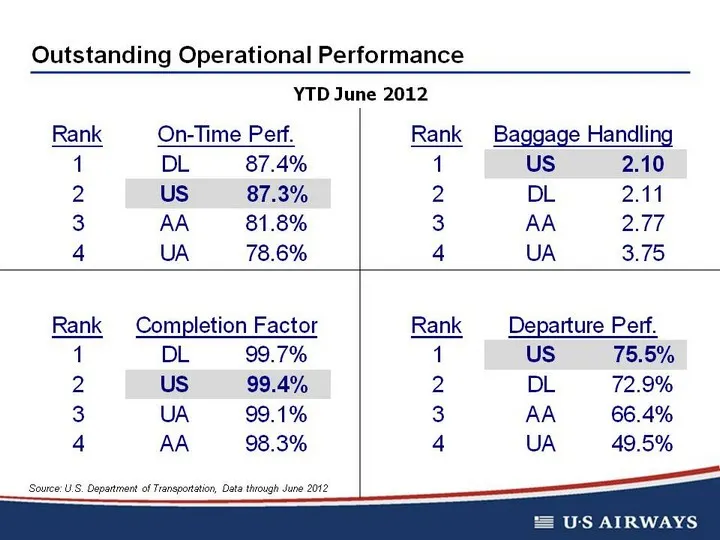
Slide 12: Outstanding Operational Performance
Outstanding Operational Performance Source: U.S. Department of Transportation, Data through June 2012 YTD June 2012
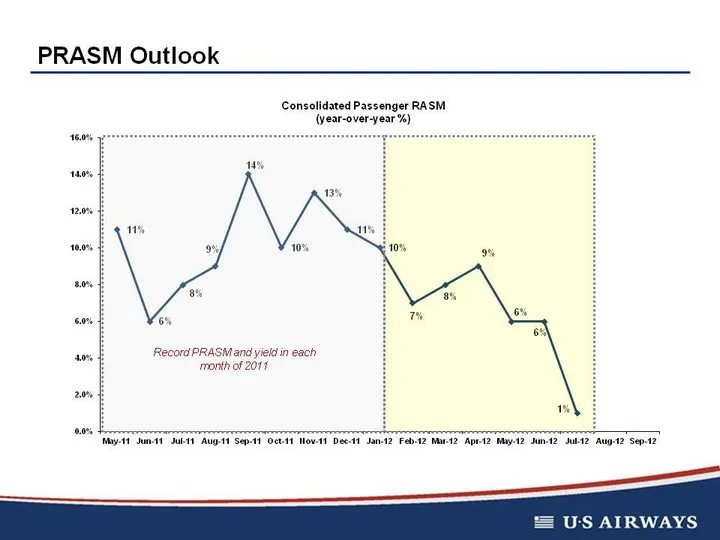
Slide 13: PRASM Outlook
PRASM Outlook Record PRASM and yield in each month of 2011
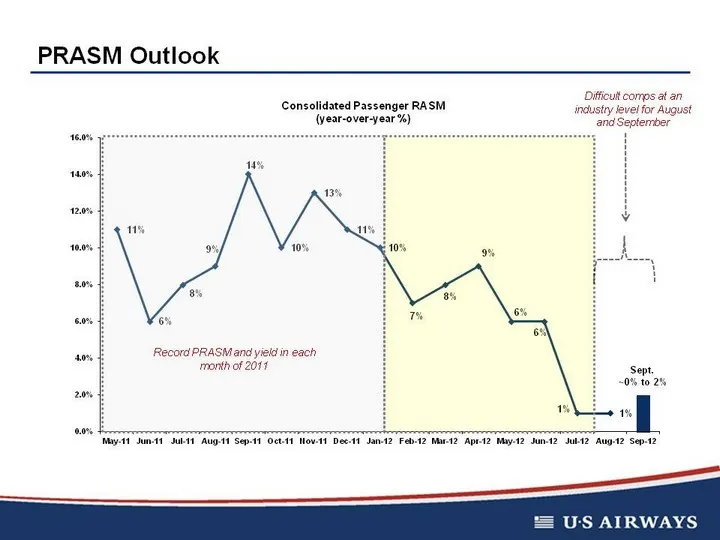
Slide 14: PRASM Outlook
PRASM Outlook Record PRASM and yield in each month of 2011 Difficult comps at an industry level for August and September Sept. ~0% to 2%
Slide 15: Conclusion
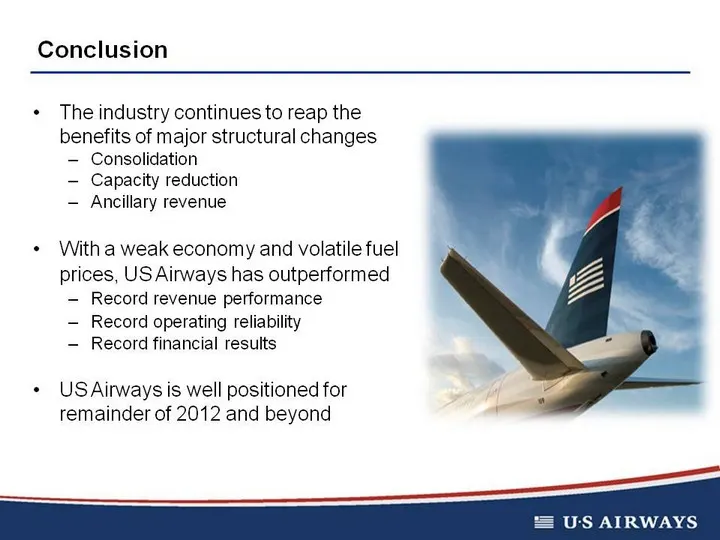
Conclusion The industry continues to reap the benefits of major structural changes Consolidation Capacity reduction Ancillary revenue With a weak economy and volatile fuel prices, US Airways has outperformed Record revenue performance Record operating reliability Record financial results US Airways
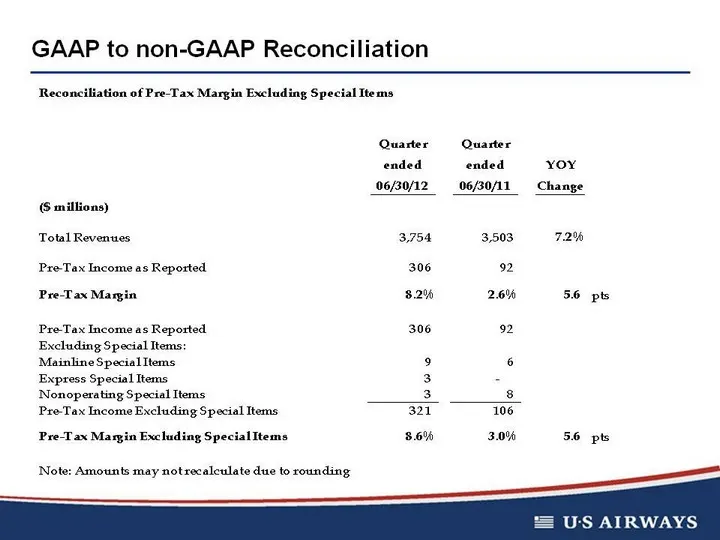
Slide 16: GAAP to non-GAAP Reconciliation
GAAP to non-GAAP Reconciliation
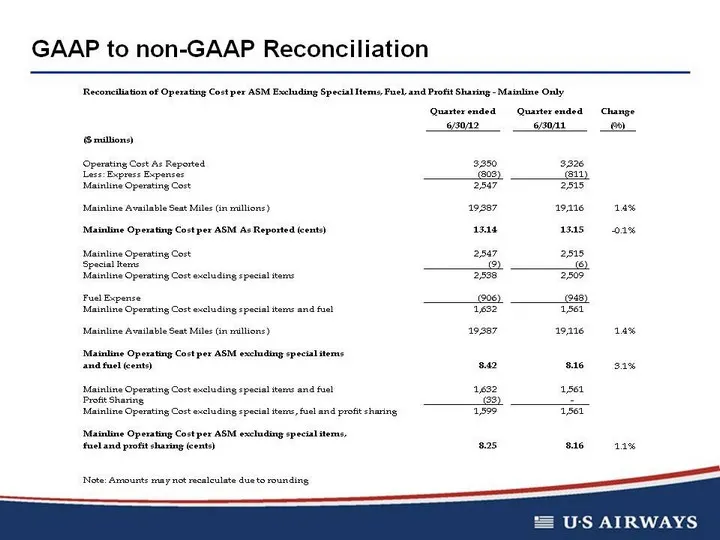
Slide 17: GAAP to non-GAAP Reconciliation
GAAP to non-GAAP Reconciliation

Slide 18: Questions?
Questions?
Source: SEC EDGAR · 8-K filed Sep 5, 2012
More decks from US Airways Group Inc
 Merger or Acquisition (May 2013)30 slides · May 10, 2013
 Merger or Acquisition (April 2013)19 slides · Apr 25, 2013
 IPO Roadshow (April 2013)25 slides · Apr 10, 2013
 Merger or Acquisition (March 2013)30 slides · Mar 22, 2013
 Merger or Acquisition (February 2013)7 slides · Feb 26, 2013
 IPO Roadshow (November 2012)10 slides · Nov 29, 2012