DEX ONE — R.H. Donnelley — Investor Day (November 2003)
98 slides from DEX ONE's investor day presentation, Nov 20, 2003

Slide 1: Investor Day Presentation November 20, 2003
Note: Custom background for cover only. Do not relink to master Investor Day Presentation November 20, 2003

Slide 2: Safe Harbor Statement
Safe Harbor Statement Certain statements contained in this presentation regarding R.H. Donnelley's future operating results or performance or business plans or prospects and any other statements not constituting historical fact are "forward-looking statements" subject to the safe harbor created by t

Slide 3: Agenda
Agenda Name Experience Topic 23 years (all yellow pages) 17 years at RHD David C. Swanson Chairman & Chief Executive Officer Company & Industry Overview 20 years (all yellow pages) 20 years at RHD Michael R. Boyce Vice President Marketing Yellow Pages as an Advertising Medium 29 years (all yellow pa
Slide 4: Overview of R.H. Donnelley
Overview of R.H. Donnelley Publishes the first- ever telephone directory together with The Chicago Telephone Company 1886 RHD acquires SPA, becoming a fully- integrated publisher of yellow pages directories 2003 Begins relationship with Illinois Bell (SBC predecessors) 1908 Acquired by Dun & Bradstr
Slide 5: Overview of R.H. Donnelley
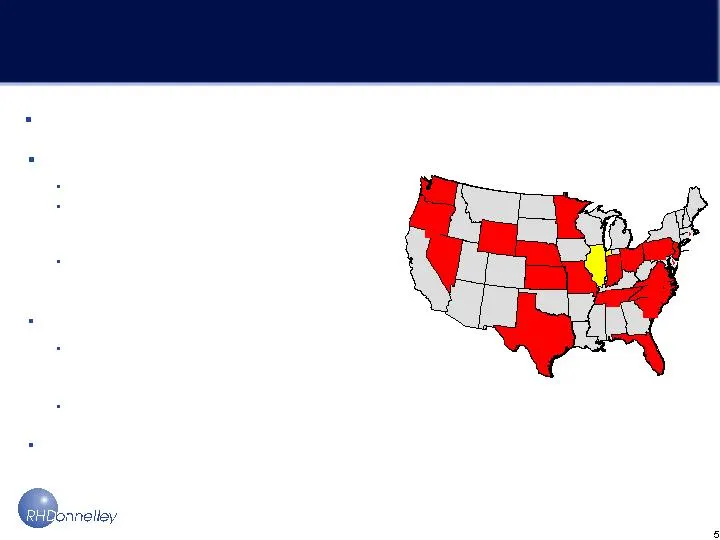
Overview of R.H. Donnelley Established 1886 Sixth largest U.S. directory publisher 18 States 260 Sprint(R) brand directories with a total circulation of 18 million and 160,000 local advertisers 50 year publishing, trademark and non-compete agreements with Sprint or its successor Perpetual partnershi
Slide 6: R.H. Donnelley Today
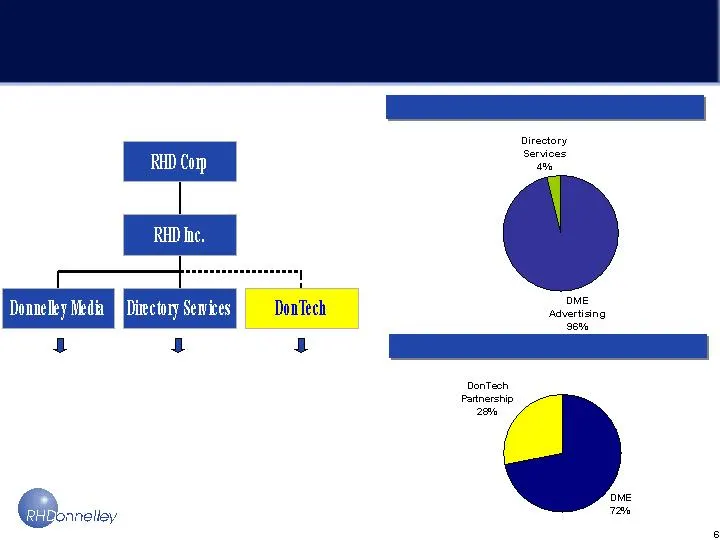
R.H. Donnelley Today 2003E EBITDA 2003E Revenues SBC Branded Products (50/50 Partnership) Sprint Branded Products Publishing & Informational Services for DME & DonTech
Slide 7: History of Shareholder Value Creation
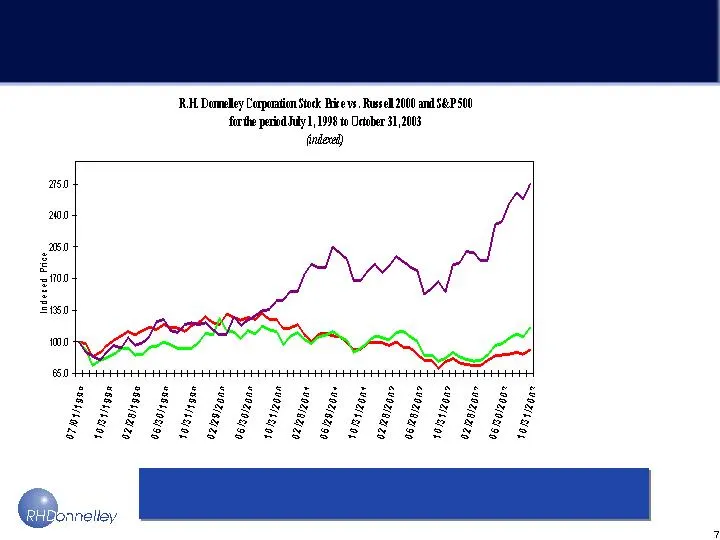
History of Shareholder Value Creation RHD stock has significantly outperformed the S&P 500 and Russell 2000 RHD up 155.4% Russell 2000 up 9.4% S&P 500 down 11.2%

Slide 8: 2003 Highlights: Operational
2003 Highlights: Operational The acquisition of Sprint Publishing and Advertising is already showing positive results Improved results in all sales metrics and employee turnover Reduced bad debt expense from $34 million in 2002 to an estimated $25 million in 2003 Reduced headcount from 1,600 to 1,35

Slide 9: 2003 Highlights: Financial
2003 Highlights: Financial The acquisition of Sprint Publishing and Advertising is already showing positive results Expect to generate EBITDA of $407 million in 2003 Forecast full year free cash flow of $230 million which will be used to repay acquisition debt Stock price has increased 38% since beg

Slide 10: Overview of R.H. Donnelley
Overview of R.H. Donnelley Q: What’s the value proposition? Q: What is Directional Media? A: Directional Media Q: What business are we in? A: Where people go to find who sells the products and services they seek when they’re ready to buy A: Generating high quality prospects with an exceptional conve
Slide 11: How we create value for our advertisers today
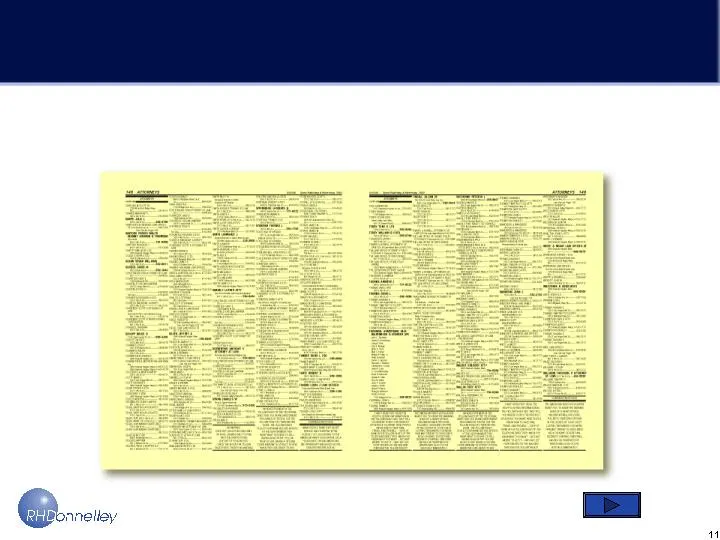
Overview of R.H. Donnelley How we create value for our advertisers today
Slide 12: Leveraging Data and Content Across Multiple Platforms
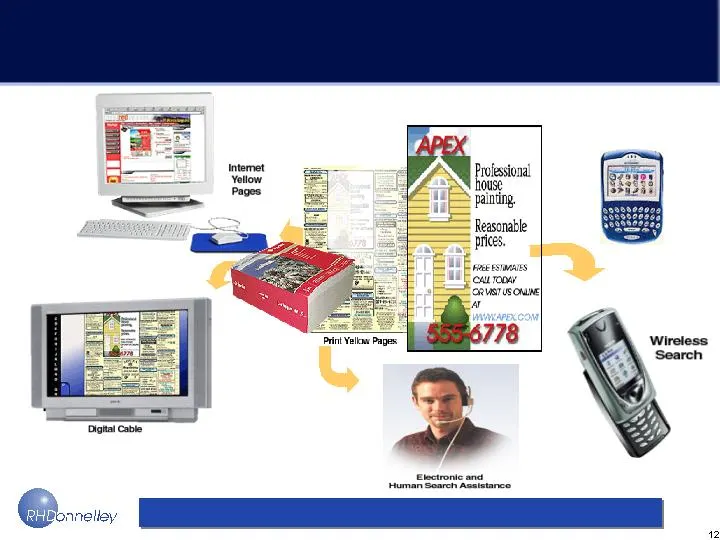
Leveraging Data and Content Across Multiple Platforms New distribution channels = New opportunities PDAs

Slide 13: Near Term Strategic Focus
Near Term Strategic Focus Reduce Debt Create financial flexibility Strengthen Current Market Positions Integrate the business model Expand online product offerings Edge outs, start ups, small acquisitions Marketing Services offerings

Slide 14: Yellow Pages as an Industry
Yellow Pages as an Industry

Slide 15: Fortune magazine cover

Slide 16: Yellow Pages "Sexiest Business Around" According to Fortune
Yellow Pages “Sexiest Business Around” According to Fortune Magazine Article What’s All The Fuss About? Stable growth Strong cash flow Predictable profitability Consumers who are ready to buy Superior ROI for advertisers
Slide 17: Top North American Directory Publishers
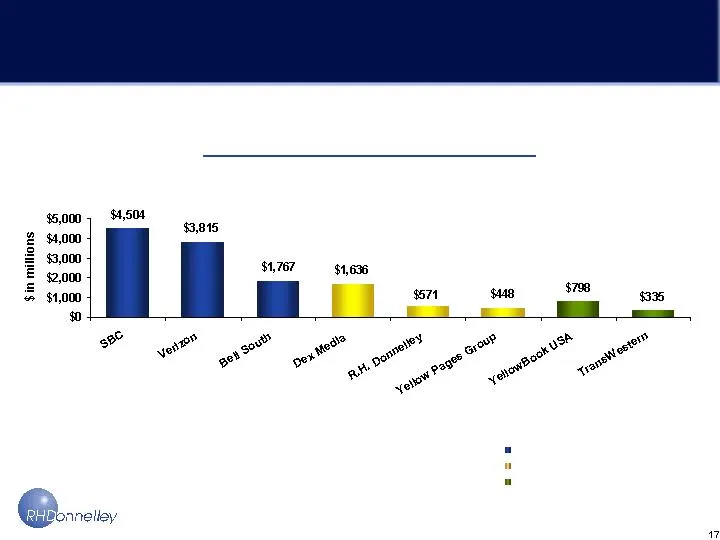
Top North American Directory Publishers 2002 Revenue RBOC Independent Incumbent Competitive Independent Source: Banc of America Securities Research and Company Reports
Slide 18: Incumbent Competitive Advantage
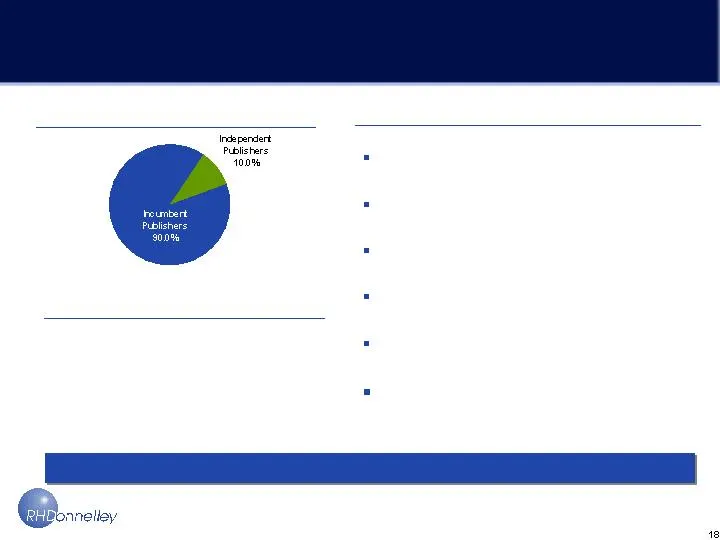
Incumbent Competitive Advantage Incumbent advantages have allowed for sustained premium pricing Incumbent Competitive Advantage “Official” telephone book High brand recognition Broader distribution More accurate & robust content Greater consumer retention Higher usage Source: SIMBA Information, Yell
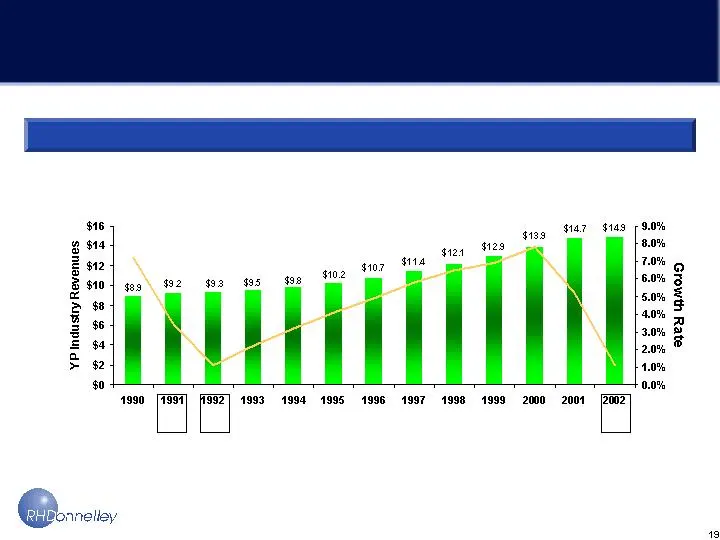
Slide 19: Consistent and Stable Growth
Consistent and Stable Growth U.S. Directories Advertising Revenue ($ in billions) Source: Veronis Suhler Stevenson Communications Industry Forecast & Report July 2003 Year-over year growth 7.2% 3.4% 1.1% 2.2% 3.2% 4.1% 4.9% 5.8% 6.5% 6.9% 7.8% 5.2% 1.1%
Slide 20: Substantial Recurring Revenue
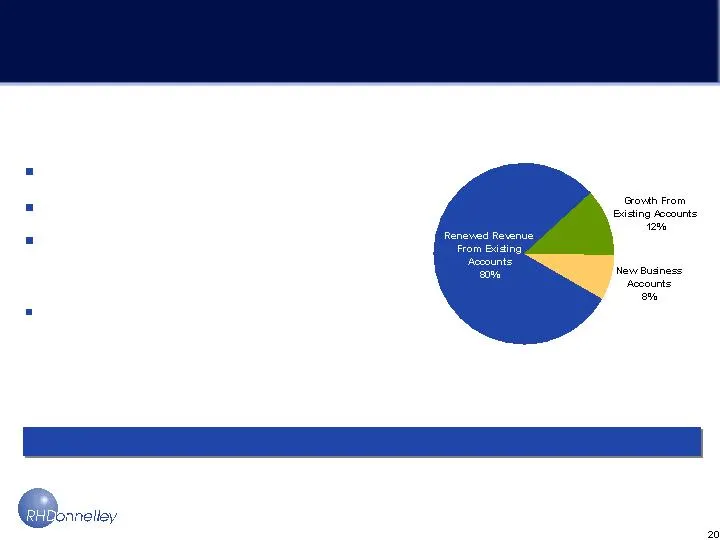
Substantial Recurring Revenue 90% Recurring Annual Revenue Source: YPIMA, 2002 Industry Forecast January 2002 Yellow Page Publishers, 2000 Benchmarking Study High recurring revenue High customer retention Primary or only advertising vehicle for many small and medium-sized businesses High penetration
Slide 21: Relative US Market Share
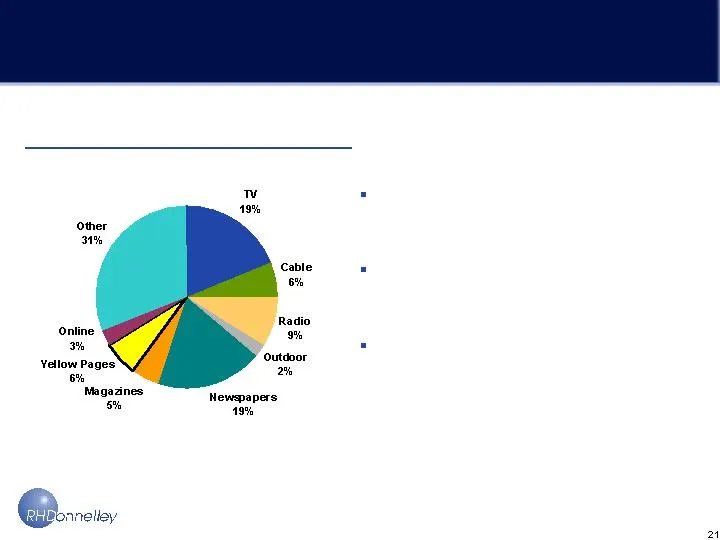
Relative US Market Share 2003E Advertising Pie Source: Deutsche Bank estimate, Universal McCann, Television Advertising Bureau, Paul Kagan Associates Inc., Cable Television Advertising Bureau, Radio Advertising Bureau, Outdoor Advertising Association 2003 Yellow Pages revenue estimated to be $14.5 b

Slide 22: Yellow Pages as an Advertising Medium
Yellow Pages as an Advertising Medium
Slide 23: Directional Media?
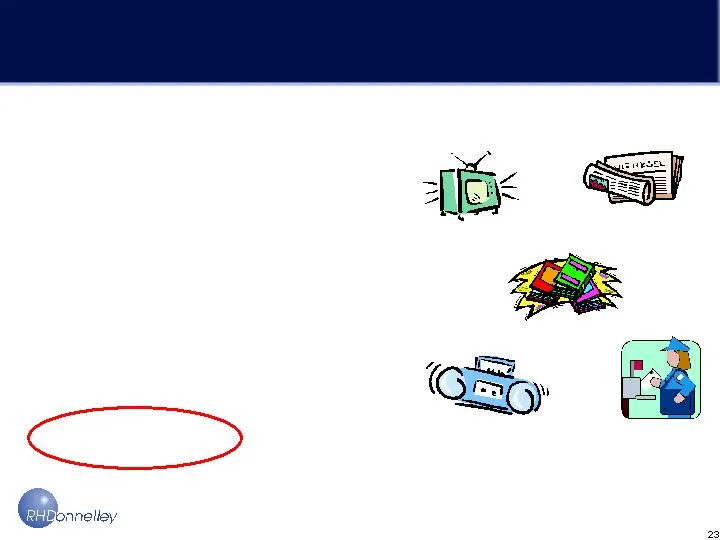
Directional Media? Creative Advertising Drive Awareness Develop Needs Reinforcing Brand Promotion Reach Create Impressions Passive Audience Radio Newspaper Magazine Direct Mail Television
Slide 24: Directional Media?
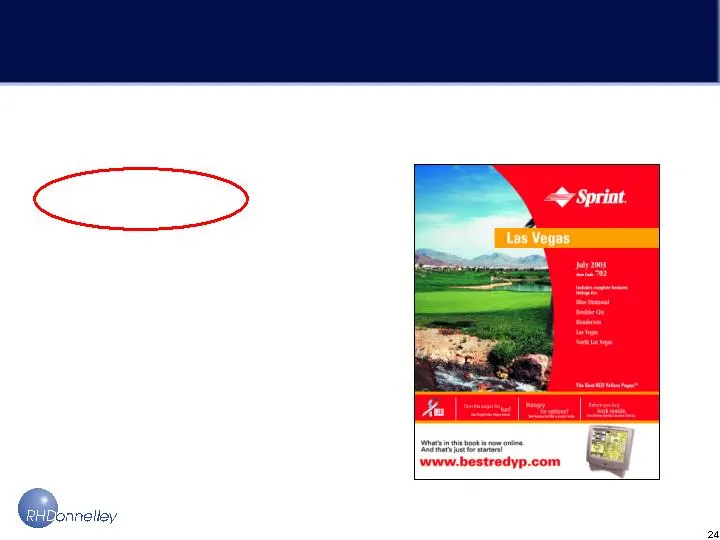
Directional Media? Directive Advertising Active Consumers Resource Tool Buying Mode Solves for Needs Distribution References

Slide 25: Yellow Pages as Directional Media
Yellow Pages as Directional Media Relevant – references are initiated by consumer Decision-Impacting – “point of sale advertising ” – 58% are shopping; 69% view ads Recent – last chance to impact shopping decision Ready-to-buy – 89% of those who use the YP’s make or intend to make a purchase Way to
Slide 26: Diverse Users
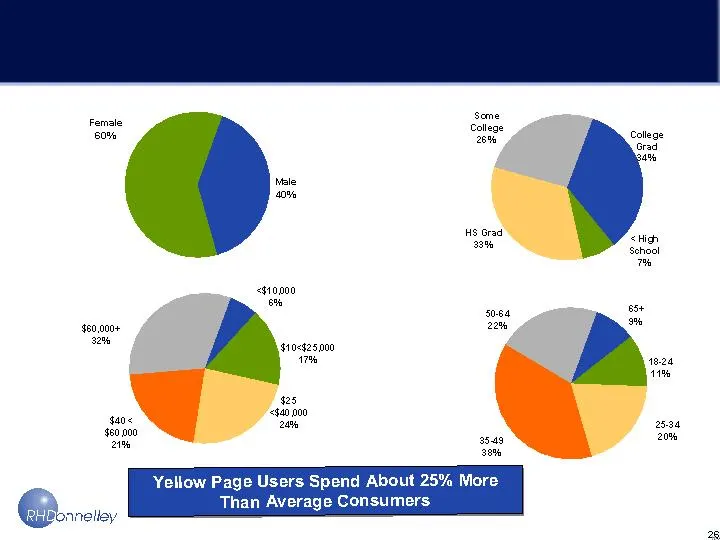
Diverse Users Source: YPIMA 2002 Facts and Media Guide Gender Education Annual Income Age
Slide 27: Usage Drivers
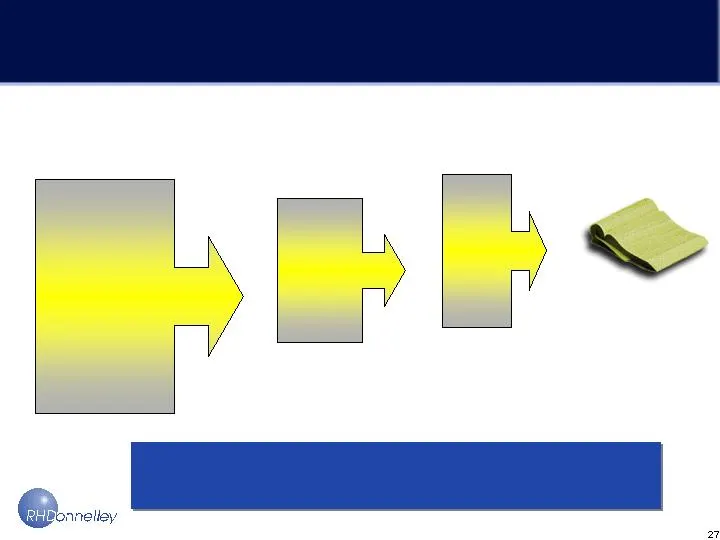
Usage Drivers 89% of Users Make or Intend to Make a Purchase Life Events Getting Married Purchasing First Home Having a Baby Separated/Divorced Changing Jobs Child Graduating College Retirement Purchasing Retirement Condo Daughter Getting Married Newly Created Needs for Products & Services Shopping
Slide 28: Drivers of YP Usage
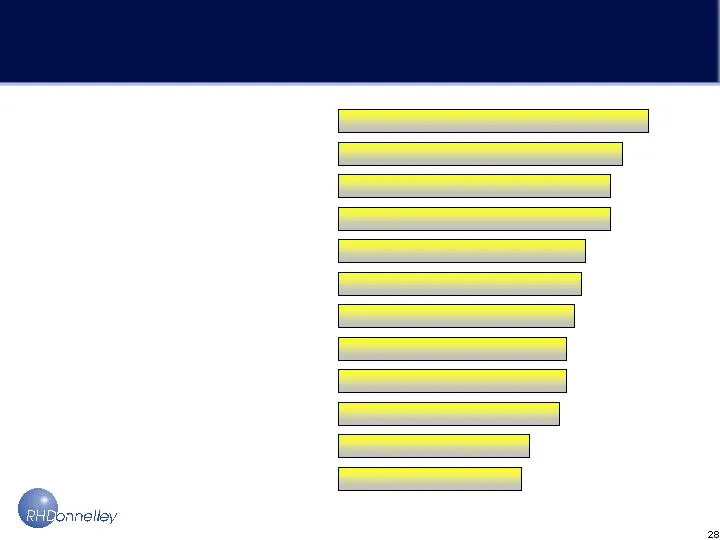
Drivers of YP Usage (% increase in directory use) 85% Getting Married Last Home Mortgage Payment Collect from Pension Buying First Home Changing Job New Baby Youngest Child Graduating Separated / Divorced Youngest Daughter Getting Married Youngest Child Leaving Home Retirement Selling or Changing Ho
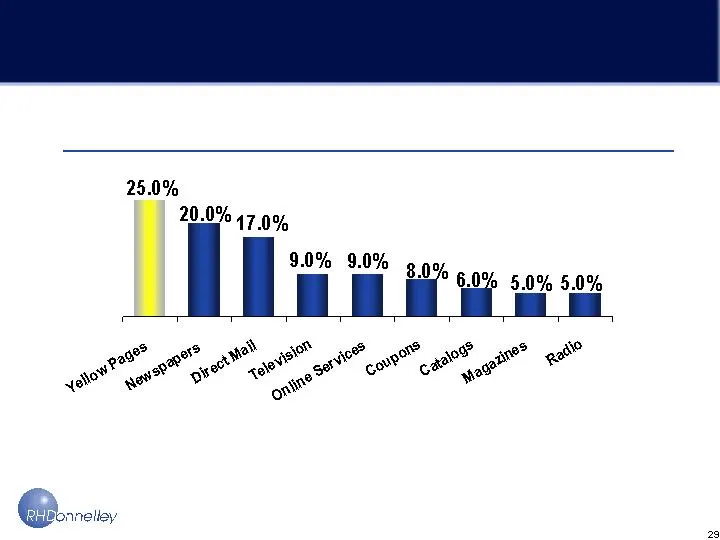
Slide 29: Influencing Consumer Behavior
Influencing Consumer Behavior Yellow Pages Influences More Buyers Than Any Other Media Source: NFO Media Impact 2002
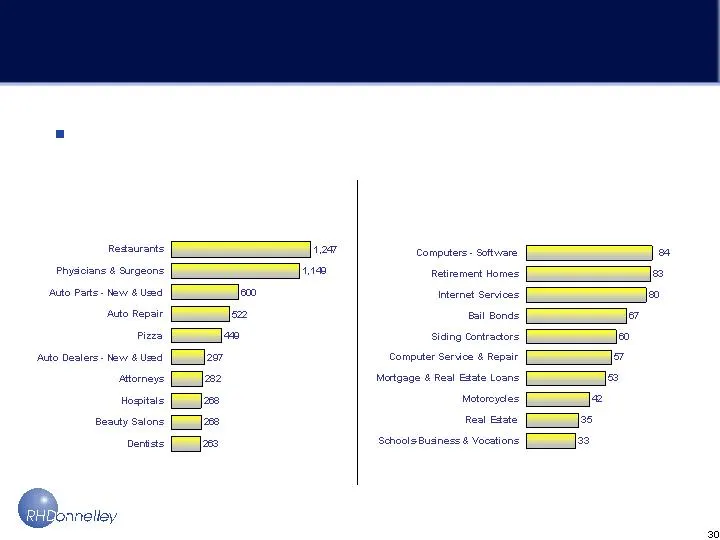
Slide 30: Most Referenced Categories
Most Referenced Categories Top 10 Reference Headings Annual references by heading (2001 - in millions) In 2002 users referenced directories approximately 15.2 billion times Fastest-growing Headings: References (percent growth from 1999 to 2001) Source: YPIMA 2002 Facts and Media Guide

Slide 31: Strong Advertiser Base
Strong Advertiser Base As an industry, we are the Marketing and Advertising Resources for many of our customers Dominated by SME’s Local Establishments <20% revenues originate from national Service Industries Attorneys/Physicians/Plumbers/Movers/Contractors Limited Marketing Resources
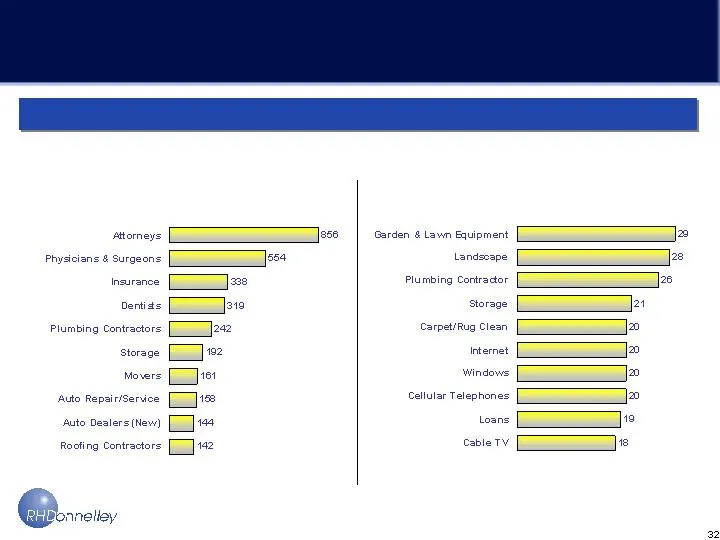
Slide 32: Who are Yellow Pages advertisers?
Who are Yellow Pages advertisers? Almost 50% of Yellow Pages revenue is generated by 50 headings Top 10 Headings by Revenue Annual revenue by heading (2001 - in millions) Source: YPIMA 2002 Facts and Media Guide Fastest-growing Headings: Revenue (percent growth from 1999 to 2001)
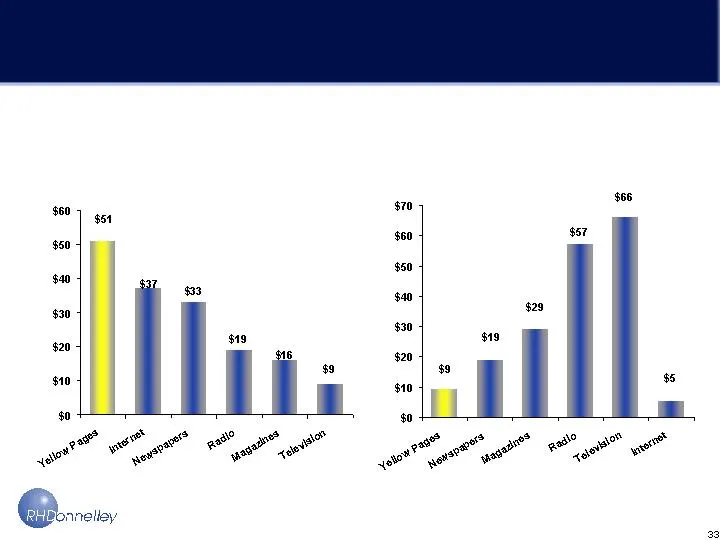
Slide 33: Strong/Measurable Results
Strong/Measurable Results Avg. Sales Return On Investment Per Dollar Invested Cost Per Buyer Influenced Median Values By Media For Top Headings Source: CRM Associates Yellow Pages Trends and Opportunities 2002 December 2002
Slide 34: Internet as Directive Media
Internet as Directive Media Multiple Business Models with No Proven Winner TODAY Products vs. Services National in Scope Out of Area Information Research vs. Selection
Slide 35: Yellow Pages and the Internet
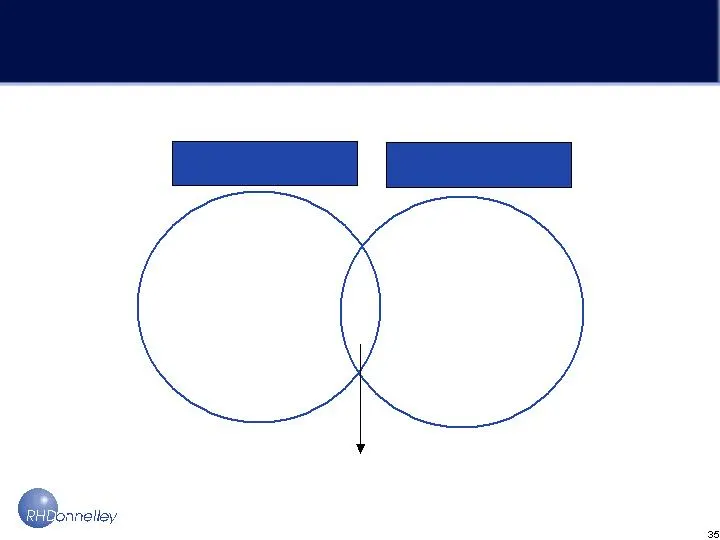
Yellow Pages and the Internet Yellow Pages 15.2 billion References Internet Search/References Local Products & Services Product Searches Local Searches National Searches Research Tool Local searches over the Internet are still evolving

Slide 36: Directive Media Success Online
Directive Media Success Online Accurate Data Depth and Breadth of Local Content Readily Available………Always on Simplicity for Local Merchants Reliable and transparent return on investment

Slide 37: Key Points
Key Points Yellow Pages: Directive In Nature Active Consumers Predisposed To Buying Diverse and Attractive User Base Rich Content at the Local Level Attractive Advertiser Segment Cost Efficient with Measurable Performance Well Positioned to Migrate to the Digital Environment

Slide 38: Directories vs. Other Media
Directories vs. Other Media

Slide 39: Investment Characteristics vs. Other Media
Investment Characteristics vs. Other Media RH D Outdoo r Radi o T V New s Direct Interne t Strong Brand Value Stable/Predictable Visible Renewals Strong Market Share Reference Conversion Annual Contracts 50%+ Margin Low Cap Ex High Cash Conversion No Regulatory Constraints
Slide 40: EBITDA Valuation: Favorable to Other Media
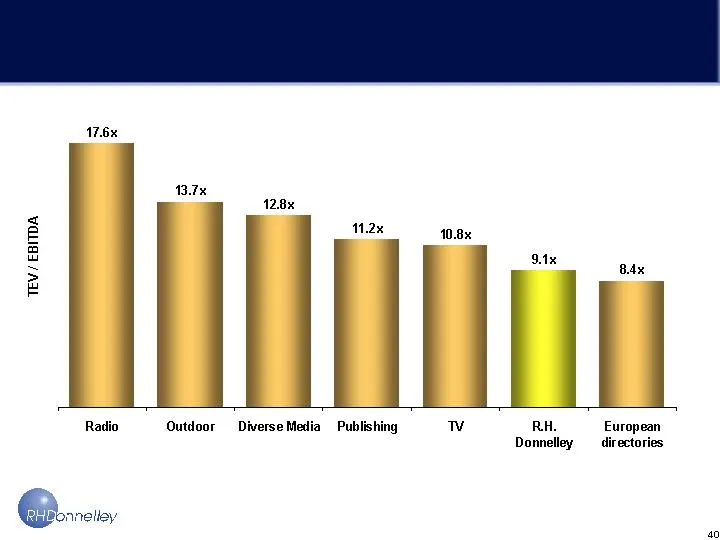
EBITDA Valuation: Favorable to Other Media Source: Deutsche Bank Securities Inc.
Slide 41: Cash Conversion: Favorable to Other Media
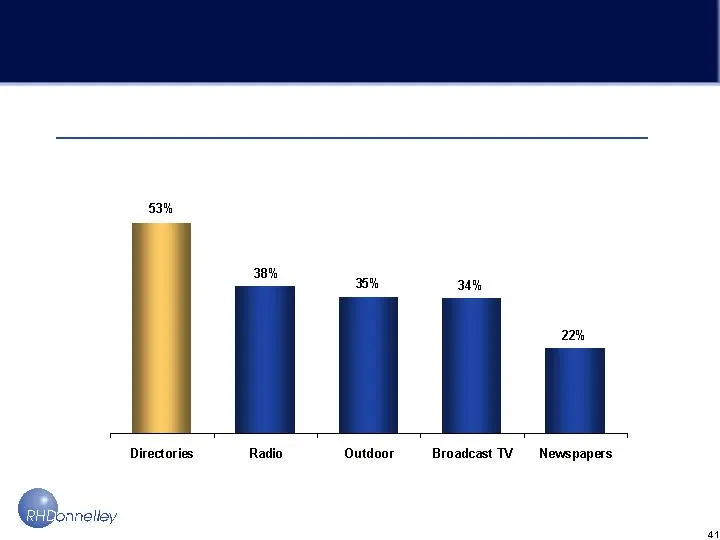
Cash Conversion: Favorable to Other Media Estimated Margin: EBITDA minus CapEx Source: Deutsche Bank Securities Inc.
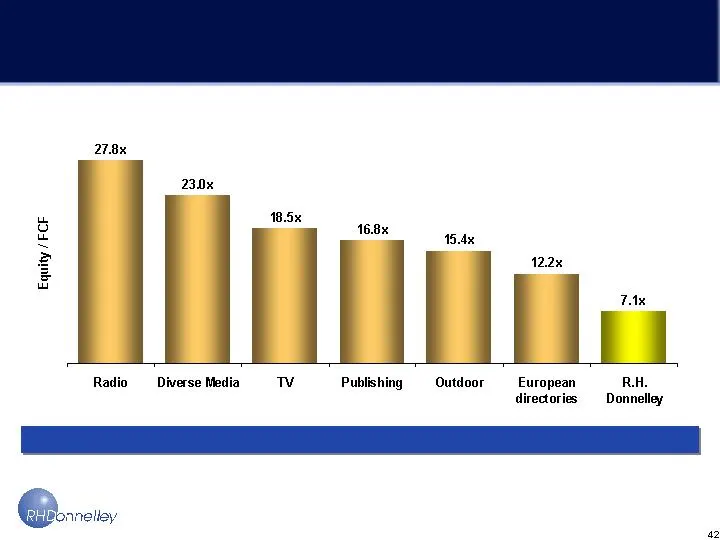
Slide 42: Favorable Free Cash Flow Multiples
Favorable Free Cash Flow Multiples Cash is a Fact Source: Deutsche Bank Securities Inc.

Slide 43

Slide 44: Company Overview
Company Overview
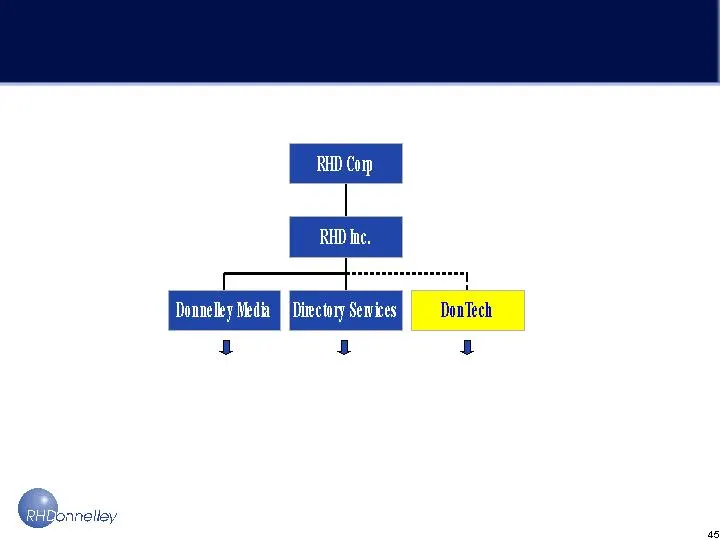
Slide 45: Organizational Structure
Organizational Structure SBC Branded Products (50/50 Partnership) Sprint Branded Products Publishing & Informational Services for DME & DonTech

Slide 46: Donnelley Media
Donnelley Media

Slide 47: What is Donnelley Media?
What is Donnelley Media? Group of 800 professional s Focused on growing Sprint brand yellow page and publishing business 160,000 local advertisers and 4,000 national customers Services 3,500 communities Produces $550 million in sales Distributes over 18 million directories
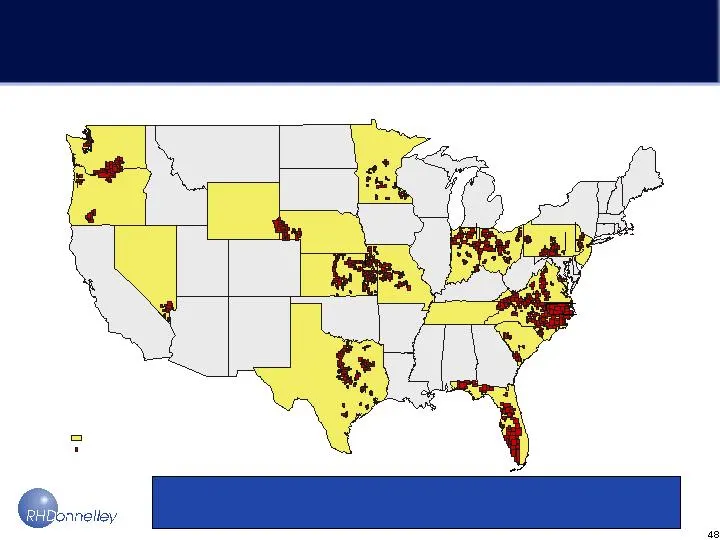
Slide 48: Key Markets Diverse Geographic Footprint
Key Markets Diverse Geographic Footprint States where Sprint has LEC operations Indicate LEC operations
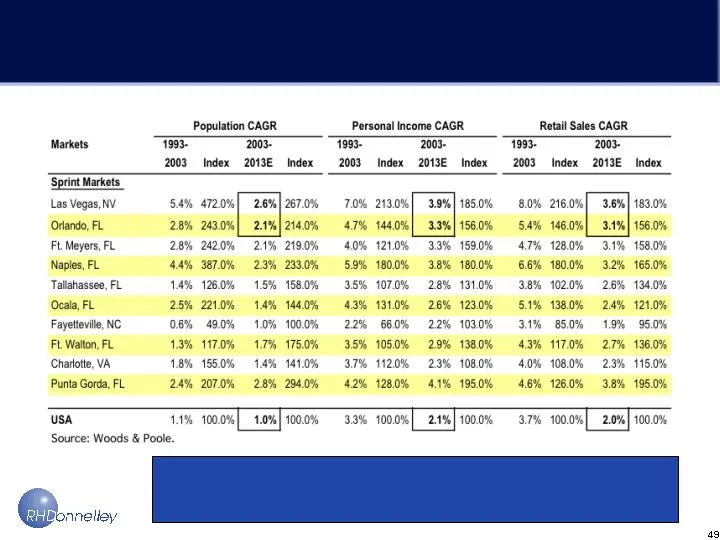
Slide 49: Key Markets Statistics
Key Markets Statistics Top Ten Markets Exceed National Average in Key Economic Drivers
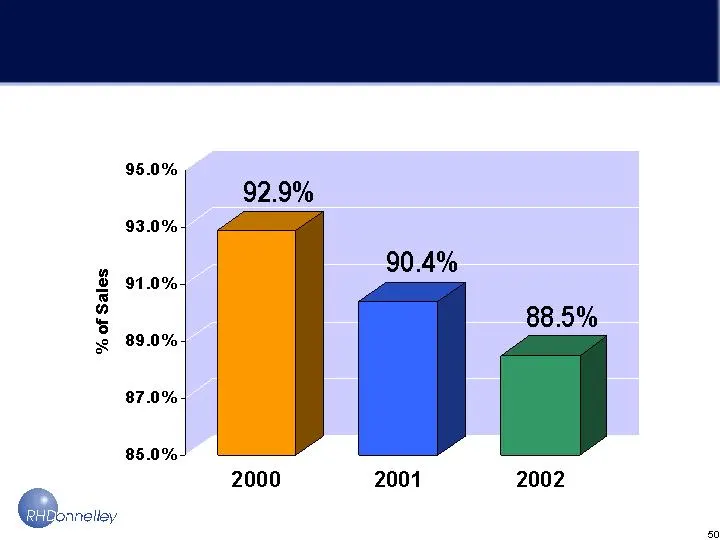
Slide 50: Recurring Revenue Prior to Acquisition
Recurring Revenue Prior to Acquisition
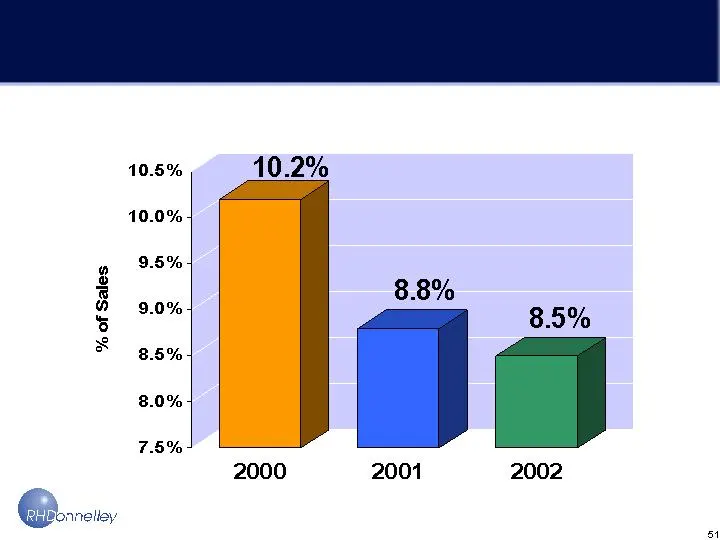
Slide 51: New Business Performance Prior to Acquisition
New Business Performance Prior to Acquisition
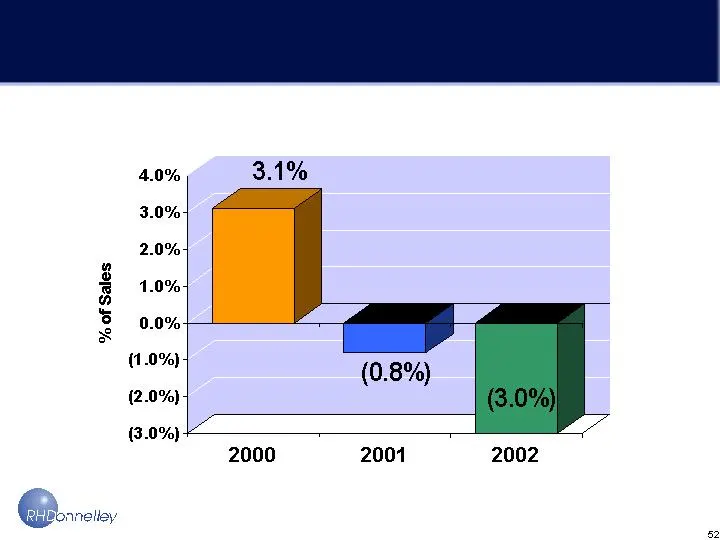
Slide 52: Net Gain Performance Prior to Acquisition
Net Gain Performance Prior to Acquisition

Slide 53: Strategic Focus
Strategic Focus 1. Focus on Core Business • Execution 2. Expand the Footprint 3. New Products

Slide 54: Marketing
Marketing Paid for Performance Centralized Advertis ing PR Research Pricing New Products - Print/Electronic
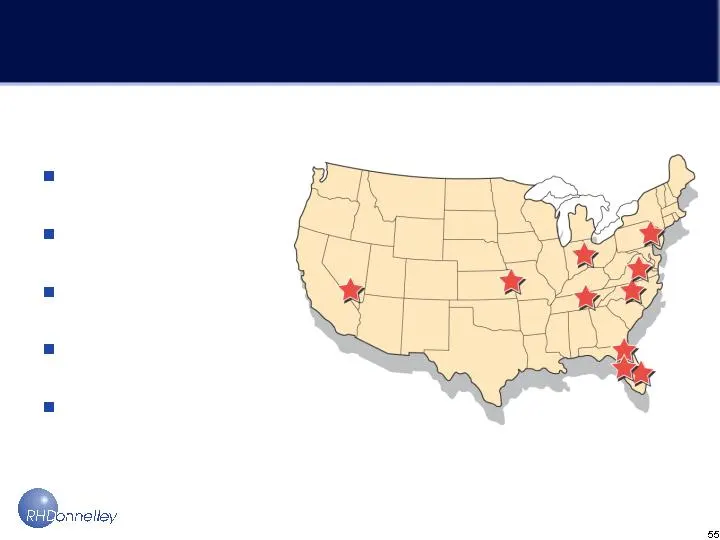
Slide 55: Marketing
Marketing Paid for Performance Decentralized Field Marketing Localized Product Development Local Market Plan Edge Outs New Books
Slide 56: Advertising
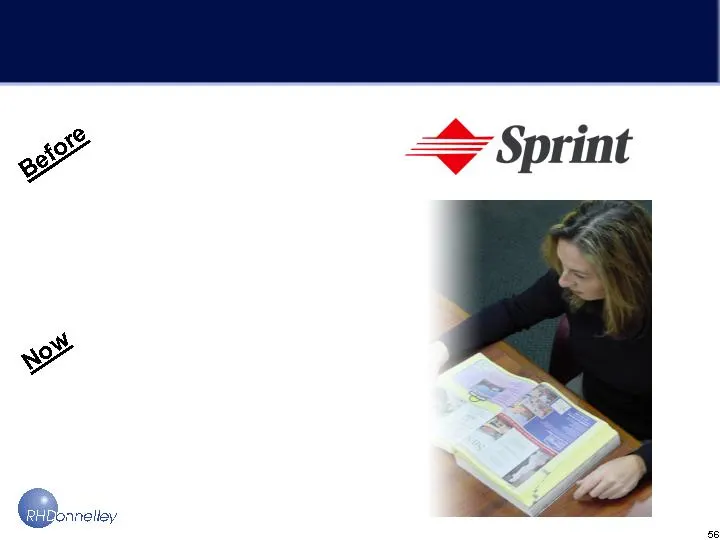
Advertising Brand Focused vs. Retention and Usage Focused

Slide 57: Market Investment Plan (MIP)
Market Investment Plan (MIP) Top 40 Markets for 2004 Finance – Sales – Marketing – Training Local franchise presents its Business Plan
Slide 58: Net Sales Gain
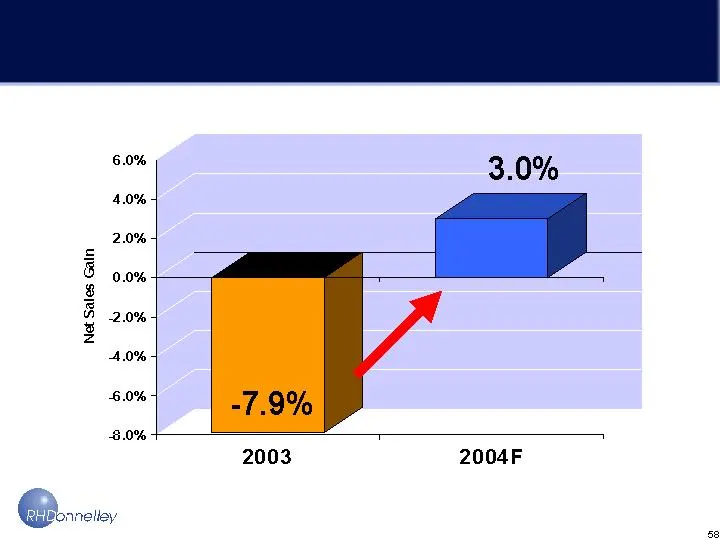
Net Sales Gain 2003 3.0% 2004F ses

Slide 59: Sales Organization
Sales Organization Training Local National
Slide 60: Sales Recruiting - Hiring - Training
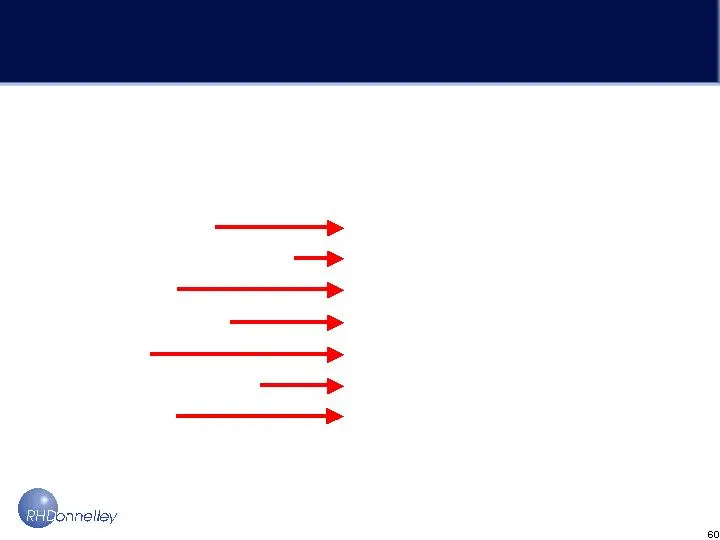
Sales Recruiting - Hiring - Training Former Now Newspaper Ads Agencies/Referral Limited Sales Experience Trainers from top 20% of Sales Force No Program Management Development Program Concept Learning 17 Page Script 3 Weeks 8 Week Training Program Limited Accountability Total Accountability Limited

Slide 61: Training Results Comparison
Training Results Comparison Former Process Current Process Timeframe 6/02 - 11/02 6/03 - 11/03 # of Trainees Sales $321,000 $565,000 Net Gain -0.5% 8.9% Turnover 41% 19%

Slide 62: Local Sales Regions Divisions
Local Sales 2 Regions 10 Divisions 3 Levels of Premise 3 Levels of Telephone

Slide 63: Sales Process Changes/Execution
Sales Process Changes/Execution Assignments Earne d Objectives Increased Increased Variable Compensation Geo-coded Assignments Sales Reports Sales Recognition
Slide 64: Market Coverage
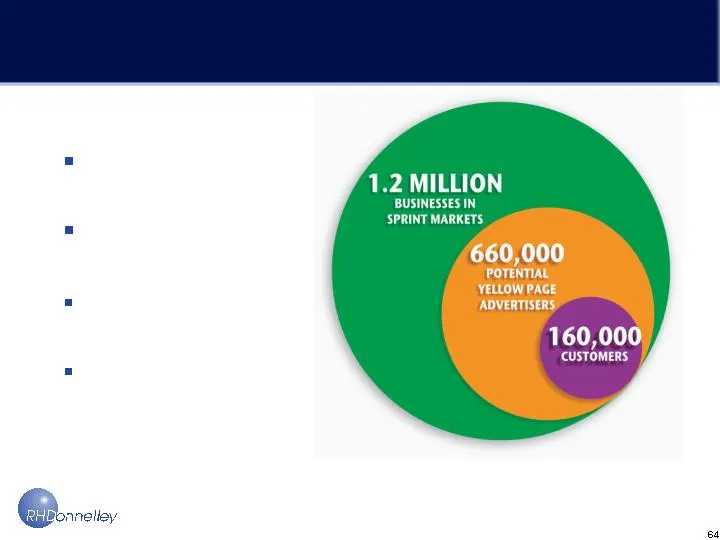
Market Coverage 500,000 Potential Advertisers!! Assign accounts b y Geo-cod e Cal l on potential customers Have a great value story Pay for results

Slide 65: National Sales
National Sales Manages Over 100 CMR Agency Relationships Experienced Quality Team

Slide 66: Finance & Operations
Finance & Operations Budgets Planning & Analysis Billing Credit Collections Customer Service Print & Distribution
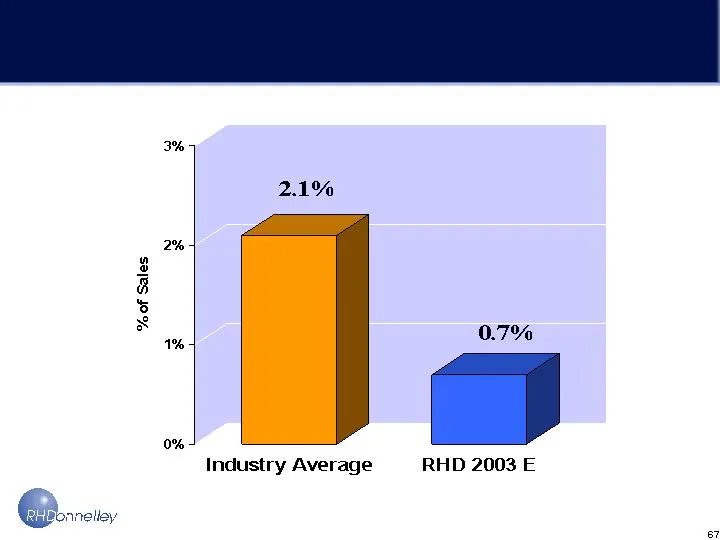
Slide 67: Write-offs as a Result of Errors and Omissions
Write-offs as a Result of Errors and Omissions Source: 2000 YPPA Benchmarking Study
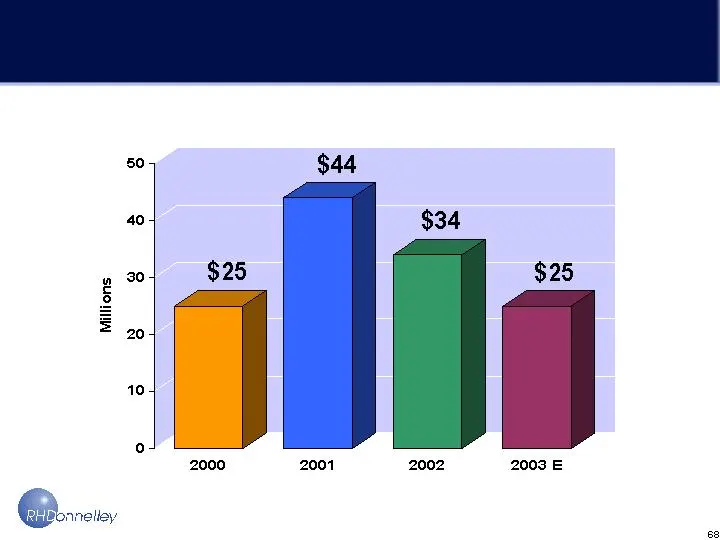
Slide 68: w s = a
w 2 s = 40 30 a
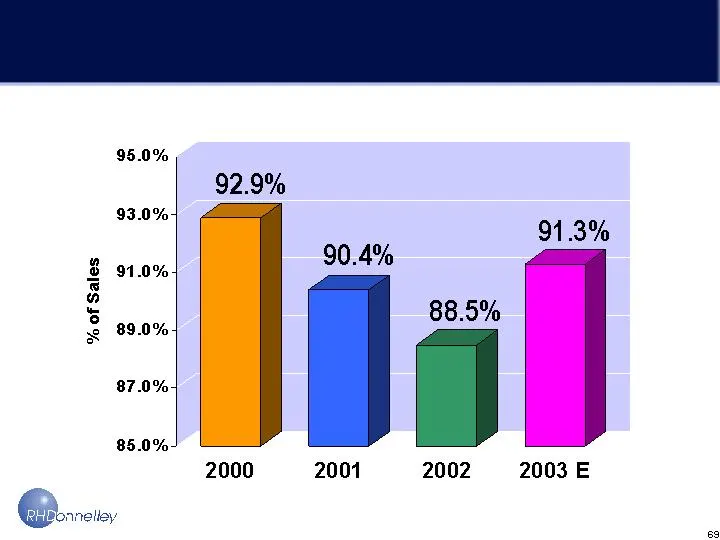
Slide 69: 91.3% 90.4% 88.5% 89.0% - “| 85.0% 2000 2001 2002 2003 E ore, %
91.3% 90.4% 88.5% 89.0% - “| 85.0% 2000 2001 2002 2003 E ore, % of Sales ee
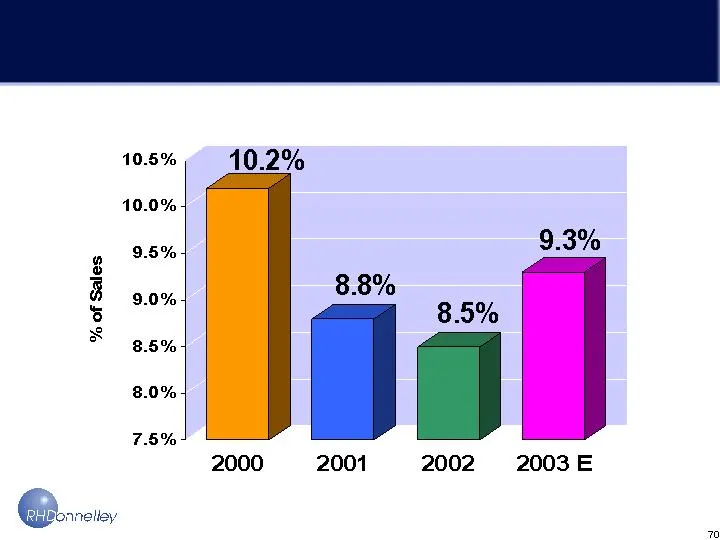
Slide 70: 9.3% 8.8% = 8.5% 8.5% 8.0% 7.5% 2000 2001 2002 2003E % of Sales
9.3% 8.8% = 8.5% 8.5% 8.0% 7.5% 2000 2001 2002 2003E % of Sales o ° x Orc, ‘ne
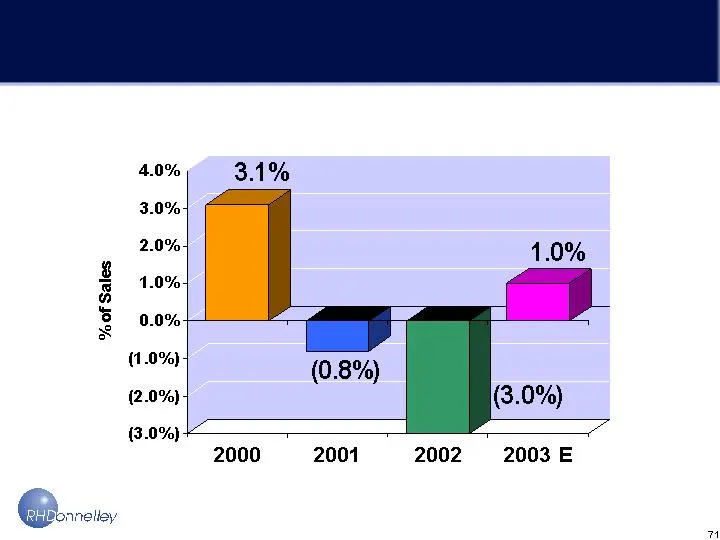
Slide 71: %of Sales
40%) 3.1% 3.0%: 2.0% 1.0% 0.0%+ %of Sales (1.0%) (0.8%) (2.0%) (3.0%) (3.0%) Orc, 2000 2001 2002 2003 E “ng

Slide 72: Strategic Focus
Strategic Focus 1. Focus on Core Business Execution 2. Expand the Footprint 3. New Products
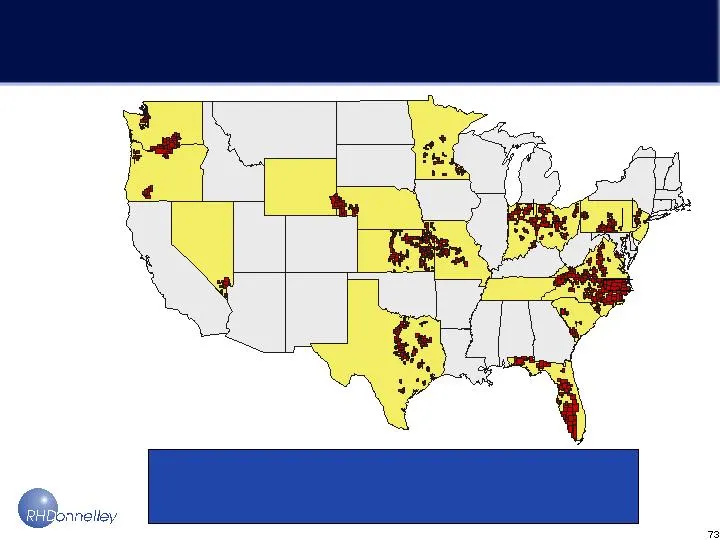
Slide 73: Expand the Footprint
Expand the Footprint From Dial Tone Boundaries to Shopping Patterns

Slide 74: New Products - Digital
New Products - Digital Sprint had no electronic solution Launched first city guide and on-line yellow pages in Las Vegas in July 2003 www.bestredyp.com Began selling internet product Greater than 40% acceptance rate Additional prototypes in 2003 50 additional markets in 2004 Less than $1.0 million t

Slide 75: Key Take-aways
Key Take-aways Outstanding Markets Experienced Management Team Proven Business Process Strong Value Proposition

Slide 76: Directory Services
Directory Services

Slide 77: Directory Services – Value Proposition
Directory Services – Value Proposition High Quality Cost Efficient Business Partner focused on contributing to the success of its customers Provides a comprehensive array of Production and IT services to DME, DonTech, SBC and RHD Corporation
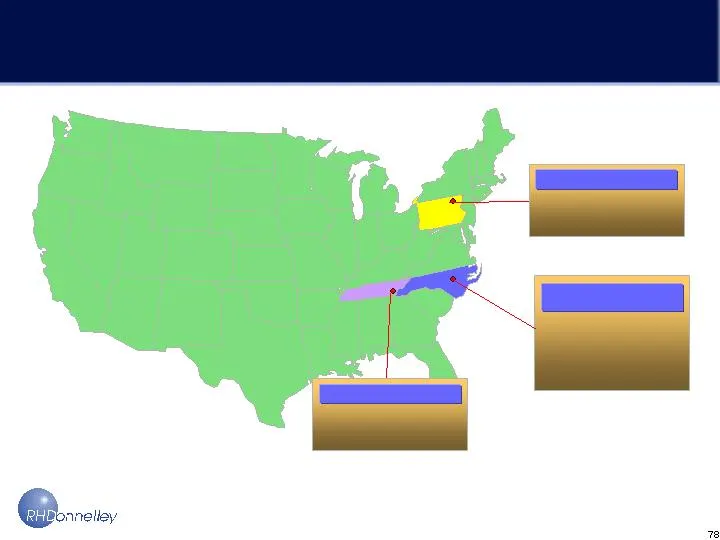
Slide 78: Directory Services – Publishing & IT
Dunmore, PA Raleigh, NC Directory Services – Publishing & IT Bristol, TN Graphics Center: Employees: 85 Publishing & IT: Publishing: 215 IT: 100 IT Contractors: Graphics Center: Employees: 85

Slide 79: Providing Comprehensive Services
Providing Comprehensive Services Directory Manufacturing Process Billing & Collections Directory Distribution Customer Service Compilation Composition Graphics Ship to Printer Delivery Information Database Directory Billing Extract Information Billing System Collection System Imaging System Customer
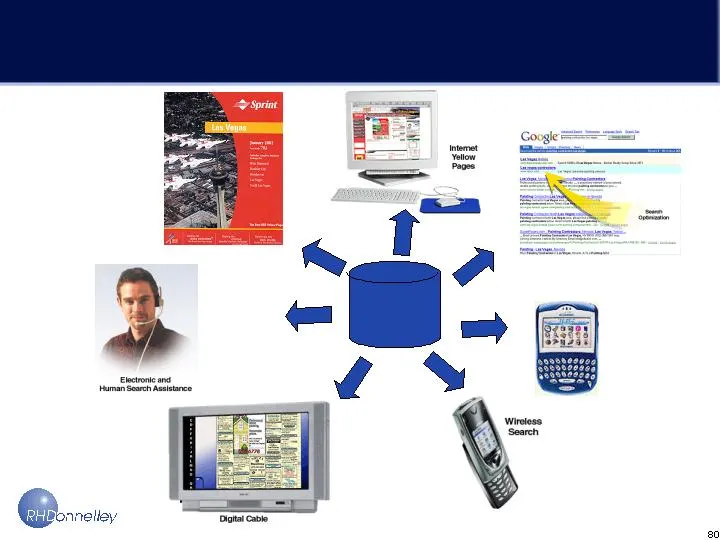
Slide 80: A Digital Publishing Center
Directory Services - A Digital Publishing Center Core Database PDAs
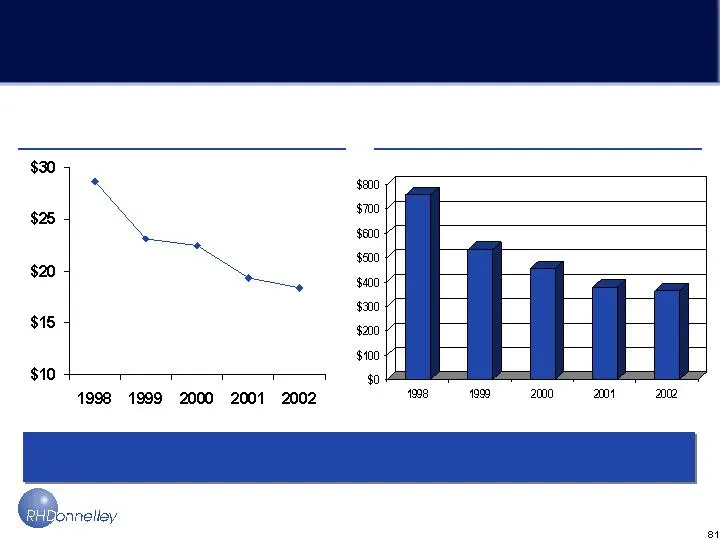
Slide 81: Directory Services – Key Cost Metrics
Directory Services – Key Cost Metrics Directory Services’ focus on performance management is driving operational efficiencies Graphics Cost per Advertisement Cost Per Yellow Page Produced
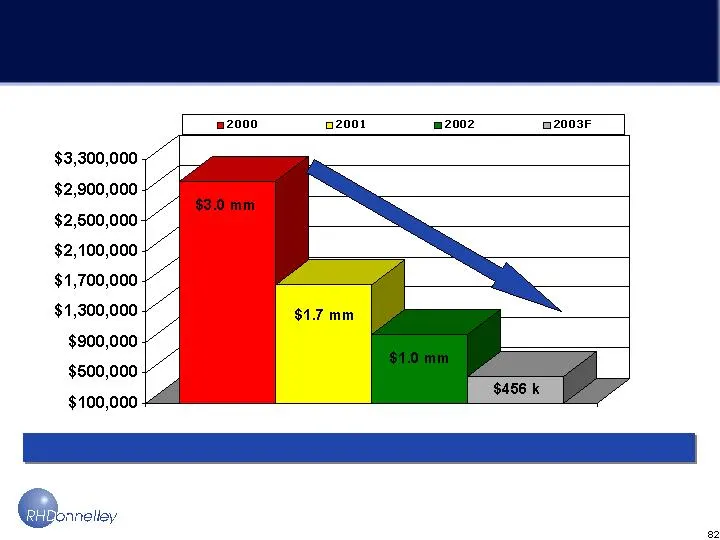
Slide 82: Publishing Claims – Dollars Written Off
Publishing Claims – Dollars Written Off Due to Errors and Omissions (DME & DonTech) Customer Adjustment Levels Well Below Industry Averages!!!! -39% -55% -45% -85%!!!
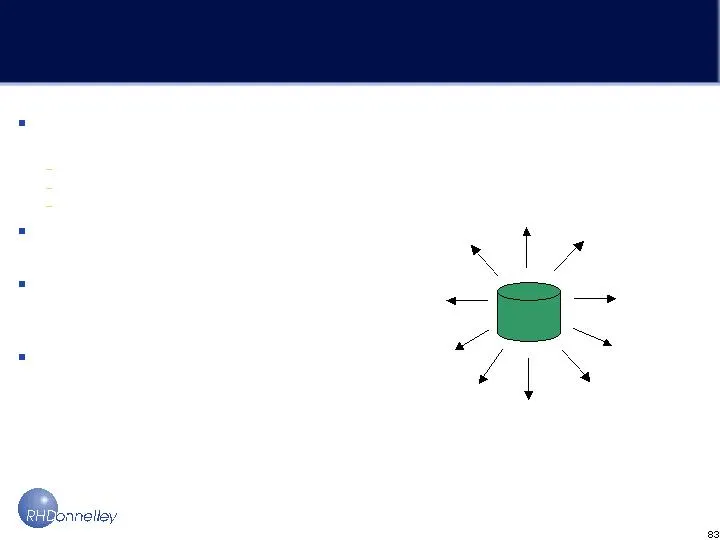
Slide 83: Information Technology Core Database
Information Technology Core Database Marketing Information Publishing Systems Customer Service Product Delivery Sales Performance Reporting Commissions Billing Payroll Sales Automation Financial Raleigh Information Center Responsible for managing all RHD Systems Development Operations Engineering Co
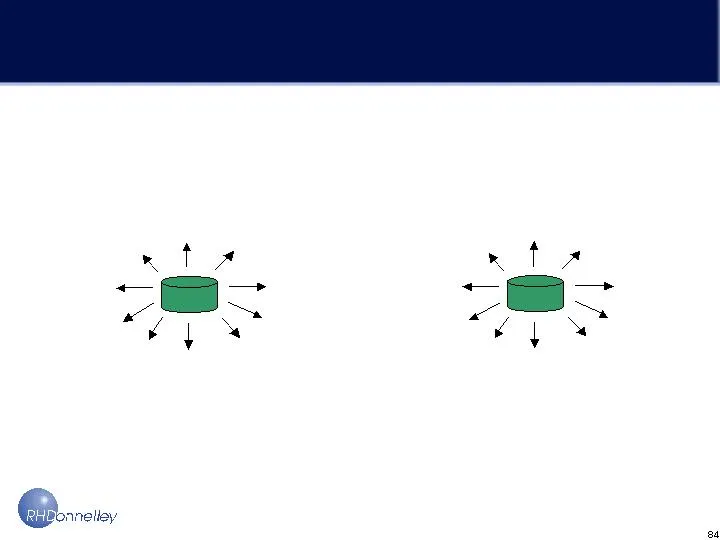
Slide 84: Systems Conversion & Integration
Core Database Core Database Systems Conversion & Integration Raleigh Information Center Marketing Information Publishing Systems Customer Service Product Delivery Sales Performance Reporting Commissions Billing Payroll Sales Automation Financial Marketing Information Publishing Systems Customer Serv
Slide 85: Systems Conversion & Integration
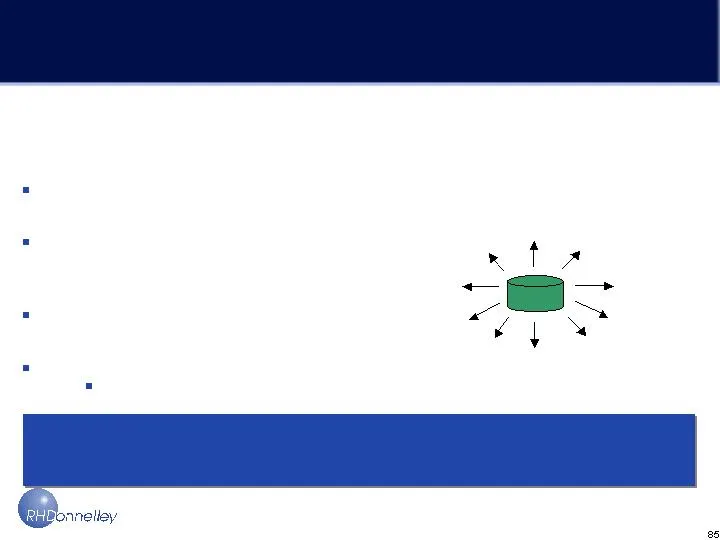
Systems Conversion & Integration Core Database Completed Systems integration, converted 20 million records and published first directory from the Raleigh Information Center Platform within 9 months of acquiring SPA! Raleigh Information Center Marketing Information Publishing Systems Customer Service

Slide 86: DonTech
DonTech

Slide 87: Overview of DonTech
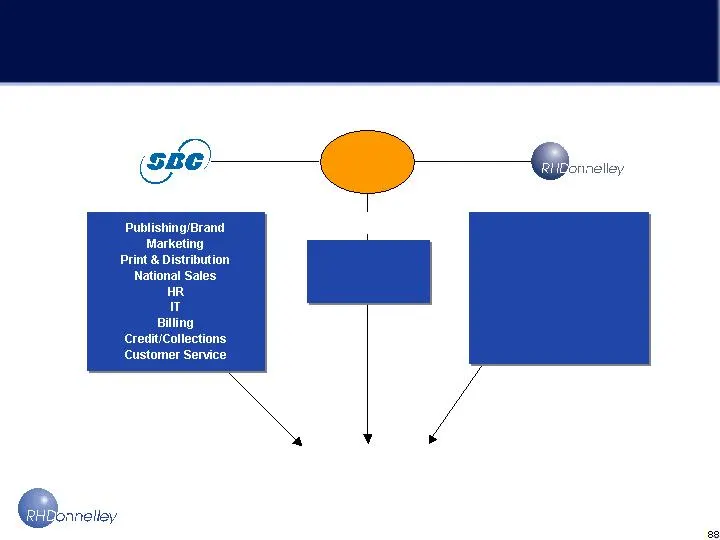
Overview of DonTech Exclusive local sales agent for 129 SBC directories published in Illinois and NW Indiana Relationship began in 1908 50/50 perpetual partnership Operates separately from RHD with 628 employees RHD provides IT, billing and pre-press publishing services under separate agreements wit
Slide 88: Overview of DonTech
Overview of DonTech Local Sales Local Sales Mgmt General Admin Pre Press IT Services Billing Services Sales Support Systems DonTech Illinois/NW Indiana Yellow Pages Board of Directors

Slide 89: SBC Publishing Services Contracts
SBC Publishing Services Contracts Activity adds scale while $18 mm revenue helps cover our fixed cost base Pre-Press Publishing For all directory products sold by DonTech IT Services Access to Customer Service, Marketing, Sales Reporting and Commission systems Billing Services Customer bill informat

Slide 90: Partnership Pros & Cons
Partnership Pros & Cons Cons Limited ability to affect marketing Limited operating leverage Limited ability to protect profit through expense control Declining earnings and cash flow in the short term Pros Senior cash flow entitlement through revenue participation interest Limited exposure to expens

Slide 91: Partnership Issues & Opportunities
Partnership Issues & Opportunities Nevertheless, it’s important to establish appropriate expectations once we turn the corner, as Chicagoland economy is expected to lag U.S. average Current Research & Initiatives at DonTech/SBC Relative to other major markets, Chicagoland remains a promising Yellow
Slide 92: Local Economy – Most Significant Performance Driver
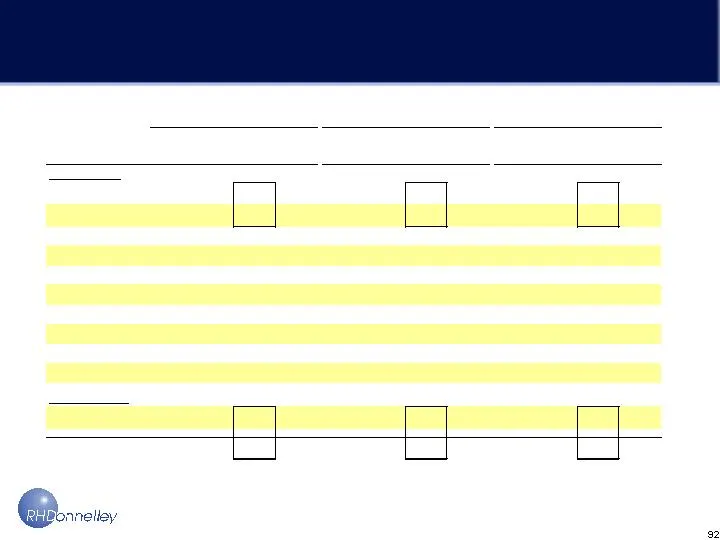
Local Economy – Most Significant Performance Driver Markets 1993- 2003 Index 2003- 2013E Index 1993- 2003 Index 2003- 2013E Index 1993- 2003 Index 2003- 2013E Index Sprint Markets Las Vegas, FL 5.4% 472.0% 2.6% 267.0% 7.0% 213.0% 3.9% 185.0% 8.0% 216.0% 3.6% 183.0% Orlando, FL 2.8% 243.0% 2.1% 214.0

Slide 93

Slide 94: Appendix
Appendix
Slide 95: Reconciliation of non-GAAP measures
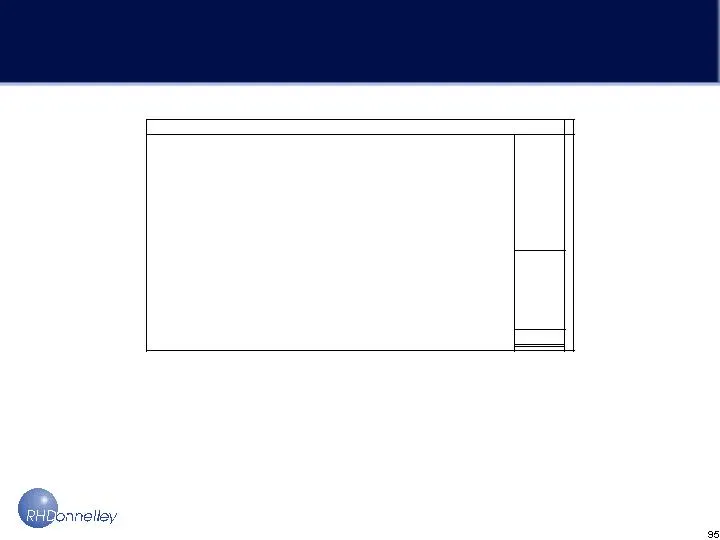
Reconciliation of non-GAAP measures (con’d) Amounts in millions 2003E Reconciliation of GAAP net loss to EBITDA and adjusted EBITDA Net loss - GAAP (51) $ Plus tax benefit (38) Plus interest expense, net Plus depreciation and amortization Less other income (2) EBITDA Plus net revenue that would have

Slide 96: Reconciliation of non-GAAP measures
Reconciliation of non-GAAP measures (con’d) Amounts in millions 2003E Reconciliation of cash flow from operations to free cash flow Cash flow from operations - GAAP $ Less capital expenditures (17) Free cash flow $
Slide 97: Reconciliation of non-GAAP measures
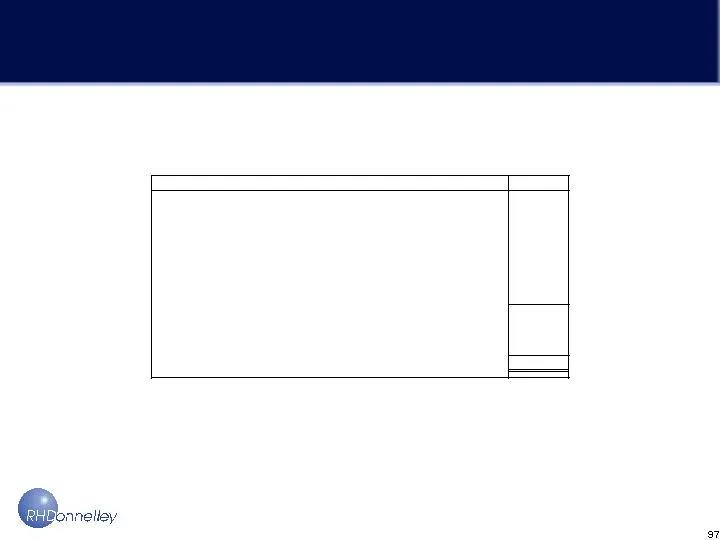
Reconciliation of non-GAAP measures (con’d) Amounts in millions 2003E Reconciliation of publication sales for Sprint-branded directories to GAAP net revenue Publication sales in the period $ Less publication sales for January 2003 directories that were not recognized as revenue due to purchase accou
Slide 98: Reconciliation of non-GAAP measures
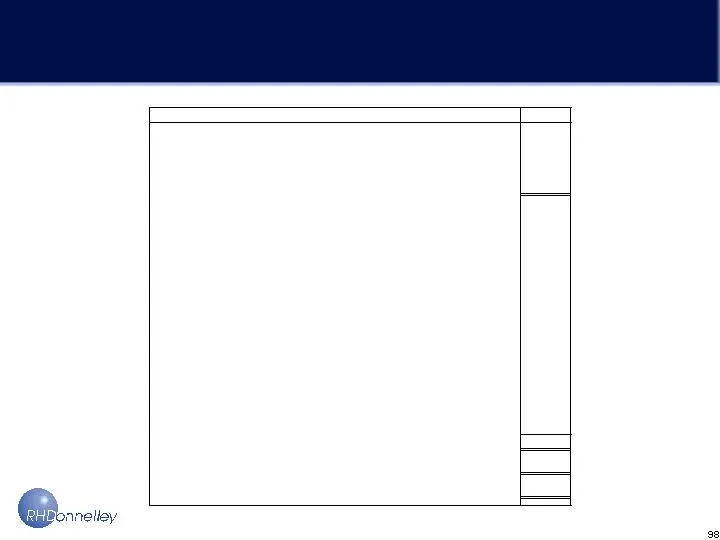
Reconciliation of non-GAAP measures Amounts in millions 2003E Reconciliation of GAAP net loss to normalized EBITDA and calculation of DonTech partnership income as a percent of normalized EBITDA and net loss DonTech partnership income - GAAP $ Net loss - GAAP (51) $ Plus tax benefit (38) Plus intere
Source: SEC EDGAR · 8-K filed Nov 20, 2003
More decks from DEX ONE Corp
 Q4 2012 Earnings Presentation17 slides · Mar 18, 2013
 Merger or Acquisition (December 2012)42 slides · Dec 6, 2012
 Merger or Acquisition (September 2012)51 slides · Sep 18, 2012
 Merger or Acquisition (August 2012)15 slides · Aug 21, 2012
 Q2 2012 Earnings Presentation16 slides · Jul 25, 2012
 Q1 2012 Earnings Presentation17 slides · Apr 26, 2012