NuStar Energy LP — 2019 Wells Fargo Midstream & Utilities Symposium
42 slides from NuStar Energy LP's conference presentation, Dec 11, 2019
Slide 1: 2019 Wells Fargo Midstream & Utilities Symposium
2019 Wells Fargo Midstream & Utilities Symposium December 11-12, 2019
Slide 2: Forward-Looking Statements
Forward-Looking Statements Statements contained in this presentation other than statements of historical fact are forward-looking statements. While these forward-looking statements, and any assumptions upon which they are based, are made in good faith and reflect our current judgment regarding the d
Slide 3: Introduction: Permian Growth Driving Midstream Opportunities
The Permian Basin: PhenomenalIntroduction Growth Driving Midstream Opportunities
Slide 4: In 2018, NuStar Completed Its Stepped Plan to Achieve MLP Characteristics
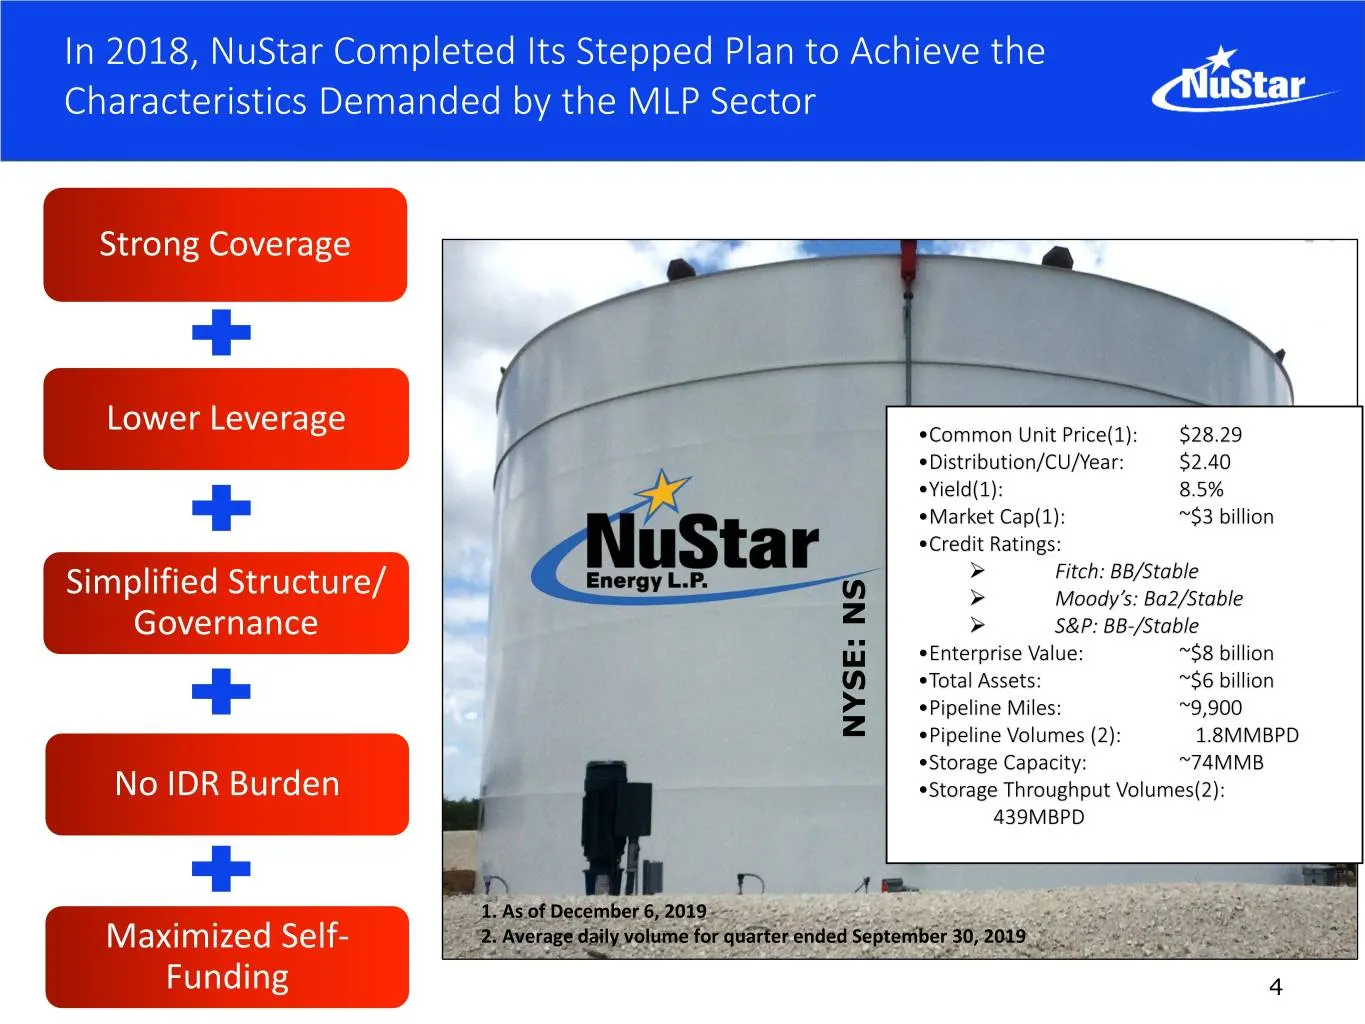
In 2018, NuStar Completed Its Stepped Plan to Achieve the Characteristics Demanded by the MLP Sector Strong Coverage Lower Leverage •Common Unit Price(1): $28.29 •Distribution/CU/Year: $2.40 •Yield(1): 8.5% •Market Cap(1): ~$3 billion •Credit Ratings: ➢ Fitch: BB/Stable Simplified Structure/ ➢ Moody
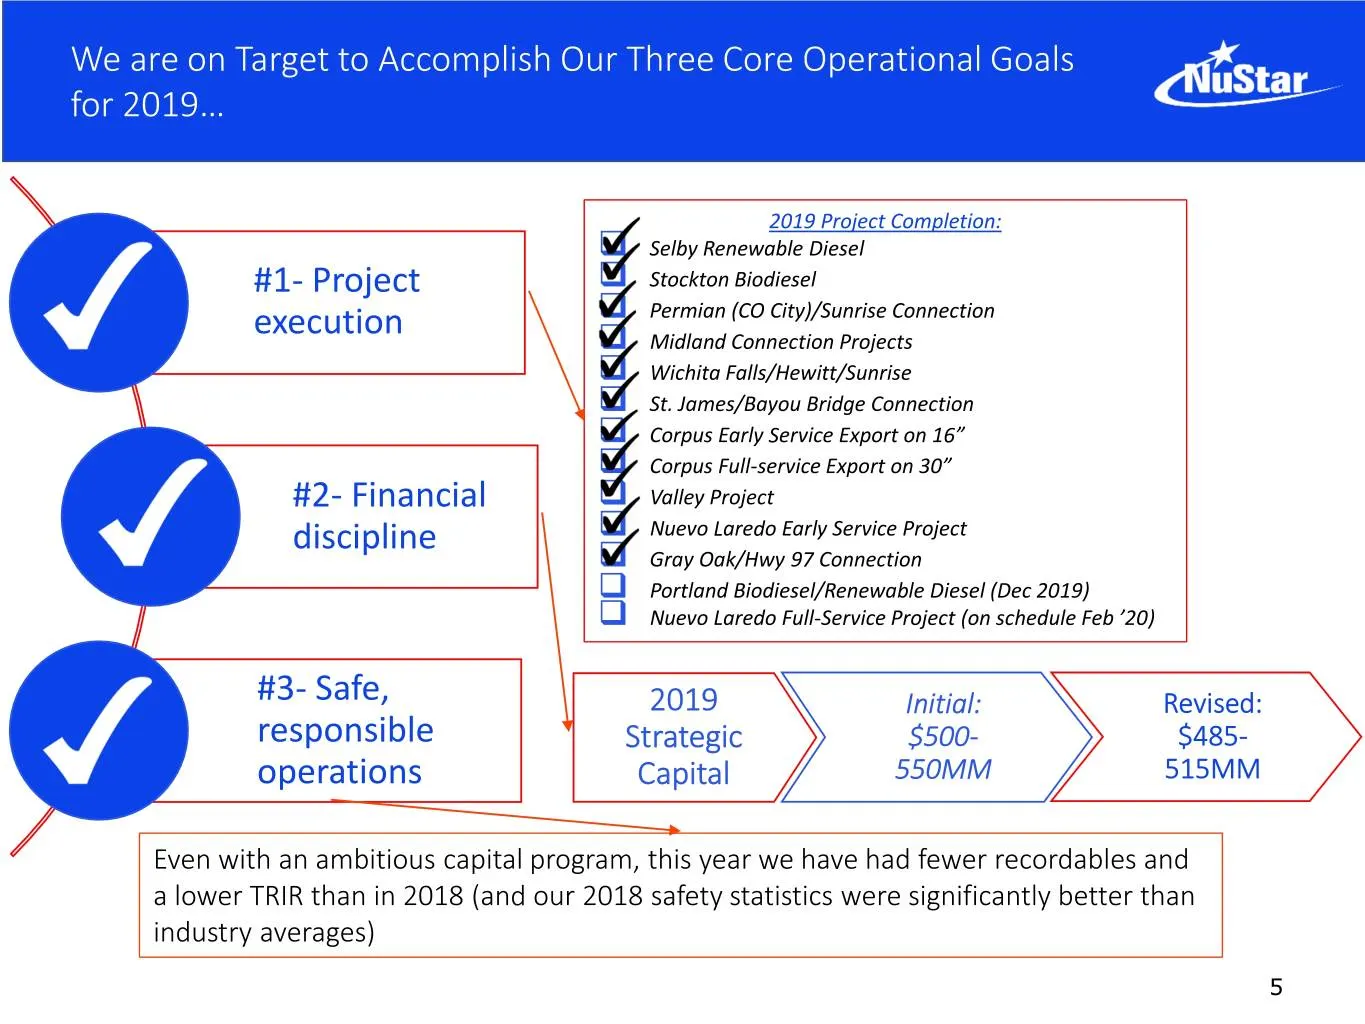
Slide 5: On Target to Accomplish Three Core Operational Goals for 2019
We are on Target to Accomplish Our Three Core Operational Goals for 2019… 2019 Project Completion: Selby Renewable Diesel #1- Project Stockton Biodiesel execution Permian (CO City)/Sunrise Connection Midland Connection Projects Wichita Falls/Hewitt/Sunrise St. James/Bayou Bridge Connecti
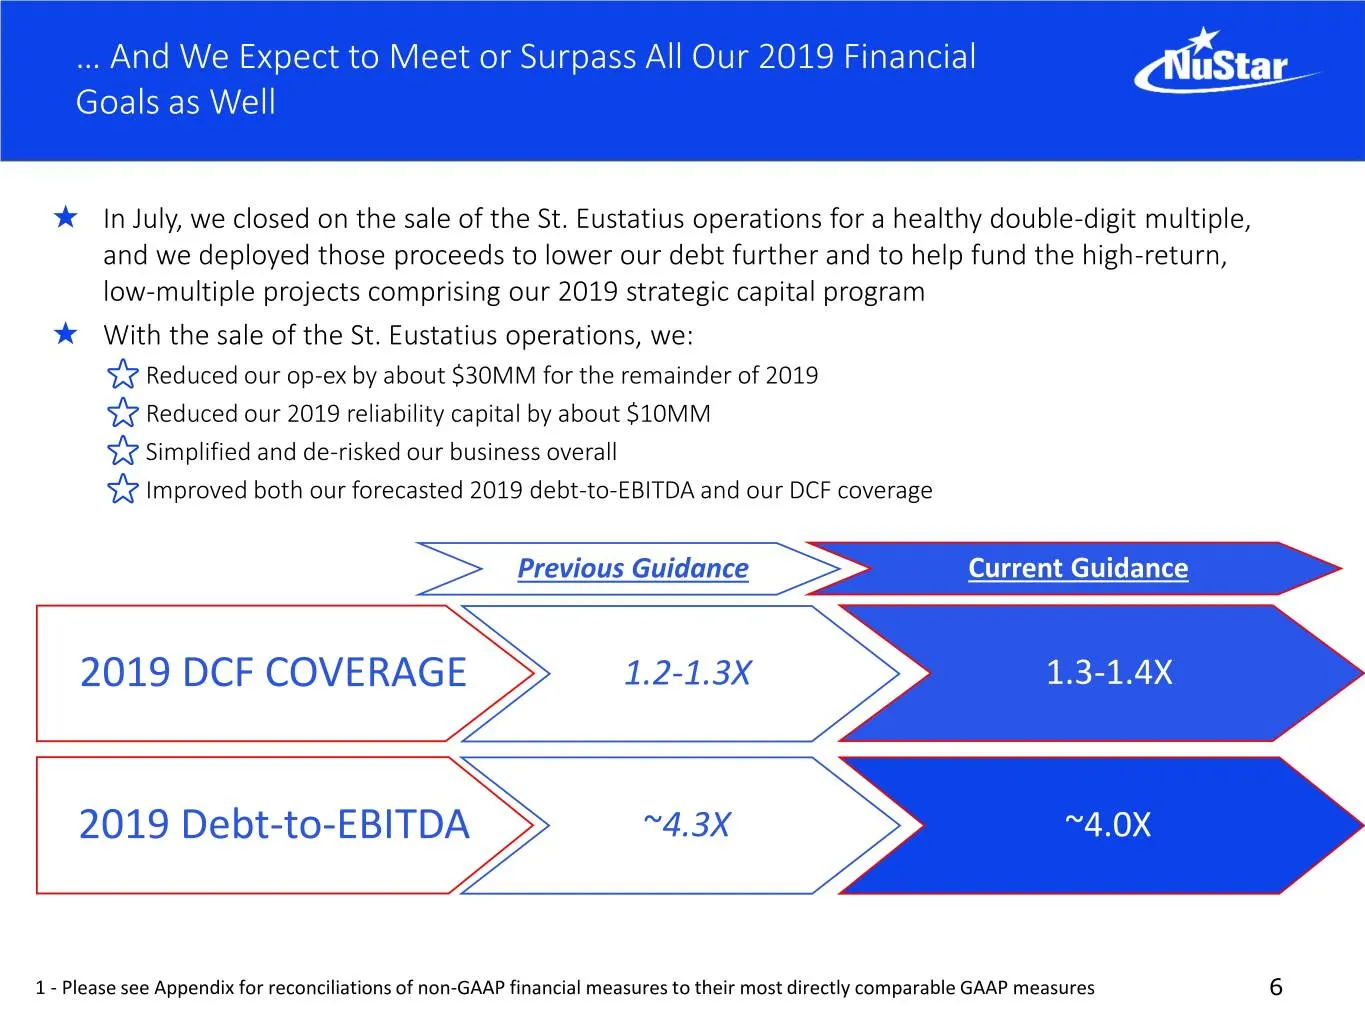
Slide 6: Expect to Meet or Surpass All 2019 Financial Goals
… And We Expect to Meet or Surpass All Our 2019 Financial Goals as Well ★ In July, we closed on the sale of the St. Eustatius operations for a healthy double-digit multiple, and we deployed those proceeds to lower our debt further and to help fund the high-return, low-multiple projects comprising ou
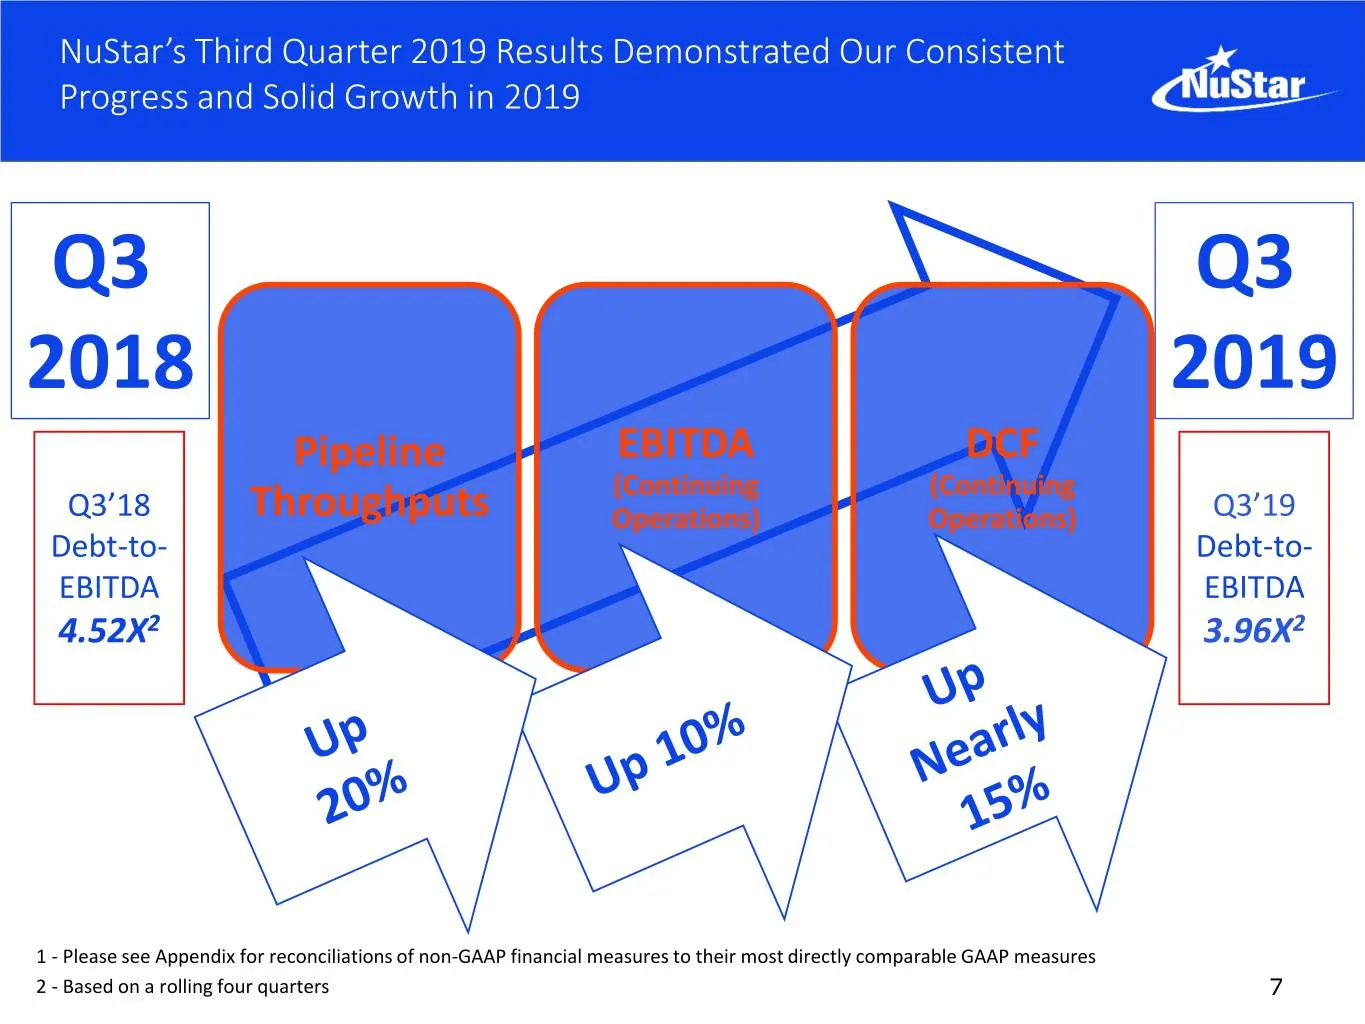
Slide 7: Third Quarter 2019 Results Demonstrated Consistent Progress
NuStar’s Third Quarter 2019 Results Demonstrated Our Consistent Progress and Solid Growth in 2019 Q3 Q3 2018 2019 Pipeline EBITDA DCF (Continuing (Continuing Q3’18 Throughputs Operations) Operations) Q3’19 Debt-to- Debt-to- EBITDA EBITDA 4.52X2 3.96X2 1 - Please see Appendix for reconciliations of n
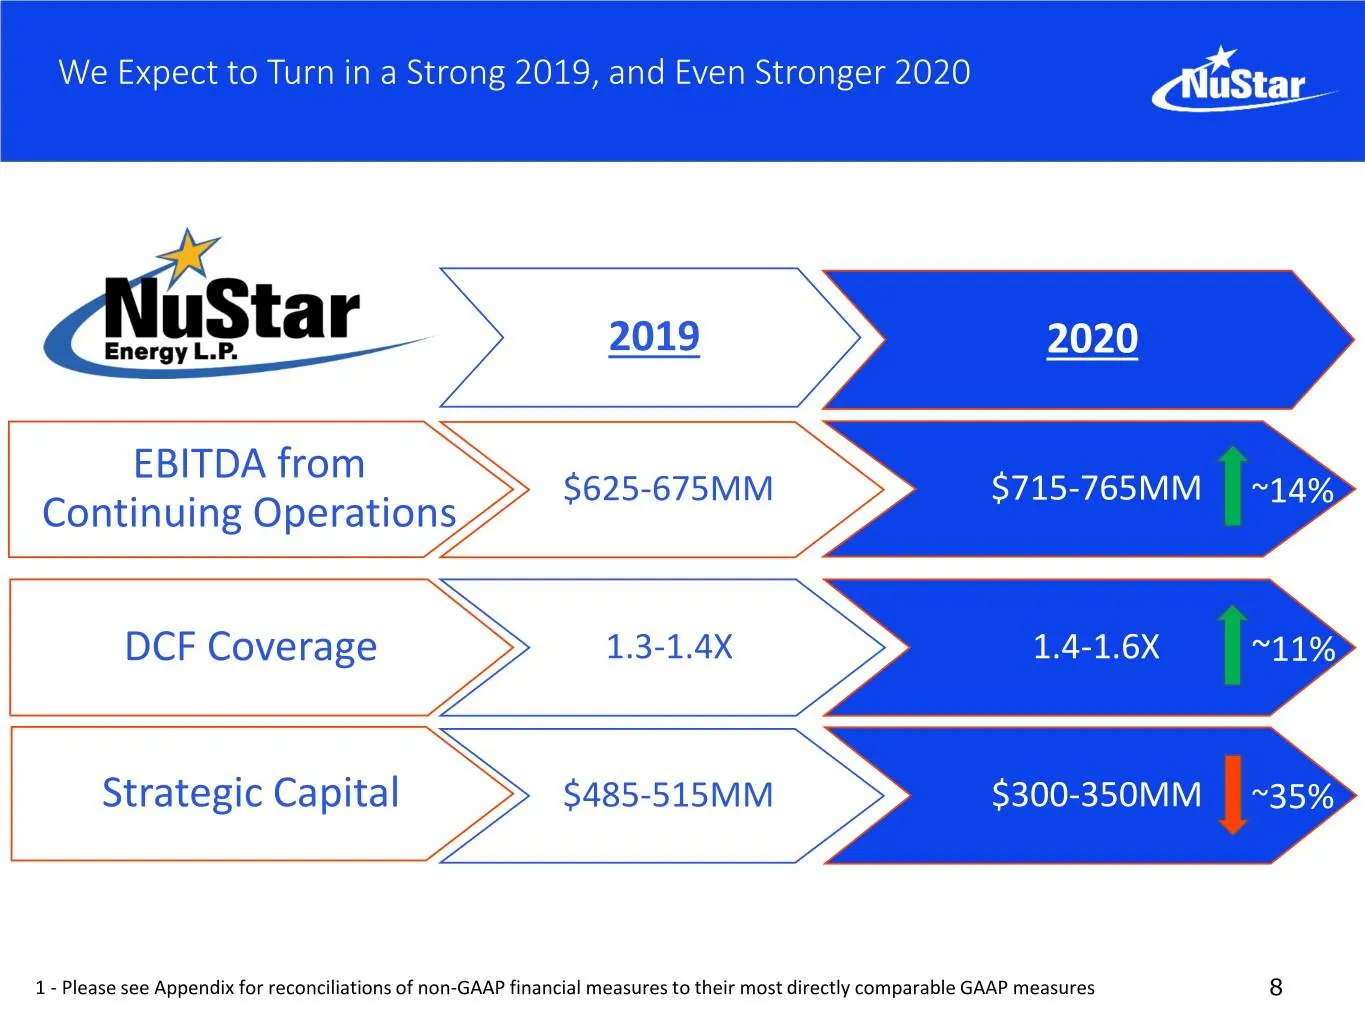
Slide 8: Strong 2019 and Even Stronger 2020 Expected
We Expect to Turn in a Strong 2019, and Even Stronger 2020 2019 2020 EBITDA from $625-675MM $715-765MM Continuing Operations ~14% DCF Coverage 1.3-1.4X 1.4-1.6X ~11% Strategic Capital $485-515MM $300-350MM ~35% 1 - Please see Appendix for reconciliations of non-GAAP financial measures to their most
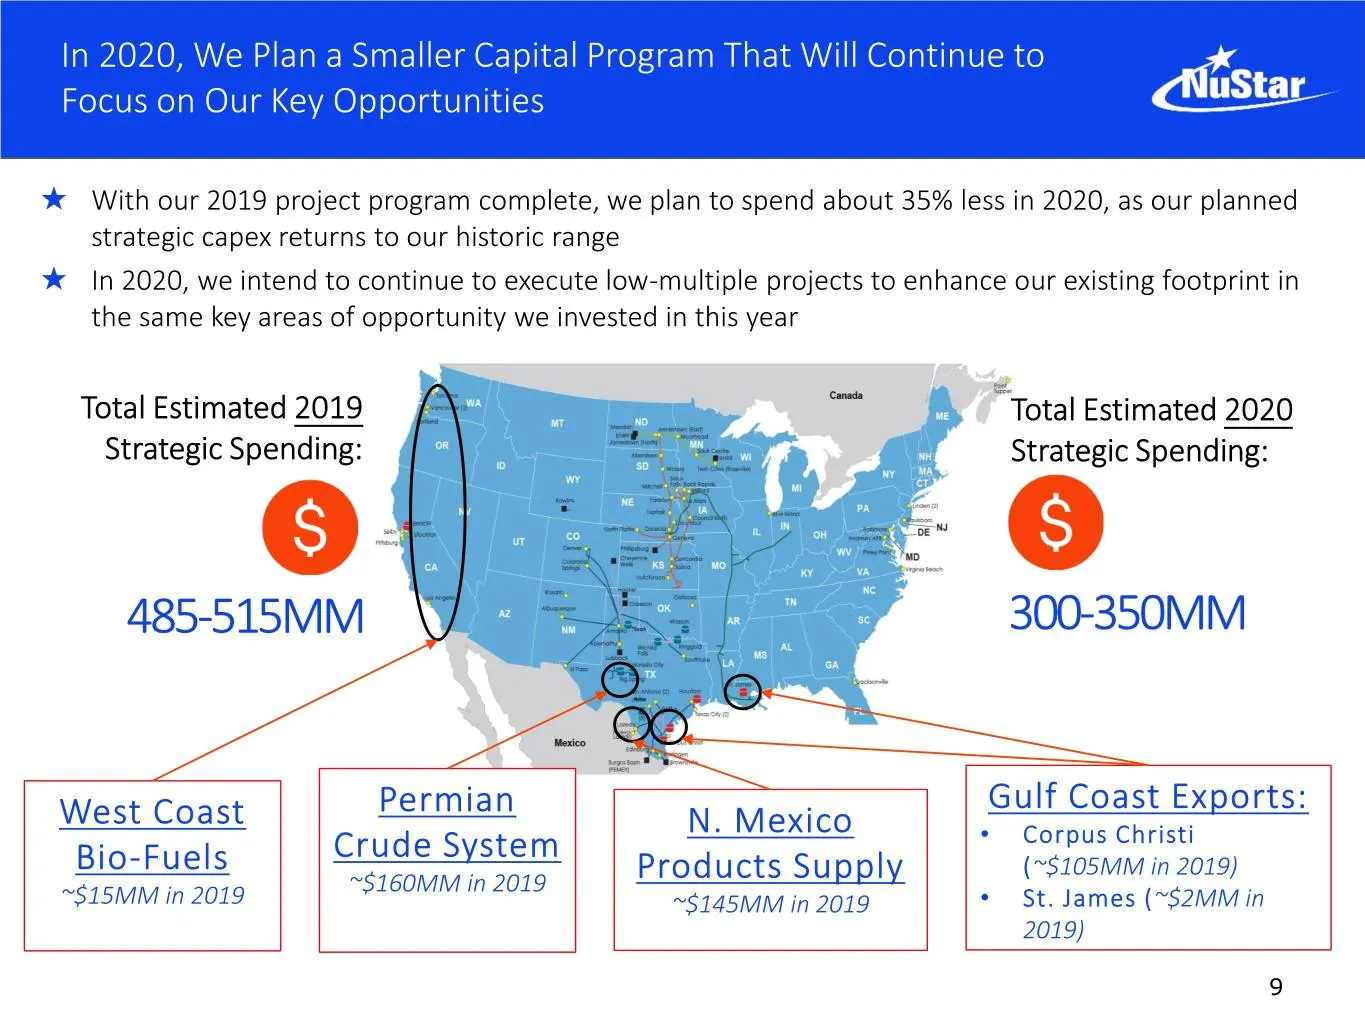
Slide 9: In 2020, We Plan a Smaller Capital Program
In 2020, We Plan a Smaller Capital Program That Will Continue to Focus on Our Key Opportunities ★ With our 2019 project program complete, we plan to spend about 35% less in 2020, as our planned strategic capex returns to our historic range ★ In 2020, we intend to continue to execute low-multiple pro
Slide 10: Permian Crude System
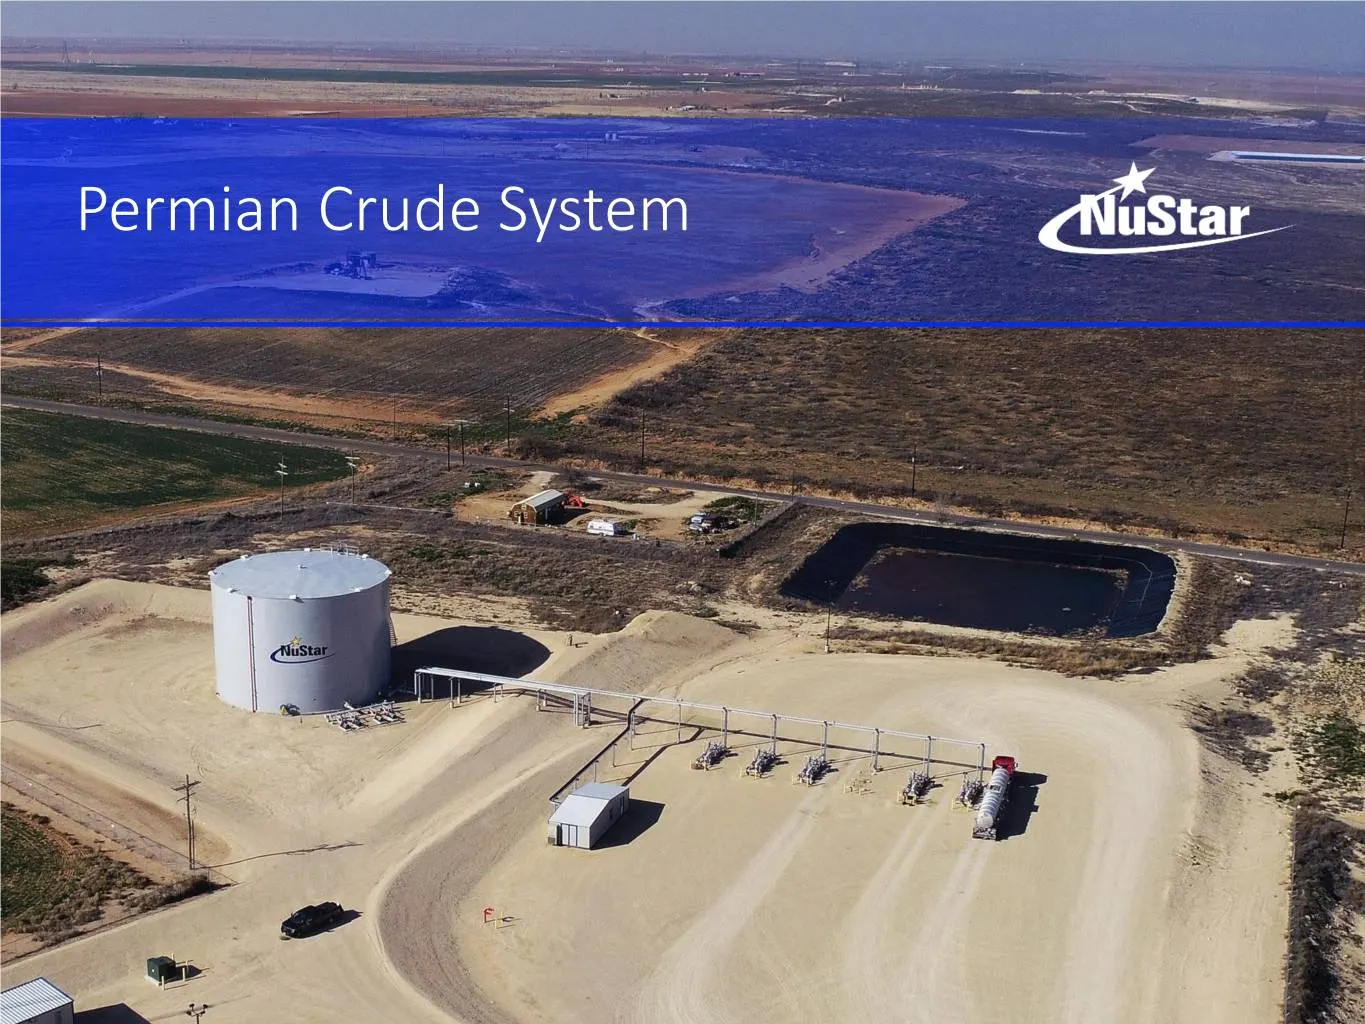
Permian Crude System
Slide 11: U.S. is Now the Global Leader in Crude Production
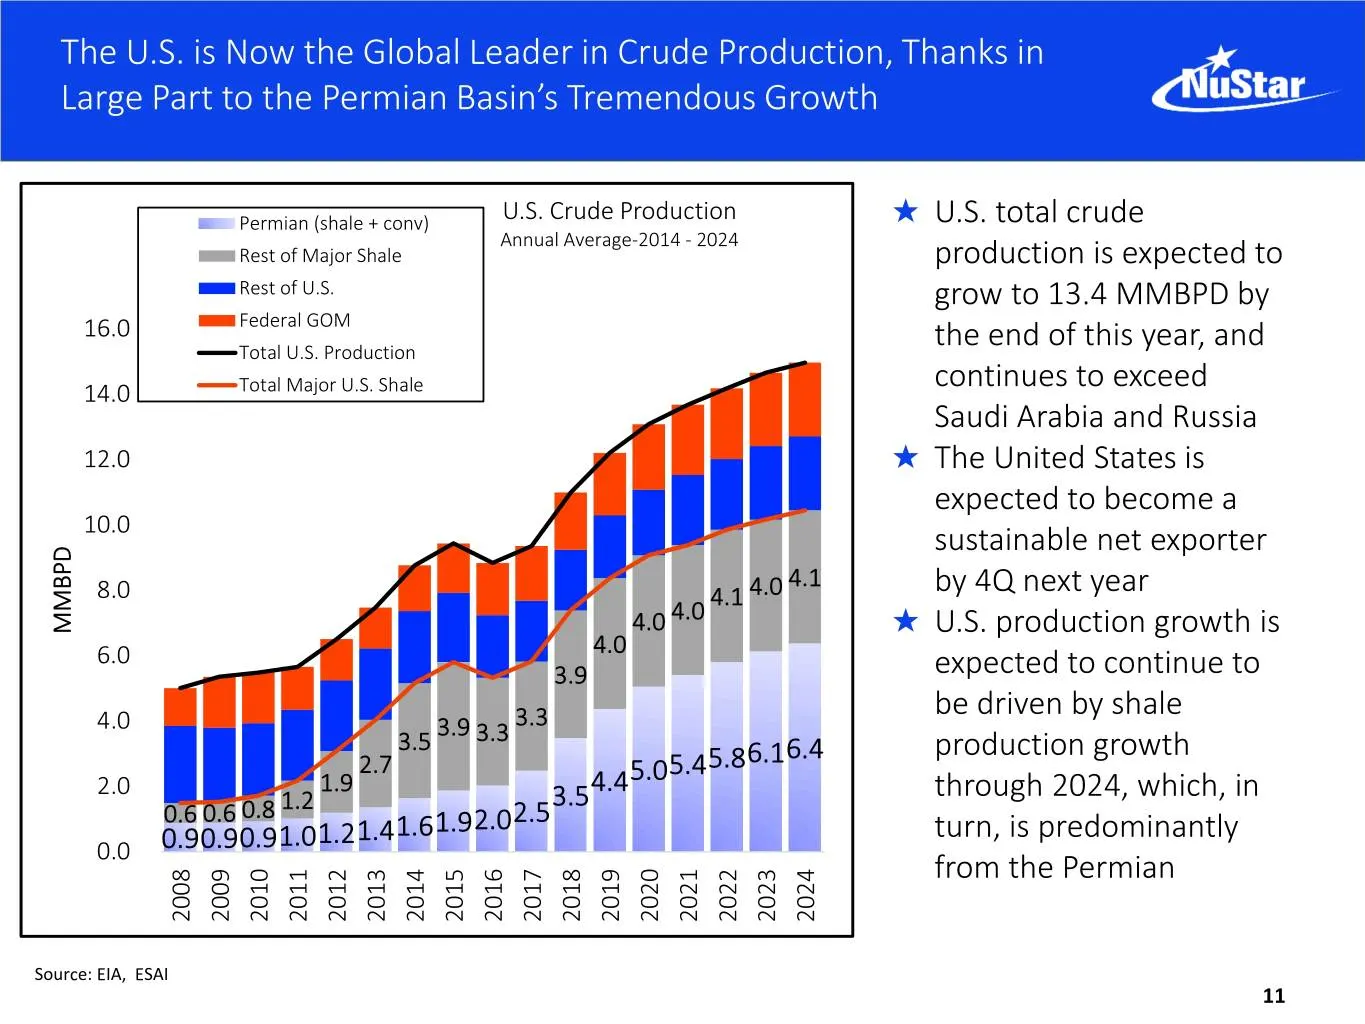
The U.S. is Now the Global Leader in Crude Production, Thanks in Large Part to the Permian Basin’s Tremendous Growth Permian (shale + conv) U.S. Crude Production ★ U.S. total crude Annual Average-2014 - 2024 Rest of Major Shale production is expected to Rest of U.S. grow to 13.4 MMBPD by 16.0 Federa
Slide 12: Permian Expected to Drive Lion's Share of U.S. Shale Growth
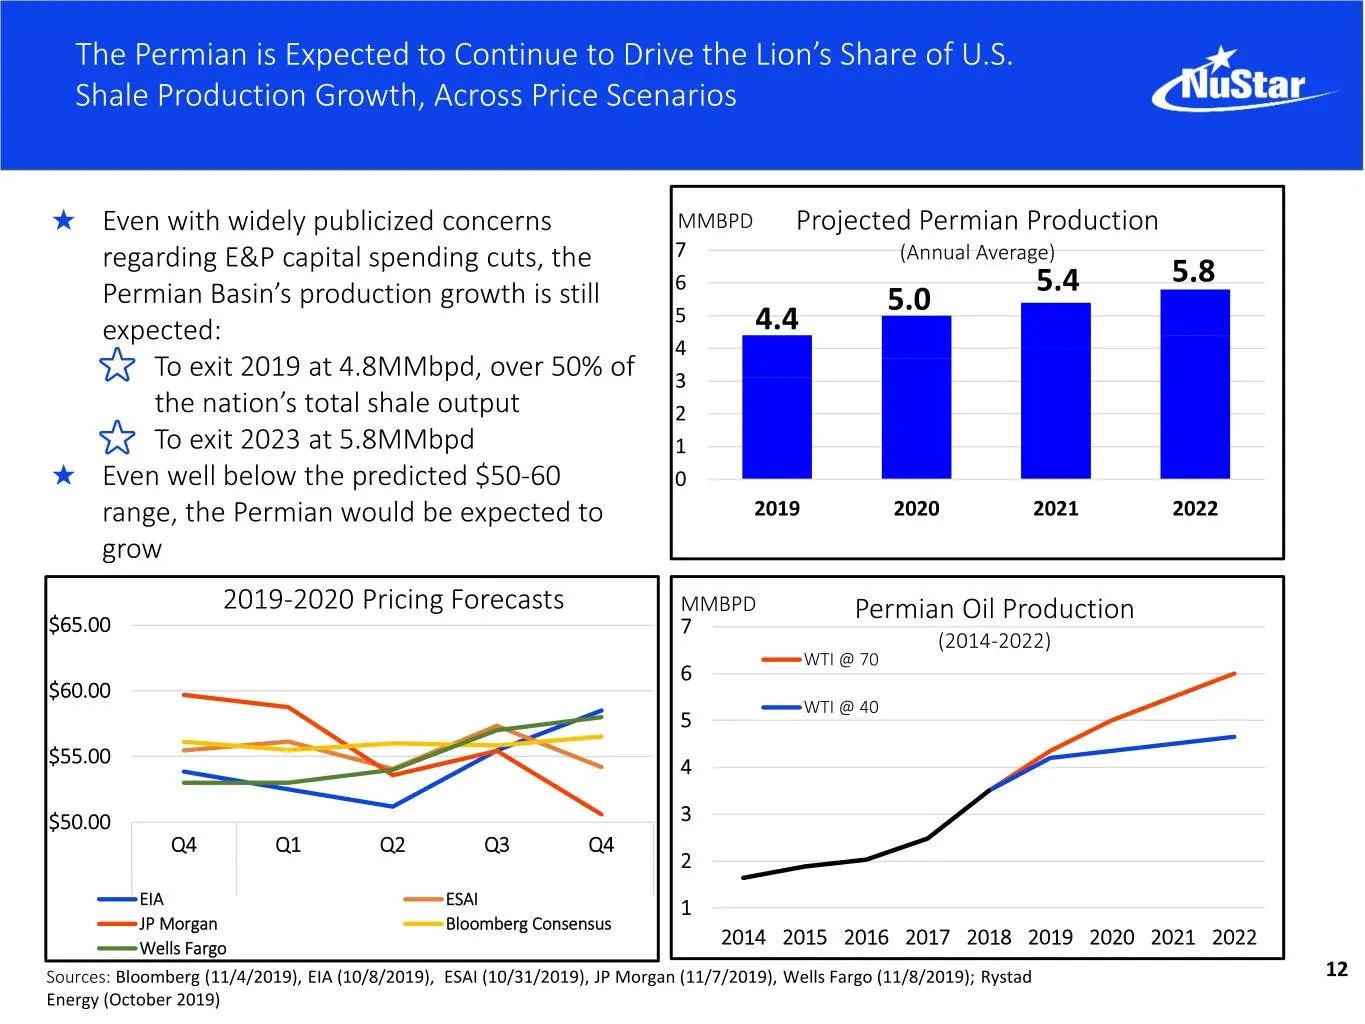
The Permian is Expected to Continue to Drive the Lion’s Share of U.S. Shale Production Growth, Across Price Scenarios ★ Even with widely publicized concerns MMBPD Projected Permian Production regarding E&P capital spending cuts, the 7 (Annual Average) 6 5.4 5.8 Permian Basin’s production growth is s
Slide 13: Despite Declining Rig Counts, Permian Production Growth Remains Robust
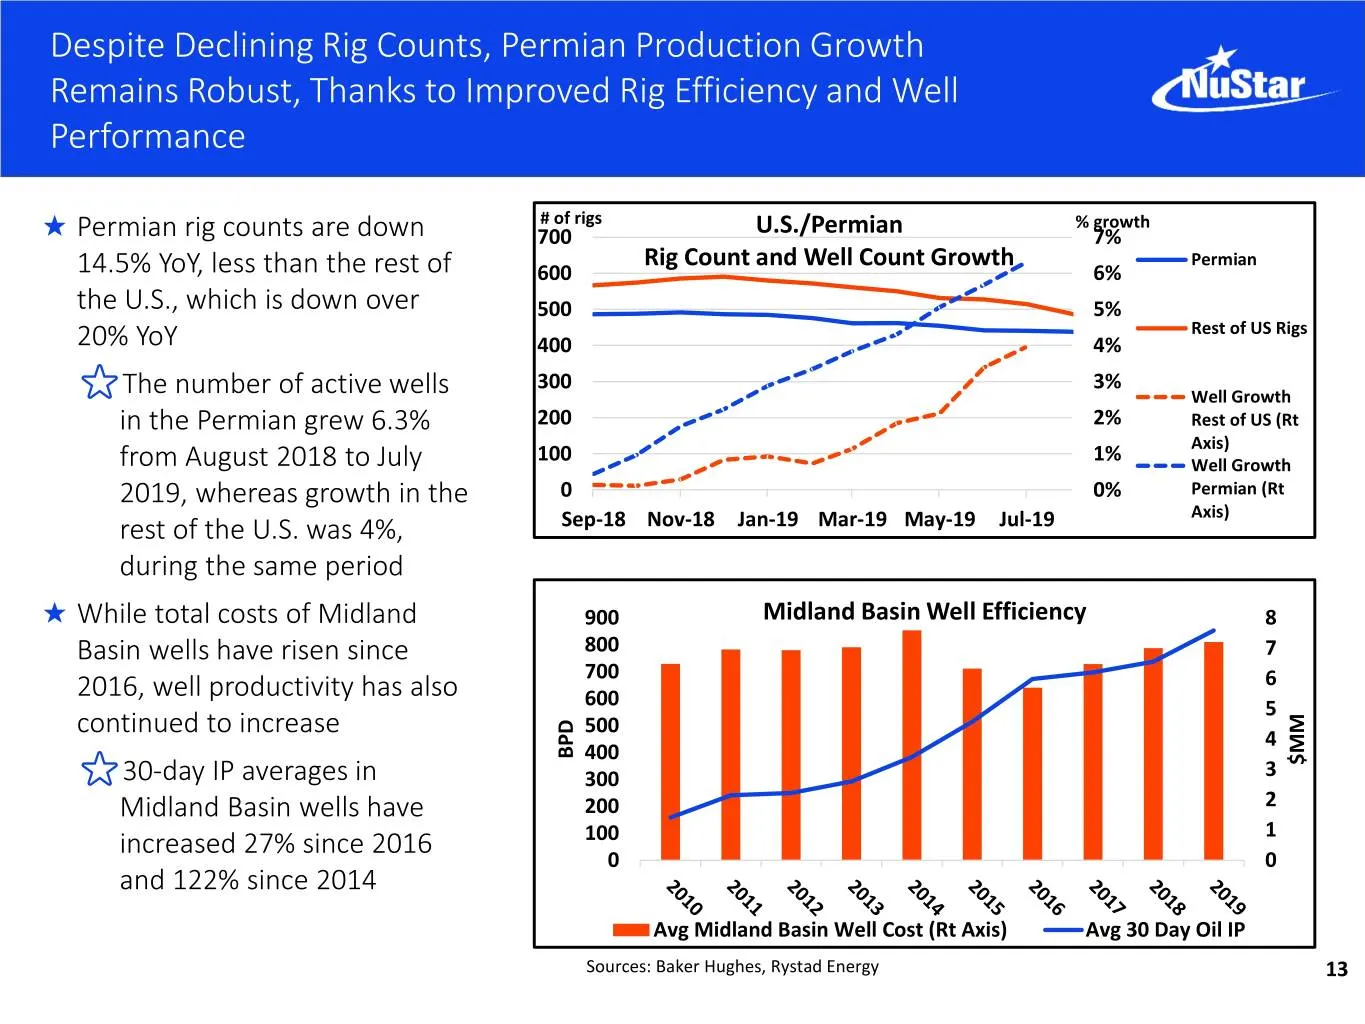
Despite Declining Rig Counts, Permian Production Growth Remains Robust, Thanks to Improved Rig Efficiency and Well Performance # of rigs % growth ★ Permian rig counts are down 700 U.S./Permian 7% Rig Count and Well Count Growth Permian 14.5% YoY, less than the rest of 600 6% the U.S., which is down
Slide 14: Our System Continues to Outpace the Permian Basin
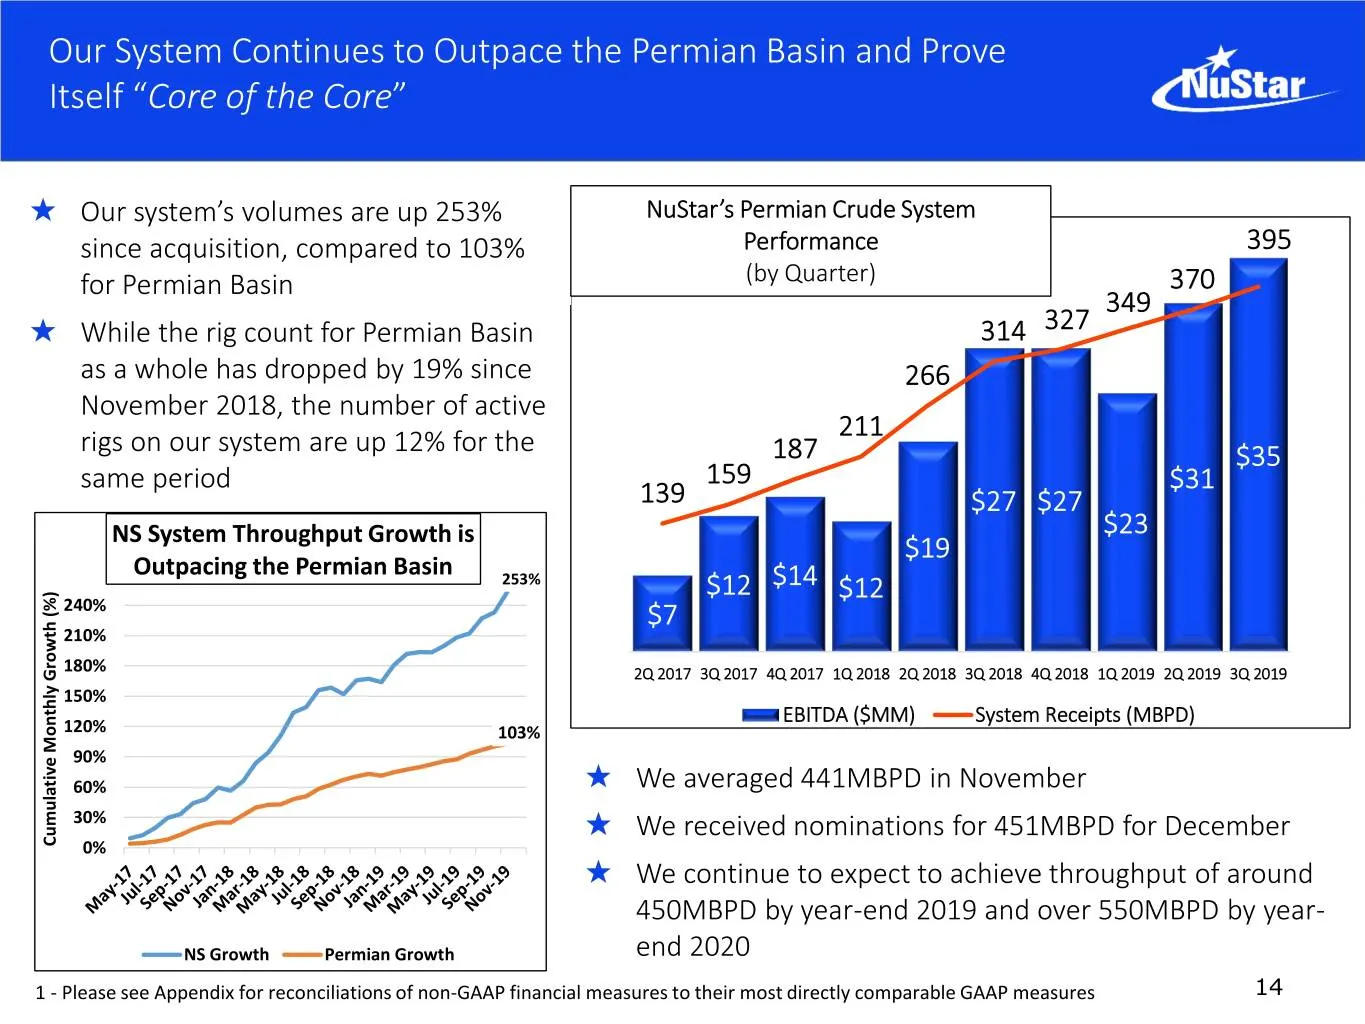
Our System Continues to Outpace the Permian Basin and Prove Itself “Core of the Core” ★ Our system’s volumes are up 253% NuStar’s Permian Crude System Performance 395 450 since acquisition, compared to 103% $35 for Permian Basin (by Quarter) 370 400 $30 349 ★ While the rig count for Permian Basin 31
Slide 15: Diversity of Our Customer Slate in the Permian
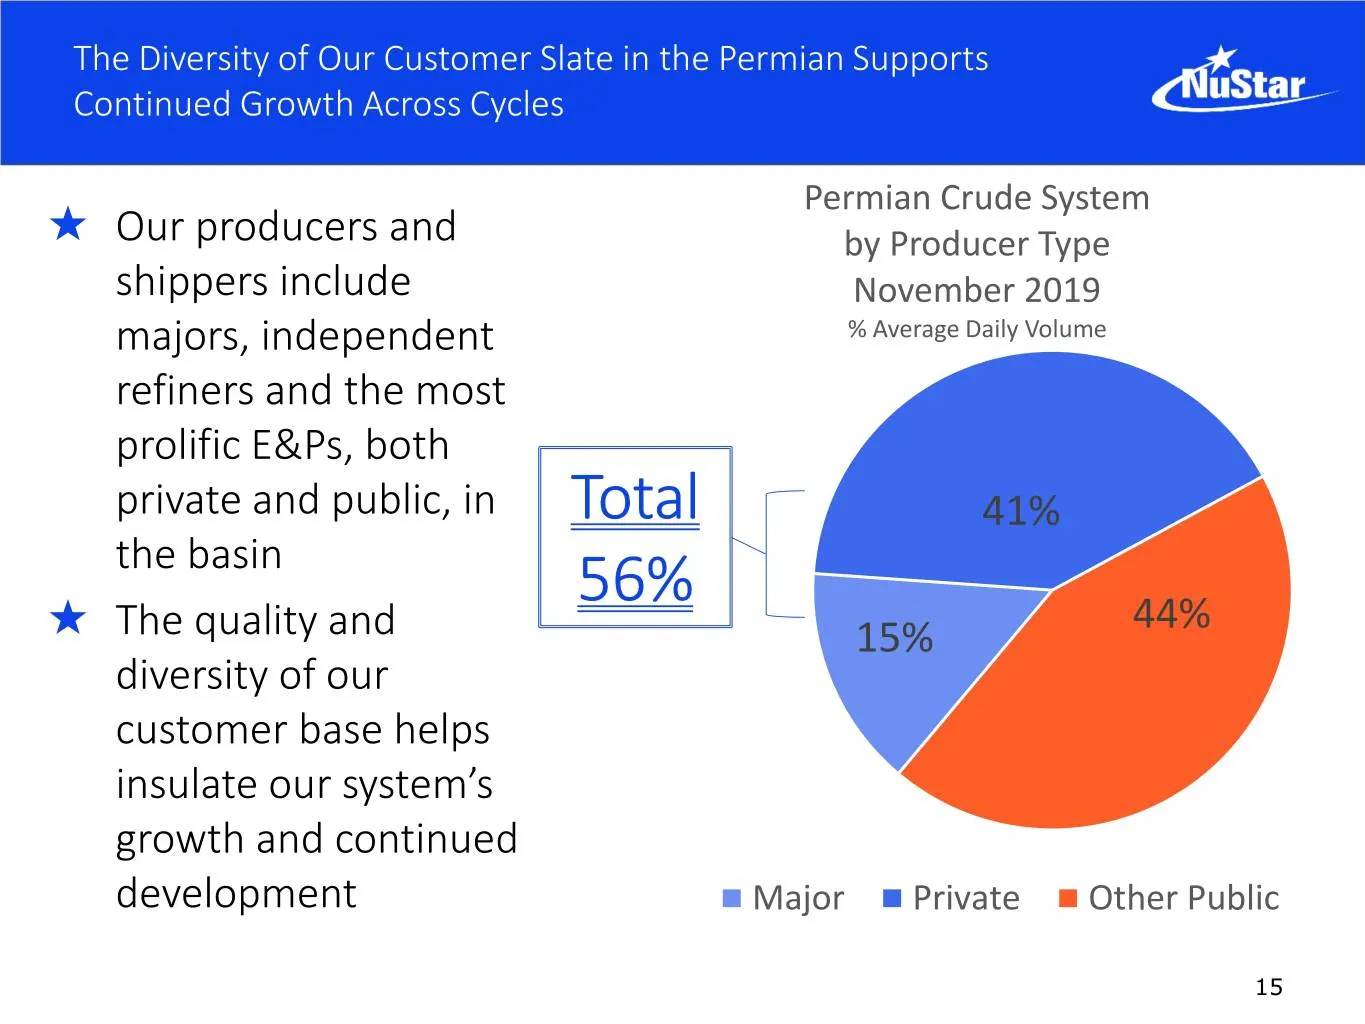
The Diversity of Our Customer Slate in the Permian Supports Continued Growth Across Cycles Permian Crude System ★ Our producers and by Producer Type shippers include November 2019 majors, independent % Average Daily Volume refiners and the most prolific E&Ps, both private and public, in Total 41% th
Slide 16: Continue to Expand and Connect Our Permian Crude System
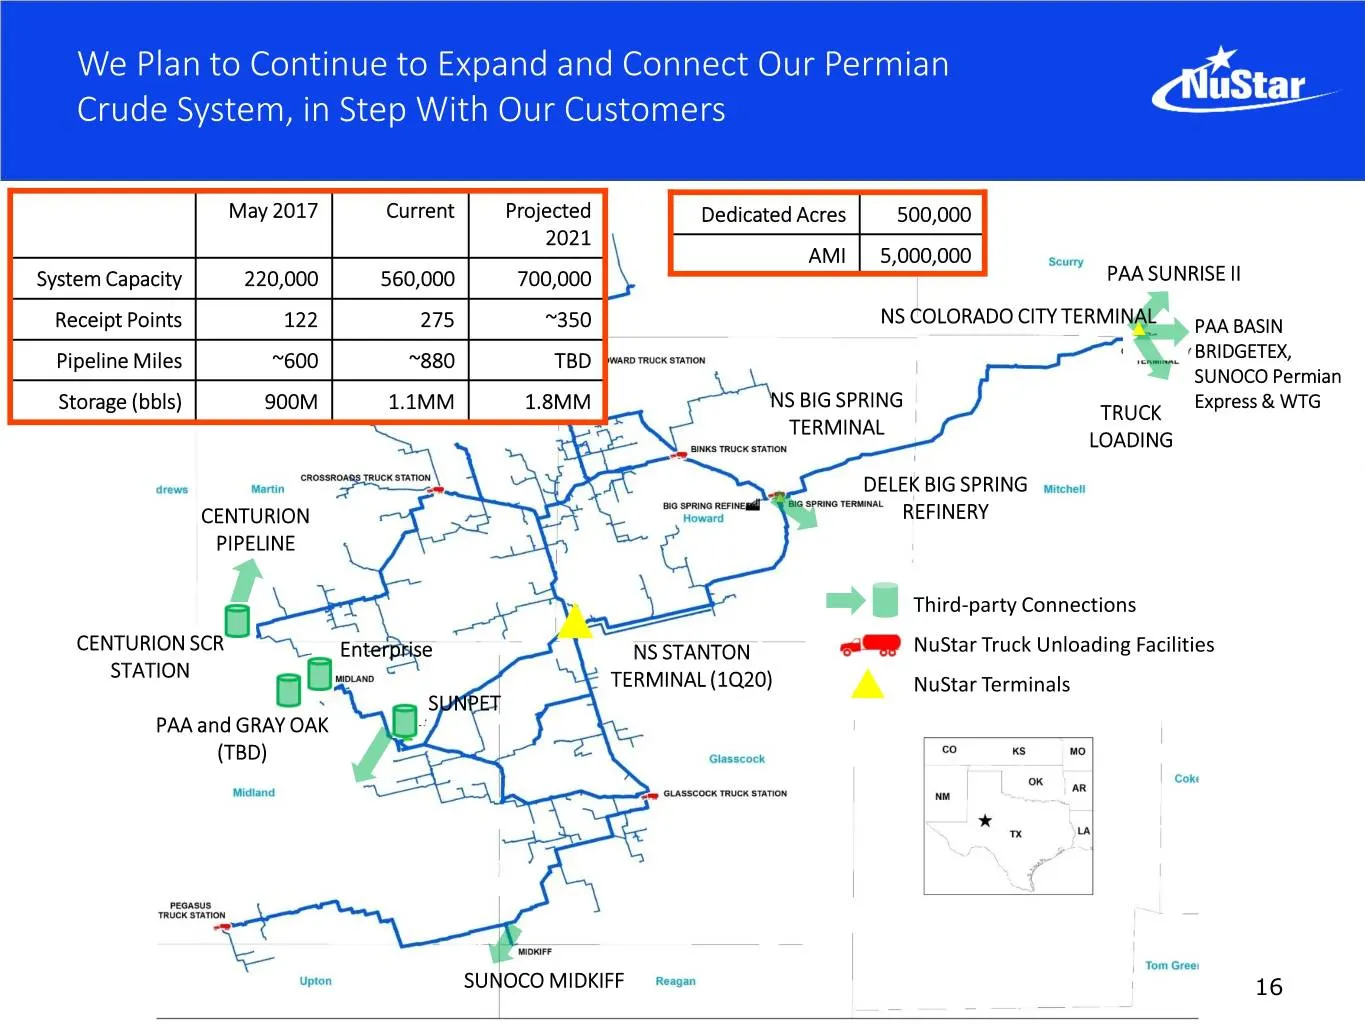
We Plan to Continue to Expand and Connect Our Permian Crude System, in Step With Our Customers May 2017 Current Projected Dedicated Acres 500,000 2021 AMI 5,000,000 System Capacity 220,000 560,000 700,000 PAA SUNRISE II Receipt Points 122 275 ~350 NS COLORADO CITY TERMINAL PAA BASIN Pipeline Miles ~
Slide 17: Gulf Coast Exports: Corpus Christi & St. James
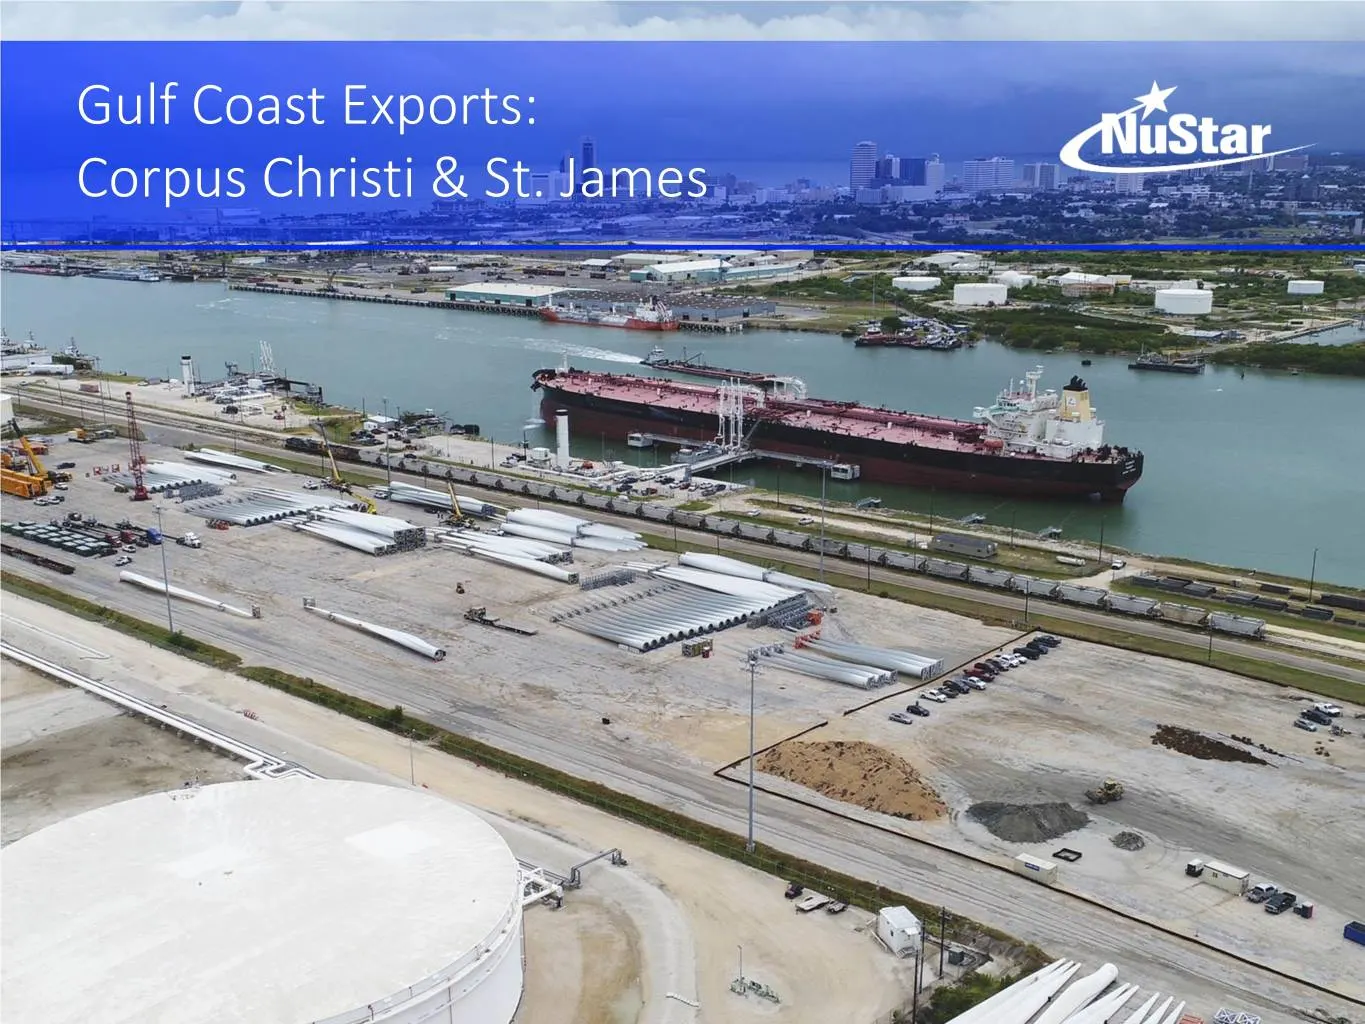
Gulf Coast Exports: ContinuedCorpus Christi Improvement: & St. James Our 2019 Plan
Slide 18: U.S. Crude Exports Expected to Ramp Dramatically
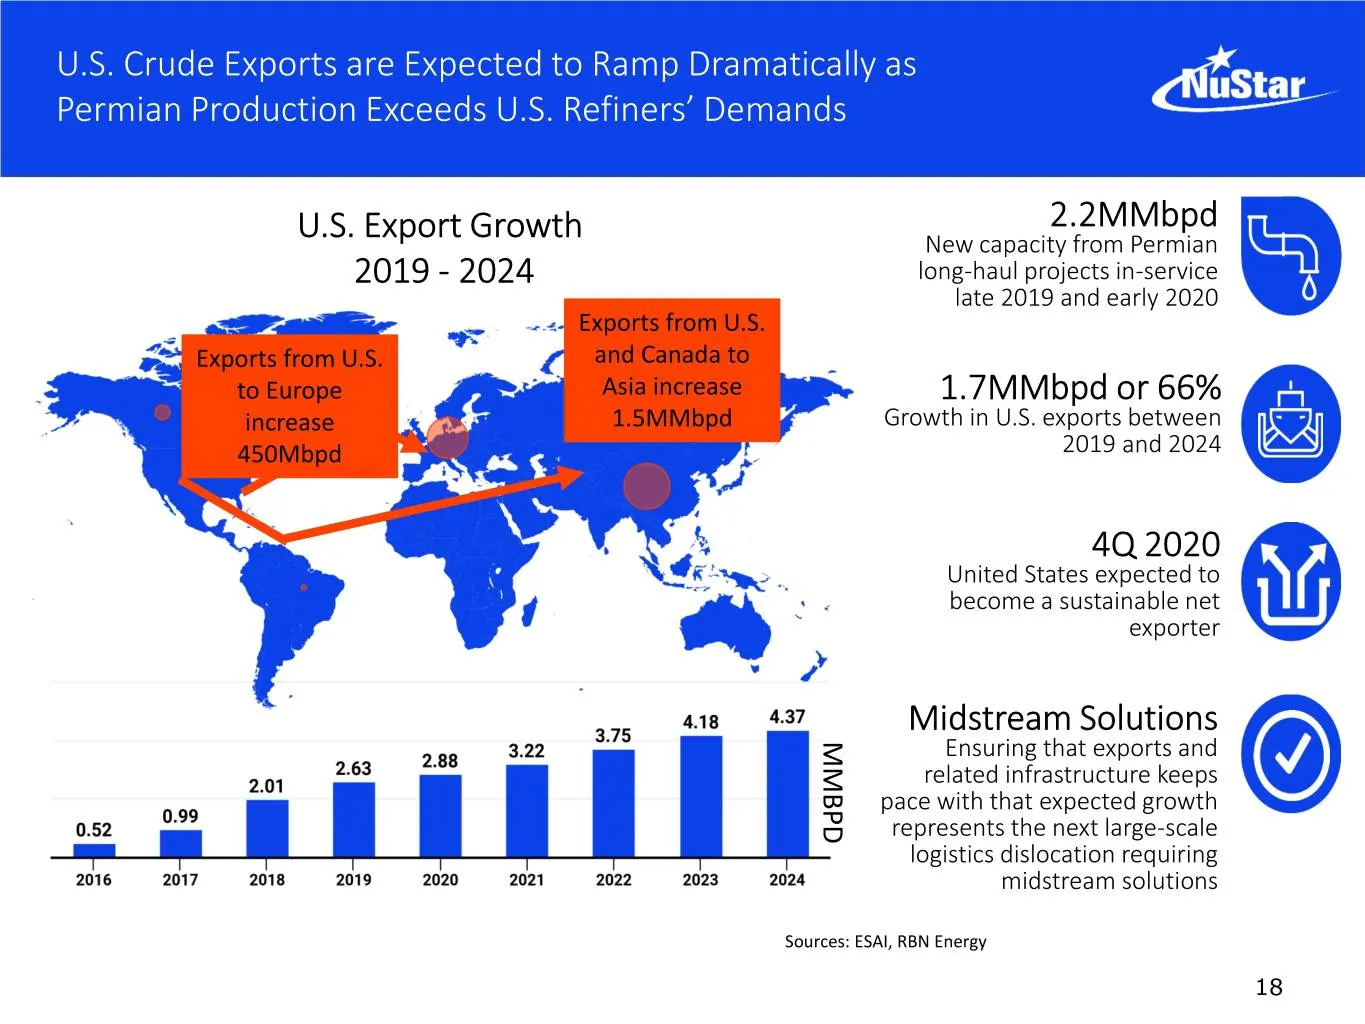
U.S. Crude Exports are Expected to Ramp Dramatically as Permian Production Exceeds U.S. Refiners’ Demands 2.2MMbpd U.S. Export Growth New capacity from Permian 2019 - 2024 long-haul projects in-service late 2019 and early 2020 Exports from U.S. Exports from U.S. and Canada to to Europe Asia increase
Slide 19: Port of Corpus Christi Expected to Become Largest U.S. Crude Export Hub
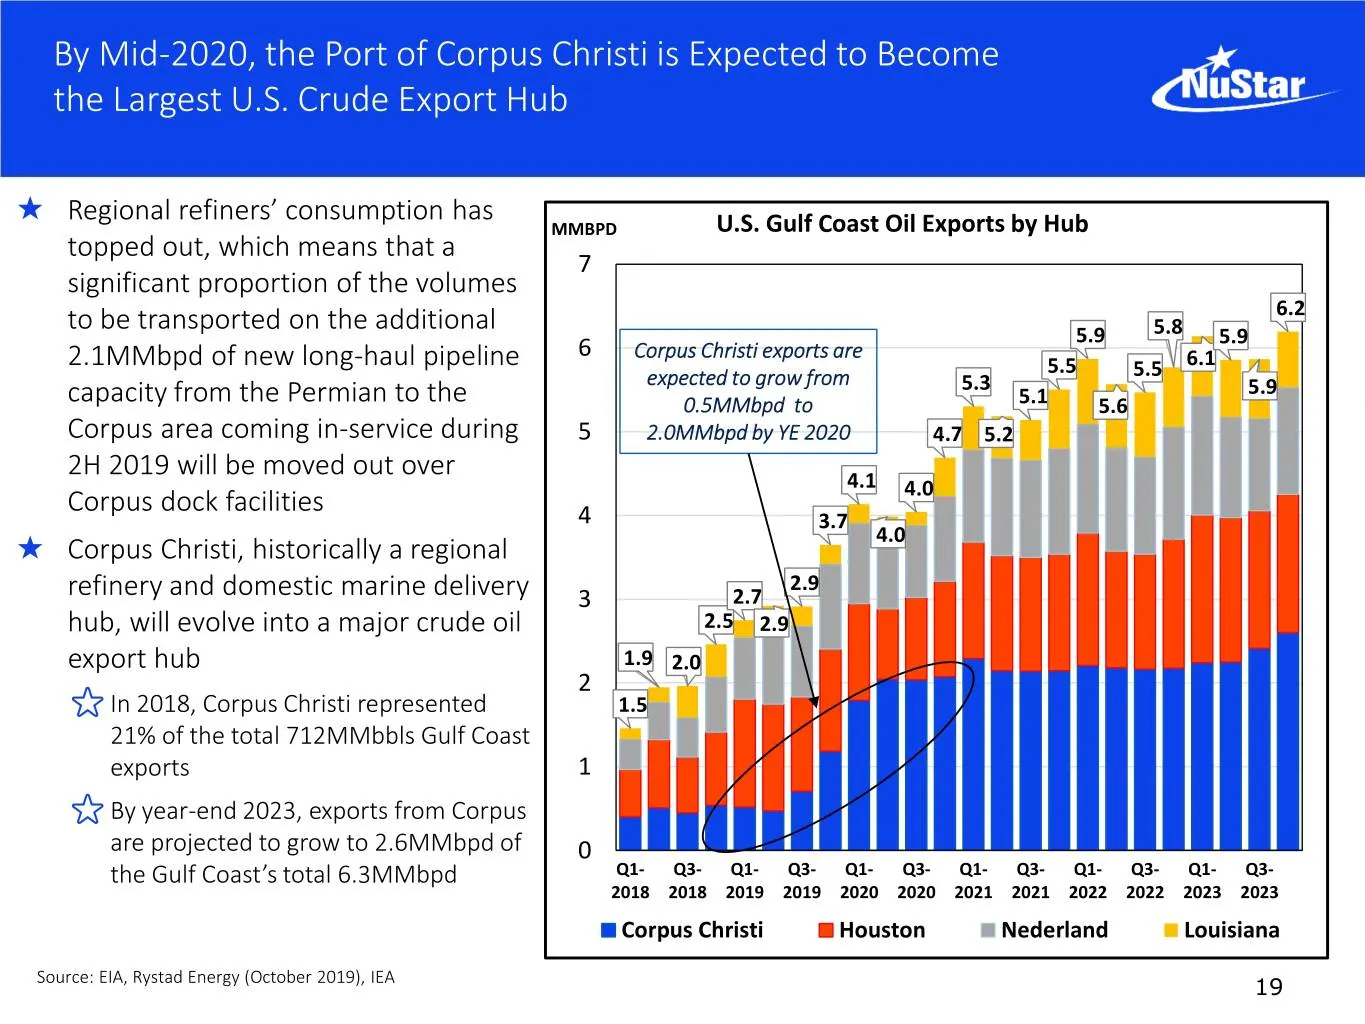
By Mid-2020, the Port of Corpus Christi is Expected to Become the Largest U.S. Crude Export Hub ★ Regional refiners’ consumption has MMBPD U.S. Gulf Coast Oil Exports by Hub topped out, which means that a 7 significant proportion of the volumes to be transported on the additional 6.2 5.9 5.8 5.9 6 C
Slide 20: Expanded Existing South Texas Assets to Export Permian Barrels for Trafigura
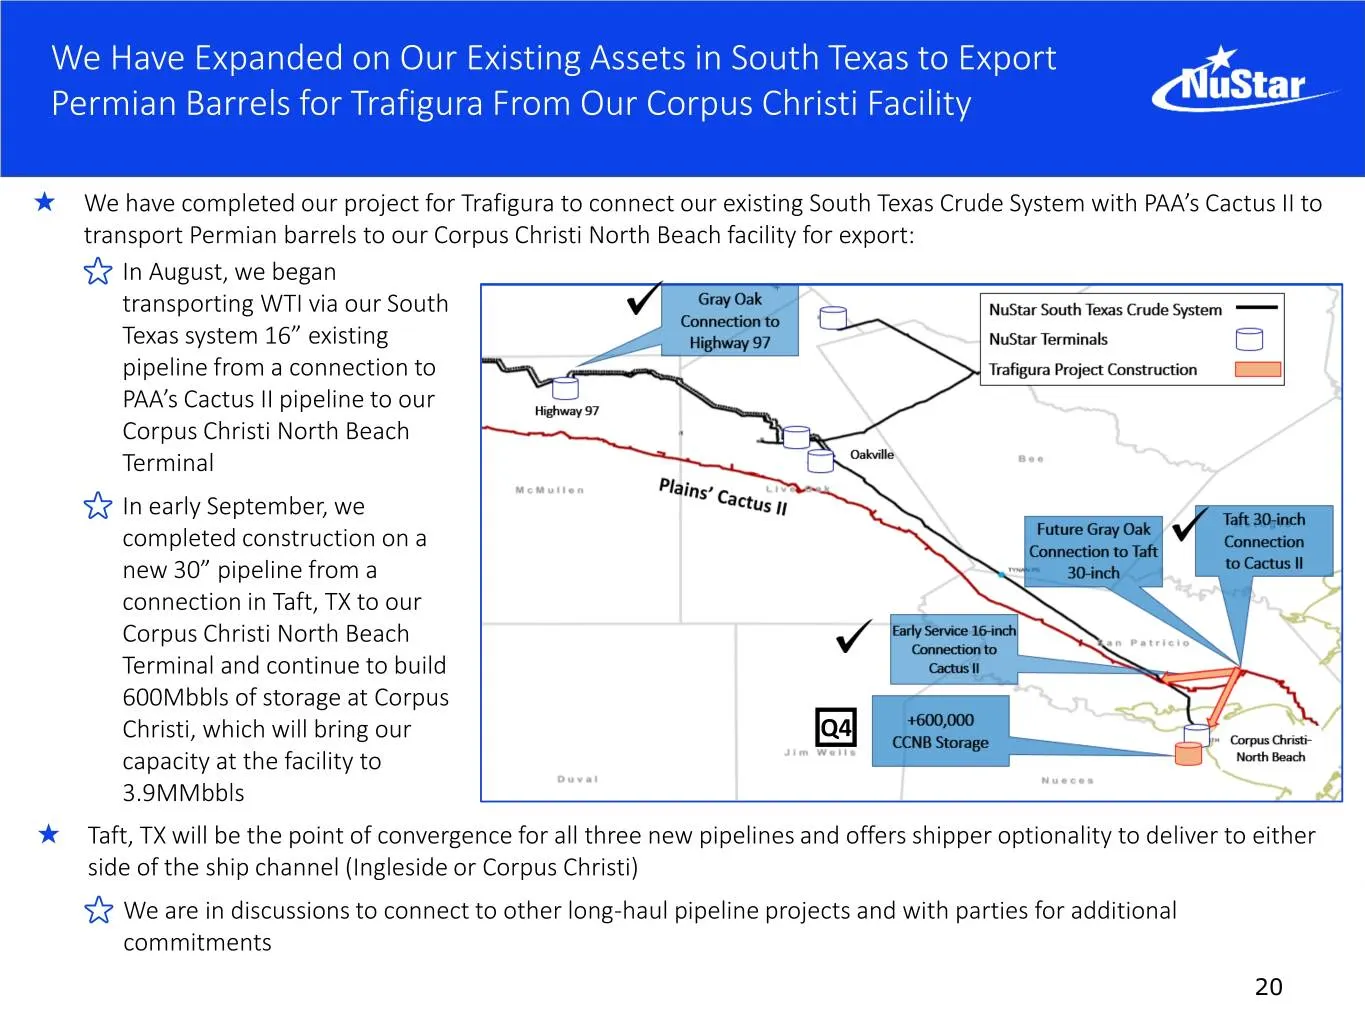
We Have Expanded on Our Existing Assets in South Texas to Export Permian Barrels for Trafigura From Our Corpus Christi Facility ★ We have completed our project for Trafigura to connect our existing South Texas Crude System with PAA’s Cactus II to transport Permian barrels to our Corpus Christi North
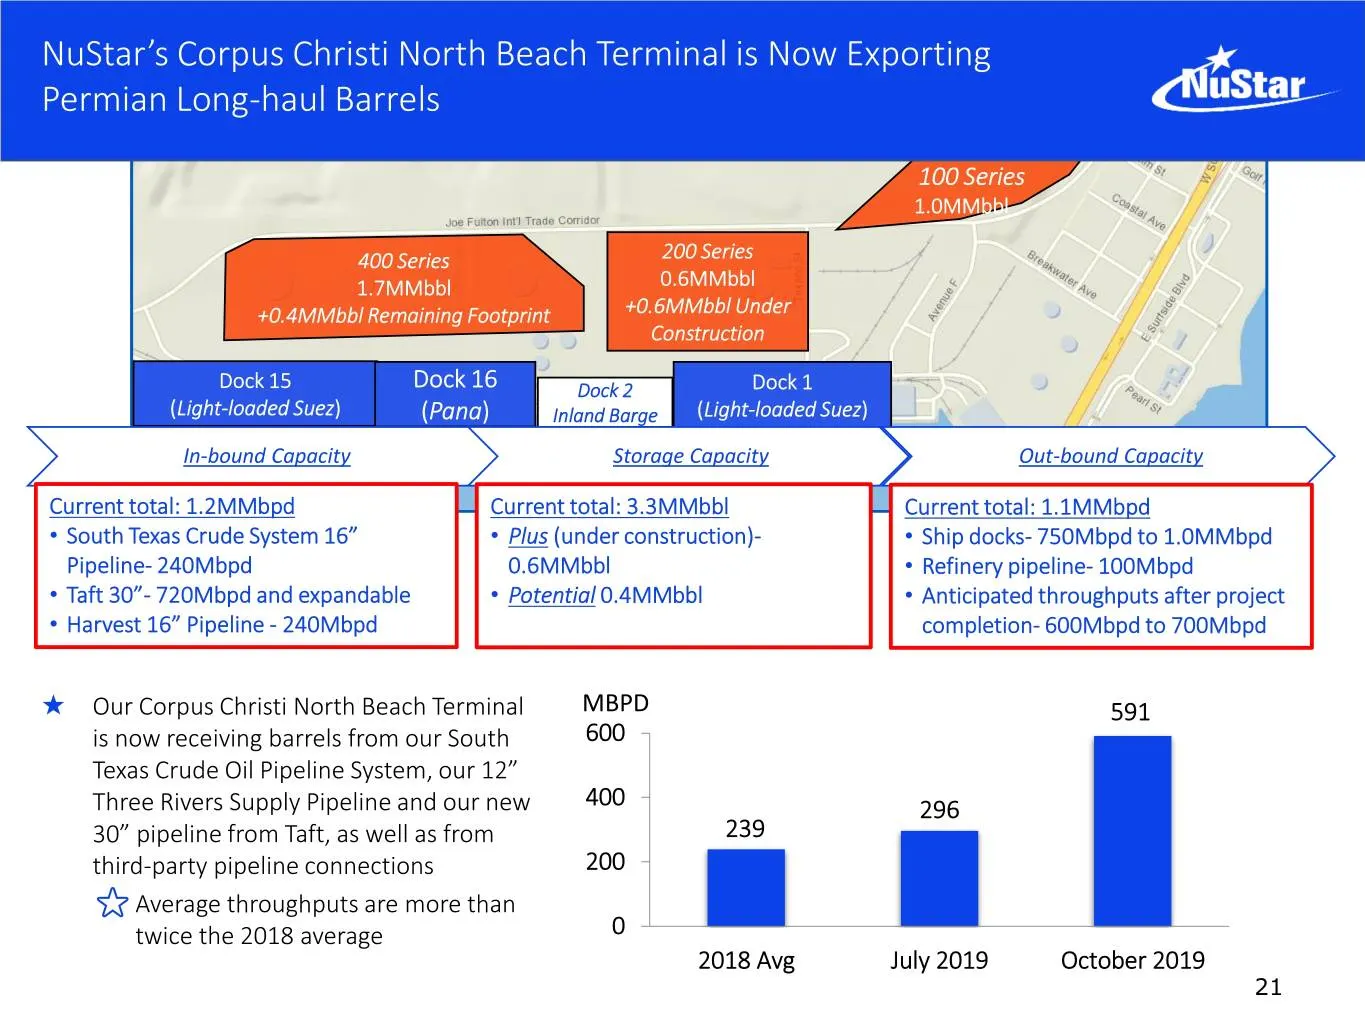
Slide 21: Corpus Christi North Beach Terminal Now Exporting Permian Barrels
NuStar’s Corpus Christi North Beach Terminal is Now Exporting Permian Long-haul Barrels 100 Series 1.0MMbbl 400 Series 200 Series 1.7MMbbl 0.6MMbbl +0.4MMbbl Remaining Footprint +0.6MMbbl Under Construction Dock 15 Dock 16 Dock 2 Dock 1 (Light-loaded Suez) (Pana) Inland Barge (Light-loaded Suez) In-
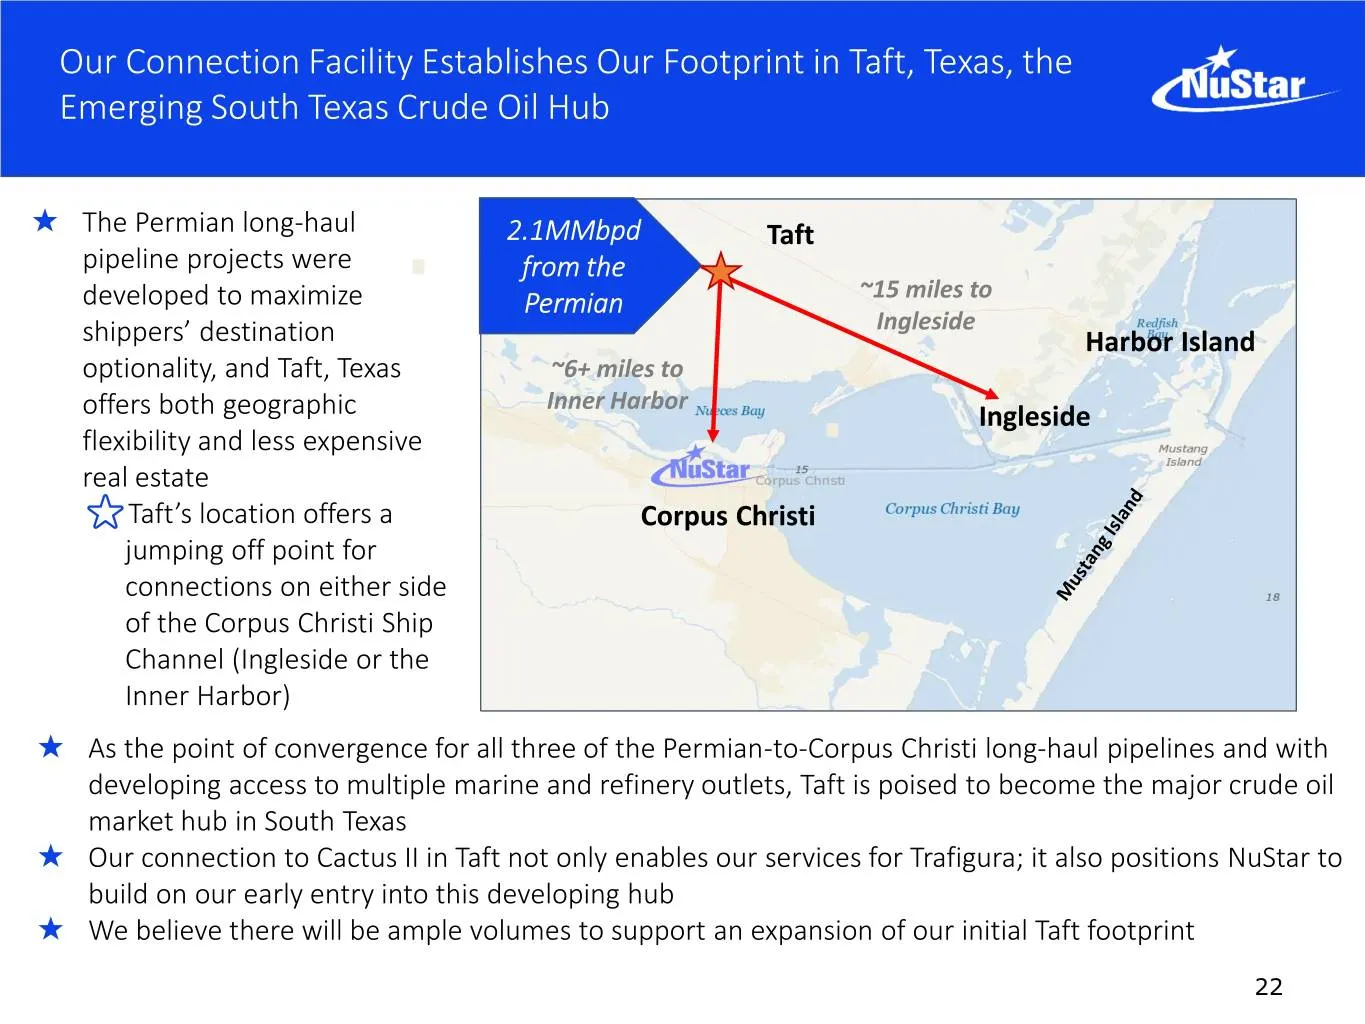
Slide 22: Taft, Texas, the Emerging South Texas Crude Oil Hub
Our Connection Facility Establishes Our Footprint in Taft, Texas, the Emerging South Texas Crude Oil Hub ★ The Permian long-haul 2.1MMbpd Taft pipeline projects were from the developed to maximize Permian ~15 miles to Ingleside shippers’ destination Harbor Island optionality, and Taft, Texas ~6+ mil
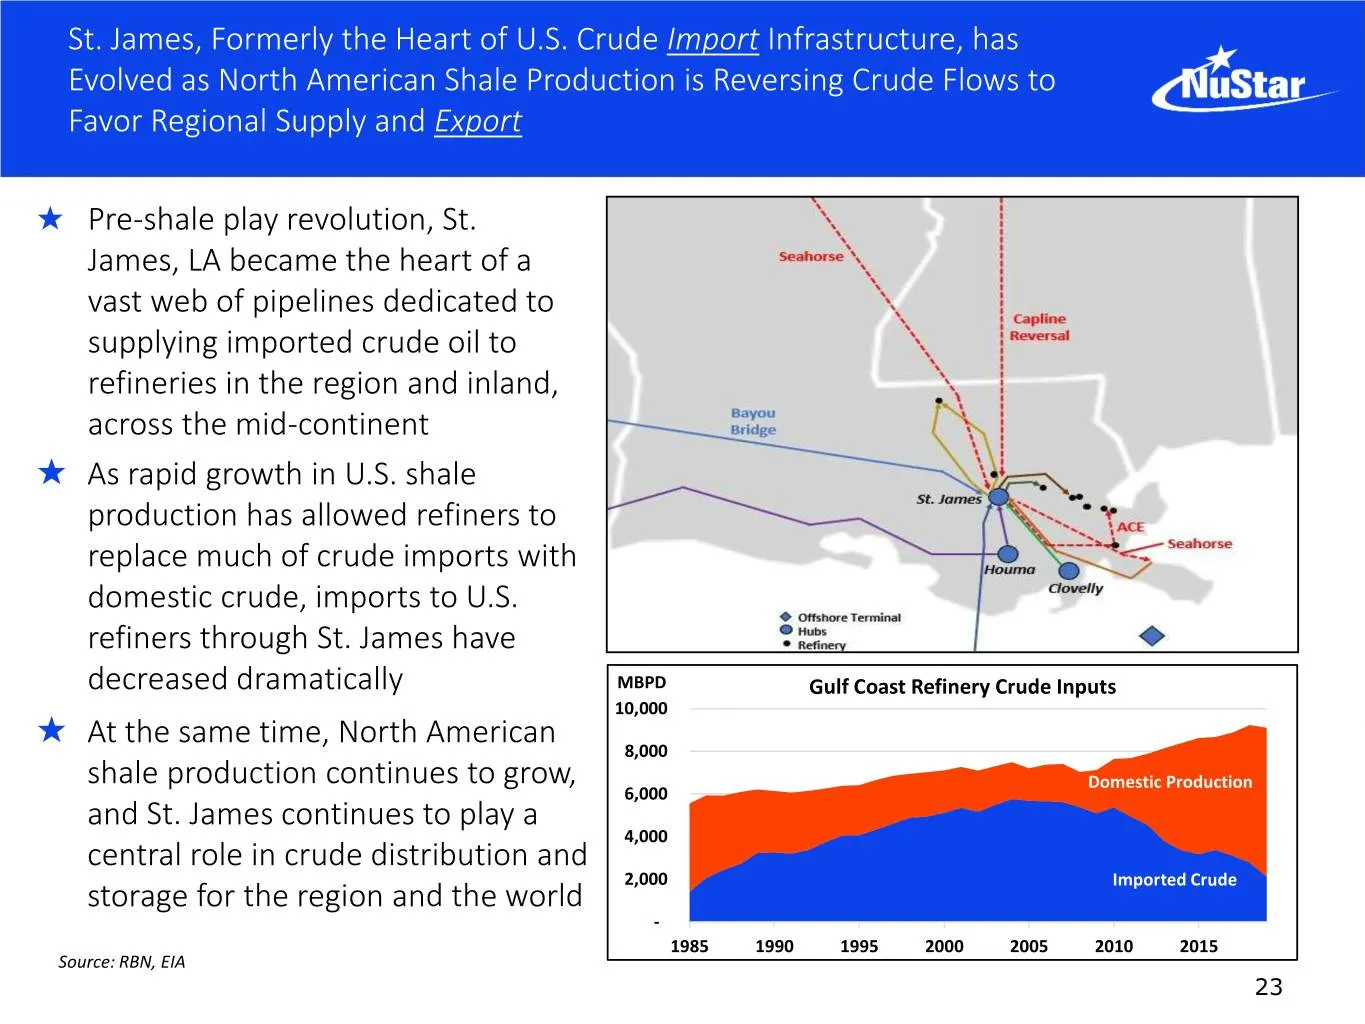
Slide 23: St. James Has Evolved as Shale Production Reverses Crude Flows
St. James, Formerly the Heart of U.S. Crude Import Infrastructure, has Evolved as North American Shale Production is Reversing Crude Flows to Favor Regional Supply and Export ★ Pre-shale play revolution, St. James, LA became the heart of a vast web of pipelines dedicated to supplying imported crude
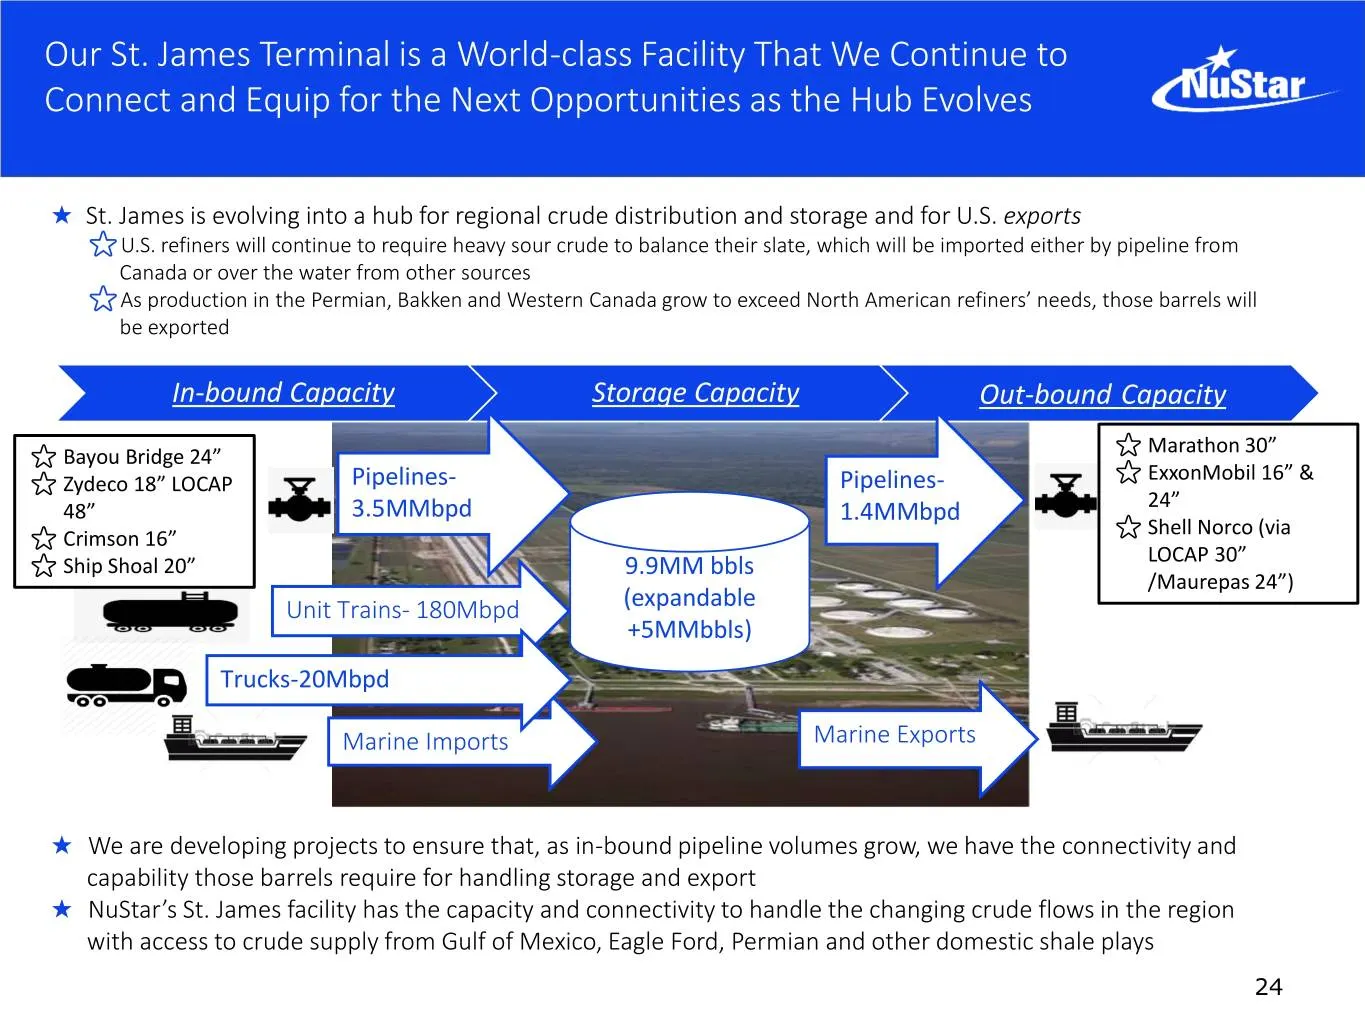
Slide 24: St. James Terminal is a World-class Facility
Our St. James Terminal is a World-class Facility That We Continue to Connect and Equip for the Next Opportunities as the Hub Evolves ★ St. James is evolving into a hub for regional crude distribution and storage and for U.S. exports ⭐U.S. refiners will continue to require heavy sour crude to balance
Slide 25: St. James Benefiting From Price Dislocations and Export Growth
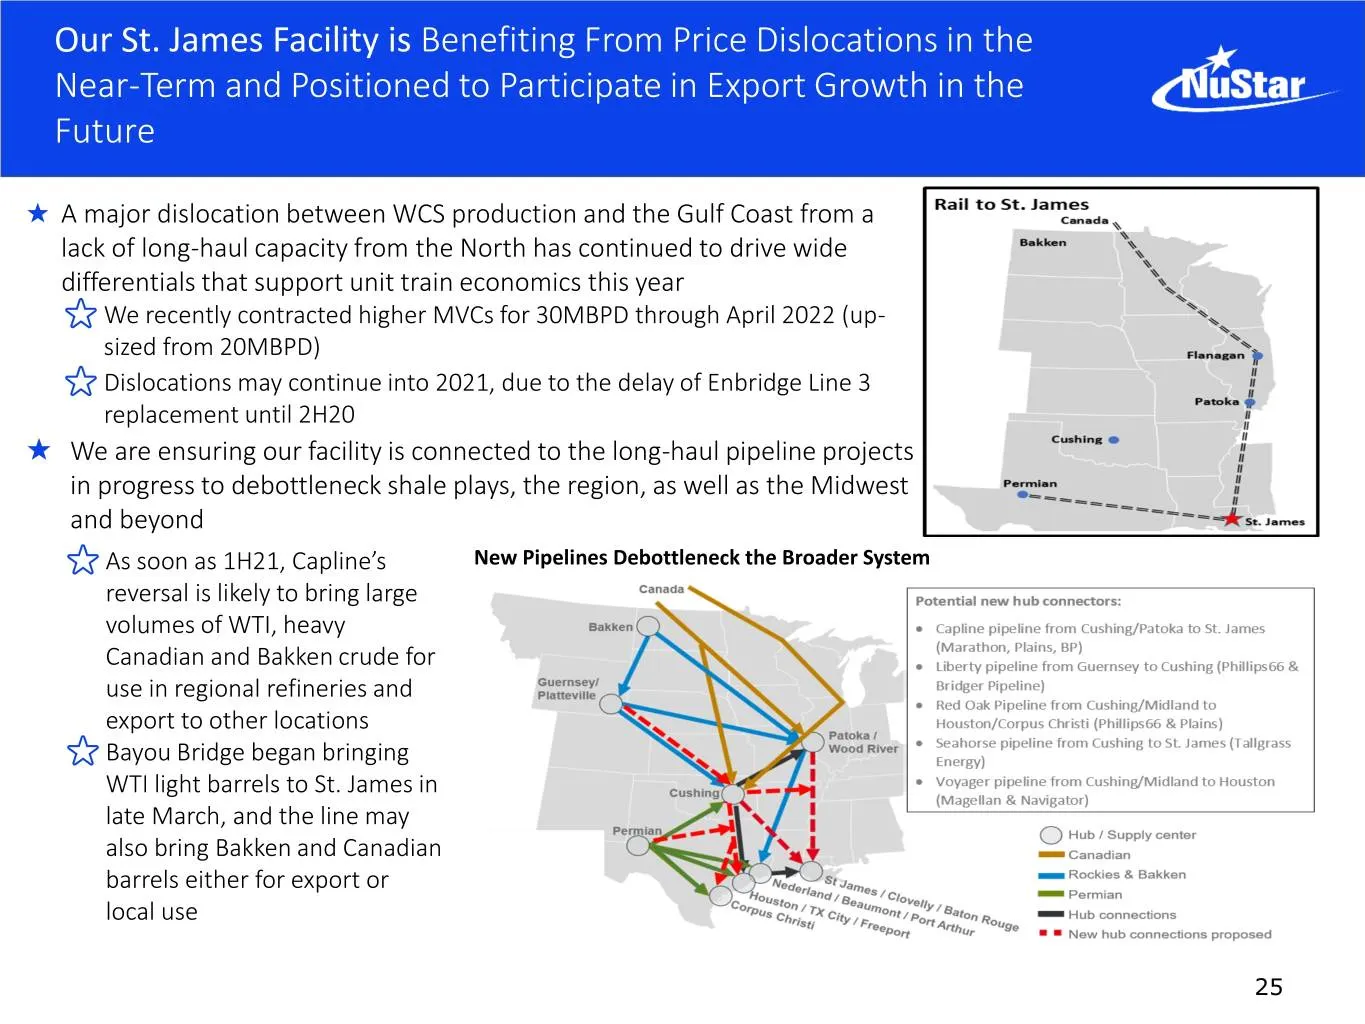
Our St. James Facility is Benefiting From Price Dislocations in the Near-Term and Positioned to Participate in Export Growth in the Future ★ A major dislocation between WCS production and the Gulf Coast from a lack of long-haul capacity from the North has continued to drive wide differentials that s
Slide 26: Northern Mexico Refined Products Supply
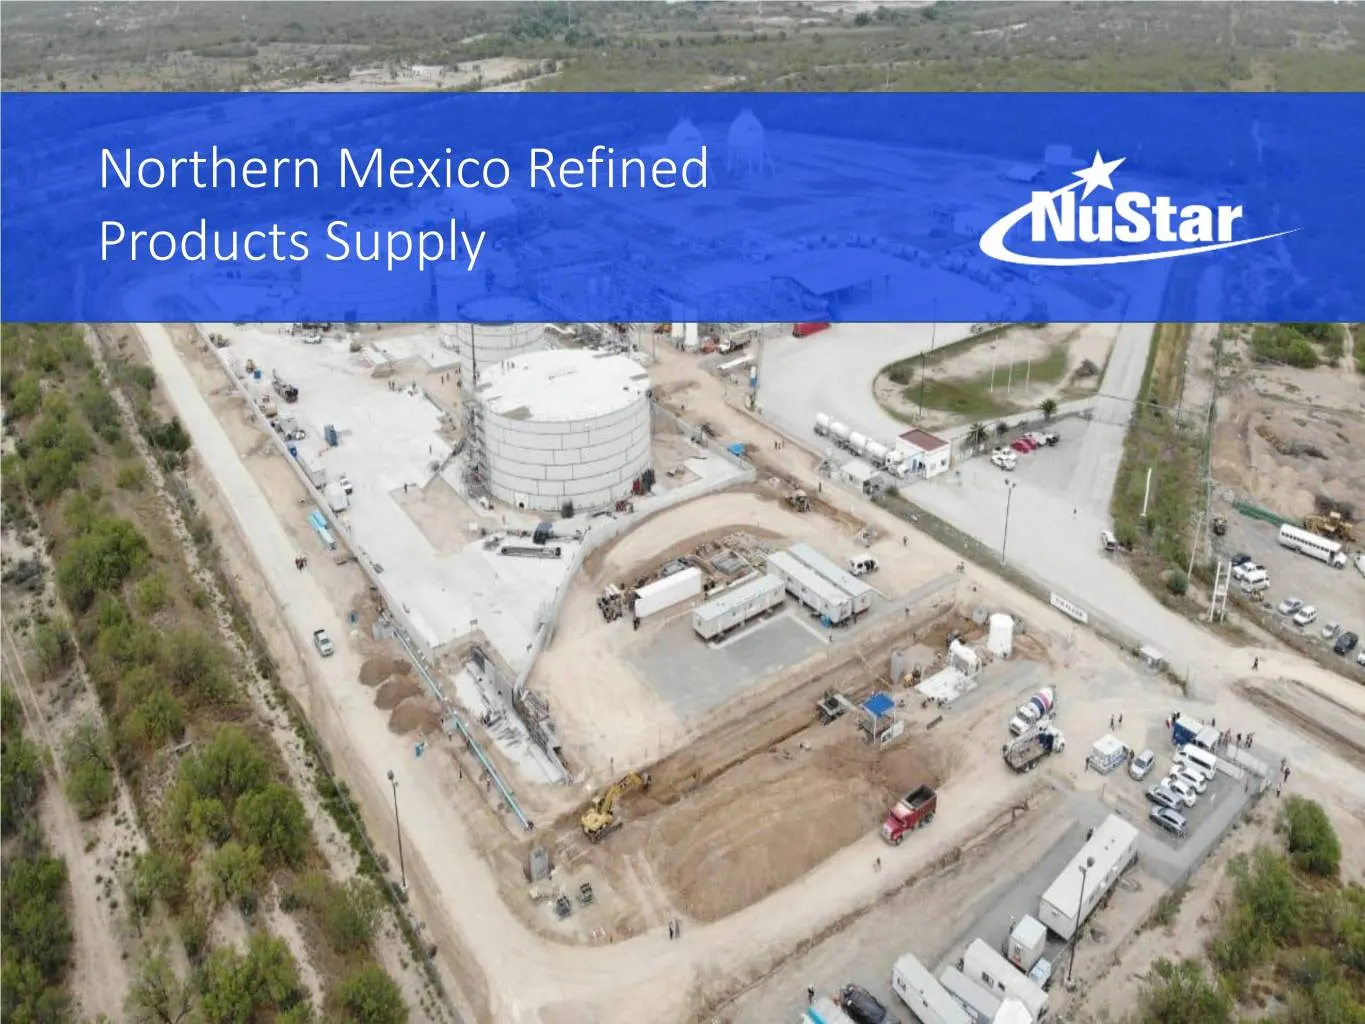
Northern Mexico Refined Products Supply
Slide 27: Mexico's Refined Product Demand Expected to Exceed Infrastructure Capacity
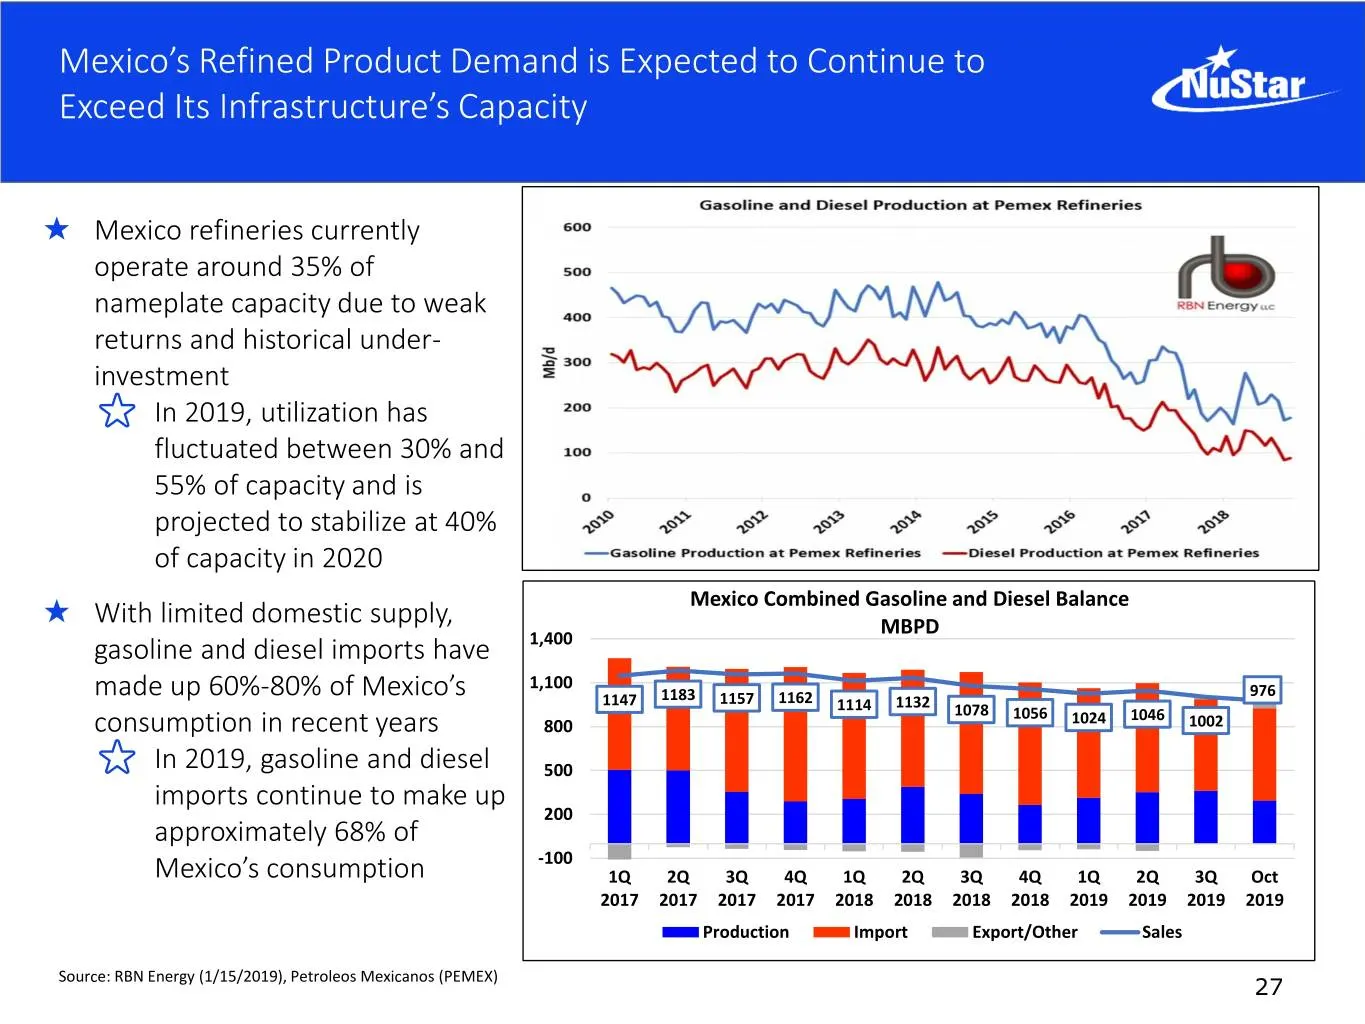
Mexico’s Refined Product Demand is Expected to Continue to Exceed Its Infrastructure’s Capacity ★ Mexico refineries currently operate around 35% of nameplate capacity due to weak returns and historical under- investment ⭐ In 2019, utilization has fluctuated between 30% and 55% of capacity and is pro
Slide 28: Completed Two Projects in 2019, Another in Early 2020
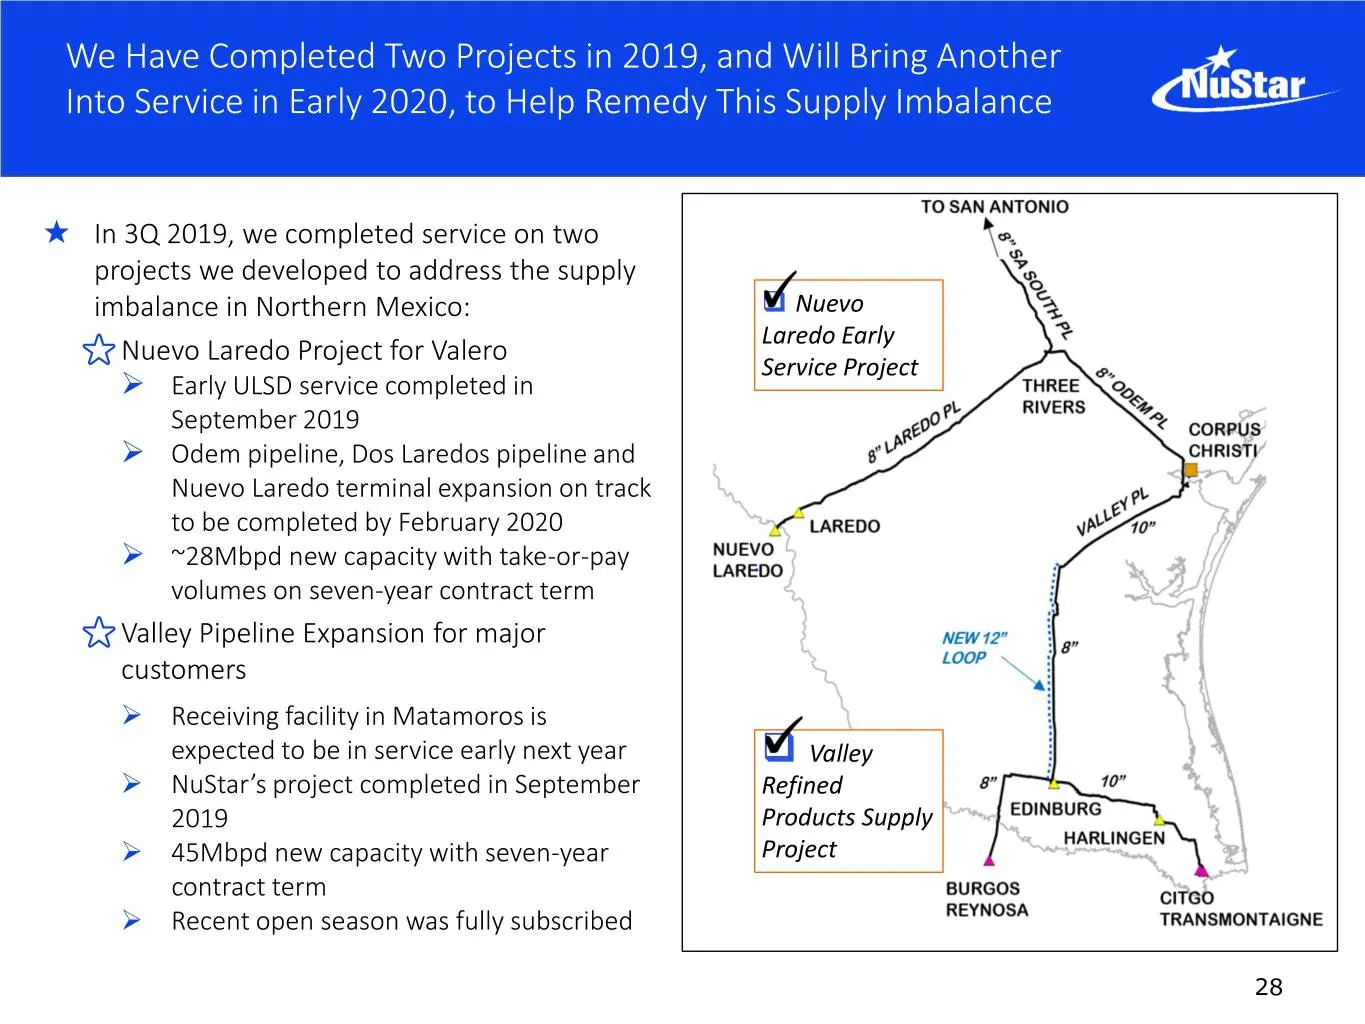
We Have Completed Two Projects in 2019, and Will Bring Another Into Service in Early 2020, to Help Remedy This Supply Imbalance ★ In 3Q 2019, we completed service on two projects we developed to address the supply imbalance in Northern Mexico: Nuevo Laredo Early ⭐Nuevo Laredo Project for Valero Se
Slide 29: West Coast Bio-Fuels
West Coast Bio-Fuels
Slide 30: Aggressive Carbon Emissions Reduction Goals on the West Coast
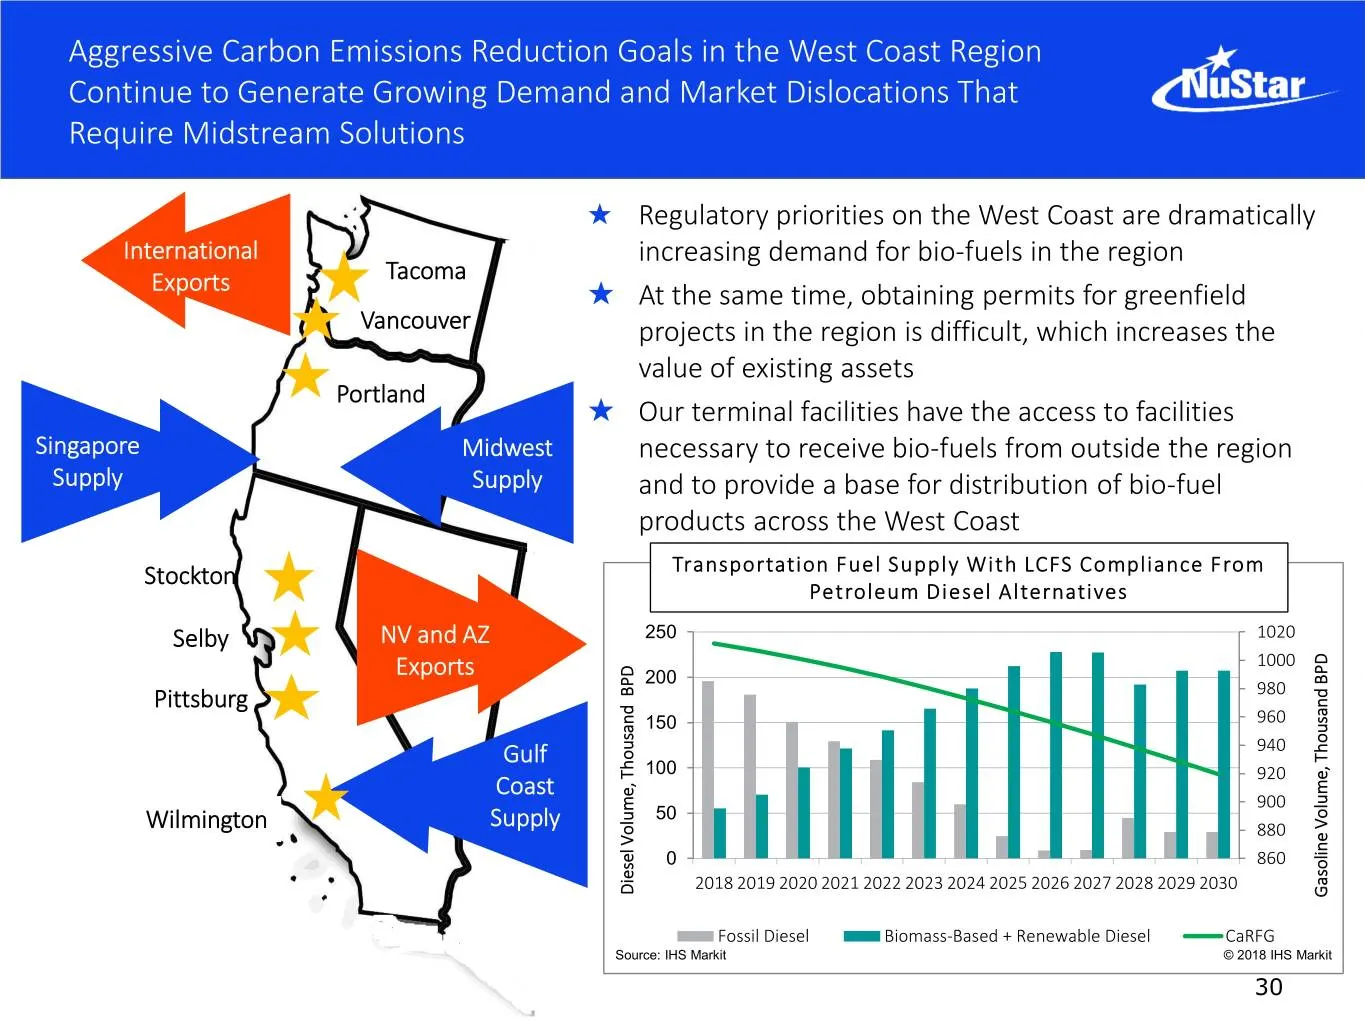
Aggressive Carbon Emissions Reduction Goals in the West Coast Region Continue to Generate Growing Demand and Market Dislocations That Require Midstream Solutions ★ Regulatory priorities on the West Coast are dramatically International increasing demand for bio-fuels in the region Tacoma Exports ★ At
Slide 31: Partnering With Key Customers to Develop Bio-Fuels Storage
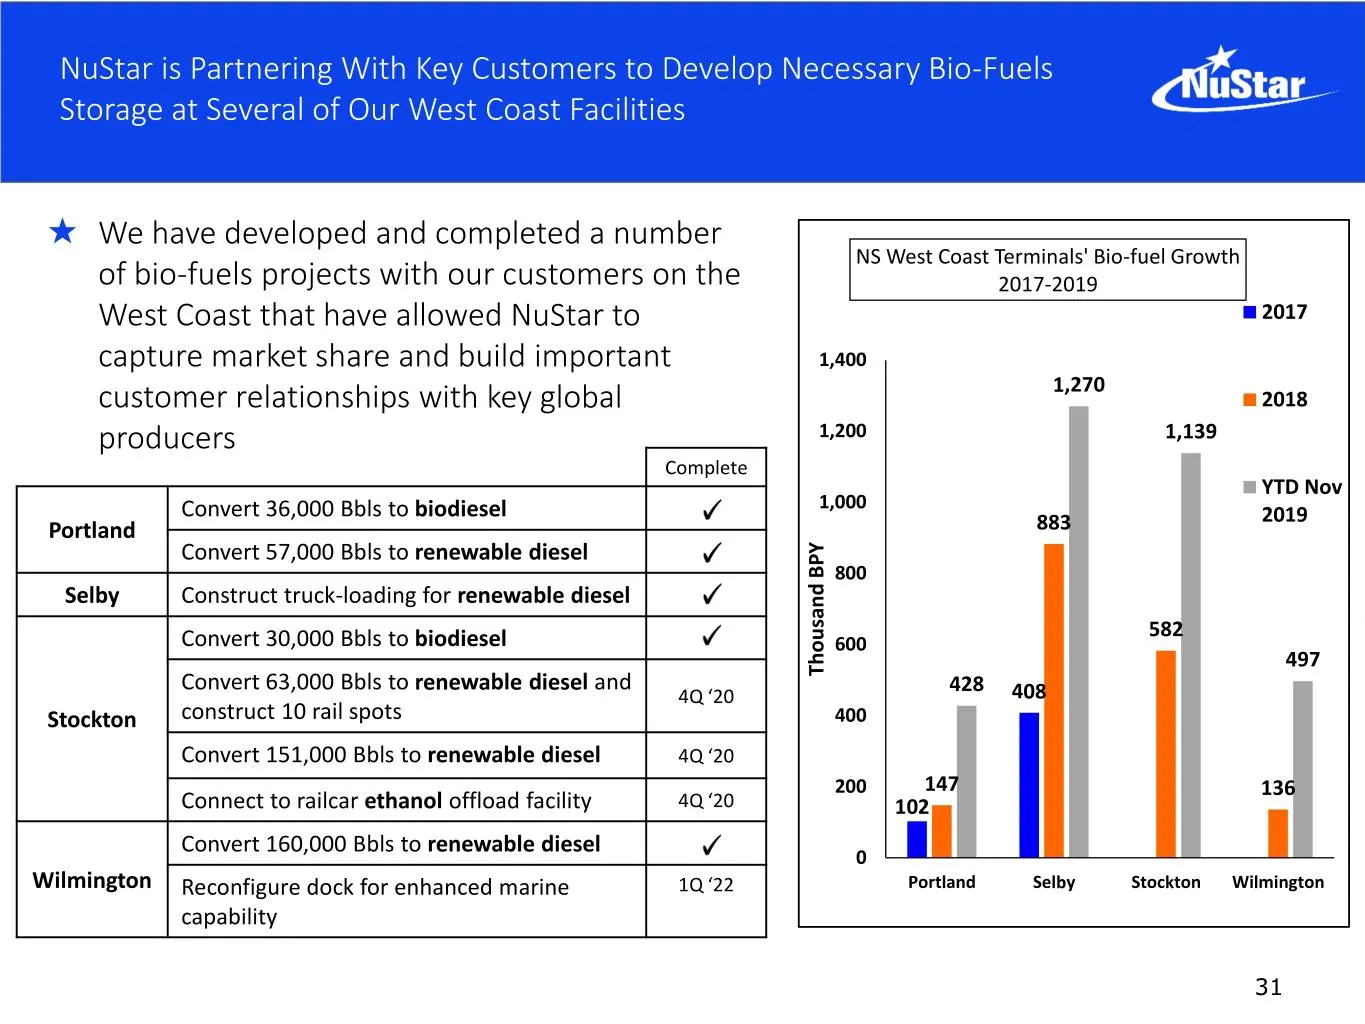
NuStar is Partnering With Key Customers to Develop Necessary Bio-Fuels Storage at Several of Our West Coast Facilities ★ We have developed and completed a number NS West Coast Terminals' Bio-fuel Growth of bio-fuels projects with our customers on the 2017-2019 West Coast that have allowed NuStar to
Slide 32: HSE Excellence is NuStar's #1 Priority
HSE Excellence is NuStar’s #1 Priority 32
Slide 33: Safe, Responsible and Efficient Operations are NuStar's #1 Priority
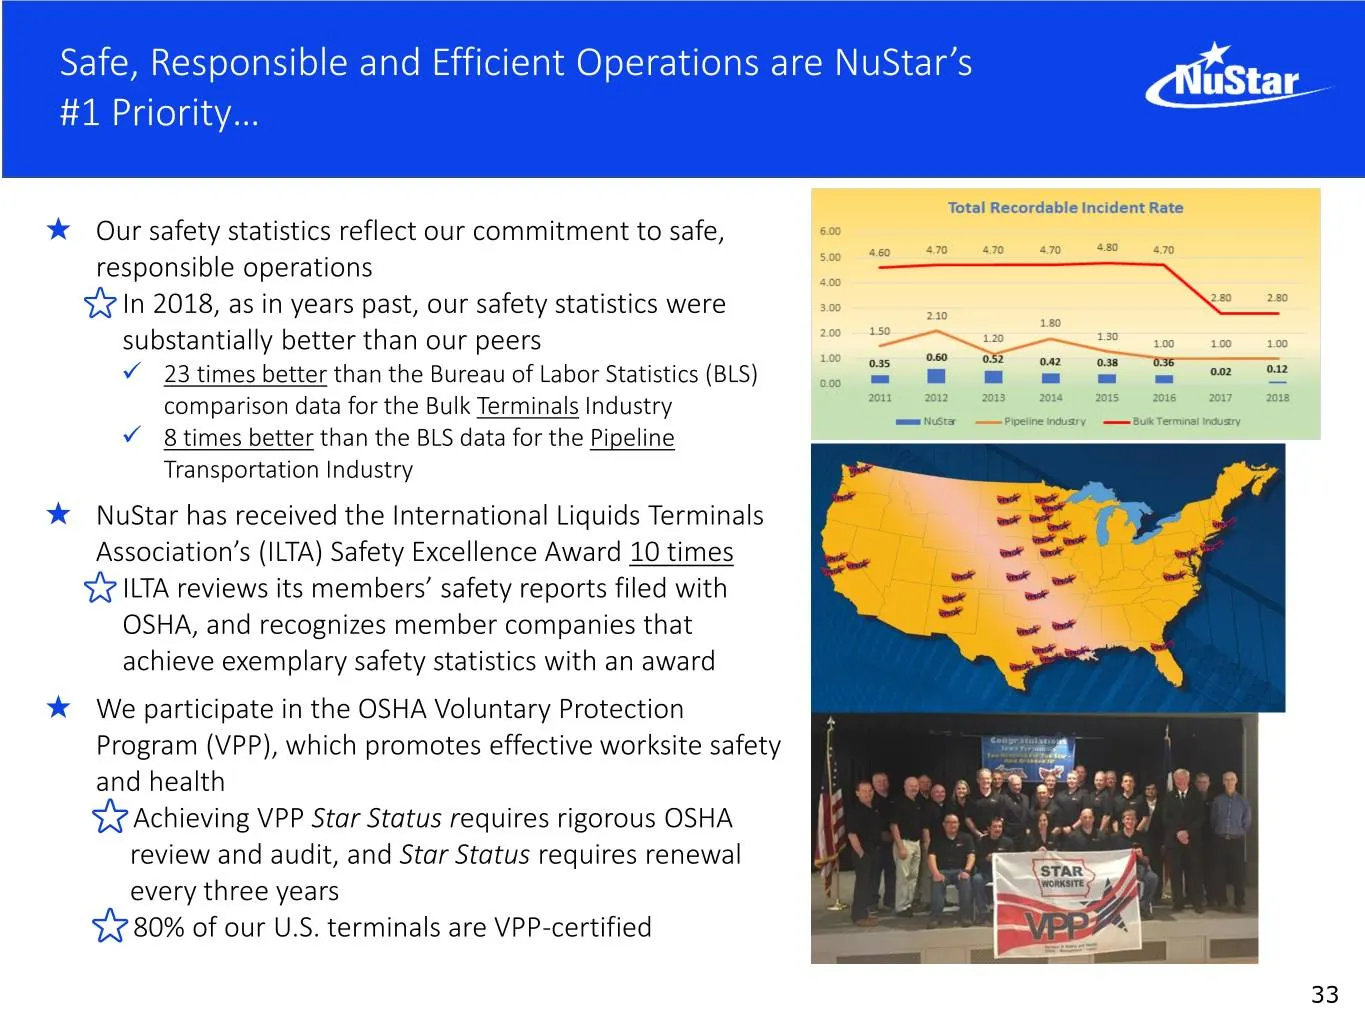
Safe, Responsible and Efficient Operations are NuStar’s #1 Priority… ★ Our safety statistics reflect our commitment to safe, responsible operations ⭐In 2018, as in years past, our safety statistics were substantially better than our peers ✓ 23 times better than the Bureau of Labor Statistics (BLS) c
Slide 34: In 2020, We Will Continue to Take Care of Employees and Communities
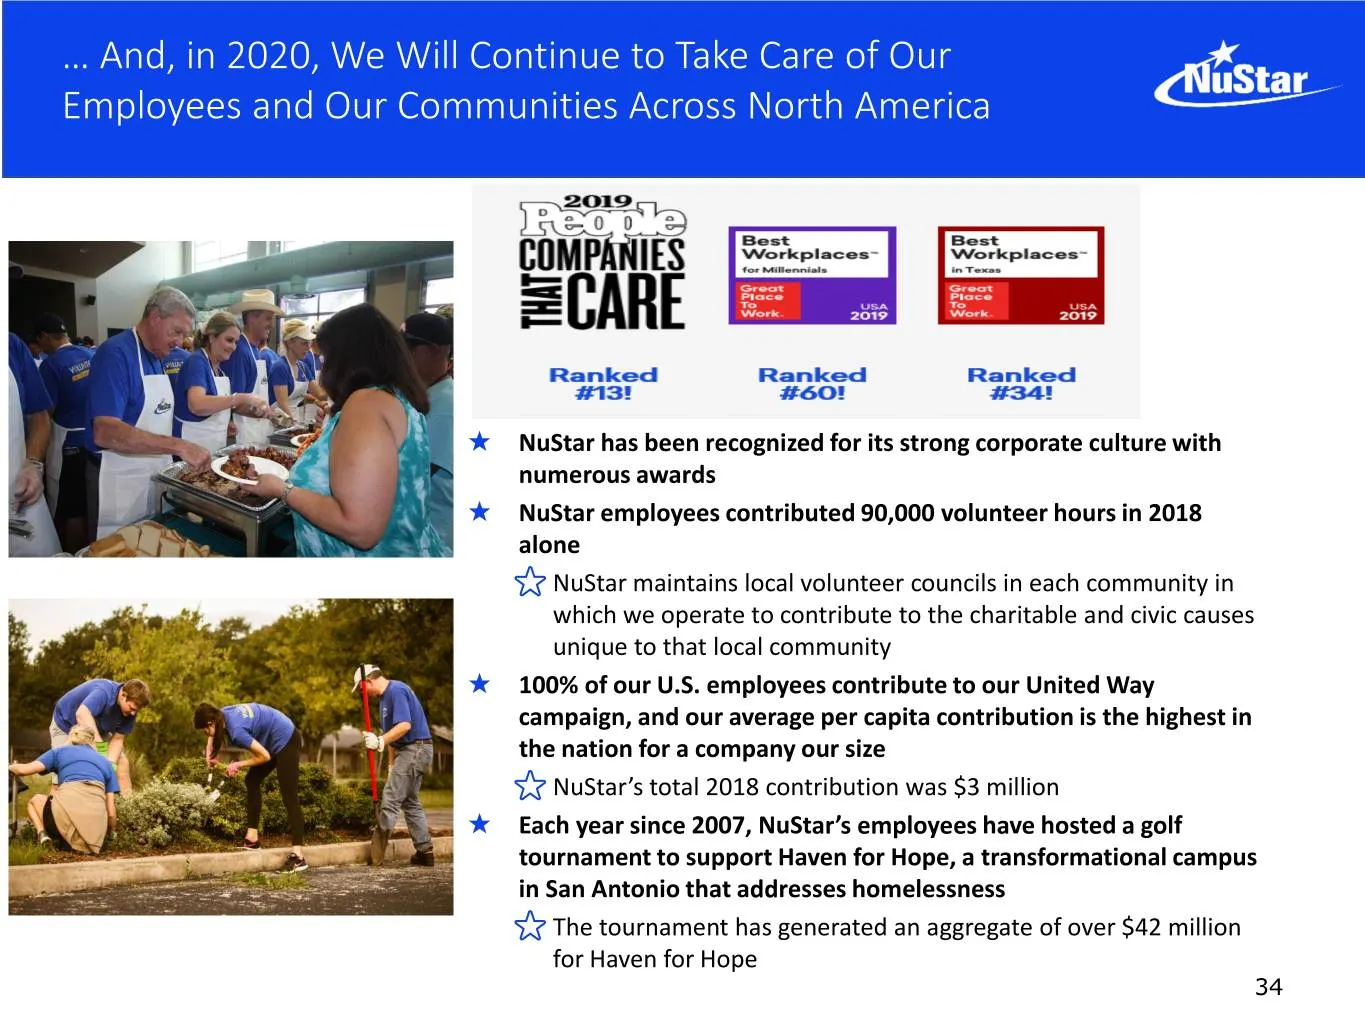
… And, in 2020, We Will Continue to Take Care of Our Employees and Our Communities Across North America ★ NuStar has been recognized for its strong corporate culture with numerous awards ★ NuStar employees contributed 90,000 volunteer hours in 2018 alone ⭐NuStar maintains local volunteer councils in
Slide 35: Appendix
APPENDIX 35
Slide 36: Debt Maturity Schedule
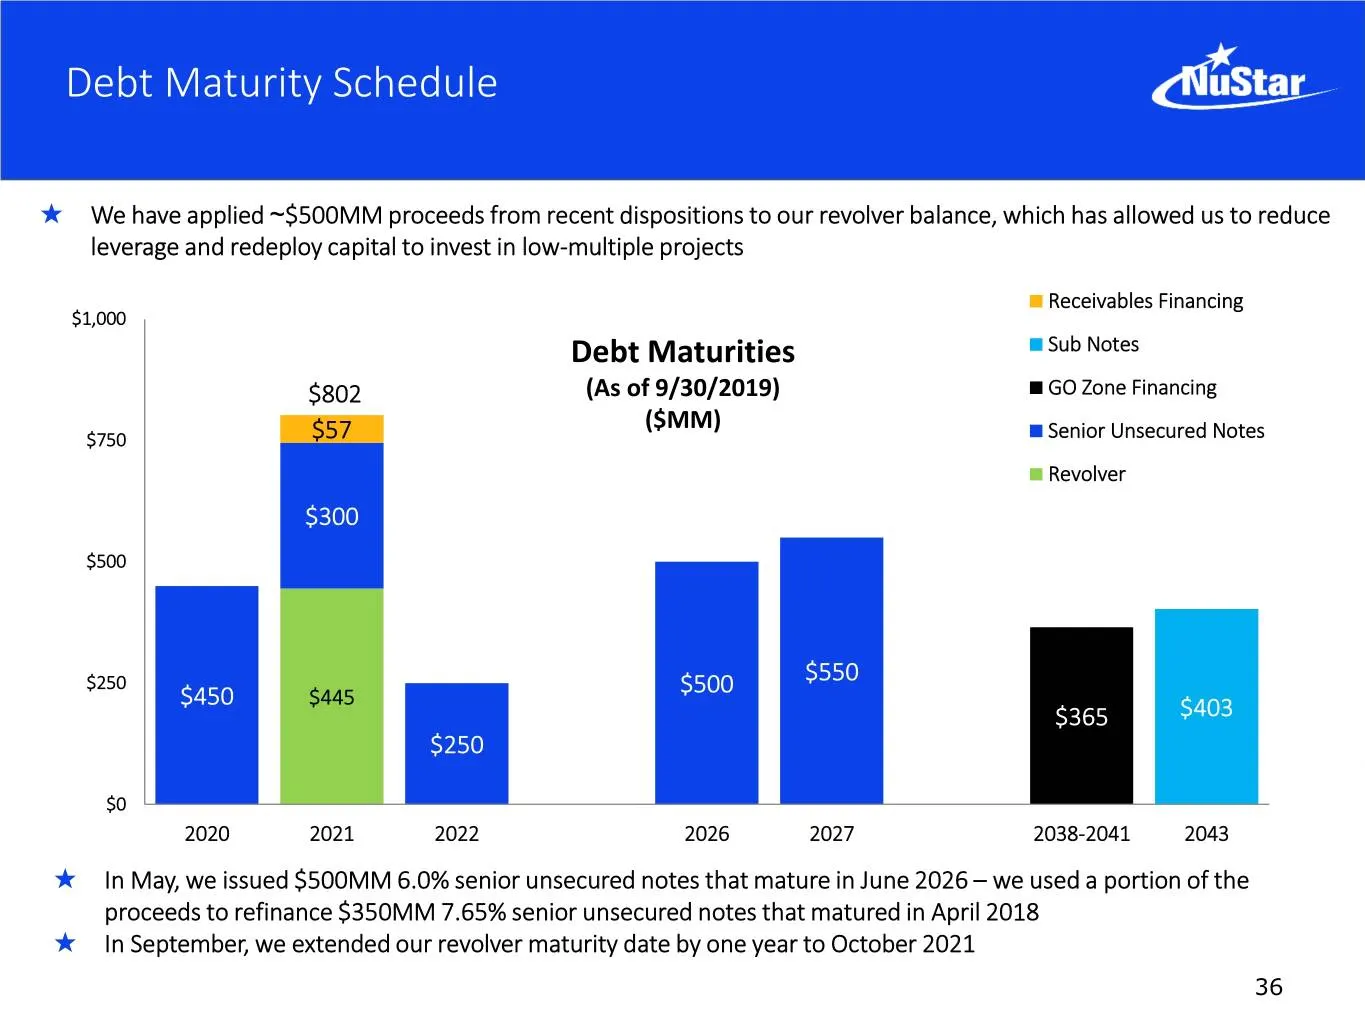
Debt Maturity Schedule ★ We have applied ~$500MM proceeds from recent dispositions to our revolver balance, which has allowed us to reduce leverage and redeploy capital to invest in low-multiple projects Receivables Financing $1,000 Debt Maturities Sub Notes $802 (As of 9/30/2019) GO Zone Financing
Slide 37: Capital Structure as of September 30, 2019
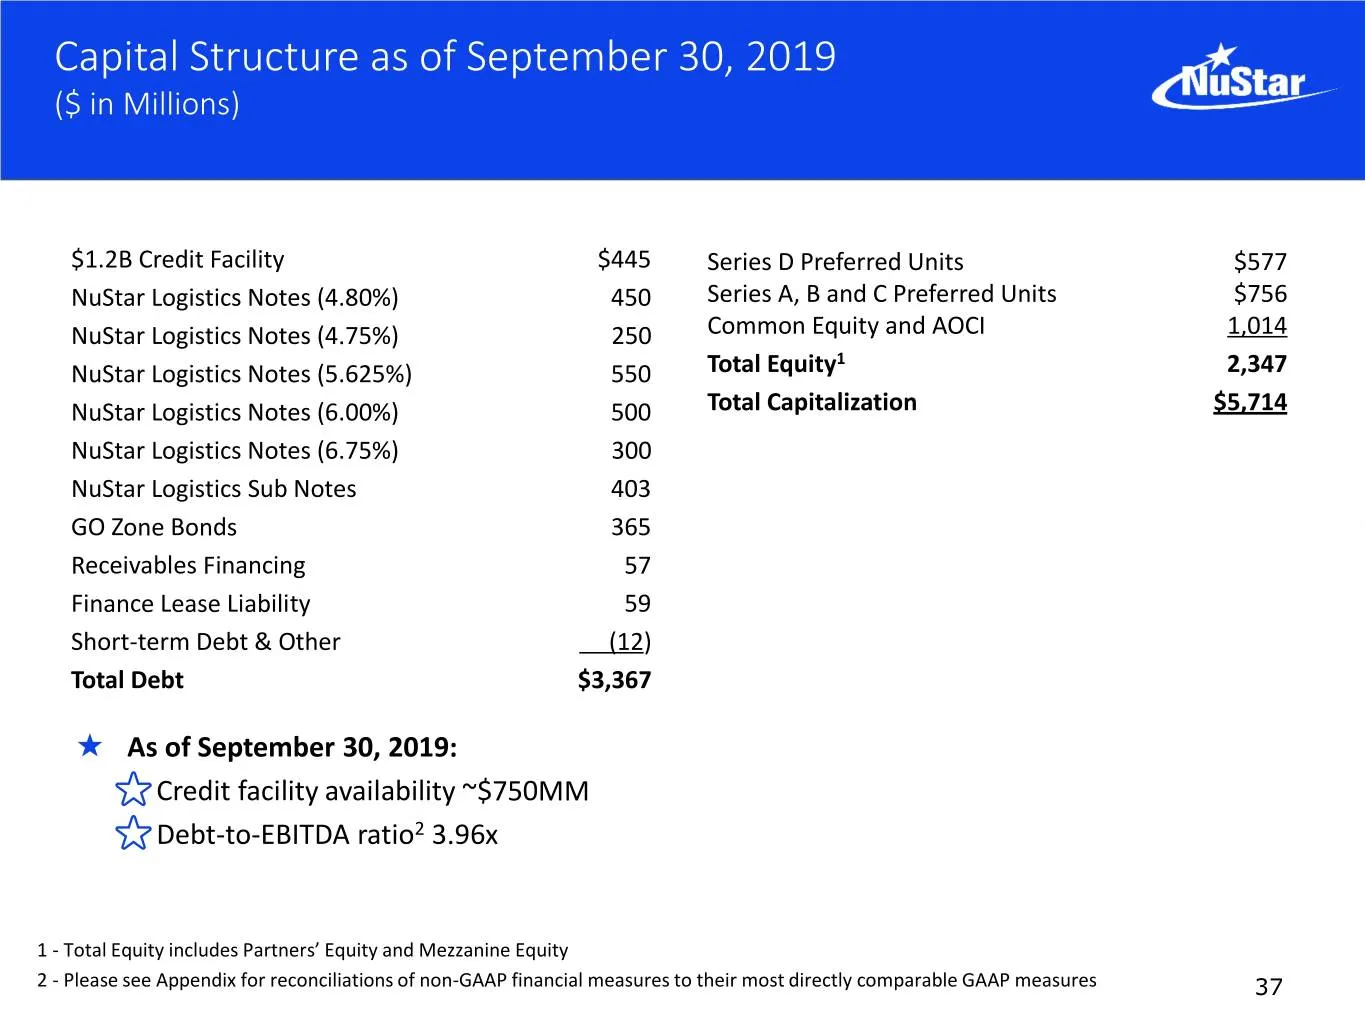
Capital Structure as of September 30, 2019 ($ in Millions) $1.2B Credit Facility $445 Series D Preferred Units $577 NuStar Logistics Notes (4.80%) 450 Series A, B and C Preferred Units $756 NuStar Logistics Notes (4.75%) 250 Common Equity and AOCI 1,014 1 NuStar Logistics Notes (5.625%) 550 Total Eq
Slide 38: Reconciliation of Non-GAAP Financial Information
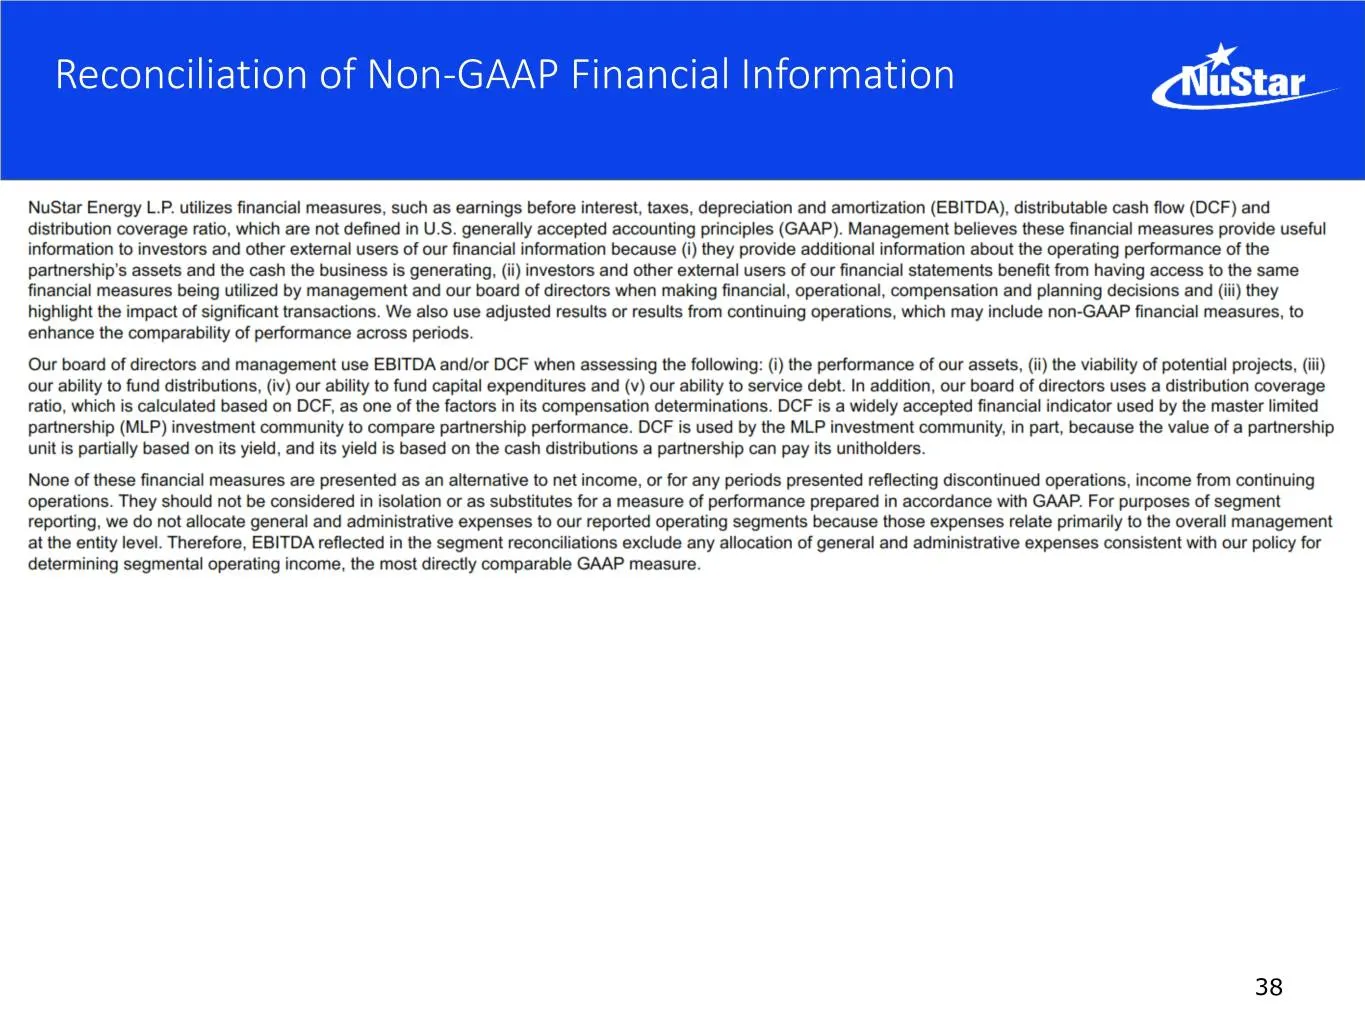
Reconciliation of Non-GAAP Financial Information 38
Slide 39: Reconciliation of Non-GAAP Financial Information (continued)
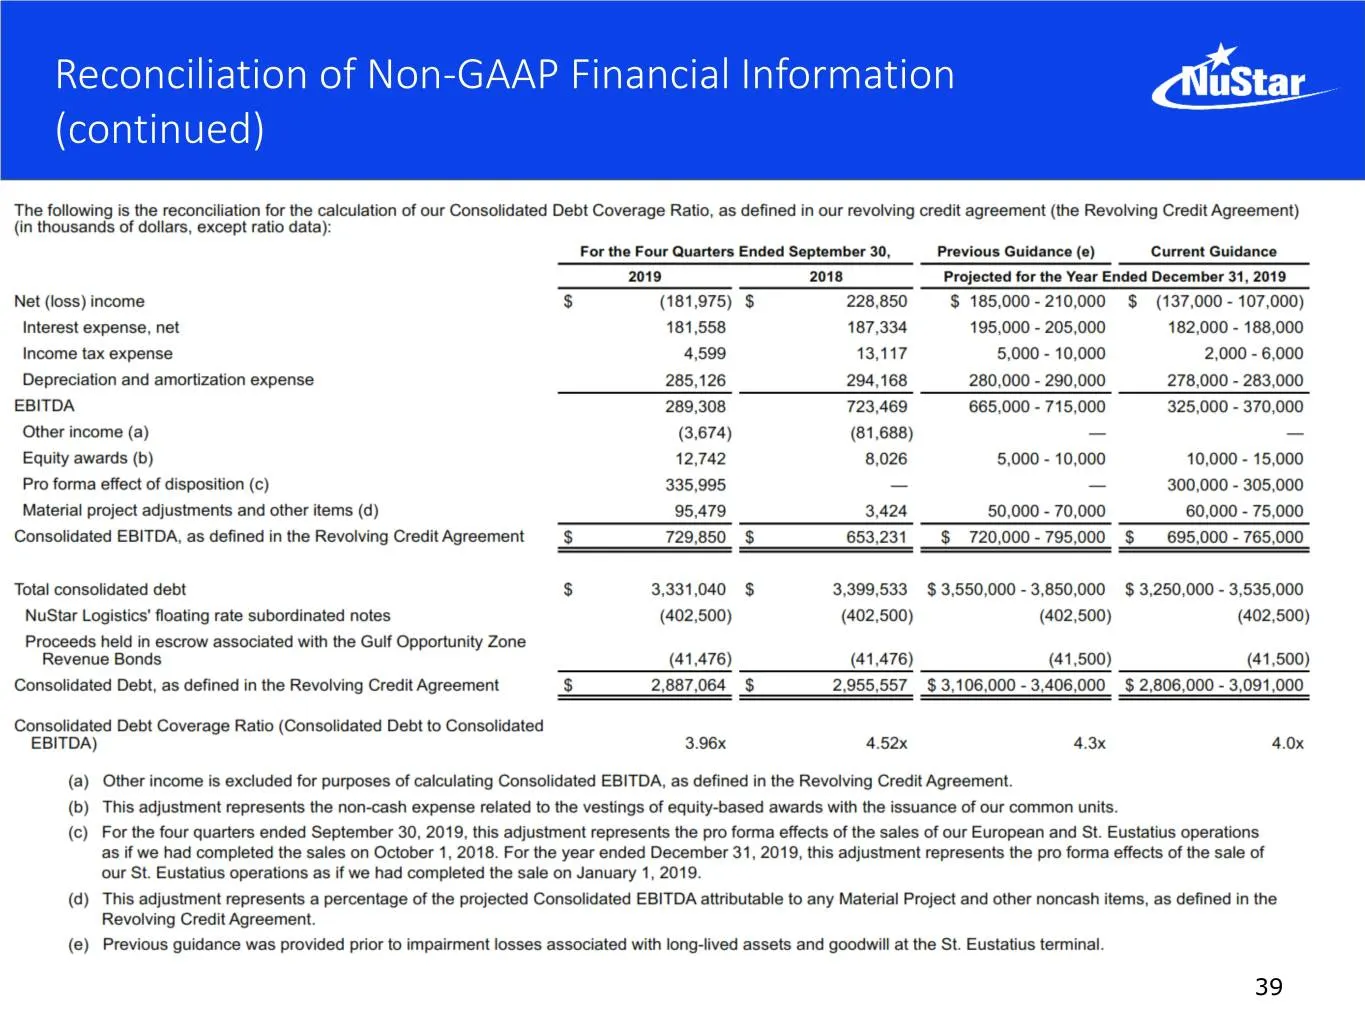
Reconciliation of Non-GAAP Financial Information (continued) 39
Slide 40: Reconciliation of Non-GAAP Financial Information (continued)
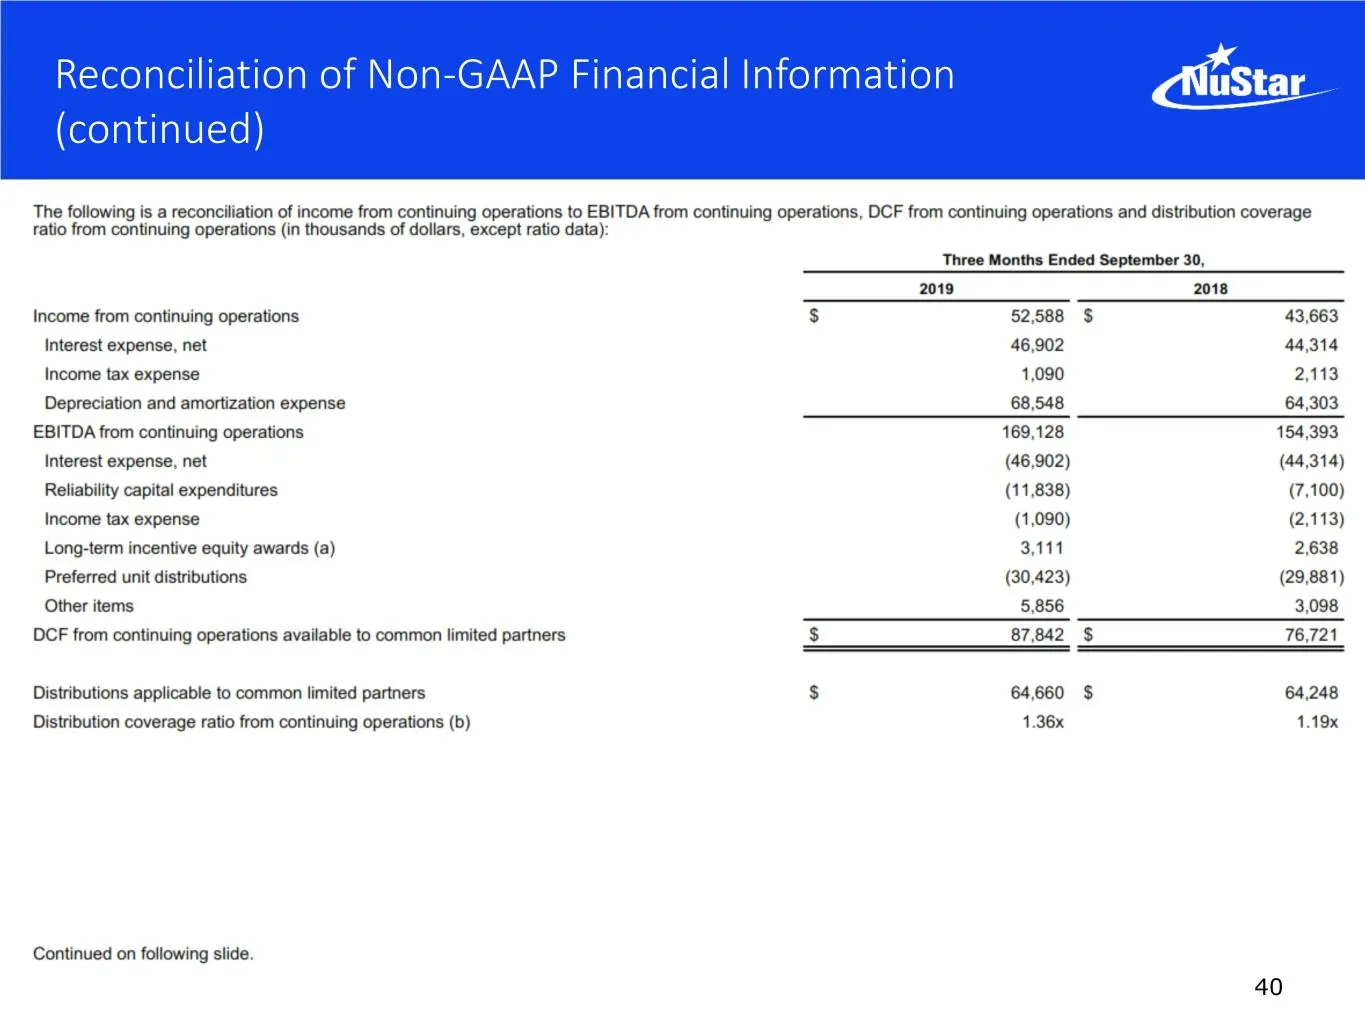
Reconciliation of Non-GAAP Financial Information (continued) 40
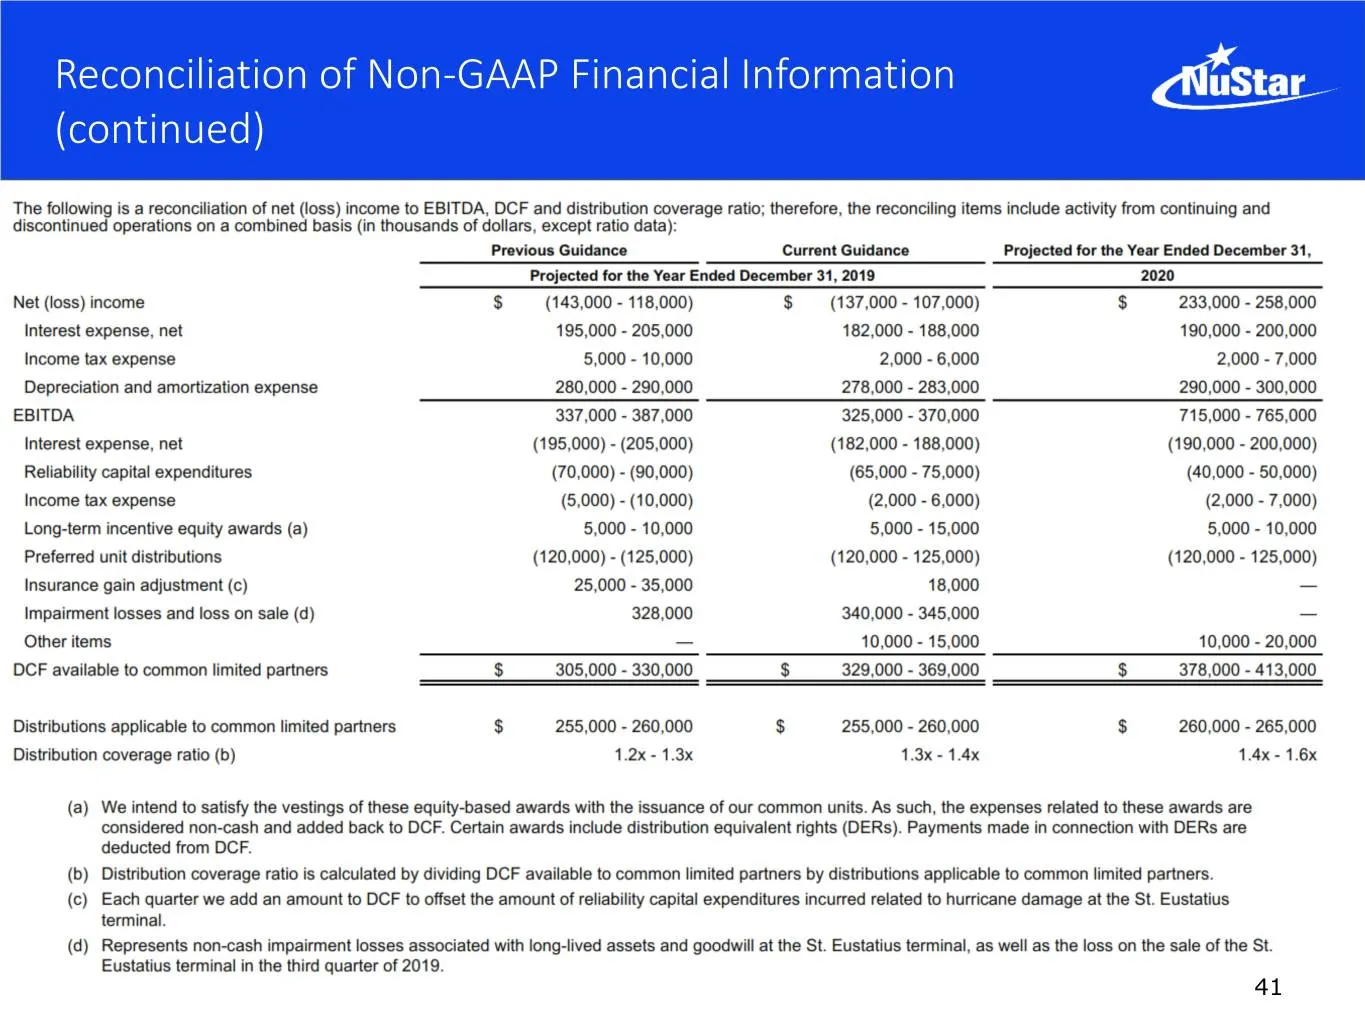
Slide 41: Reconciliation of Non-GAAP Financial Information (continued)
Reconciliation of Non-GAAP Financial Information (continued) 41
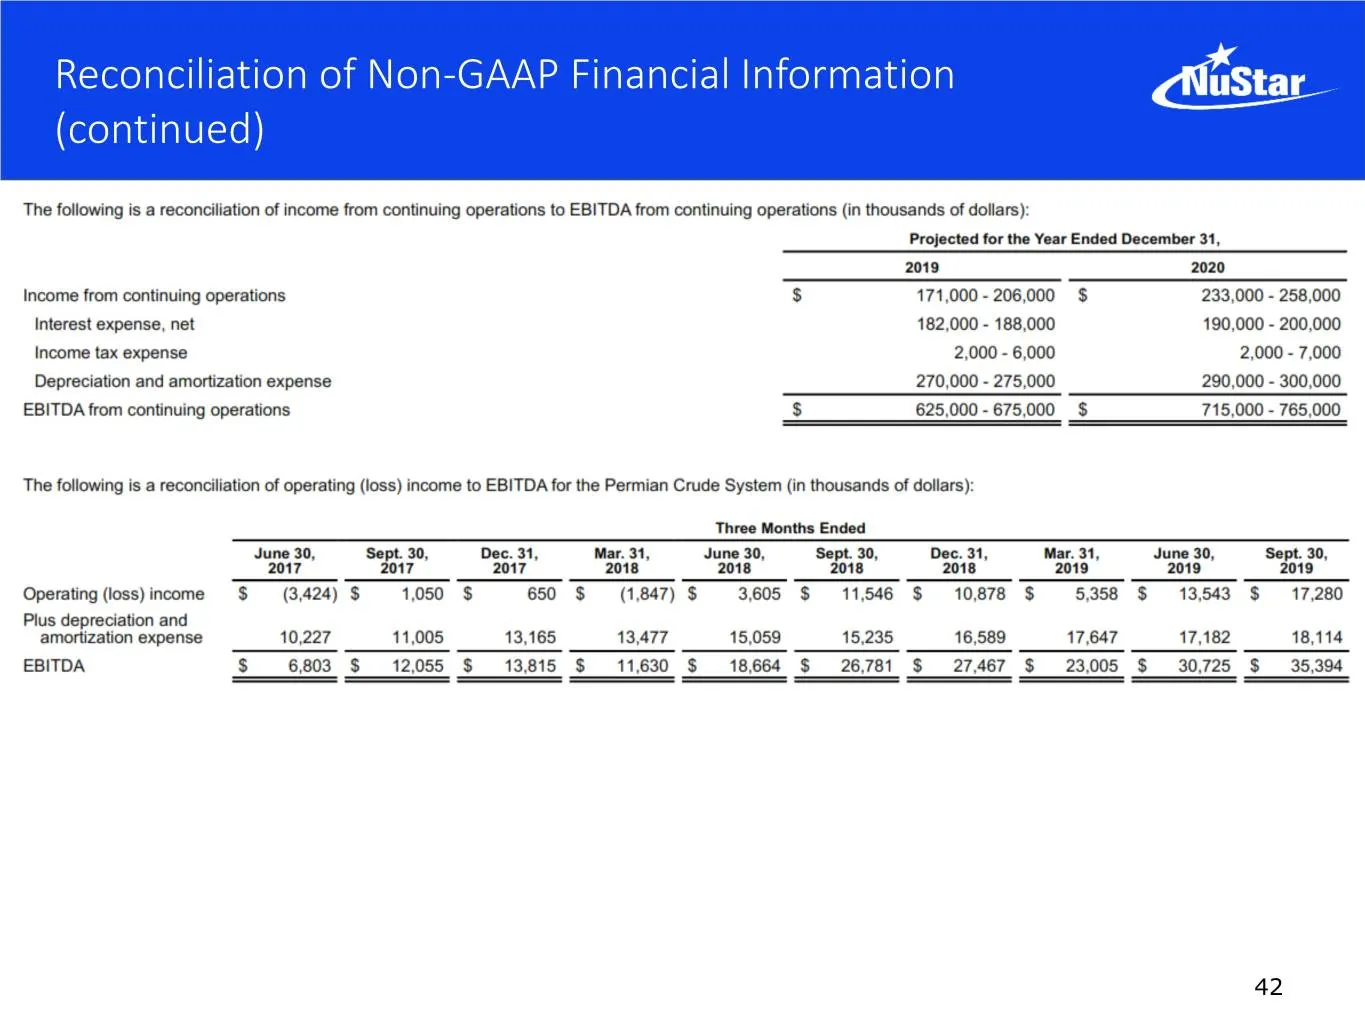
Slide 42: Reconciliation of Non-GAAP Financial Information (continued)
Reconciliation of Non-GAAP Financial Information (continued) 42
Source: SEC EDGAR · 8-K filed Dec 11, 2019
More decks from NuStar Energy LP
 Merger or Acquisition (January 2024)14 slides · Jan 22, 2024
 Investor Presentation (December 2023)35 slides · Dec 5, 2023
 Raymond James Virtual Energy Supply Chain Conference 2023; Pickering Energy Partners TE&MF36 slides · Sep 19, 2023
 Barclays CEO Energy-Power Conference 202336 slides · Sep 6, 2023
 Citi One-on-One Midstream/Energy Infrastructure Conference 202336 slides · Aug 22, 2023
 8th Annual J.P. Morgan Energy, Power & Renewables Conference 202336 slides · Jun 21, 2023