MidSouth Bancorp — Gulf South Bank Conference 2017
32 slides from MidSouth Bancorp's conference presentation, May 8, 2017

Slide 1: Gulf South Bank Conference May 8-9, 2017 | New Orleans
Gulf South Bank Conference May 8 – 9, 2017 | New Orleans
Slide 2: Forward Looking Statements
Forward Looking Statements Certain statements contained herein are forward-looking statements within the meaning of Section 27A of the Securities Act of 1933 and Section 21E of the Securities Exchange Act of 1934 and subject to the safe harbor provisions of the Private Securities Litigation Reform A
Slide 3: Company Profile
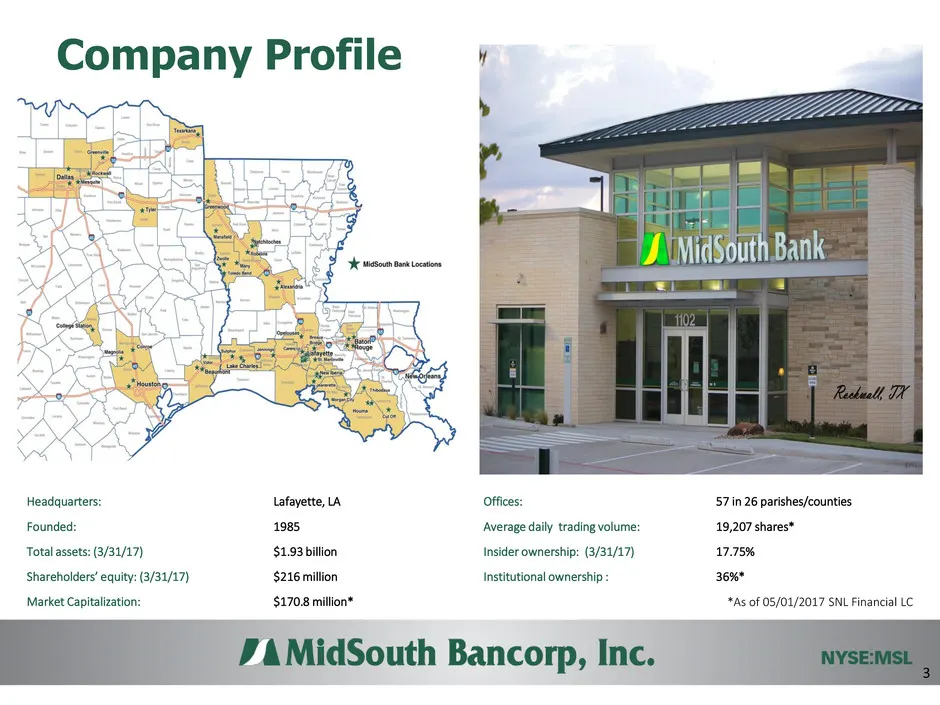
Company Profile Headquarters: Lafayette, LA Offices: 57 in 26 parishes/counties Founded: 1985 Average daily trading volume: 19,207 shares* Total assets: (3/31/17) $1.93 billion Insider ownership: (3/31/17) 17.75% Shareholders’ equity: (3/31/17) $216 million Institutional ownership : 36%* Market Capi
Slide 4: Diversified Loan Portfolio
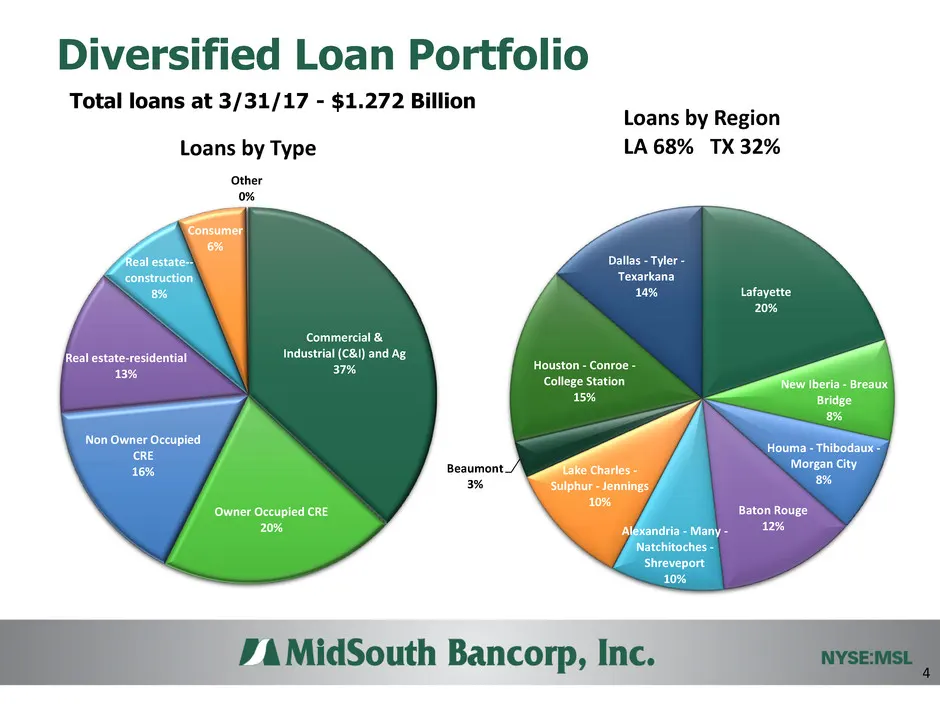
Diversified Loan Portfolio Total loans at 3/31/17 - $1.272 Billion 4 Commercial & Industrial (C&I) and Ag 37% Owner Occupied CRE 20% Non Owner Occupied CRE 16% Real estate-residential 13% Real estate-- construction 8% Consumer 6% Other 0% Loans by Type Lafayette 20% New Iberia - Breaux Bridge 8% Hou
Slide 5: Attractive Core Deposits
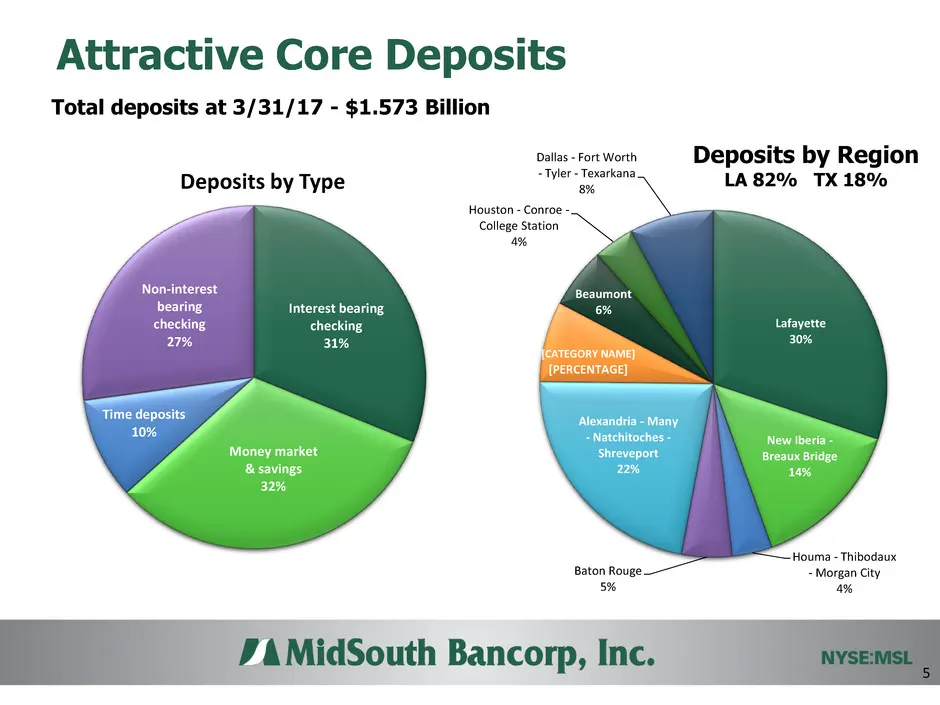
Attractive Core Deposits Total deposits at 3/31/17 - $1.573 Billion 5 Interest bearing checking 31% Money market & savings 32% Time deposits 10% Non-interest bearing checking 27% Deposits by Type Lafayette 30% New Iberia - Breaux Bridge 14% Houma - Thibodaux - Morgan City 4% Baton Rouge 5% Alexandri
Slide 6: Management Team of MidSouth Bank
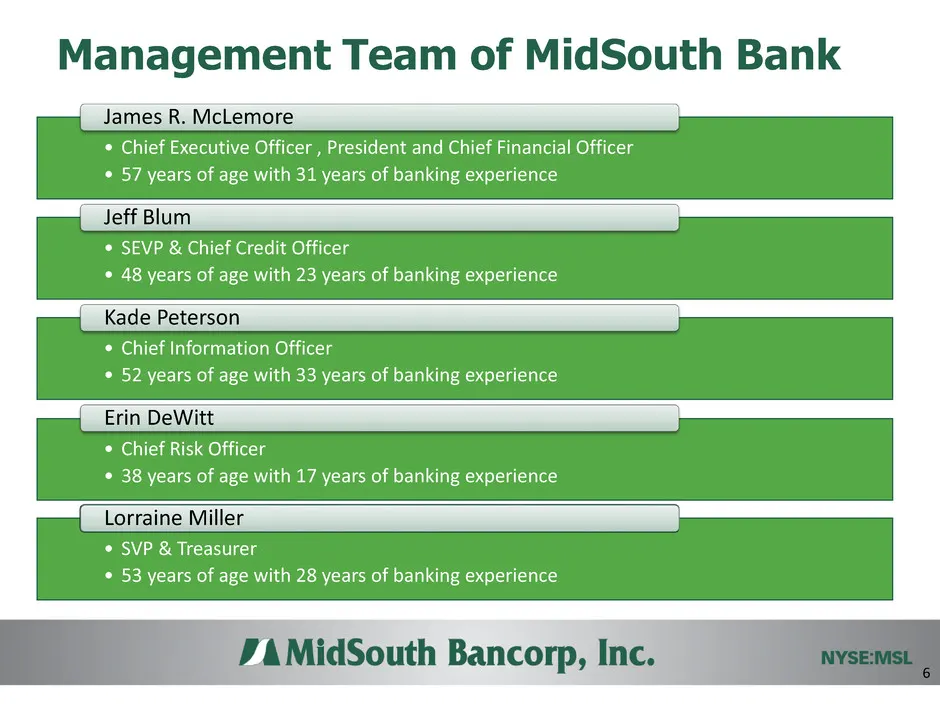
Management Team of MidSouth Bank • Chief Executive Officer , President and Chief Financial Officer • 57 years of age with 31 years of banking experience James R. McLemore • SEVP & Chief Credit Officer • 48 years of age with 23 years of banking experience Jeff Blum • Chief Information Officer • 52 ye
Slide 7: 1Q17 Summary Results
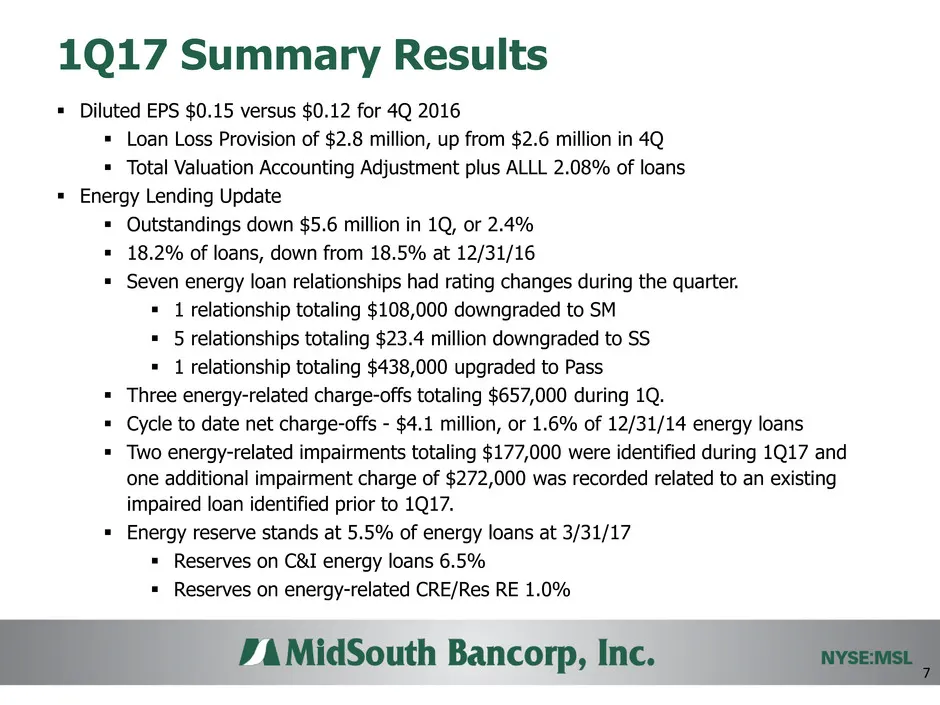
1Q17 Summary Results Diluted EPS $0.15 versus $0.12 for 4Q 2016 Loan Loss Provision of $2.8 million, up from $2.6 million in 4Q Total Valuation Accounting Adjustment plus ALLL 2.08% of loans Energy Lending Update Outstandings down $5.6 million in 1Q, or 2.4% 18.2% of loans, down from 18.
Slide 8: Energy Lending – Through Major Cycles
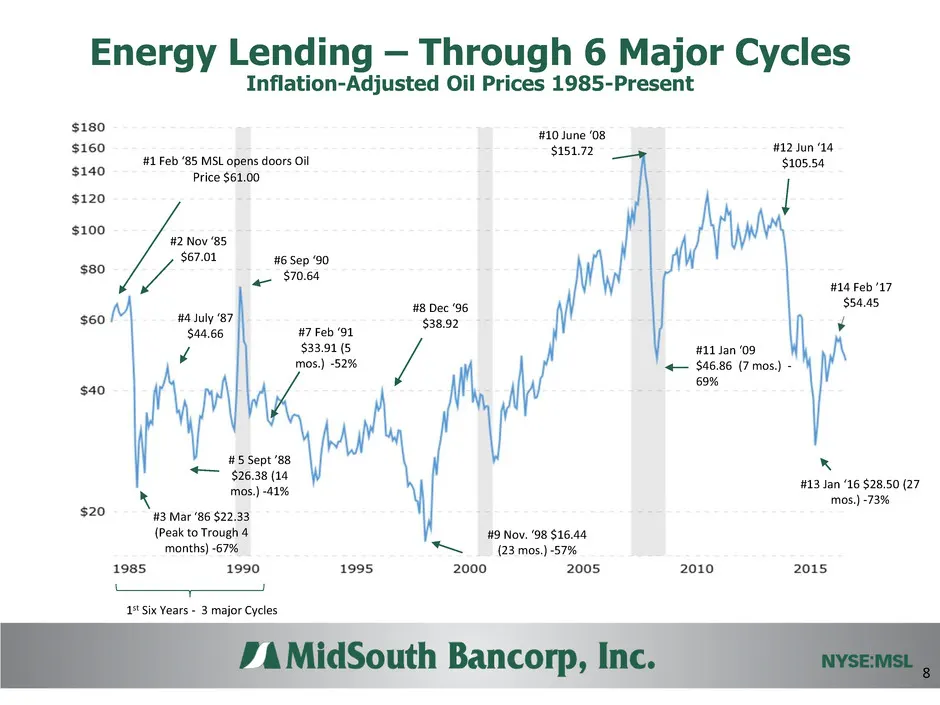
Energy Lending – Through 6 Major Cycles Inflation-Adjusted Oil Prices 1985-Present 8 #1 Feb ‘85 MSL opens doors Oil Price $61.00 #2 Nov ‘85 $67.01 #3 Mar ‘86 $22.33 (Peak to Trough 4 months) -67% #6 Sep ‘90 $70.64 #7 Feb ‘91 $33.91 (5 mos.) -52% #4 July ‘87 $44.66 # 5 Sept ’88 $26.38 (14 mos.) -41%
Slide 9: Energy Lending – Track Record
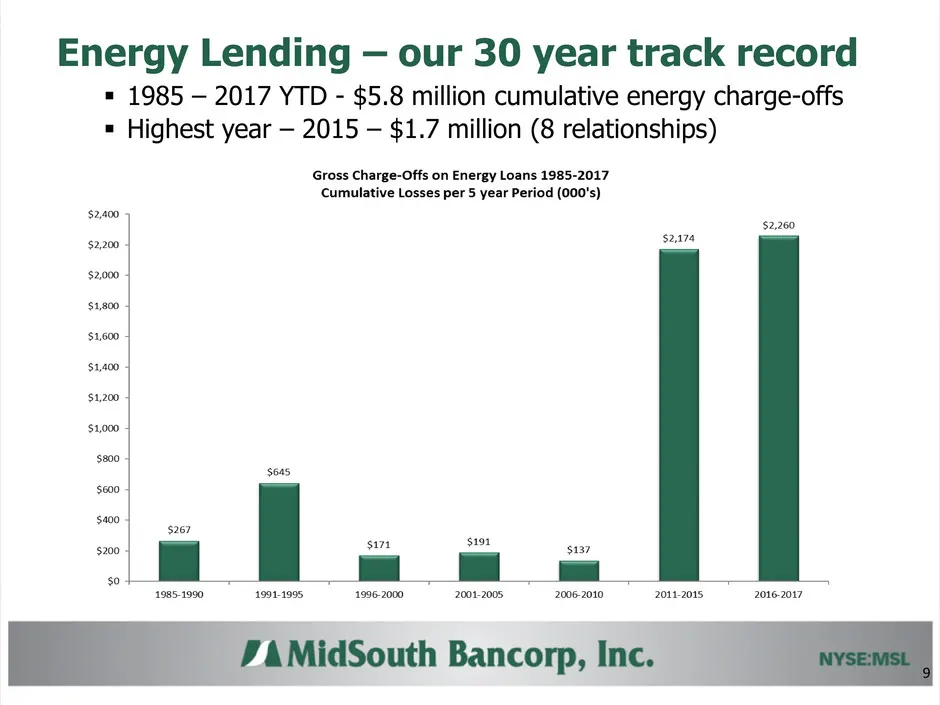
Energy Lending – our 30 year track record 1985 – 2017 YTD - $5.8 million cumulative energy charge-offs Highest year – 2015 – $1.7 million (8 relationships) 9
Slide 10: Energy Lending – Asset Quality
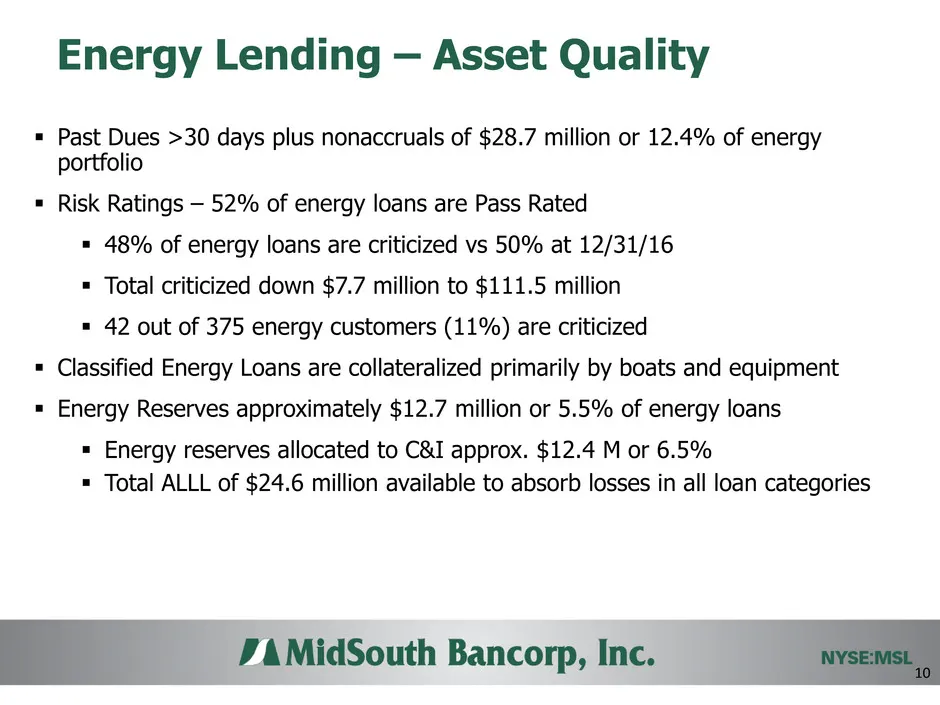
Energy Lending – Asset Quality Past Dues >30 days plus nonaccruals of $28.7 million or 12.4% of energy portfolio Risk Ratings – 52% of energy loans are Pass Rated 48% of energy loans are criticized vs 50% at 12/31/16 Total criticized down $7.7 million to $111.5 million 42 out of 375 energy
Slide 11: Loan Growth Being Impacted by Energy-related Paydowns
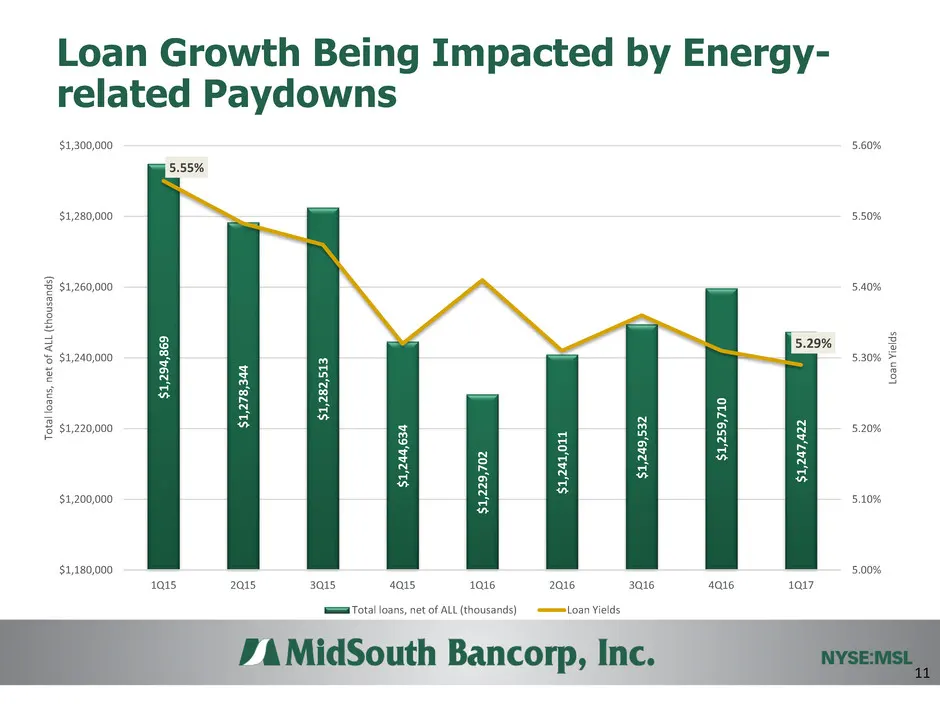
11 Loan Growth Being Impacted by Energy- related Paydowns $ 1 ,2 9 4, 86 9 $ 1 ,2 7 8, 3 44 $ 1 ,2 8 2 ,5 13 $ 1 ,2 4 4, 63 4 $ 1 ,2 2 9 ,7 02 $ 1 ,2 4 1 ,0 11 $ 1 ,2 4 9 ,5 32 $ 1 ,2 5 9, 7 10 $ 1 ,2 4 7 ,4 22 5.55% 5.29% 5.00% 5.10% 5.20% 5.30% 5.40% 5.50% 5.60% $1,180,000 $1,200,000 $1,220,000 $1
Slide 12: LOC Utilization - Revolvers
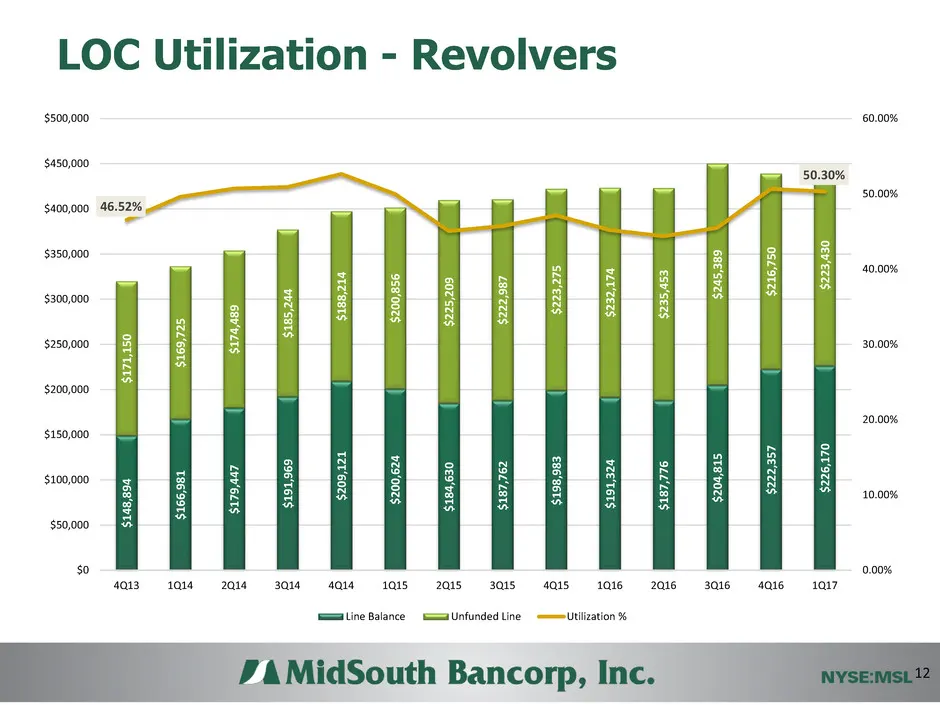
LOC Utilization - Revolvers 12 $14 8 ,89 4 $16 6 ,98 1 $17 9 ,44 7 $19 1 ,96 9 $20 9 ,12 1 $20 0 ,62 4 $18 4 ,63 0 $18 7 ,76 2 $19 8 ,98 3 $19 1 ,32 4 $18 7 ,77 6 $20 4 ,81 5 $22 2 ,35 7 $22 6 ,17 0 $17 1 ,15 0 $16 9 ,72 5 $17 4 ,48 9 $18 5 ,24 4 $18 8 ,21 4 $20 0 ,85 6 $22 5 ,20 9 $22 2 ,98 7 $22 3
Slide 13: Deposit Base – Source of Stable Low Cost Funding
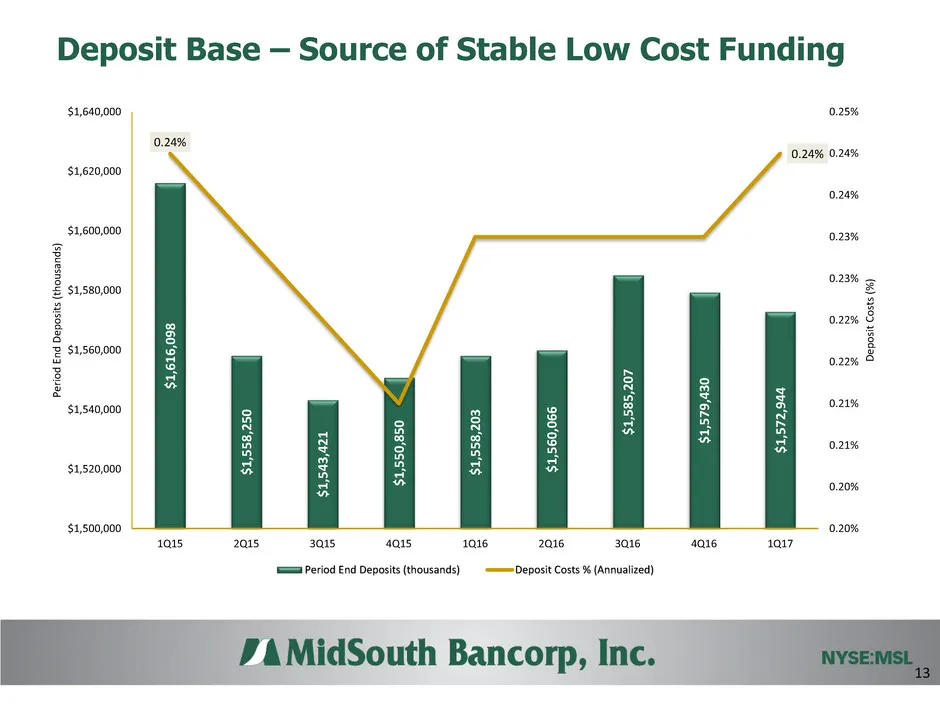
Deposit Base – Source of Stable Low Cost Funding 13 $ 1 ,6 1 6 ,0 9 8 $ 1 ,5 5 8 ,2 50 $ 1 ,5 4 3 ,4 2 1 $ 1 ,5 5 0 ,8 50 $ 1 ,5 5 8 ,2 0 3 $ 1 ,5 6 0 ,0 6 6 $ 1 ,5 8 5 ,2 07 $ 1 ,5 7 9 ,4 30 $ 1 ,5 7 2 ,9 44 0.24% 0.24% 0.20% 0.20% 0.21% 0.21% 0.22% 0.22% 0.23% 0.23% 0.24% 0.24% 0.25% $1,500,000 $1
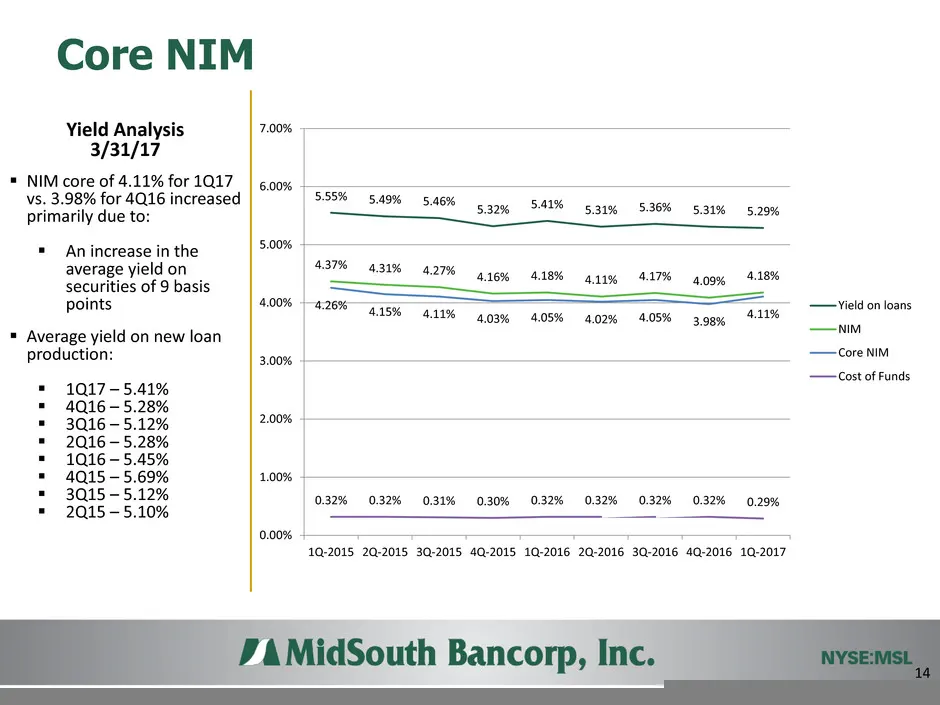
Slide 14: Core NIM Yield Analysis
Core NIM Yield Analysis 3/31/17 NIM core of 4.11% for 1Q17 vs. 3.98% for 4Q16 increased primarily due to: An increase in the average yield on securities of 9 basis points Average yield on new loan production: 1Q17 – 5.41% 4Q16 – 5.28% 3Q16 – 5.12% 2Q16 – 5.28% 1Q16 – 5.45% 4Q15 – 5
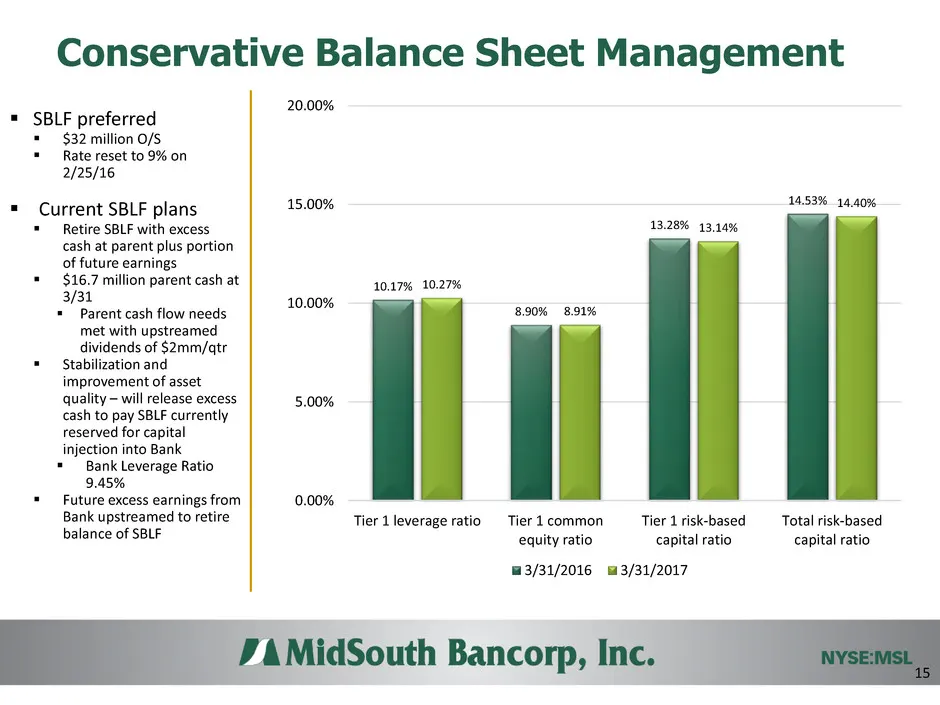
Slide 15: Conservative Balance Sheet Management
Conservative Balance Sheet Management 15 SBLF preferred $32 million O/S Rate reset to 9% on 2/25/16 Current SBLF plans Retire SBLF with excess cash at parent plus portion of future earnings $16.7 million parent cash at 3/31 Parent cash flow needs met with upstreamed dividends of $2mm/q
Slide 16: Investment Considerations
Investment Considerations Deep & experienced management team and board of directors with significant insider ownership Lending to Energy sector – core competency since Bank started in 1985 Located in resilient markets with growth opportunities Long-term conservative operating philosophy We
Slide 17: MSL Team
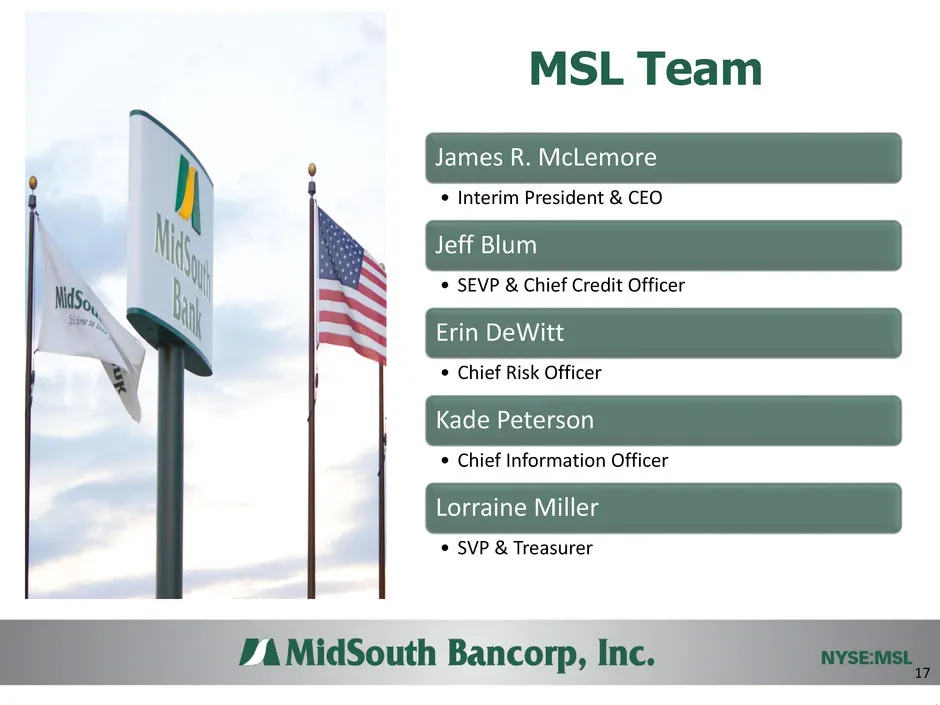
MSL Team 17 James R. McLemore • Interim President & CEO Jeff Blum • SEVP & Chief Credit Officer Erin DeWitt • Chief Risk Officer Kade Peterson • Chief Information Officer Lorraine Miller • SVP & Treasurer
Slide 18: Appendix
Appendix 18
Slide 19: Energy Exploration
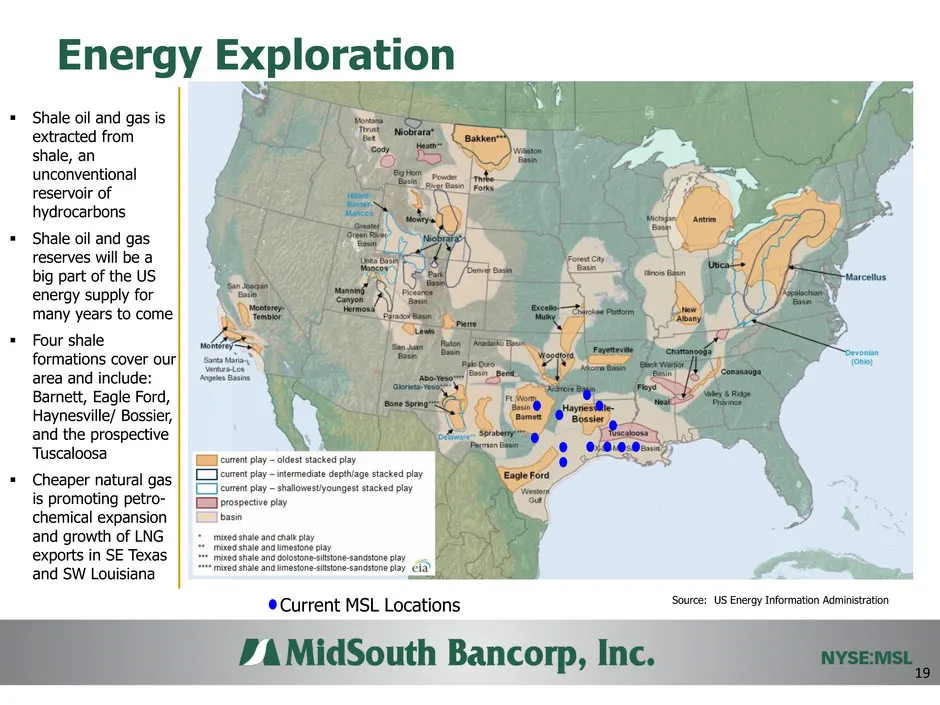
Energy Exploration Current MSL Locations Source: US Energy Information Administration Shale oil and gas is extracted from shale, an unconventional reservoir of hydrocarbons Shale oil and gas reserves will be a big part of the US energy supply for many years to come Four shale formations cover
Slide 20: Energy Lending – Portfolio Characteristics
Energy Lending – Portfolio Characteristics No Reserve-Based Lending / Redeterminations Two SNCs - $14.2 million (6.1% of energy loans) Substandard – downgraded 3Q16 With exception of one loan i/a/o $11.2 million, all of top 25 lending relationships have personal guarantees 20
Slide 21: Energy Loans – All Inclusive Definition
Energy Loans – All Inclusive Definition Total energy and energy related exposure of $231.8 million or 18.2% of loans Includes both Direct C&I and other non-C&I categories Commercial Real Estate (CRE) - $34.9 MM 15.1% of Energy Loans 94.5% of CRE is Owner Occupied Residential Real Estate
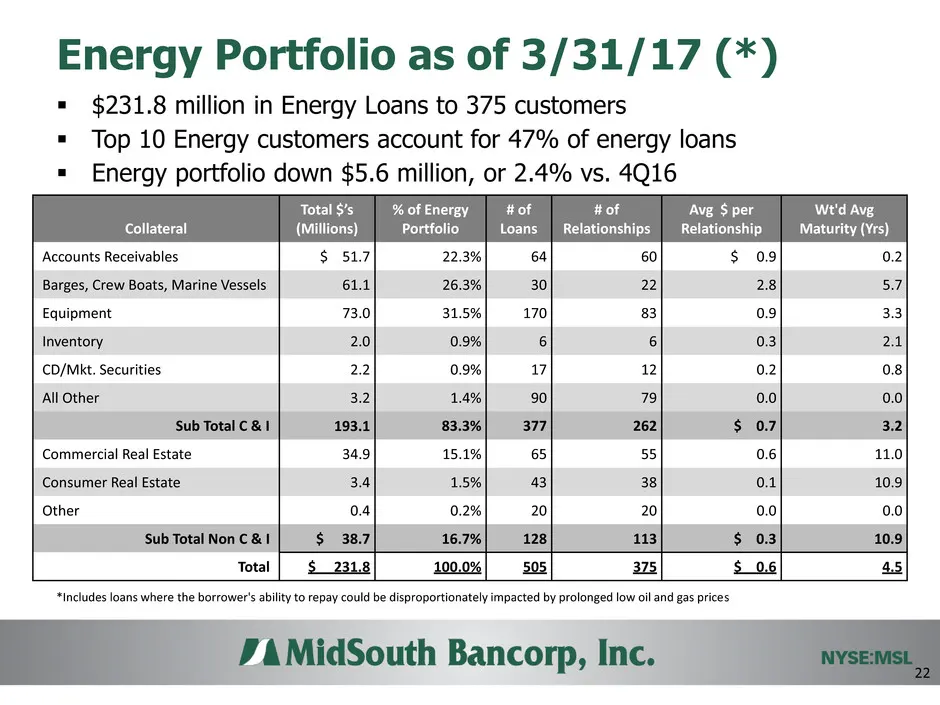
Slide 22: Energy Portfolio as of 3/31/17
Energy Portfolio as of 3/31/17 (*) $231.8 million in Energy Loans to 375 customers Top 10 Energy customers account for 47% of energy loans Energy portfolio down $5.6 million, or 2.4% vs. 4Q16 *Includes loans where the borrower's ability to repay could be disproportionately impacted by prolonge
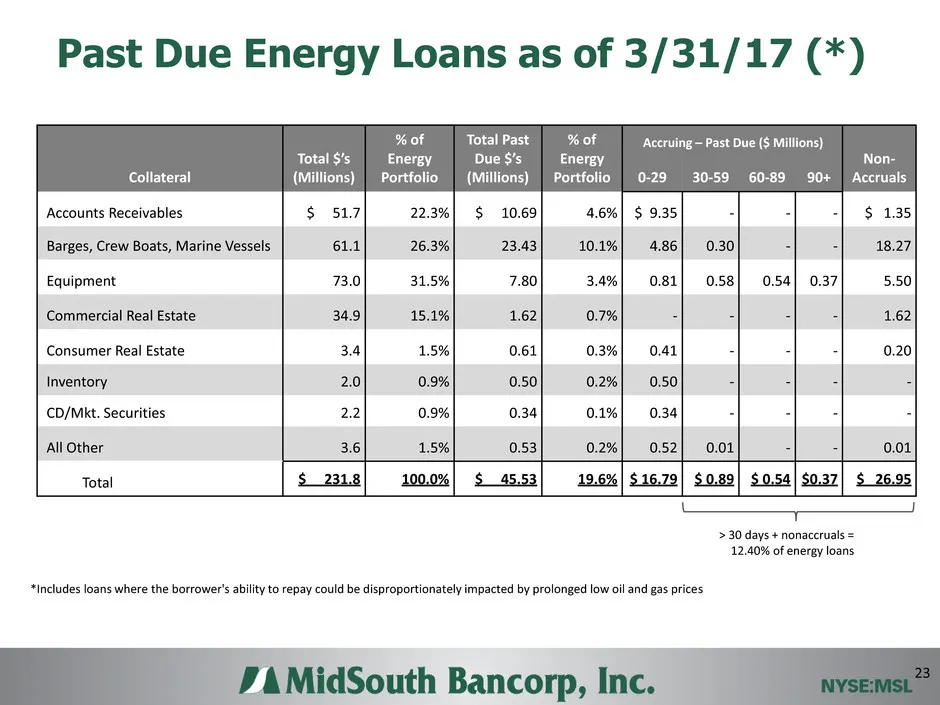
Slide 23: Past Due Energy Loans as of 3/31/17
Past Due Energy Loans as of 3/31/17 (*) *Includes loans where the borrower's ability to repay could be disproportionately impacted by prolonged low oil and gas prices > 30 days + nonaccruals = 12.40% of energy loans 23 Collateral Total $’s (Millions) % of Energy Portfolio Total Past Due $’s (Million
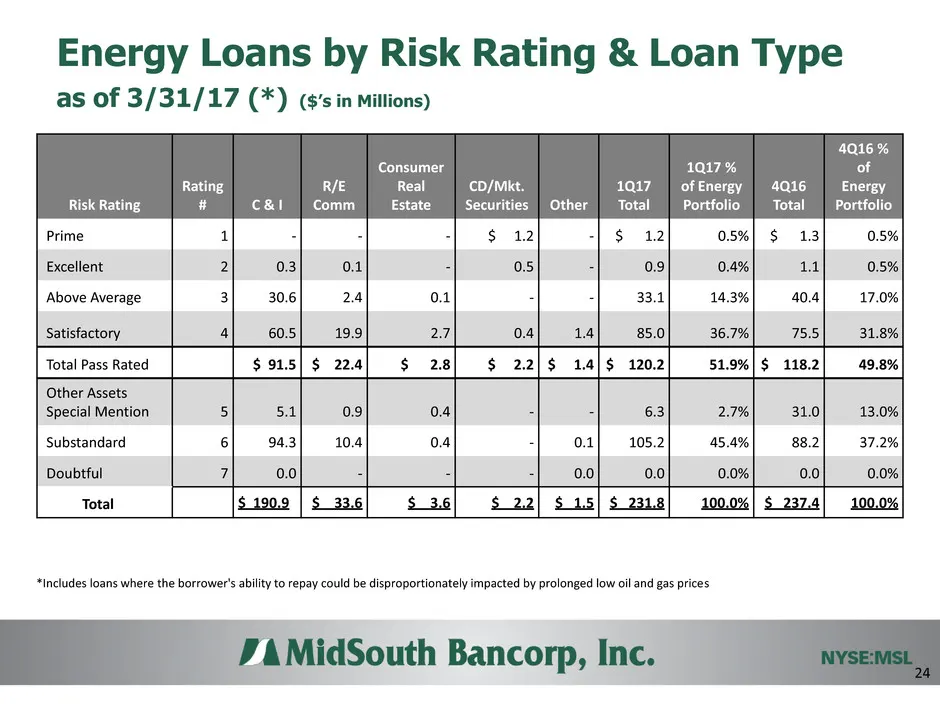
Slide 24: Energy Loans by Risk Rating & Loan Type
Energy Loans by Risk Rating & Loan Type as of 3/31/17 (*) ($’s in Millions) *Includes loans where the borrower's ability to repay could be disproportionately impacted by prolonged low oil and gas prices 24 Risk Rating Rating # C & I R/E Comm Consumer Real Estate CD/Mkt. Securities Other 1Q17 Total 1
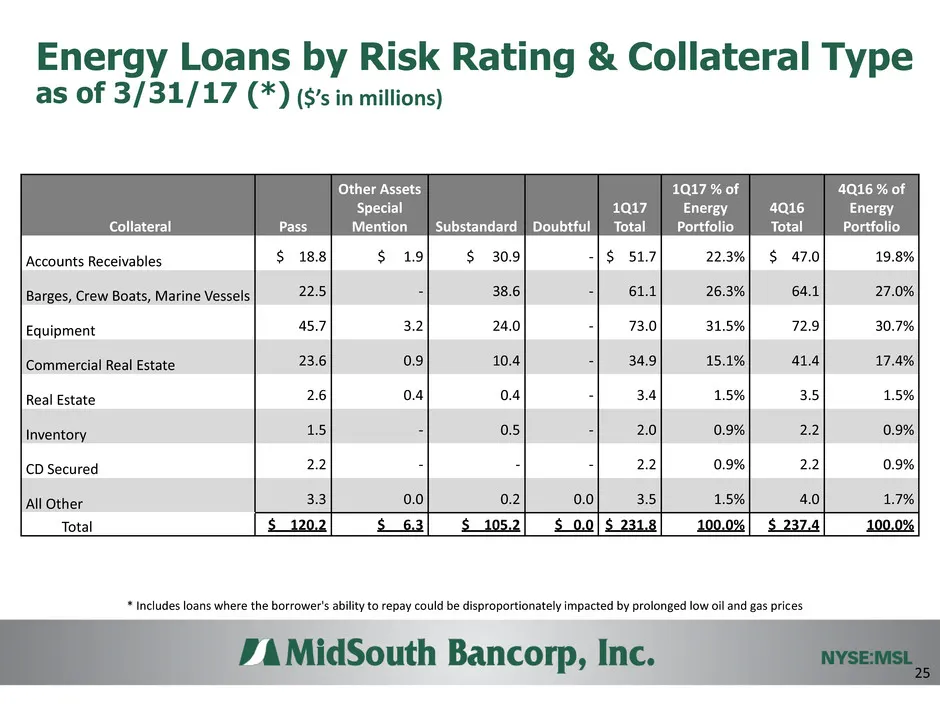
Slide 25: Energy Loans by Risk Rating & Collateral Type
Energy Loans by Risk Rating & Collateral Type as of 3/31/17 (*) * Includes loans where the borrower's ability to repay could be disproportionately impacted by prolonged low oil and gas prices 25 ($’s in millions) Collateral Pass Other Assets Special Mention Substandard Doubtful 1Q17 Total 1Q17 % of
Slide 26: Energy Loans by Type of Facility
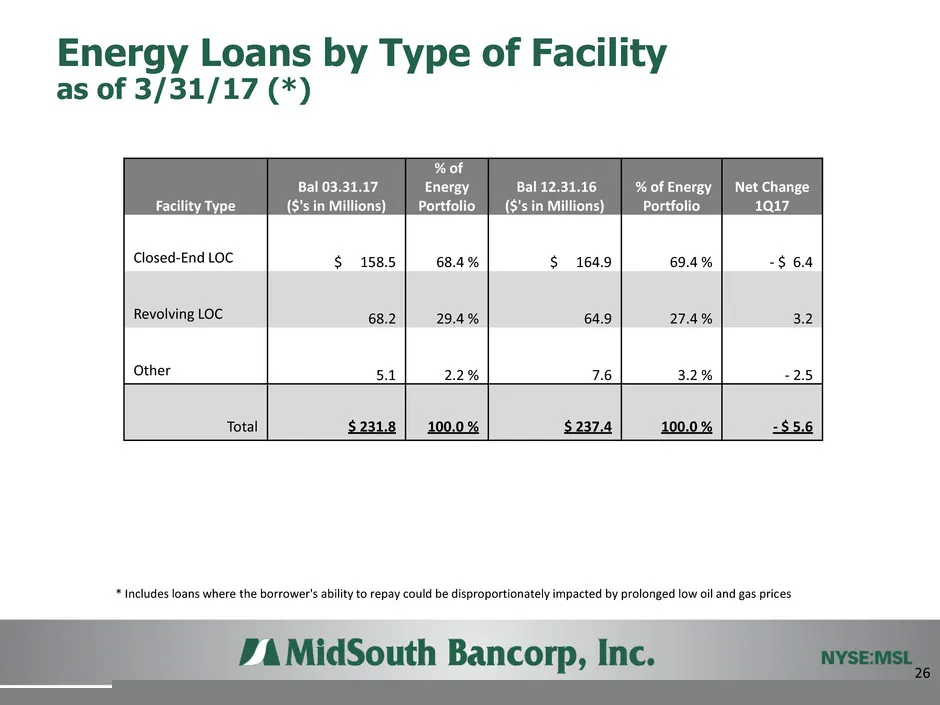
Energy Loans by Type of Facility as of 3/31/17 (*) * Includes loans where the borrower's ability to repay could be disproportionately impacted by prolonged low oil and gas prices 26 Facility Type Bal 03.31.17 ($'s in Millions) % of Energy Portfolio Bal 12.31.16 ($'s in Millions) % of Energy Portfoli
Slide 27: Unfunded Commitments on Energy Loans
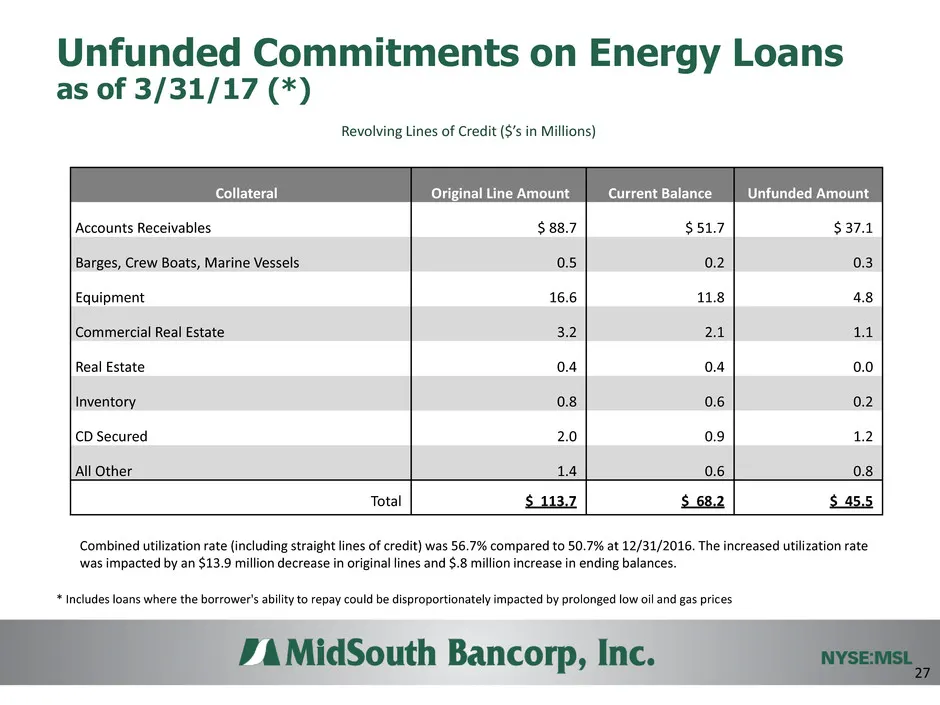
Unfunded Commitments on Energy Loans as of 3/31/17 (*) * Includes loans where the borrower's ability to repay could be disproportionately impacted by prolonged low oil and gas prices 27 Revolving Lines of Credit ($’s in Millions) Collateral Original Line Amount Current Balance Unfunded Amount Accoun
Slide 28: Financial Highlights
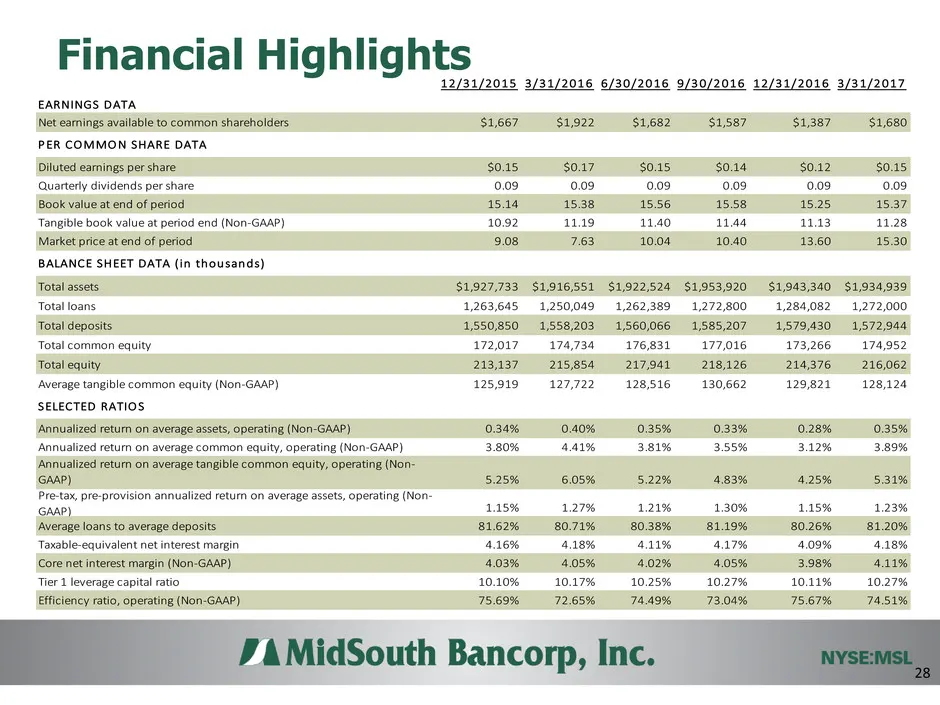
Financial Highlights 28 12/31/2015 3/31/2016 6/30/2016 9/30/2016 12/31/2016 3/31/2017 EARNINGS DATA Net earnings available to common shareholders $1,667 $1,922 $1,682 $1,587 $1,387 $1,680 PER COMMON SHARE DATA Diluted earnings per share $0.15 $0.17 $0.15 $0.14 $0.12 $0.15 Quarterly dividends per sha
Slide 29: Reconciliation of Non-GAAP Financial Measures
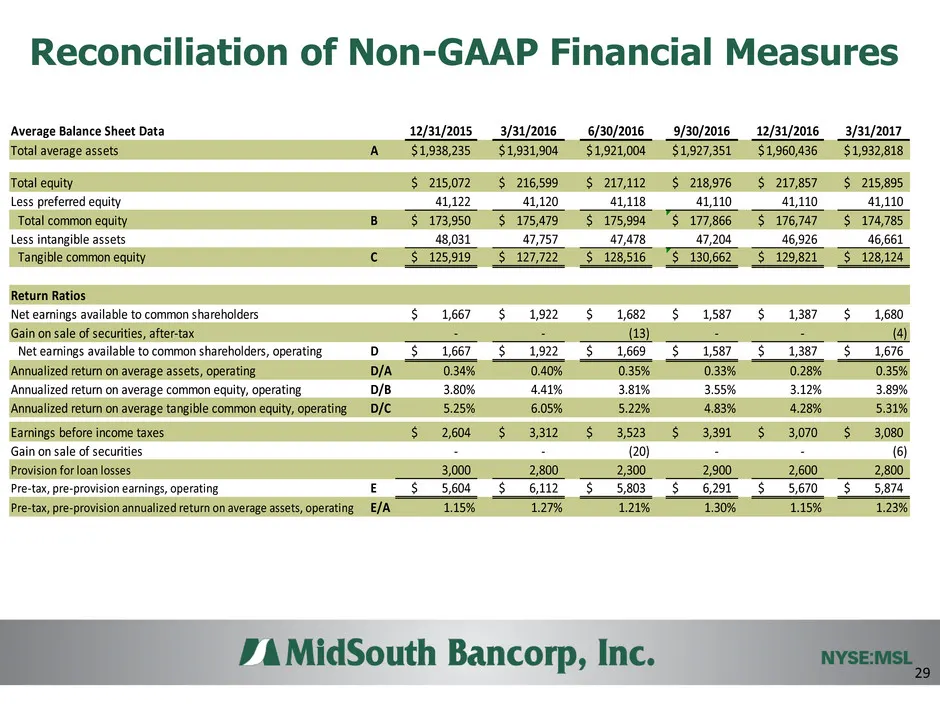
Reconciliation of Non-GAAP Financial Measures 29 Average Balance Sheet Data 12/31/2015 3/31/2016 6/30/2016 9/30/2016 12/31/2016 3/31/2017 Total average assets A 1,938,235$ 1,931,904$ 1,921,004$ 1,927,351$ 1,960,436$ 1,932,818$ Total equity 215,072$ 216,599$ 217,112$ 218,976$ 217,857$ 215,895$ Less p
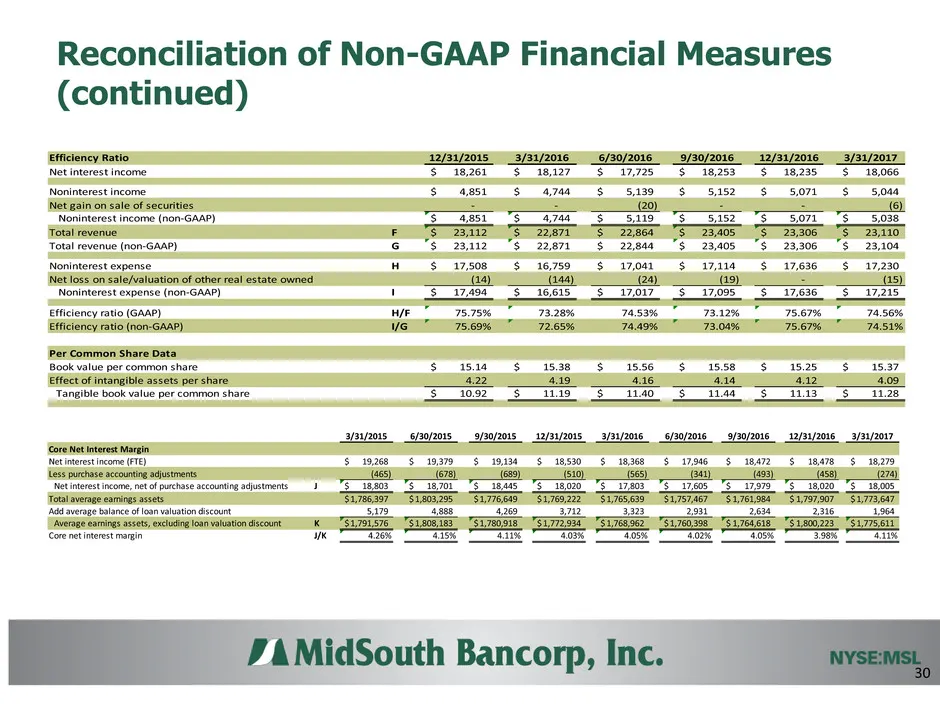
Slide 30: Reconciliation of Non-GAAP Financial Measures (continued)
Reconciliation of Non-GAAP Financial Measures (continued) 30 3/31/2015 6/30/2015 9/30/2015 12/31/2015 3/31/2016 6/30/2016 9/30/2016 12/31/2016 3/31/2017 Core Net Interest Margin Net interest income (FTE) 19,268$ 19,379$ 19,134$ 18,530$ 18,368$ 17,946$ 18,472$ 18,478$ 18,279$ Less purchase accounting
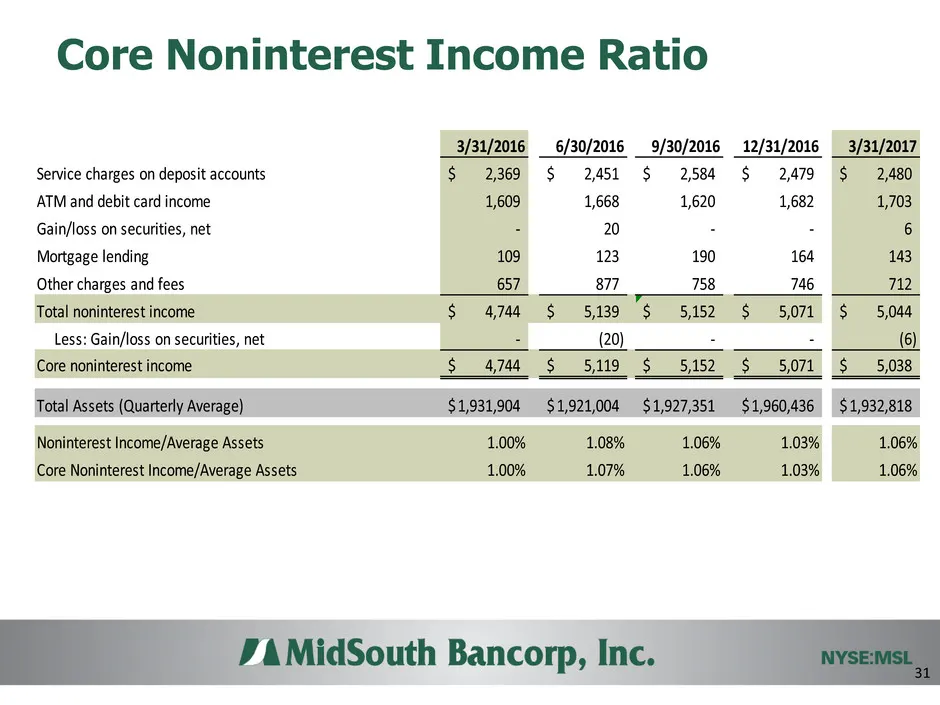
Slide 31: Core Noninterest Income Ratio
Core Noninterest Income Ratio 31 3/31/2016 6/30/2016 9/30/2016 12/31/2016 3/31/2017 Service charges on deposit accounts 2,369$ 2,451$ 2,584$ 2,479$ 2,480$ ATM and debit card income 1,609 1,668 1,620 1,682 1,703 Gain/loss on securities, net - 20 - - 6 Mortgage lending 109 123 190 164 143 Other charge
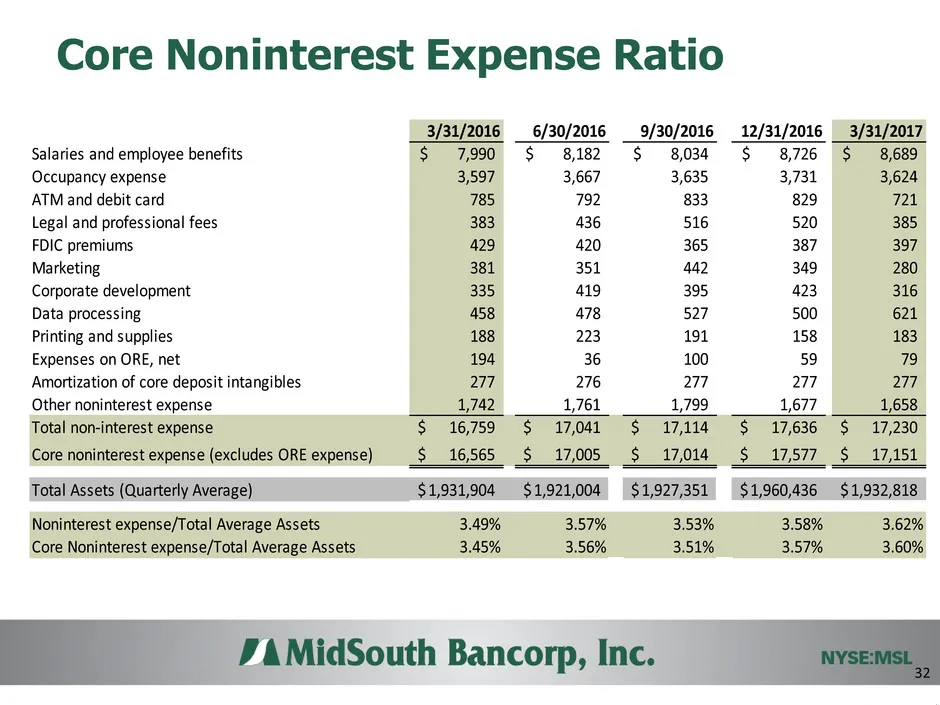
Slide 32: Core Noninterest Expense Ratio
Core Noninterest Expense Ratio 32 3/31/2016 6/30/2016 9/30/2016 12/31/2016 3/31/2017 Salaries and employee benefits 7,990$ 8,182$ 8,034$ 8,726$ 8,689$ Occupancy expense 3,597 3,667 3,635 3,731 3,624 ATM and debit card 785 792 833 829 721 Legal and professional fees 383 436 516 520 385 FDIC premiums
Source: SEC EDGAR · 8-K filed May 8, 2017
More decks from MidSouth Bancorp Inc
 IPO Roadshow (June 2017)36 slides · Jun 7, 2017
 Shareholder Meeting (May 2017)12 slides · May 24, 2017
 Gulf South Bank Conference 201319 slides · May 14, 2013
 Merger or Acquisition (September 2012)11 slides · Sep 27, 2012
 Q3 2011 Earnings Presentation6 slides · Oct 26, 2011
 IPO Roadshow (December 2009)22 slides · Dec 9, 2009