South Jersey Industries — IDEAS Conference – Chicago 2016
23 slides from South Jersey Industries's conference presentation, Aug 31, 2016

Slide 1: South Jersey Industries IDEAS Conference – Chicago
South Jersey Industries IDEAS Conference – Chicago August 31, 2016
Slide 2: Forward Looking Statements
Forward Looking Statements Certain statements contained in this presentation may qualify as “forward-looking statements” within the meaning of Section 27A of the Securities Act of 1933 and Section 21E of the Securities Exchange Act of 1934. All statements other than statements of historical fact sho

Slide 3: South Jersey Industries Business Overview
South Jersey Industries Business Overview
Slide 4: South Jersey Industries business segments
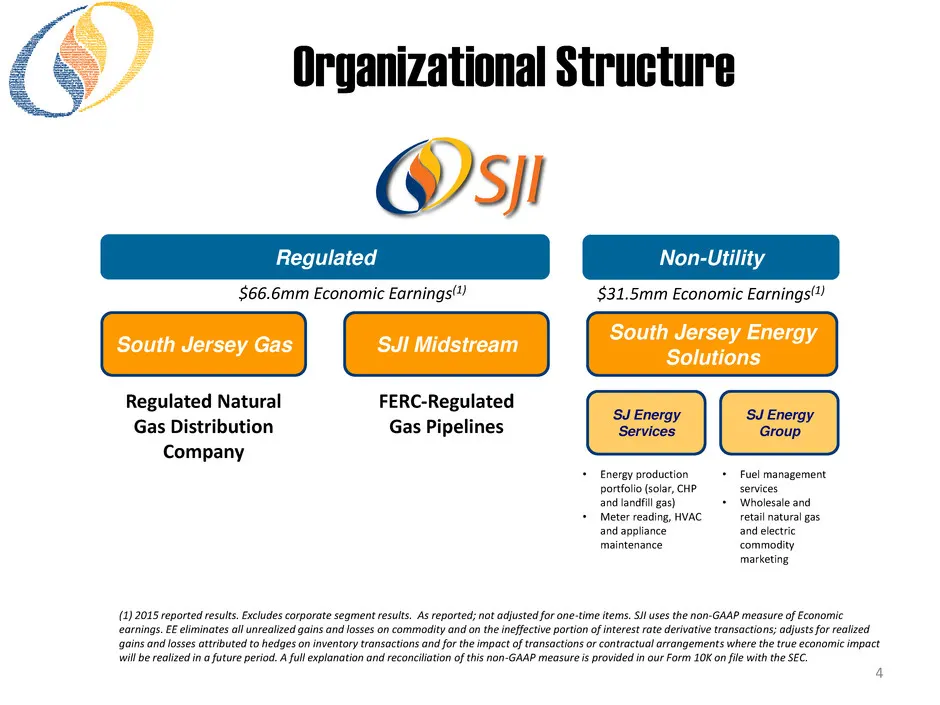
4 South Jersey Gas SJI Midstream South Jersey Energy Solutions Regulated Natural Gas Distribution Company FERC-Regulated Gas Pipelines SJ Energy Services SJ Energy Group • Energy production portfolio (solar, CHP and landfill gas) • Meter reading, HVAC and appliance maintenance • Fuel management serv
Slide 5: Selected Financial Data
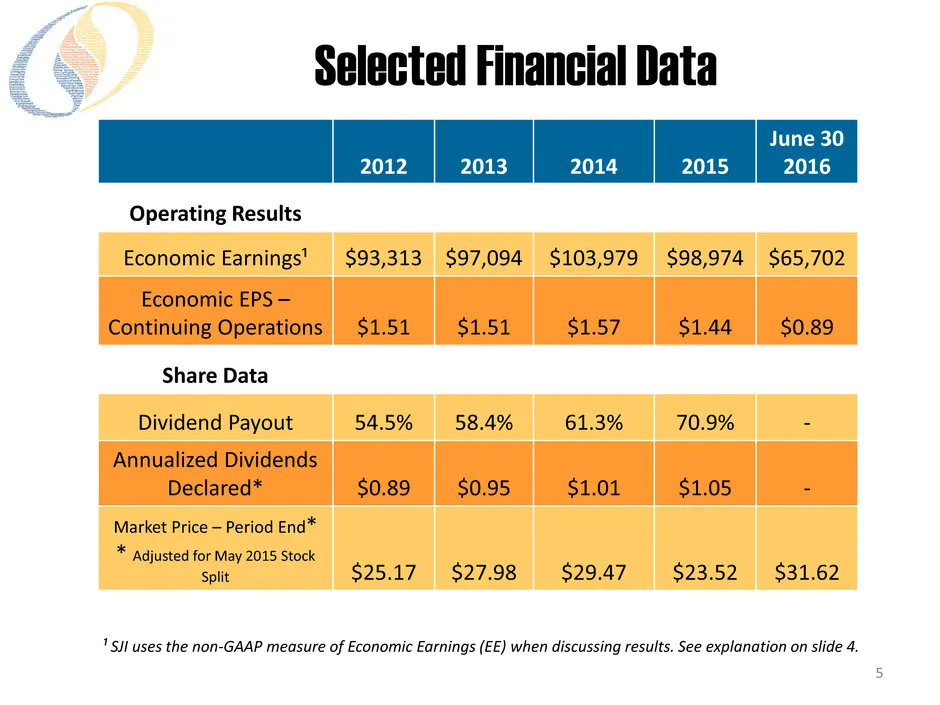
2012 2013 2014 2015 June 30 2016 Operating Results Economic Earnings¹ $93,313 $97,094 $103,979 $98,974 $65,702 Economic EPS – Continuing Operations $1.51 $1.51 $1.57 $1.44 $0.89 Share Data Dividend Payout 54.5% 58.4% 61.3% 70.9% - Annualized Dividends Declared* $0.89 $0.95 $1.01 $1.05 - Market Price
Slide 6: Strategic Priorities
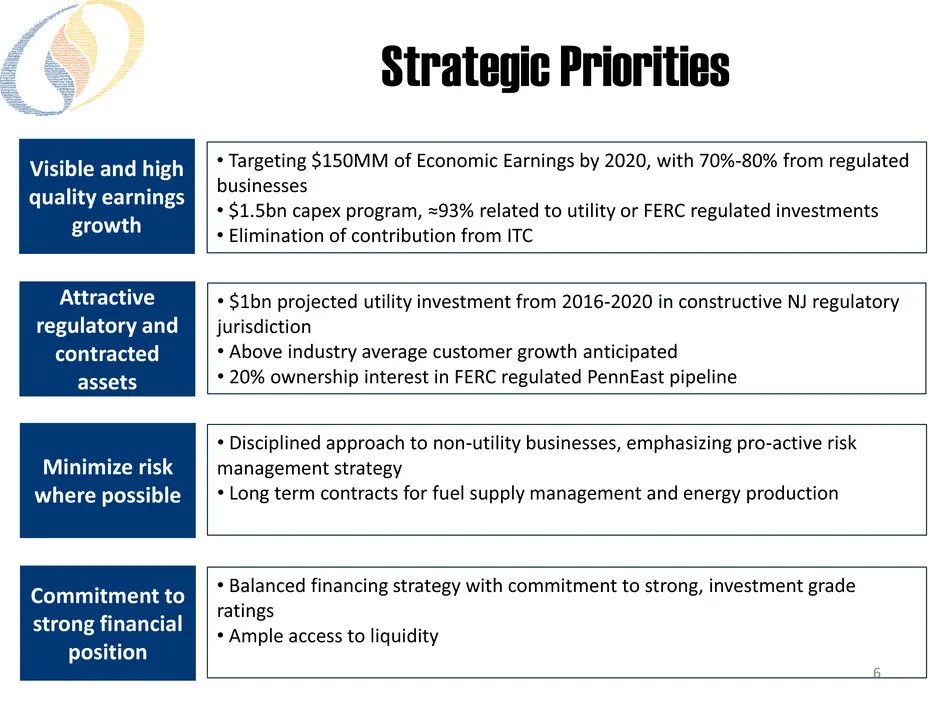
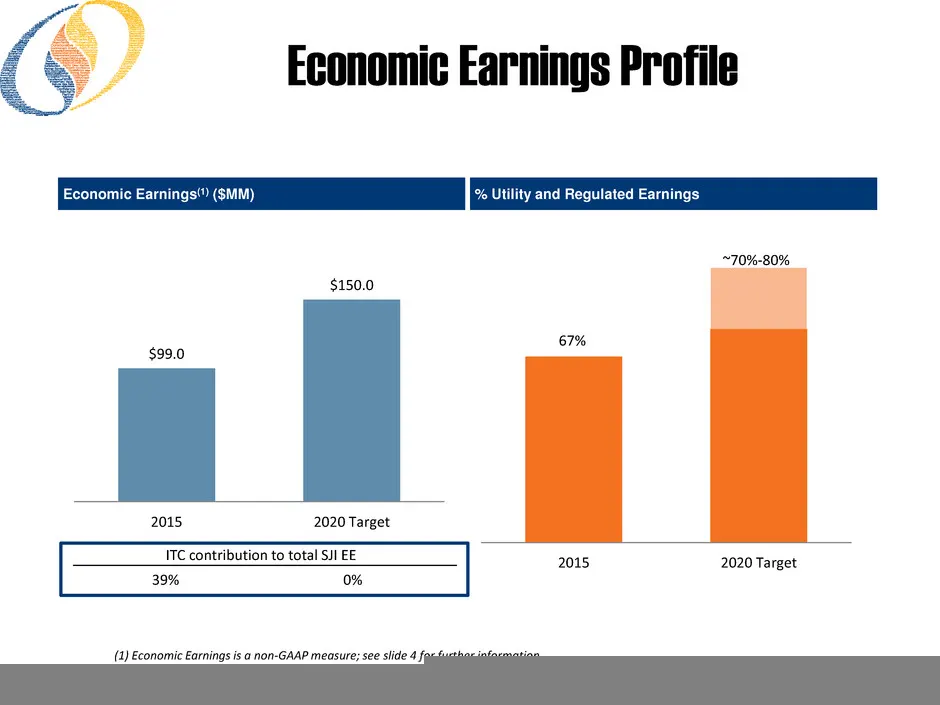
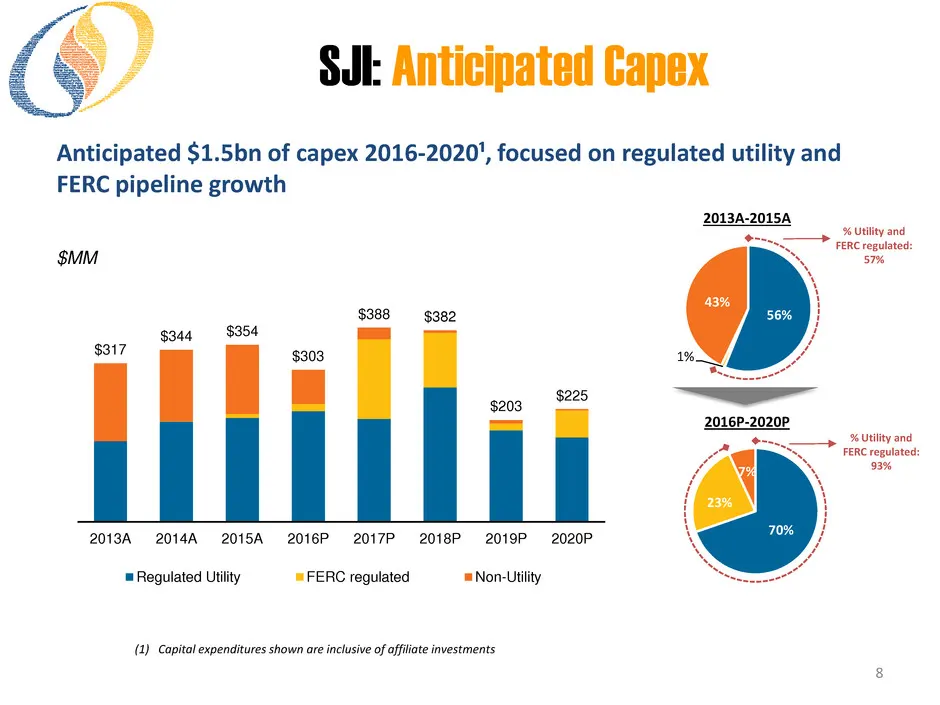
Strategic Priorities • Targeting $150MM of Economic Earnings by 2020, with 70%-80% from regulated businesses • $1.5bn capex program, ≈93% related to utility or FERC regulated investments • Elimination of contribution from ITC • Balanced financing strategy with commitment to strong, investment grade
Slide 7: Economic Earnings Profile
Economic Earnings Profile 7 (1) Economic Earnings is a non-GAAP measure; see slide 4 for further information. $99.0 $150.0 2015 2020 Target Economic Earnings(1) ($MM) % Utility and Regulated Earnings 67% ~70%-80% 2015 2020 TargetITC contribution to total SJI EE 39% 0%
Slide 8: SJI: Anticipated Capex
70% 23% 7% 56% 1% 43% 8 $MM Anticipated $1.5bn of capex 2016-2020¹, focused on regulated utility and FERC pipeline growth (1) Capital expenditures shown are inclusive of affiliate investments 2013A-2015A 2016P-2020P % Utility and FERC regulated: 57% % Utility and FERC regulated: 93% $317 $344 $354 $
Slide 9: South Jersey Gas
ages ‘itrastracta Sollaboraite i fe rarely GreenFamily ‘“Sinfre ire Bera | Seer US eae Barts, Gee Service Bonaisteney ince a COTA y Strong Soak Family” siren Cormunity change’ cellencel i! srowth eeeere er Valdes Sait ann Nawal gs gale, efficient paver ae Ques" Shange Beaty. ‘Bel Smit nemabletniZsv"
Slide 10: Regulated Utility Profile
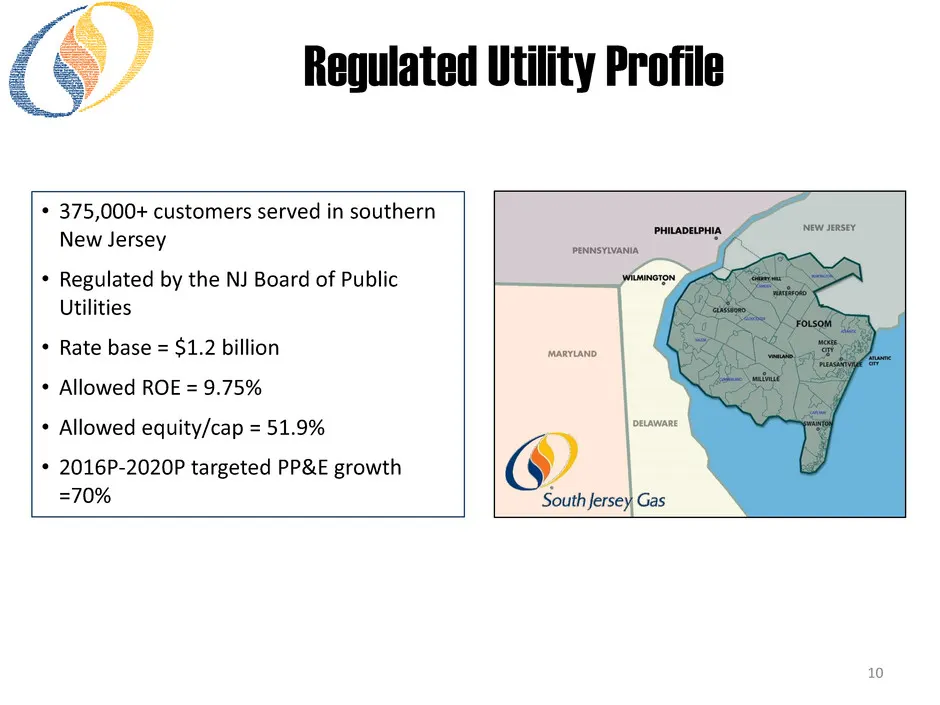
10 • 375,000+ customers served in southern New Jersey • Regulated by the NJ Board of Public Utilities • Rate base = $1.2 billion • Allowed ROE = 9.75% • Allowed equity/cap = 51.9% • 2016P-2020P targeted PP&E growth =70% Regulated Utility Profile
Slide 11: Utility Growth Drivers
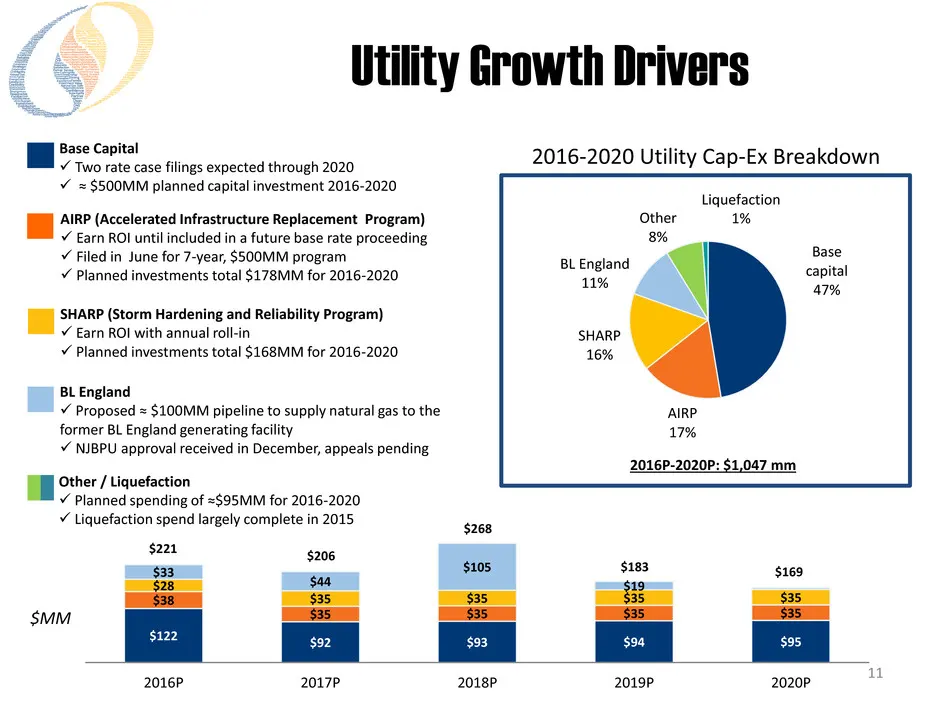
11 $122 $92 $93 $94 $95 $38 $35 $35 $35 $35 $28 $35 $35 $35 $35 $33 $44 $105 $19 $206 $268 $183 $169 2016P 2017P 2018P 2019P 2020P $221 Utility Growth Drivers Base Capital Two rate case filings expected through 2020 ≈ $500MM planned capital investment 2016-2020 Other / Liquefaction Planned spe
Slide 12: Utility Customer Trends and Drivers
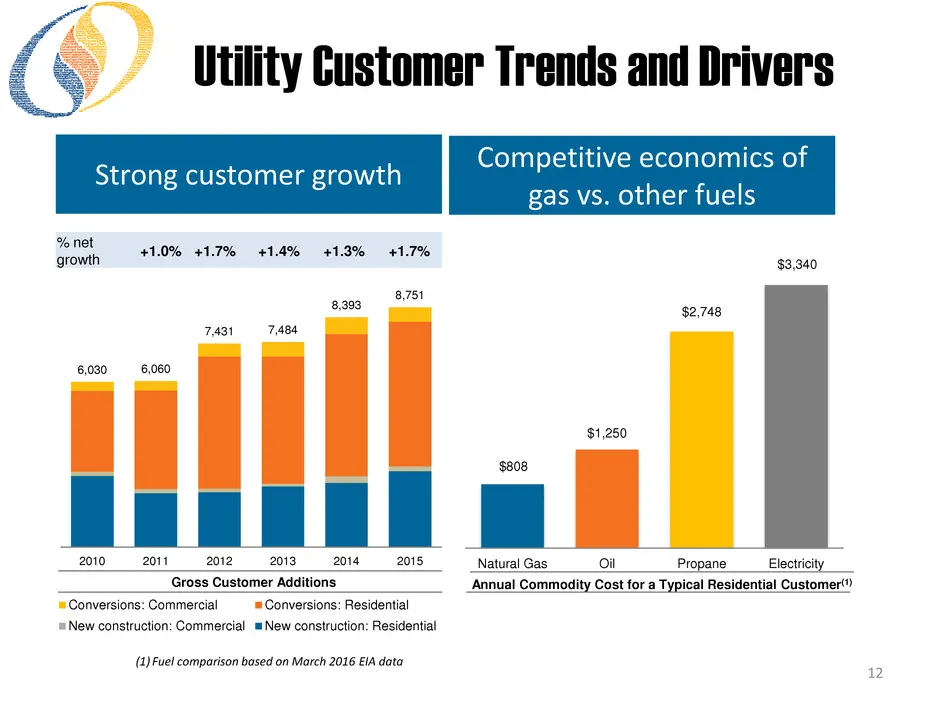
Conversions: Commercial Conversions: Residential New construction: Commercial New construction: Residential 12 % net growth +1.0% +1.7% +1.4% +1.3% +1.7% Strong customer growth $808 $1,250 $2,748 $3,340 Natural Gas Oil Propane Electricity Competitive economics of gas vs. other fuels (1) Fuel compari

Slide 13: SJI Midstream
ages ntegstratta anise ‘Ore Safect ‘ani Rey GreenFamily ‘infra: ire ve dafaeetueure, S' cellenceFamil iivestinent Value 2s Natural Gas Safe Efficient, Deliver aural Ga a, Efficin teen lence San see Balaraaniey LS wate” sane bat Eyer Pr crea Renewabletody” SJl Midstream
Slide 14: PennEast Pipeline Project
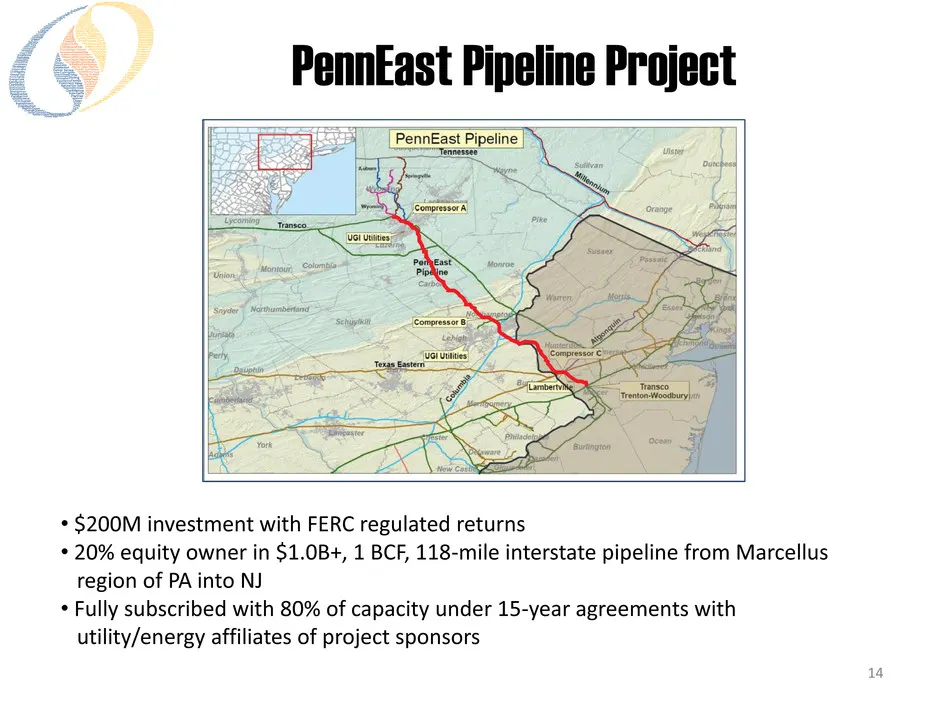
14 PennEast Pipeline Project • $200M investment with FERC regulated returns • 20% equity owner in $1.0B+, 1 BCF, 118-mile interstate pipeline from Marcellus region of PA into NJ • Fully subscribed with 80% of capacity under 15-year agreements with utility/energy affiliates of project sponsors
Slide 15: PennEast Pipeline Project
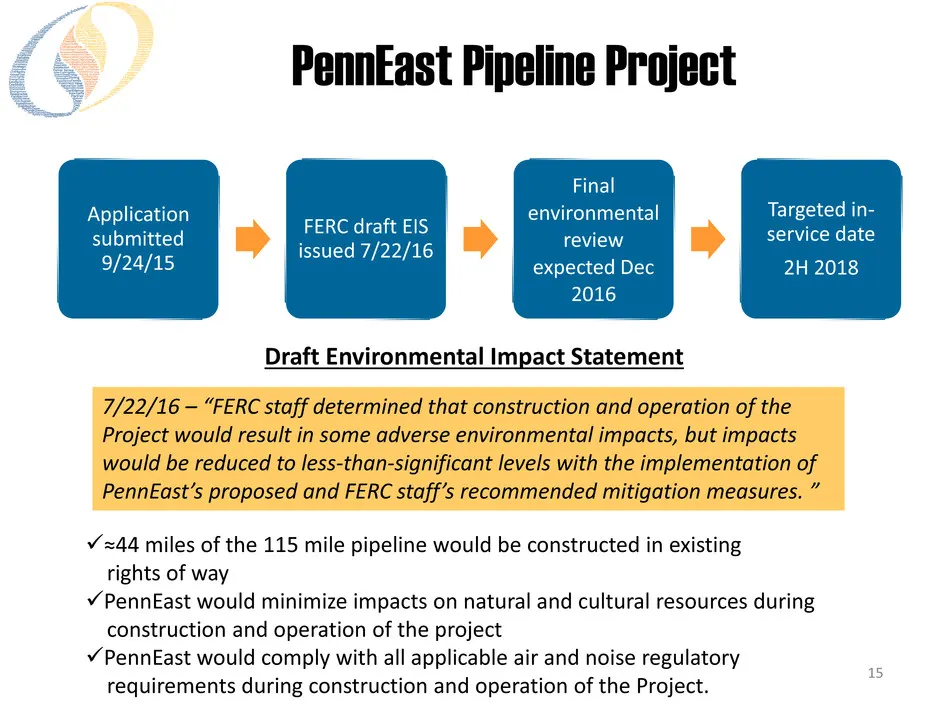
15 PennEast Pipeline Project Application submitted 9/24/15 FERC draft EIS issued 7/22/16 Final environmental review expected Dec 2016 Targeted in- service date 2H 2018 Draft Environmental Impact Statement 7/22/16 – “FERC staff determined that construction and operation of the Project would result in
Slide 16: South Jersey Energy Solutions
South Jersey Energy Solutions
Slide 17: South Jersey Energy Solutions business overview
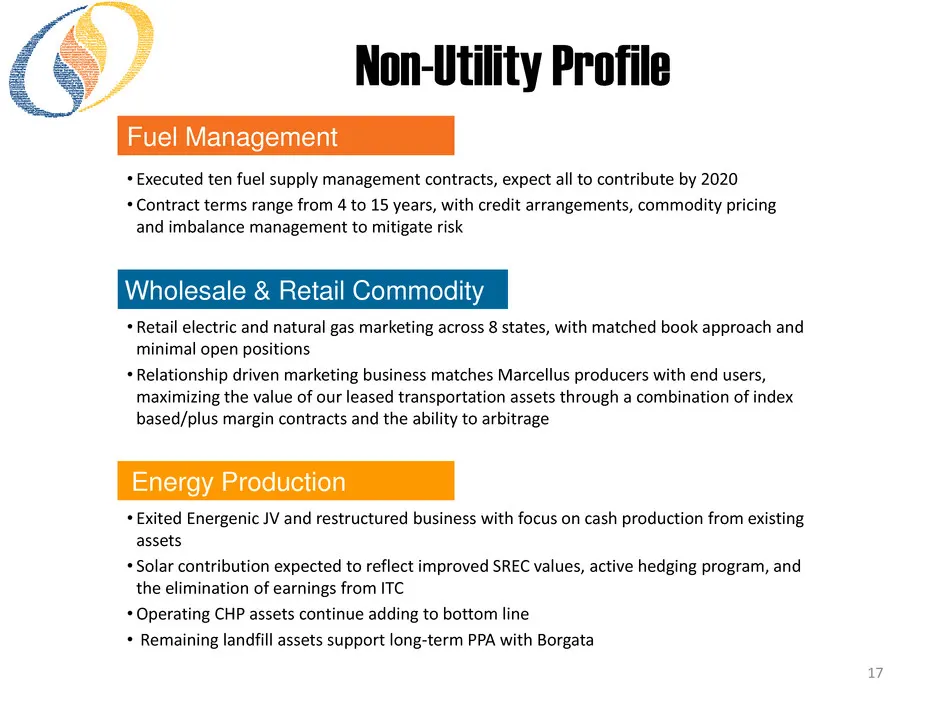
17 • Retail electric and natural gas marketing across 8 states, with matched book approach and minimal open positions • Relationship driven marketing business matches Marcellus producers with end users, maximizing the value of our leased transportation assets through a combination of index based/plu
Slide 18: Non-Utility Growth Summary
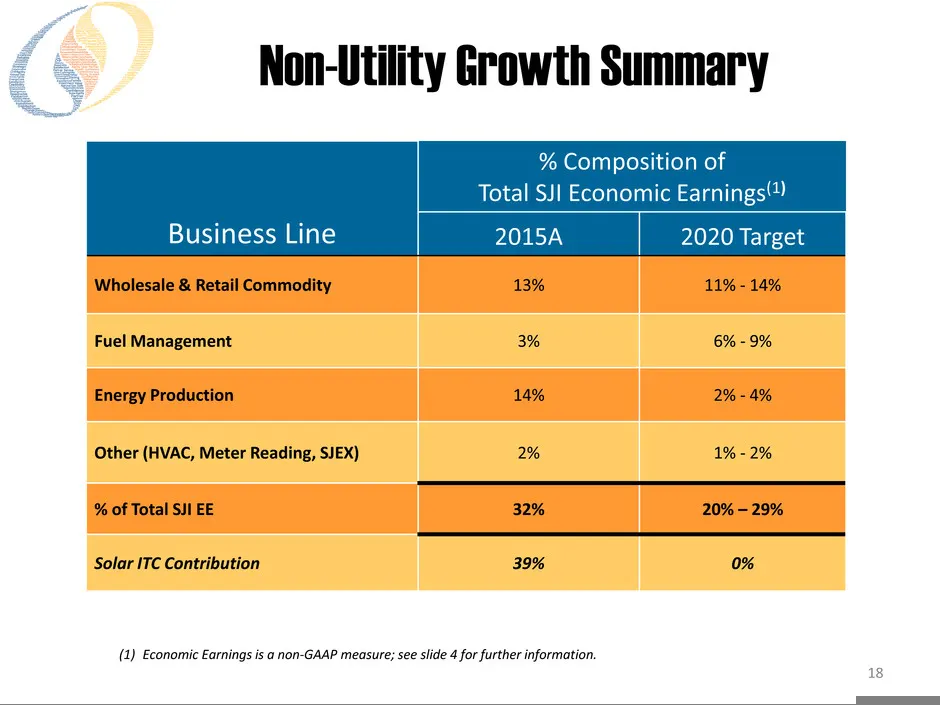
18 Business Line % Composition of Total SJI Economic Earnings(1) 2015A 2020 Target Wholesale & Retail Commodity 13% 11% - 14% Fuel Management 3% 6% - 9% Energy Production 14% 2% - 4% Other (HVAC, Meter Reading, SJEX) 2% 1% - 2% % of Total SJI EE 32% 20% – 29% Solar ITC Contribution 39% 0% (1) Econom
Slide 19: Fuel Supply Management
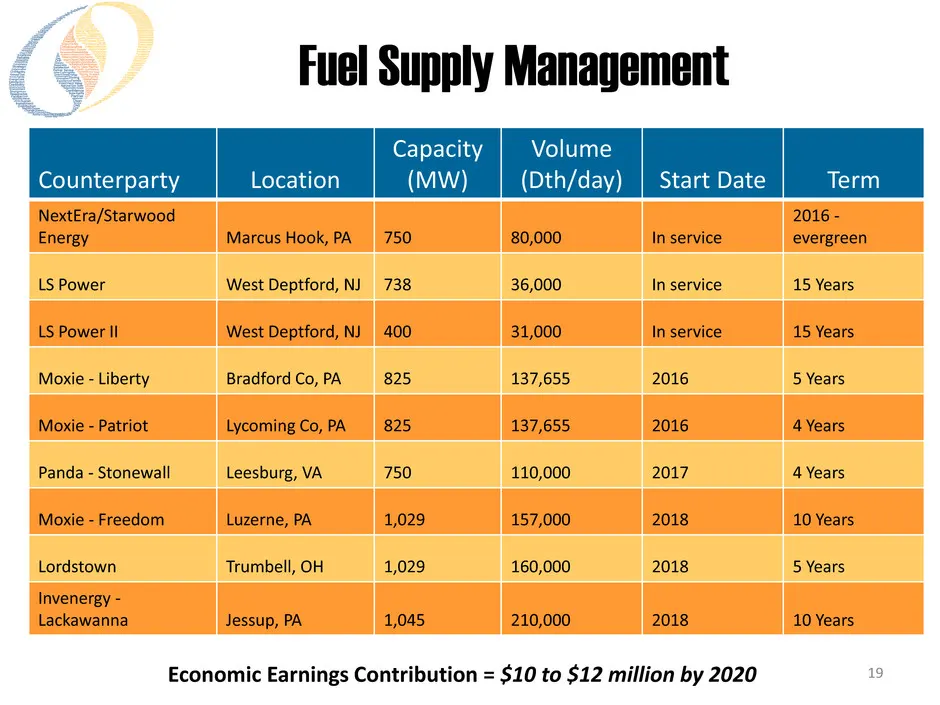
19 Counterparty Location Capacity (MW) Volume (Dth/day) Start Date Term NextEra/Starwood Energy Marcus Hook, PA 750 80,000 In service 2016 - evergreen LS Power West Deptford, NJ 738 36,000 In service 15 Years LS Power II West Deptford, NJ 400 31,000 In service 15 Years Moxie - Liberty Bradford Co, P
Slide 20: South Jersey Industries Performance / Projections
South Jersey Industries Performance / Projections
Slide 21: YTD 2016 Performance as of 6/30/16
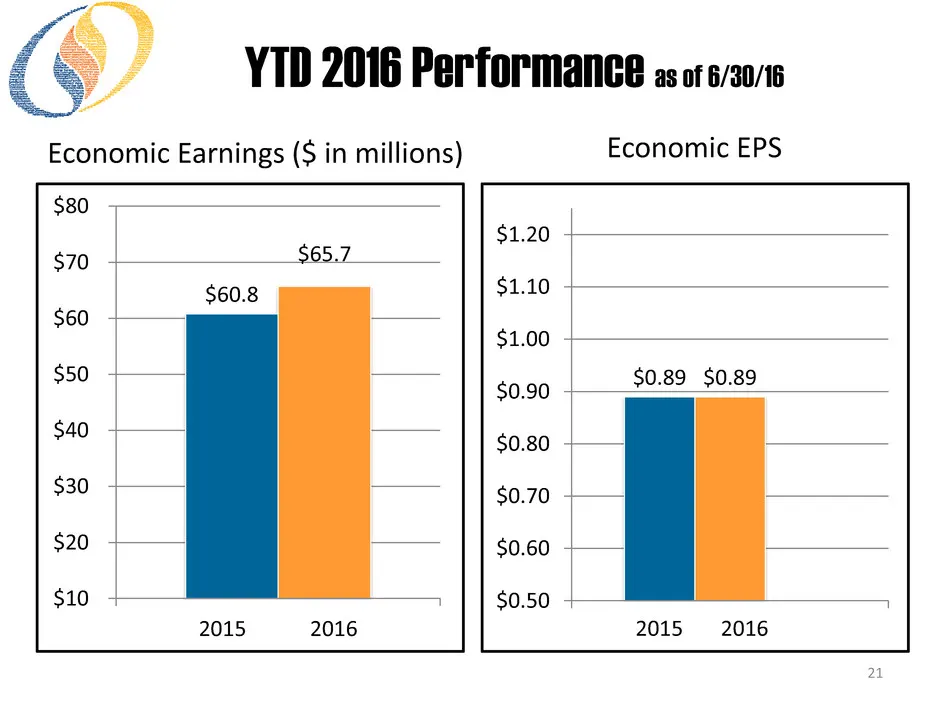
$60.8 $65.7 $10 $20 $30 $40 $50 $60 $70 $80 2015 2016 21 $0.89 $0.89 $0.50 $0.60 $0.70 $0.80 $0.90 $1.00 $1.10 $1.20 2015 20162015 2016 Economic Earnings ($ in millions) Economic EPS YTD 2016 Performance as of 6/30/16
Slide 22: Contribution to Economic Earnings
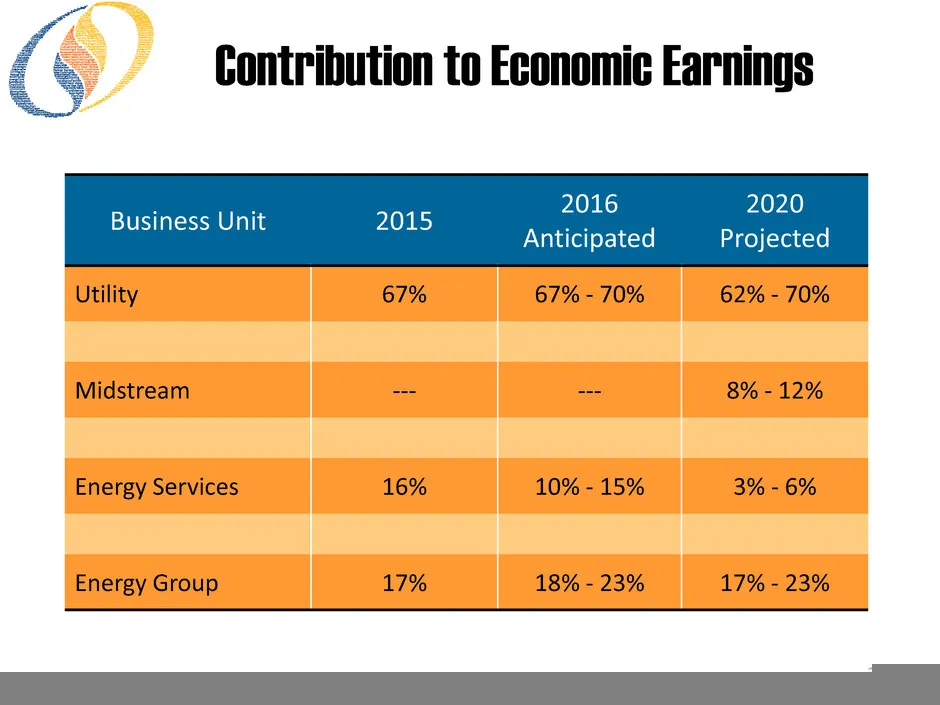
22 Business Unit 2015 2016 Anticipated 2020 Projected Utility 67% 67% - 70% 62% - 70% Midstream --- --- 8% - 12% Energy Services 16% 10% - 15% 3% - 6% Energy Group 17% 18% - 23% 17% - 23% Contribution to Economic Earnings
Slide 23: Performance Highlights/Drivers
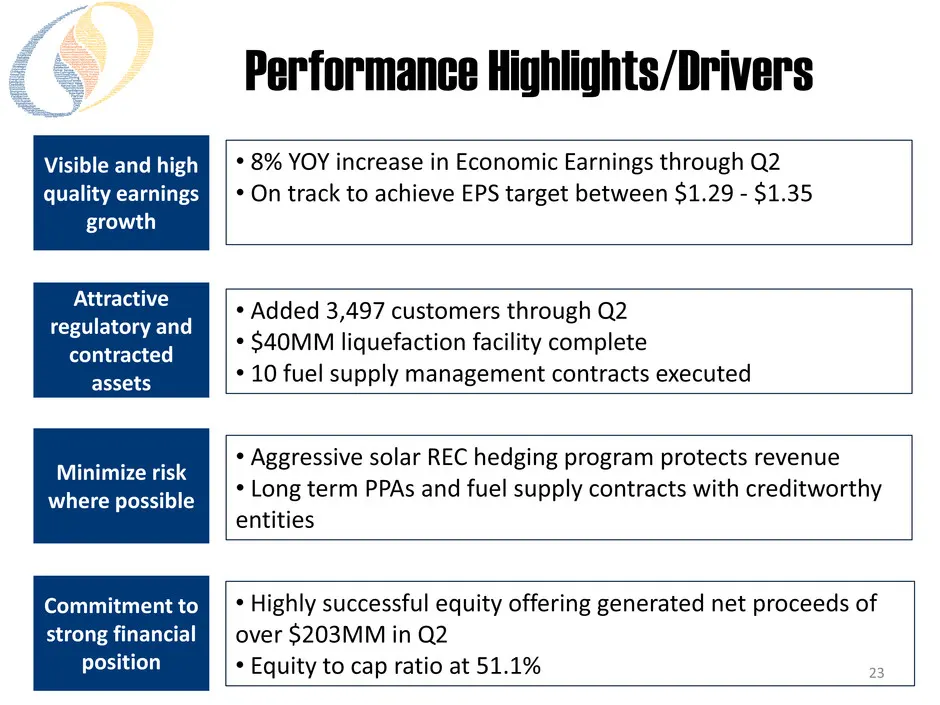
Performance Highlights/Drivers Visible and high quality earnings growth • 8% YOY increase in Economic Earnings through Q2 • On track to achieve EPS target between $1.29 - $1.35 • Highly successful equity offering generated net proceeds of over $203MM in Q2 • Equity to cap ratio at 51.1% 23 Attractiv
Source: SEC EDGAR · 8-K filed Aug 31, 2016
More decks from South Jersey Industries Inc
 FY2021 Earnings Presentation29 slides · Feb 24, 2022
 Q3 2021 Earnings Presentation31 slides · Nov 3, 2021
 Q2 2021 Earnings Presentation31 slides · Aug 4, 2021
 Investor Day (May 2021)88 slides · May 6, 2021
 FY2020 Earnings Presentation31 slides · Feb 24, 2021
 Q3 2020 Earnings Presentation37 slides · Nov 4, 2020