Arlington Asset Investment Corp
Arlington Asset Investment — Q1 2022 Earnings Presentation
32 slides from Arlington Asset Investment's earnings presentation, May 13, 2022
Slide 1: Investor Presentation First Quarter 2022
Investor Presentation First Quarter 2022 Exhibit 99.2
Slide 2: Information Related to Forward-Looking Statements
Information Related to Forward-Looking Statements Forward-looking statements are based on our beliefs, assumptions and expectations of our future performance, taking into account information currently in our possession. These beliefs, assumptions and expectations may change as a result of many possi
Slide 3: Contents
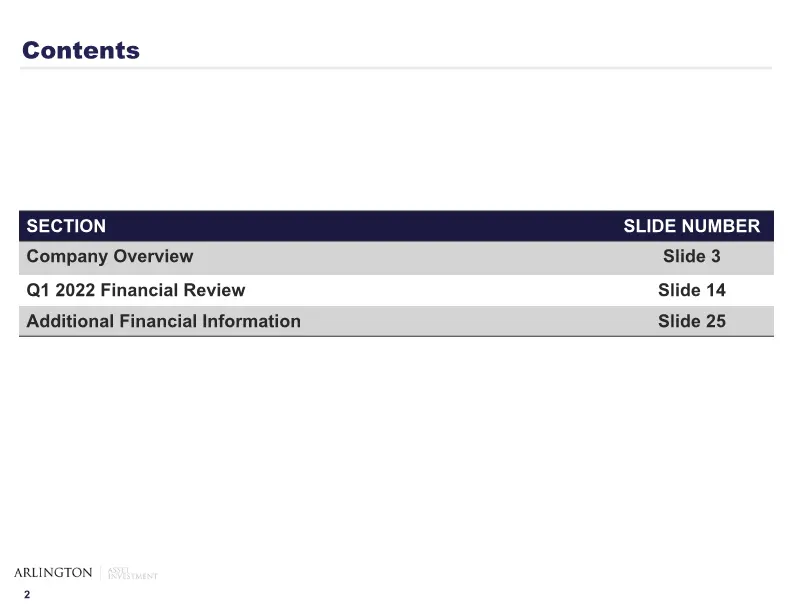
Contents Company Overview Slide 3 Q1 2022 Financial Review Slide 14 Additional Financial Information Slide 25 ARLINGTON 2
Slide 4: Company Overview
ARLINGTON Company Overview
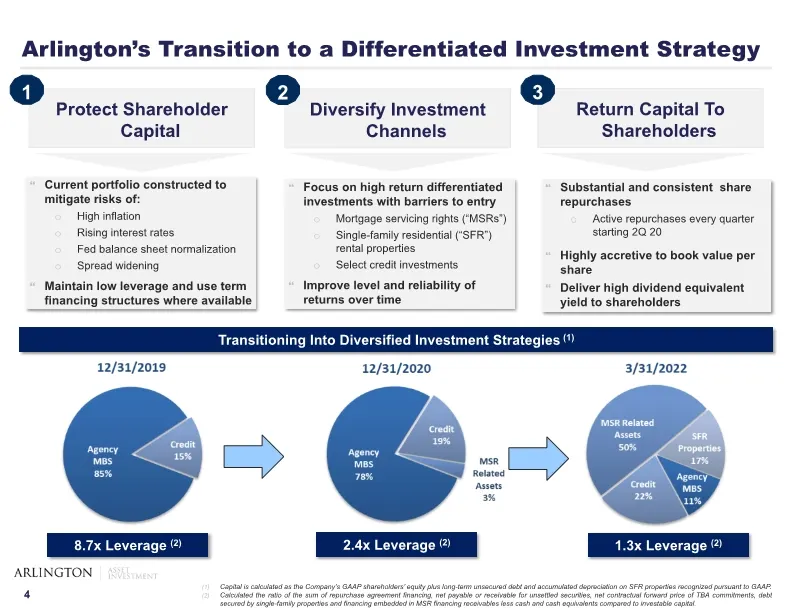
Slide 5: Arlington's Transition to a Differentiated Investment Strategy
Arlington’s Transition to a Differentiated Investment Strategy Return Capital To Shareholders 3 Focus on high return differentiated investments with barriers to entry Mortgage servicing rights (“MSRs”) Single-family residential (“SFR”) rental properties Select credit investments Improve level and re
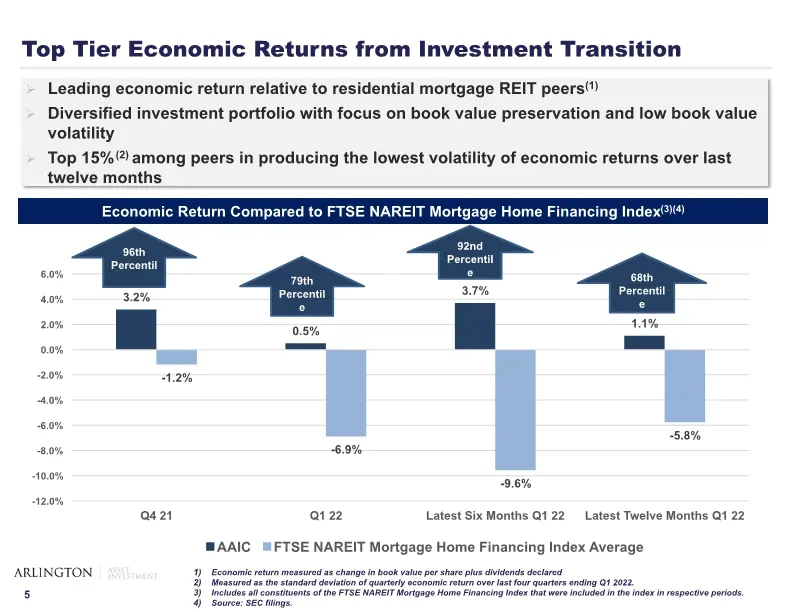
Slide 6: Top Tier Economic Returns from Investment Transition
Top Tier Economic Returns from Investment Transition Economic Return Compared to FTSE NAREIT Mortgage Home Financing Index(3)(4) Leading economic return relative to residential mortgage REIT peers(1) Diversified investment portfolio with focus on book value preservation and low book value volatility
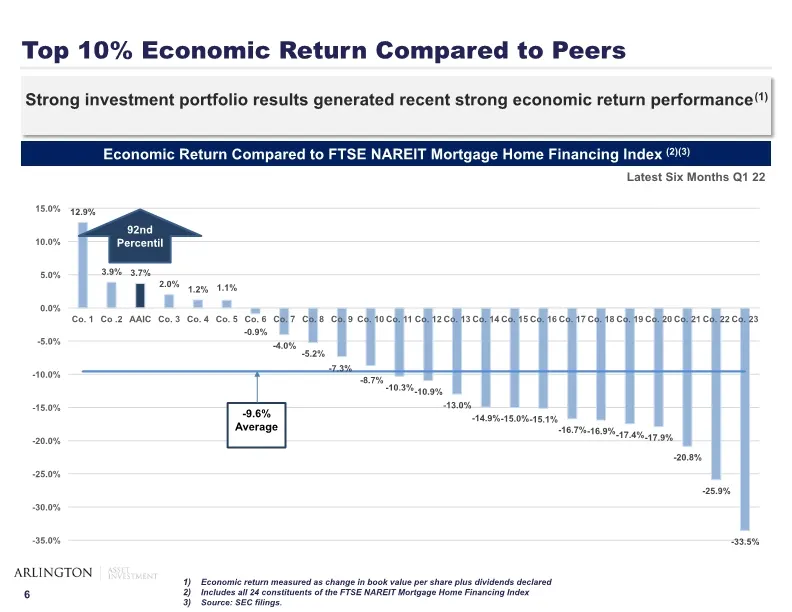
Slide 7: Top 10% Economic Return Compared to Peers
Top 10% Economic Return Compared to Peers Strong investment portfolio results generated recent strong economic return performance(1) Economic Return Compared to FTSE NAREIT Mortgage Home Financing Index (2)(3) Economic return measured as change in book value per share plus dividends declared Include
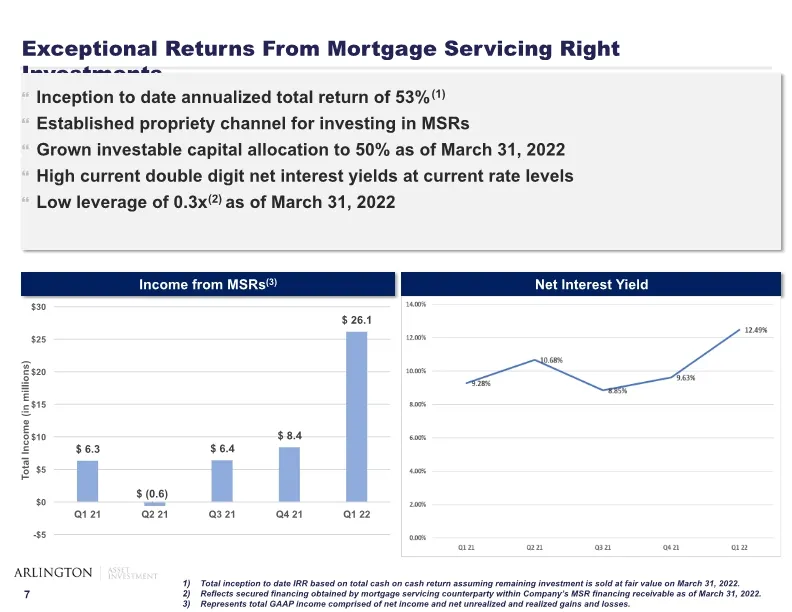
Slide 8: Exceptional Returns From Mortgage Servicing Right Investments
Exceptional Returns From Mortgage Servicing Right Investments Inception to date annualized total return of 53%(1) Established propriety channel for investing in MSRs Grown investable capital allocation to 50% as of March 31, 2022 High current double digit net interest yields at current rate levels L
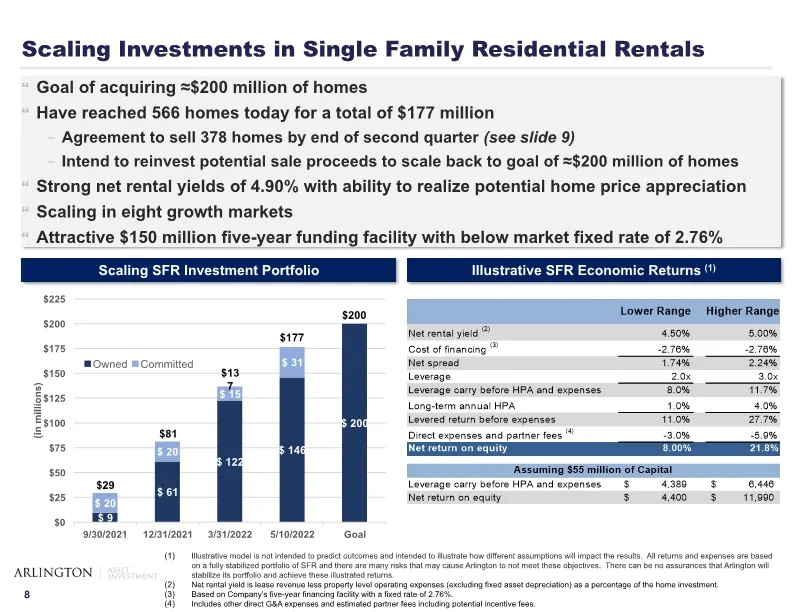
Slide 9: Scaling Investments in Single Family Residential Rentals
Scaling Investments in Single Family Residential Rentals This illustrative model is not intended to predict outcomes. This model is only intended to illustrate how different assumptions will impact the results. All returns and expenses are based on a fully stabilized portfolio of SFR and there are m
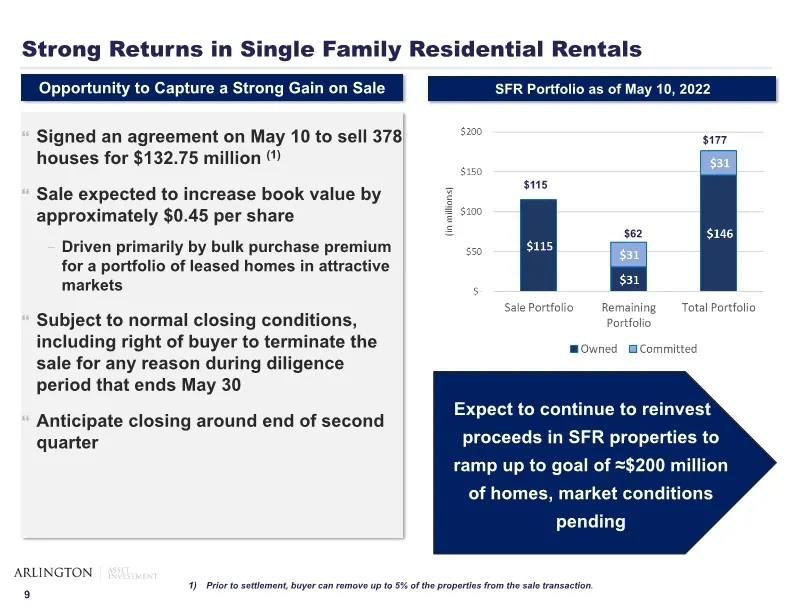
Slide 10: Strong Returns in Single Family Residential Rentals
Strong Returns in Single Family Residential Rentals Signed an agreement on May 10 to sell 378 houses for $132.75 million (1) Sale expected to increase book value by approximately $0.45 per share Driven primarily by bulk purchase premium for a portfolio of leased homes in attractive markets Subject t
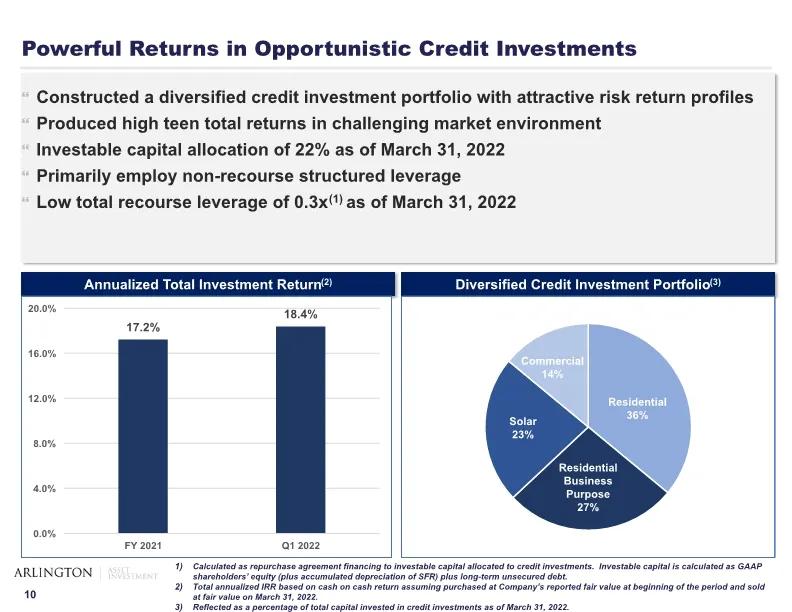
Slide 11: Powerful Returns in Opportunistic Credit Investments
Powerful Returns in Opportunistic Credit Investments Constructed a diversified credit investment portfolio with attractive risk return profiles Produced high teen total returns in challenging market environment Investable capital allocation of 22% as of March 31, 2022 Primarily employ non-recourse s
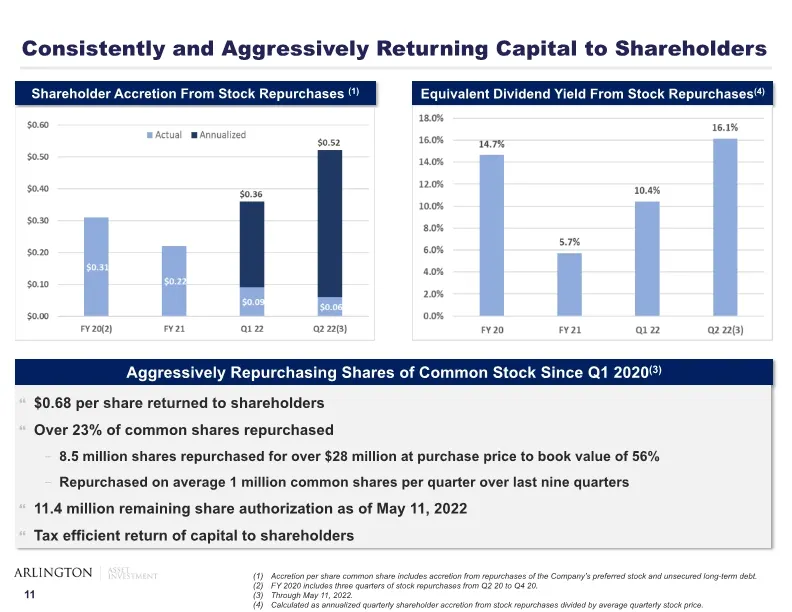
Slide 12: Consistently and Aggressively Returning Capital to Shareholders
Consistently and Aggressively Returning Capital to Shareholders Accretion per share common share includes accretion from repurchases of the Company’s preferred stock and unsecured long-term debt. FY 2020 includes three quarters of stock repurchases from Q2 20 to Q4 20. Through May 11, 2022. Calculat
Slide 13: Substantial Tax Benefits Provide Additional Shareholder Value
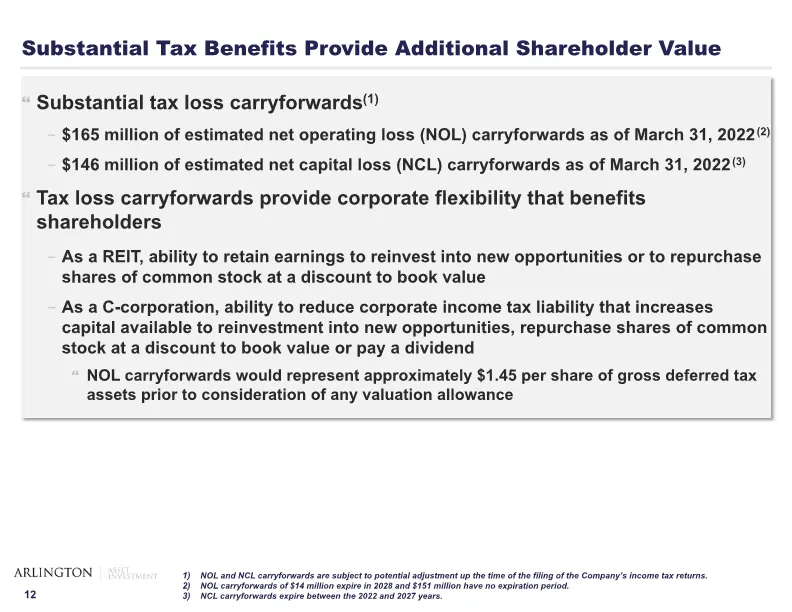
Substantial Tax Benefits Provide Additional Shareholder Value Substantial tax loss carryforwards(1) $165 million of estimated net operating loss (NOL) carryforwards as of March 31, 2022(2) $146 million of estimated net capital loss (NCL) carryforwards as of March 31, 2022(3) Tax loss carryforwards p
Slide 14: Extensive Alignment
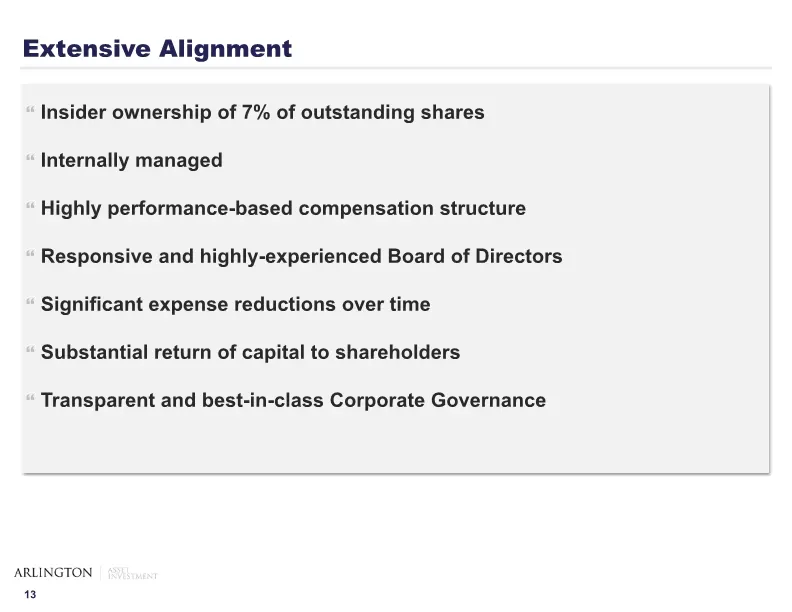
Extensive Alignment Insider ownership of 7% of outstanding shares Internally managed Highly performance-based compensation structure Responsive and highly-experienced Board of Directors Significant expense reductions over time Substantial return of capital to shareholders Transparent and best-in-cla
Slide 15: Q1 2022 Financial Review
ARLINGTON Q1 2022 Financial Review
Slide 16: Financial Highlights
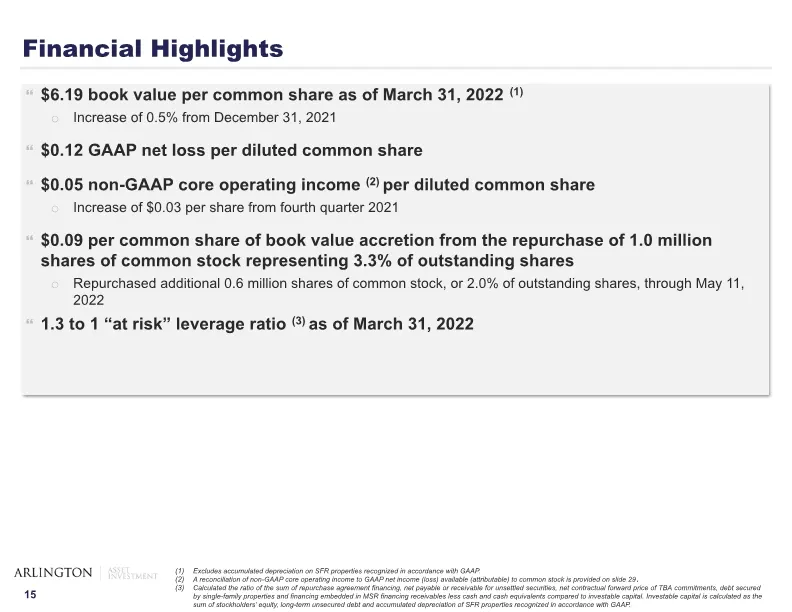
Financial Highlights $6.19 book value per common share as of March 31, 2022 (1) Increase of 0.5% from December 31, 2021 $0.12 GAAP net loss per diluted common share $0.05 non-GAAP core operating income (2) per diluted common share Increase of $0.03 per share from fourth quarter 2021 $0.09 per common
Slide 17: Investment Portfolio Highlights
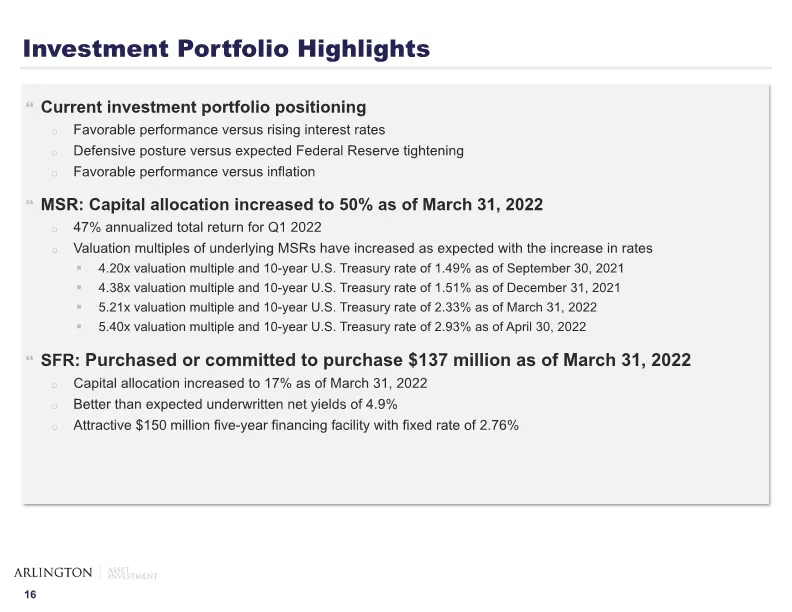
Investment Portfolio Highlights Current investment portfolio positioning Favorable performance versus rising interest rates Defensive posture versus expected Federal Reserve tightening Favorable performance versus inflation MSR: Capital allocation increased to 50% as of March 31, 2022 47% annualized
Slide 18: Diversified and Complimentary Return Profile
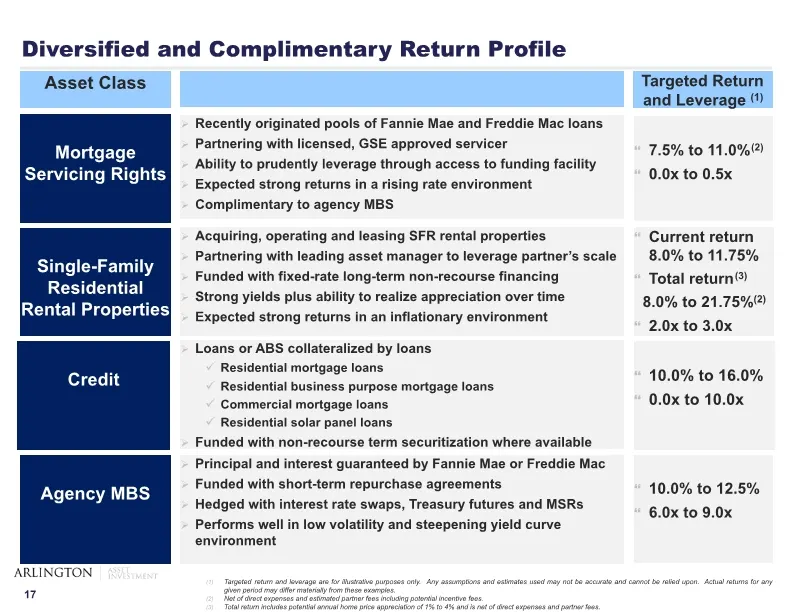
Diversified and Complimentary Return Profile Agency MBS Mortgage Servicing Rights Single-Family Residential Rental Properties Credit Principal and interest guaranteed by Fannie Mae or Freddie Mac Funded with short-term repurchase agreements Hedged with interest rate swaps, Treasury futures and MSRs
Slide 19: Investment Portfolio Allocation as of March 31, 2022
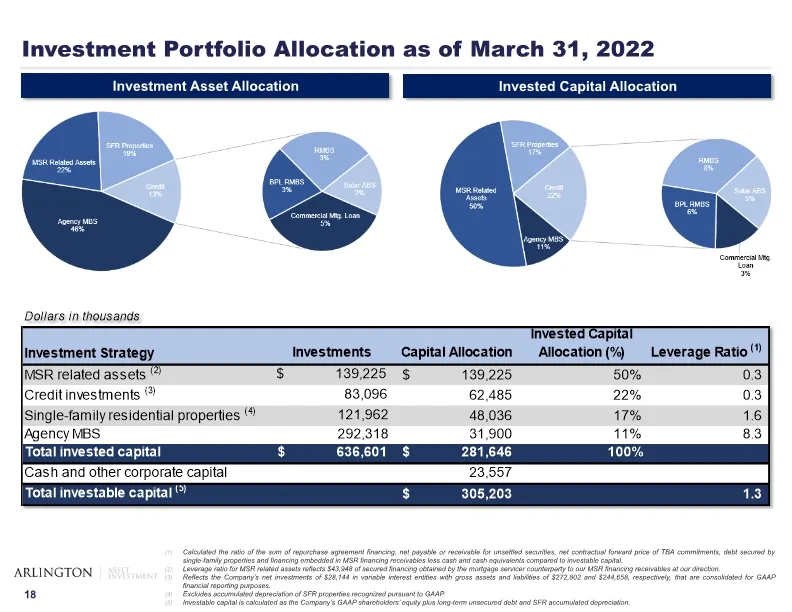
Investment Portfolio Allocation as of March 31, 2022 Investment Asset Allocation Invested Capital Allocation Calculated the ratio of the sum of repurchase agreement financing, net payable or receivable for unsettled securities, net contractual forward price of TBA commitments, debt secured by single
Slide 20: MSR Related Assets
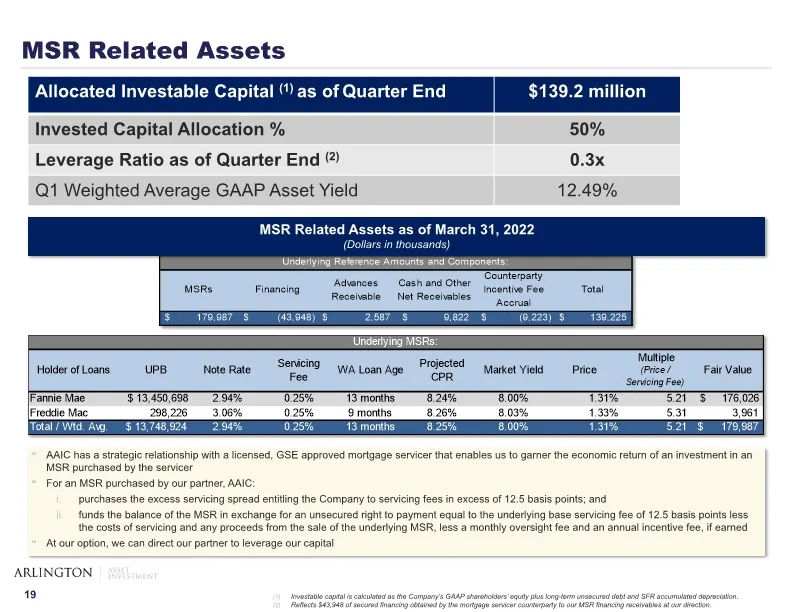
MSR Related Assets MSR Related Assets as of March 31, 2022 (Dollars in thousands) AAIC has a strategic relationship with a licensed, GSE approved mortgage servicer that enables us to garner the economic return of an investment in an MSR purchased by the servicer For an MSR purchased by our partner,
Slide 21: Single-Family Residential Properties
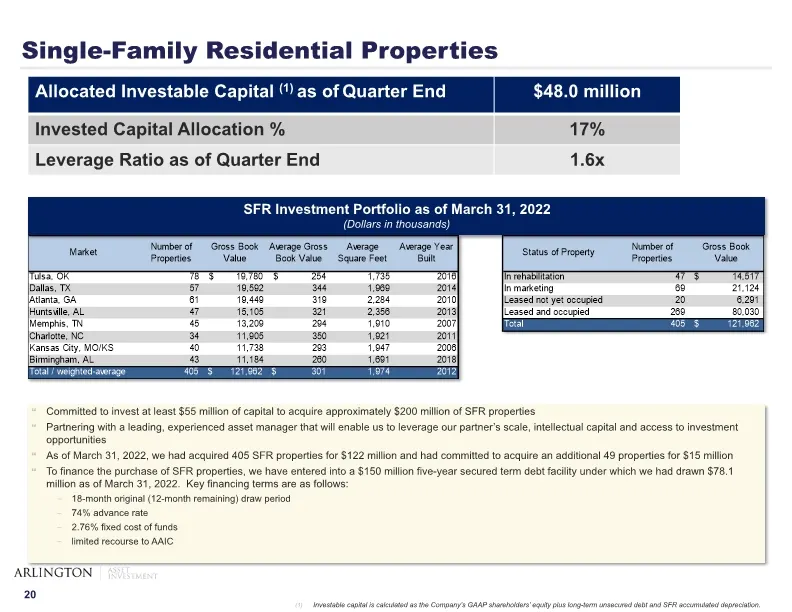
Single-Family Residential Properties Investable capital is calculated as the Company’s GAAP shareholders’ equity plus long-term unsecured debt and SFR accumulated depreciation. SFR Investment Portfolio as of March 31, 2022 (Dollars in thousands) Committed to invest at least $55 million of capital to
Slide 22: Credit Investments
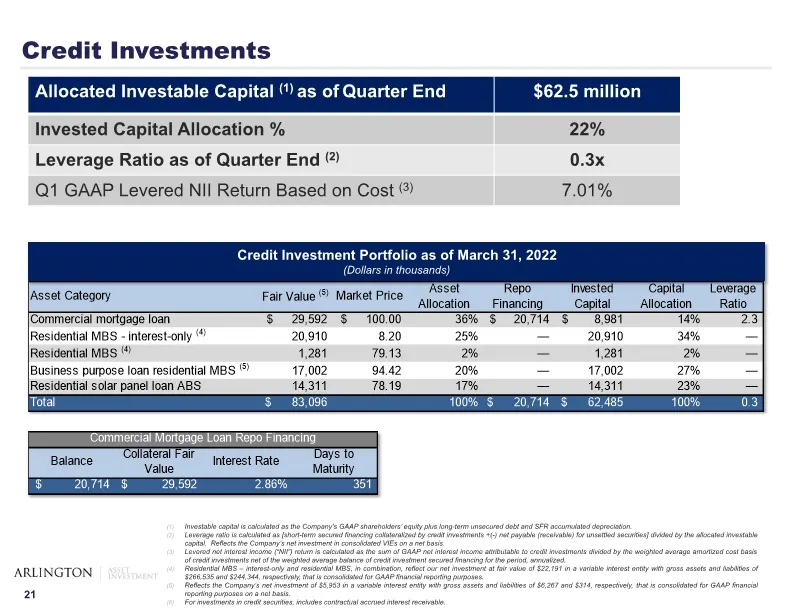
Credit Investments Investable capital is calculated as the Company’s GAAP shareholders’ equity plus long-term unsecured debt and SFR accumulated depreciation. Leverage ratio is calculated as [short-term secured financing collateralized by credit investments +(-) net payable (receivable) for unsettle
Slide 23: Agency MBS Investments
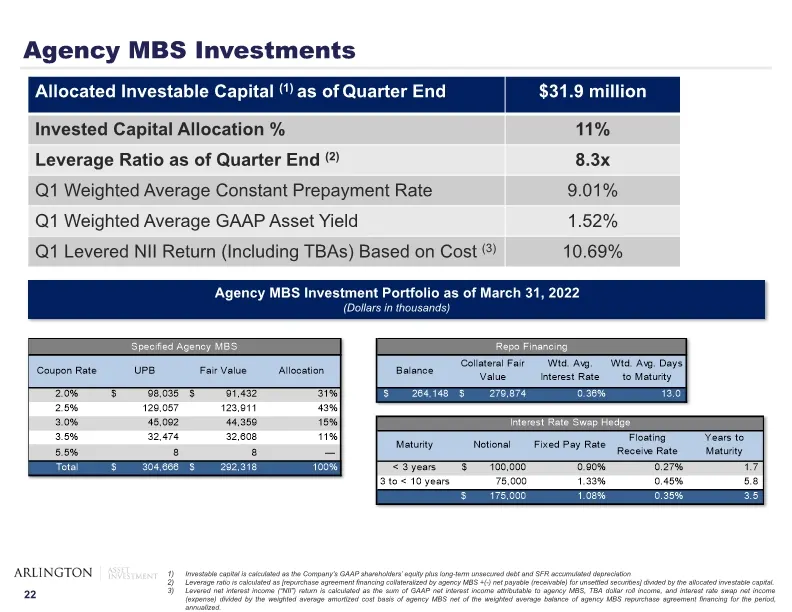
Agency MBS Investments Agency MBS Investment Portfolio as of March 31, 2022 (Dollars in thousands) Investable capital is calculated as the Company’s GAAP shareholders’ equity plus long-term unsecured debt and SFR accumulated depreciation Leverage ratio is calculated as [repurchase agreement financin
Slide 24: Non-GAAP Core Operating Income
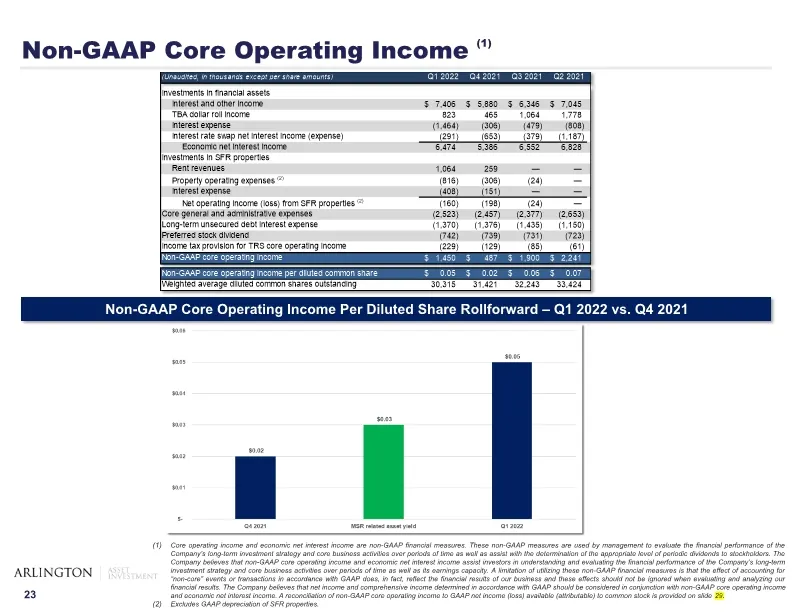
Non-GAAP Core Operating Income (1) Core operating income and economic net interest income are non-GAAP financial measures. These non-GAAP measures are used by management to evaluate the financial performance of the Company’s long-term investment strategy and core business activities over periods of
Slide 25: Book Value Per Share Rollforward
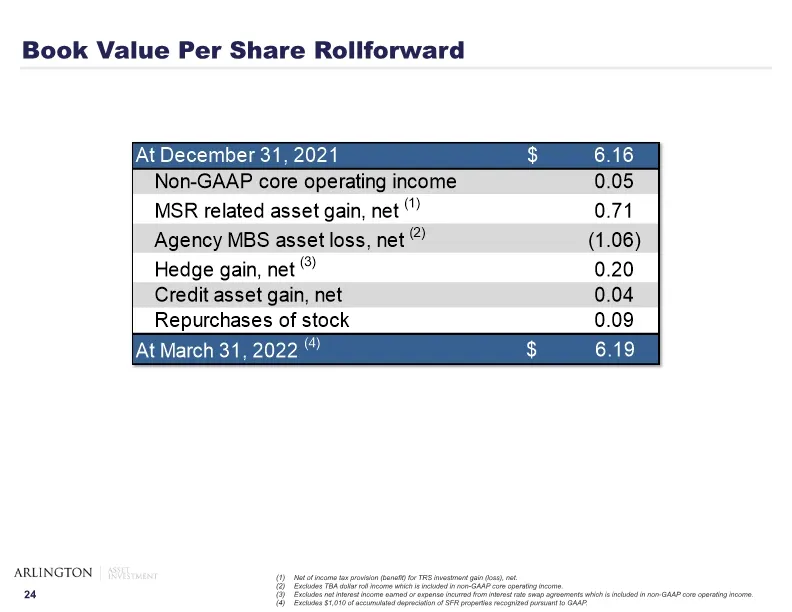
Book Value Per Share Rollforward Net of income tax provision (benefit) for TRS investment gain (loss), net. Excludes TBA dollar roll income which is included in non-GAAP core operating income. Excludes net interest income earned or expense incurred from interest rate swap agreements which is include
Slide 26: Additional Financial Information
Additional Financial Information
Slide 27: Publicly Traded Capital
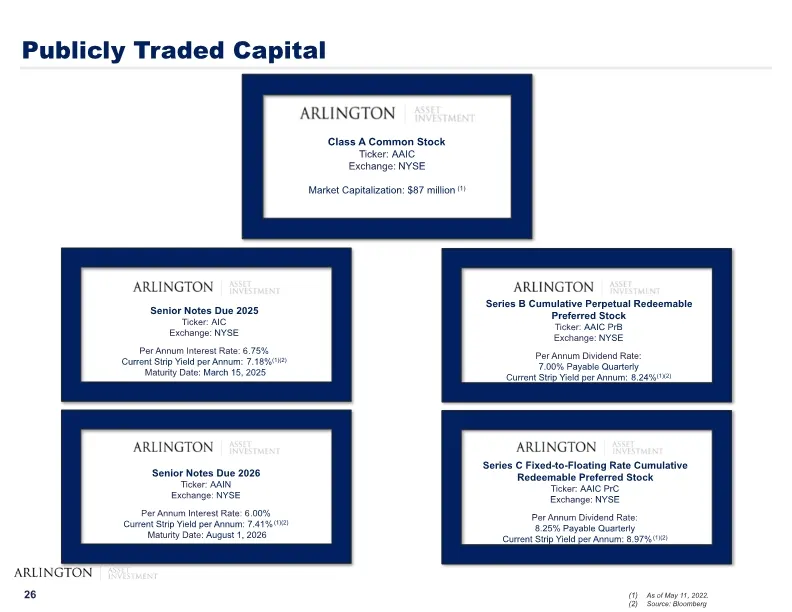
Publicly Traded Capital Class A Common Stock Ticker: AAIC Exchange: NYSE Market Capitalization: $87 million (1) Senior Notes Due 2026 Ticker: AAIN Exchange: NYSE Per Annum Interest Rate: 6.00% Current Strip Yield per Annum: 7.41%(1)(2) Maturity Date: August 1, 2026 Series B Cumulative Perpetual Rede
Slide 28: Balance Sheet
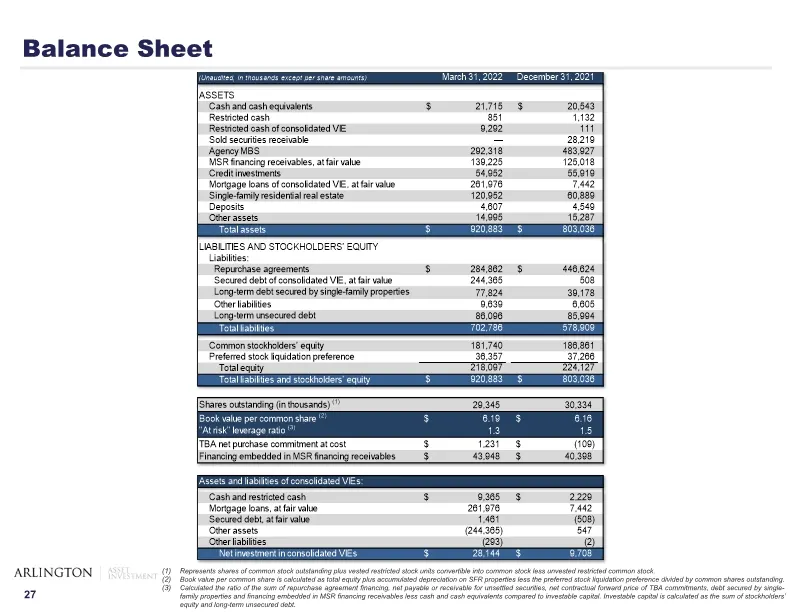
Balance Sheet Represents shares of common stock outstanding plus vested restricted stock units convertible into common stock less unvested restricted common stock. Book value per common share is calculated as total equity plus accumulated depreciation on SFR properties less the preferred stock liqui
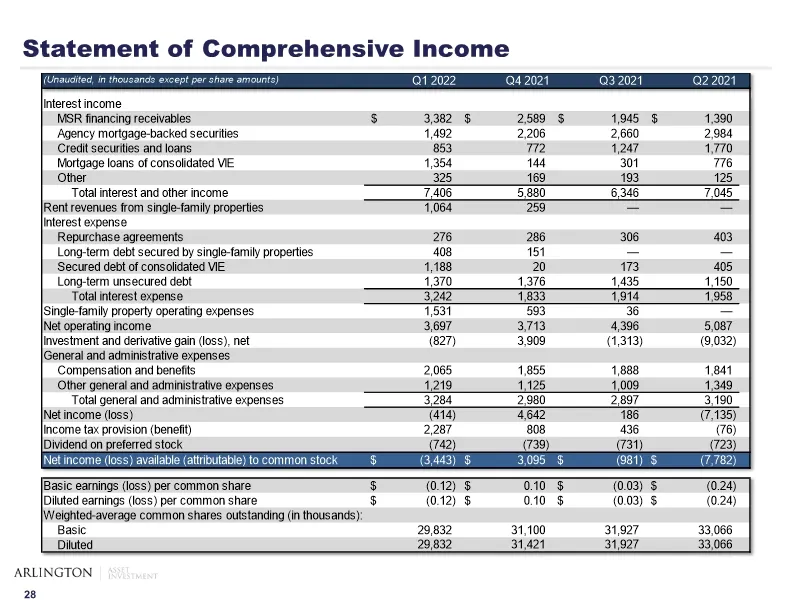
Slide 29: Statement of Comprehensive Income
Statement of Comprehensive Income
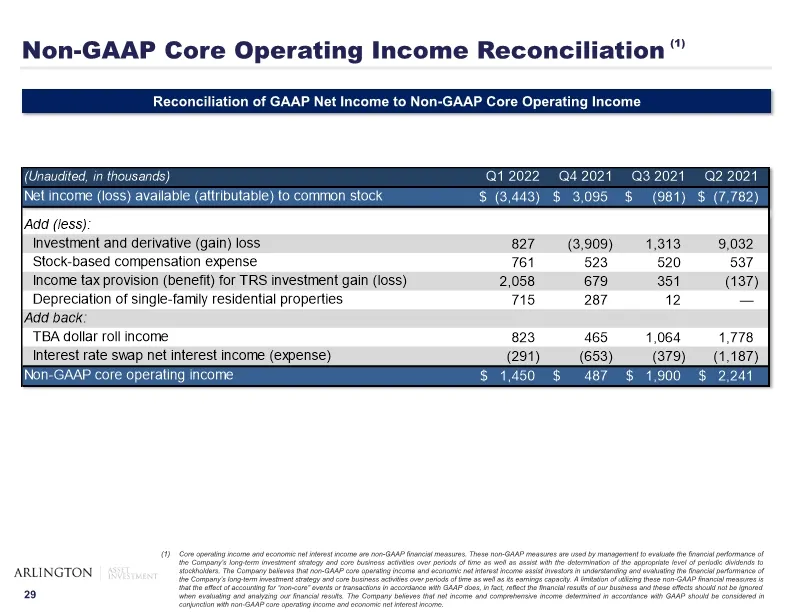
Slide 30: Non-GAAP Core Operating Income Reconciliation
Non-GAAP Core Operating Income Reconciliation (1) Core operating income and economic net interest income are non-GAAP financial measures. These non-GAAP measures are used by management to evaluate the financial performance of the Company’s long-term investment strategy and core business activities o
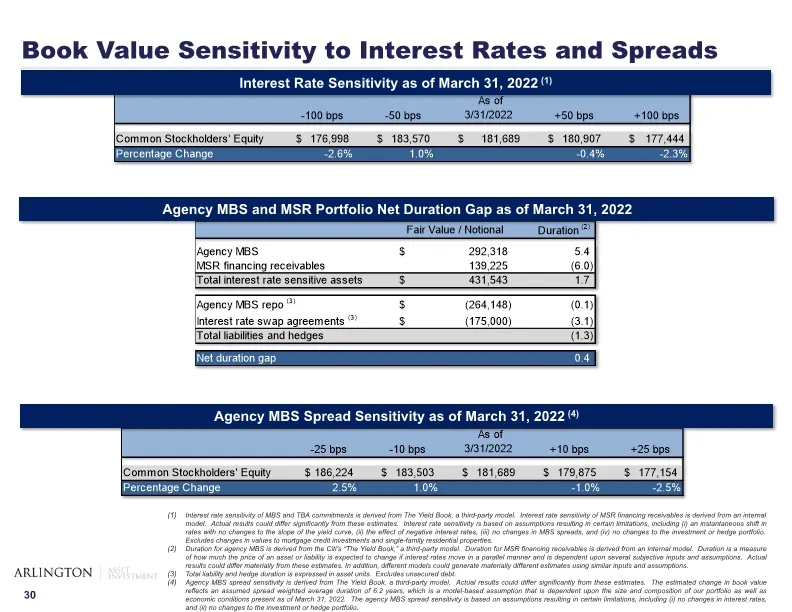
Slide 31: Interest Rate Sensitivity and Duration Notes
Interest rate sensitivity of MBS and TBA commitments is derived from The Yield Book, a third-party model. Interest rate sensitivity of MSR financing receivables is derived from an internal model. Actual results could differ significantly from these estimates. Interest rate sensitivity is based on as
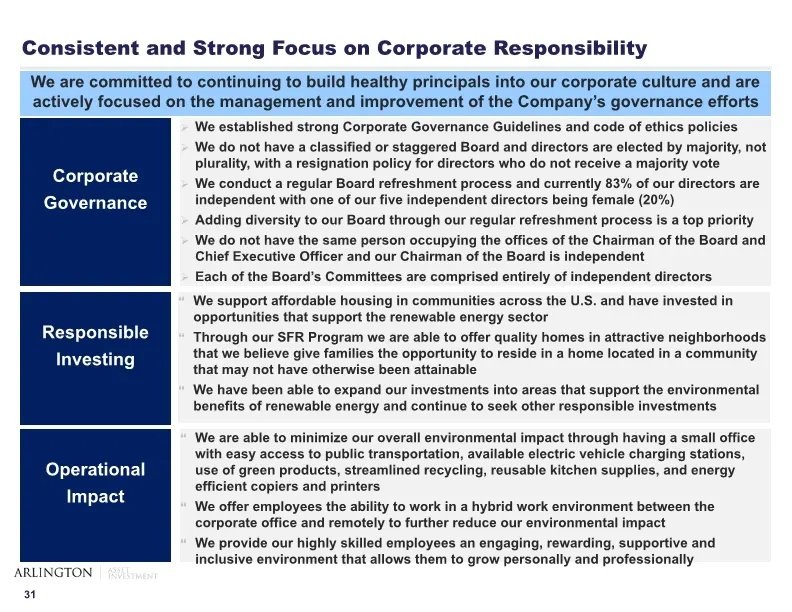
Slide 32: Consistent and Strong Focus on Corporate Responsibility
Consistent and Strong Focus on Corporate Responsibility Corporate Governance We are committed to continuing to build healthy principals into our corporate culture and are actively focused on the management and improvement of the Company’s governance efforts We established strong Corporate Governance
Source: SEC EDGAR · 8-K filed May 13, 2022
More decks from Arlington Asset Investment Corp
 Q3 2023 Earnings Presentation12 slides · Nov 13, 2023
 Q2 2023 Earnings Presentation12 slides · Aug 14, 2023
 Q1 2023 Earnings Presentation16 slides · May 15, 2023
 Q4 2022 Earnings Presentation20 slides · Mar 31, 2023
 Q3 2022 Earnings Presentation29 slides · Nov 15, 2022
 Q2 2022 Earnings Presentation31 slides · Aug 10, 2022