Caremark Rx — JP Morgan 25th Annual Healthcare Conference 2007
23 slides from Caremark Rx's conference presentation, Jan 8, 2007
Slide 1: Alignment in Action
JP Morgan25th Annual Healthcare Conference January 8, 2007 Delivering Superior Value to Stockholders, Plan Sponsors and Patients Alignment in Action
Slide 2: Safe Harbor: Forward Looking Statements
Safe Harbor: Forward Looking Statements This presentation contains "forward-looking statements," including, among other statements, statements regarding the proposed business combination between Express Scripts and Caremark, and the anticipated consequences and benefits of such transaction. Statemen
Slide 3: Safe Harbor: Additional Information
Safe Harbor: Additional Information IMPORTANT INFORMATION This material is not a substitute for the prospectus/proxy statement Express Scripts and Caremark would file with the Securities and Exchange Commission ("SEC") if an agreement between Express Scripts and Caremark is reached or any other docu
Slide 4: Express Scripts: A Legacy of Alignment
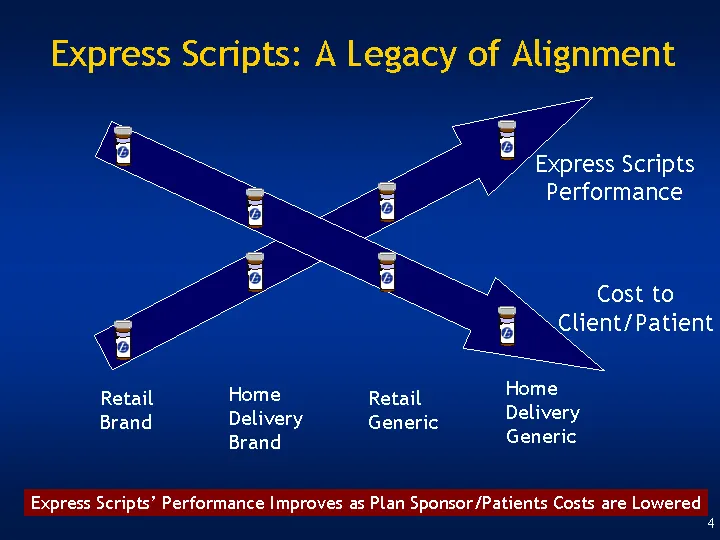
Express Scripts: A Legacy of Alignment Express Scripts Performance Cost to Client/Patient Retail Brand Home Delivery Brand Retail Generic Home Delivery Generic Express Scripts' Performance Improves as Plan Sponsor/Patients Costs are Lowered
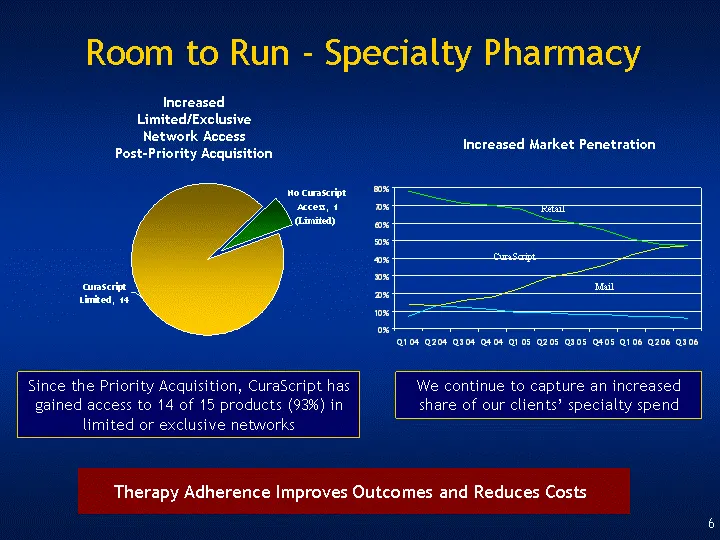
Slide 5: Room to Run - Specialty Pharmacy
Room to Run - Specialty Pharmacy CuraScript Limited No CuraScript Access East 14 1 Since the Priority Acquisition, CuraScript has gained access to 14 of 15 products (93%) in limited or exclusive networks Increased Limited/Exclusive Network Access Post-Priority Acquisition (Limited) Q1 04 Q2 04 Q3 04
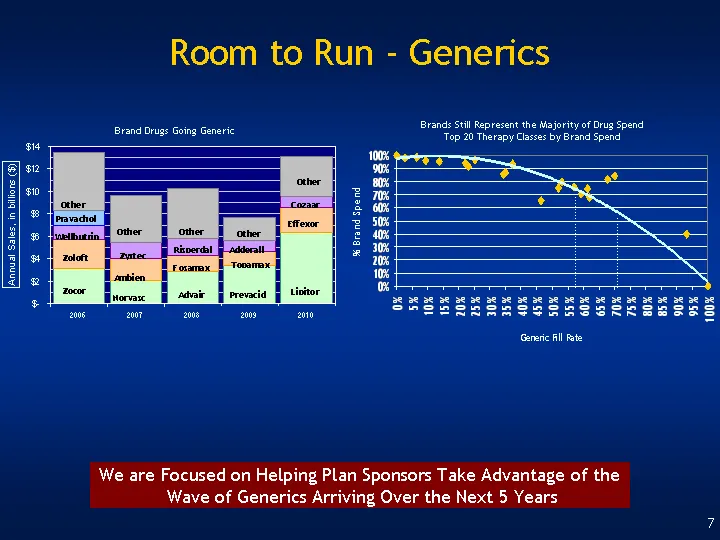
Slide 6: Room to Run - Generics
Room to Run - Generics 2006 2007 2008 2009 2010 3.106 2.06 2.83 3.328 6.321 2.561 1.933 1.484 1.268 2.219 1.329 1.408 1.473 1.007 1.029 1.315 5.086 4.195 4.406 2.068 3.493 Brand Drugs Going Generic Brands Still Represent the Majority of Drug Spend Top 20 Therapy Classes by Brand Spend We are Focused
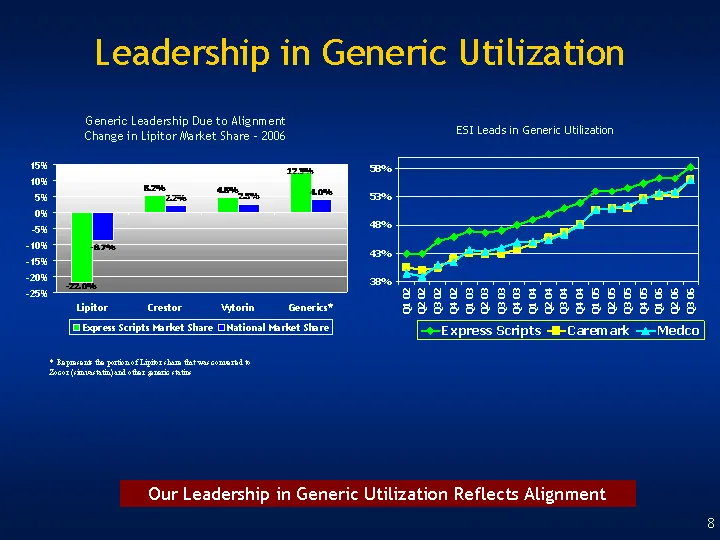
Slide 7: Leadership in Generic Utilization
Leadership in Generic Utilization Q1 02 Q2 02 Q3 02 Q4 02 Q1 03 Q2 03 Q3 03 Q4 03 Q1 04 Q2 04 Q3 04 Q4 04 Q1 05 Q2 05 Q3 05 Q4 05 Q1 06 Q2 06 Q3 06 Express Scripts 0.43 0.43 0.452 0.459 0.47 0.467 0.471 0.48 0.49 0.5 0.51 0.52 0.54 0.54 0.545 0.554 0.563 0.563 0.583 Caremark 0.406 0.401 0.405 0.421
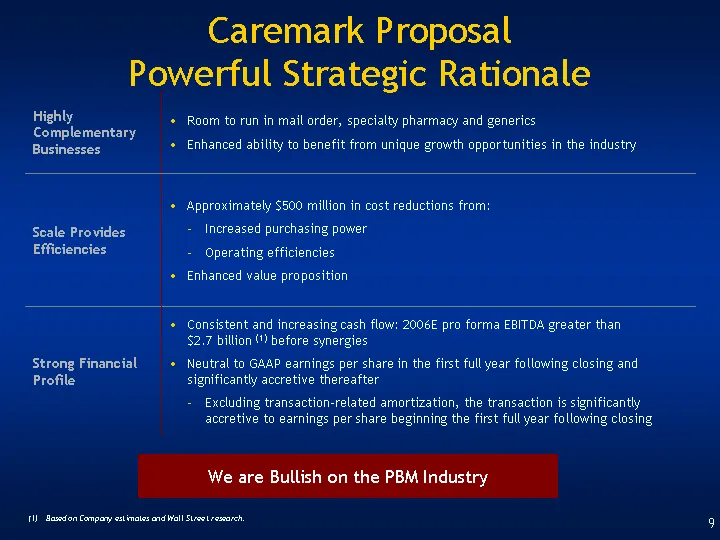
Slide 8: Caremark Proposal Powerful Strategic Rationale
Caremark Proposal Powerful Strategic Rationale Highly Complementary Businesses Room to run in mail order, specialty pharmacy and generics Enhanced ability to benefit from unique growth opportunities in the industry Scale Provides Efficiencies Approximately $500 million in cost reductions from: Incre
Slide 9: Caremark Transaction Summary
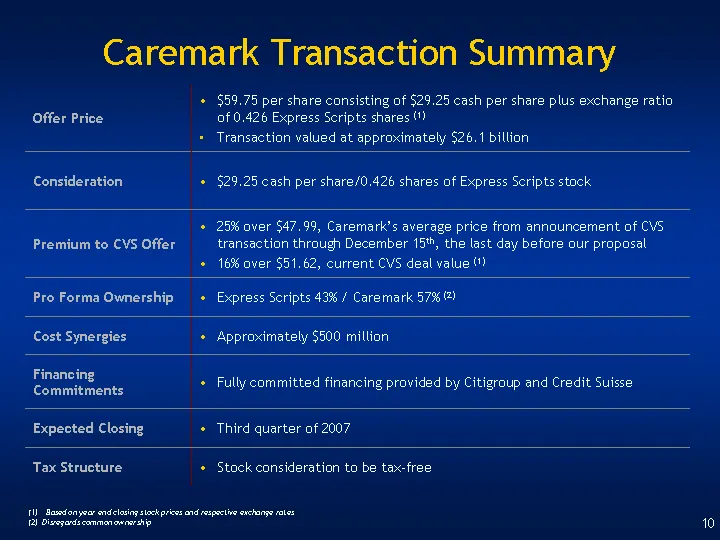
Caremark Transaction Summary Offer Price $59.75 per share consisting of $29.25 cash per share plus exchange ratio of 0.426 Express Scripts shares (1) Transaction valued at approximately $26.1 billion Consideration $29.25 cash per share/0.426 shares of Express Scripts stock Premium to CVS Offer 25% o
Slide 10: Superior Financial Proposal
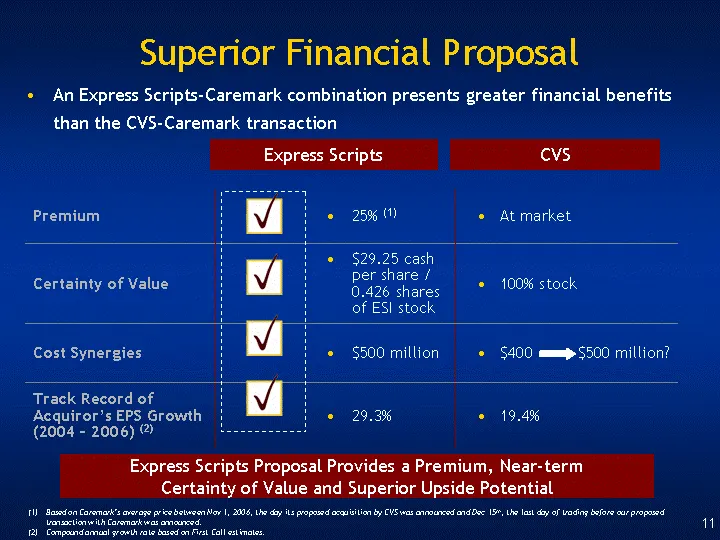
Superior Financial Proposal An Express Scripts-Caremark combination presents greater financial benefits than the CVS-Caremark transaction Express Scripts CVS Premium 25% (1) At market Certainty of Value $29.25 cash per share / 0.426 shares of ESI stock 100% stock Cost Synergies $500 million $400 $50
Slide 11: Superior Value Proposition
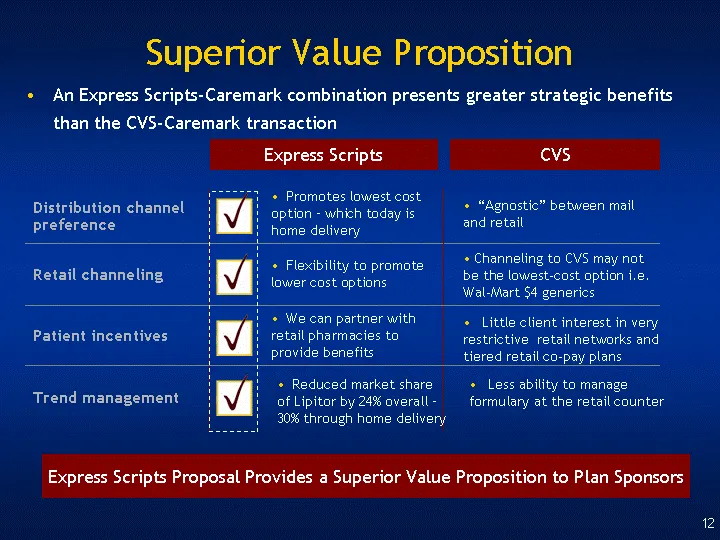
Superior Value Proposition An Express Scripts-Caremark combination presents greater strategic benefits than the CVS-Caremark transaction Express Scripts CVS Distribution channel preference Retail channeling Patient incentives Trend management Express Scripts Proposal Provides a Superior Value Propos
Slide 12: Regulatory Review Competitive Landscape
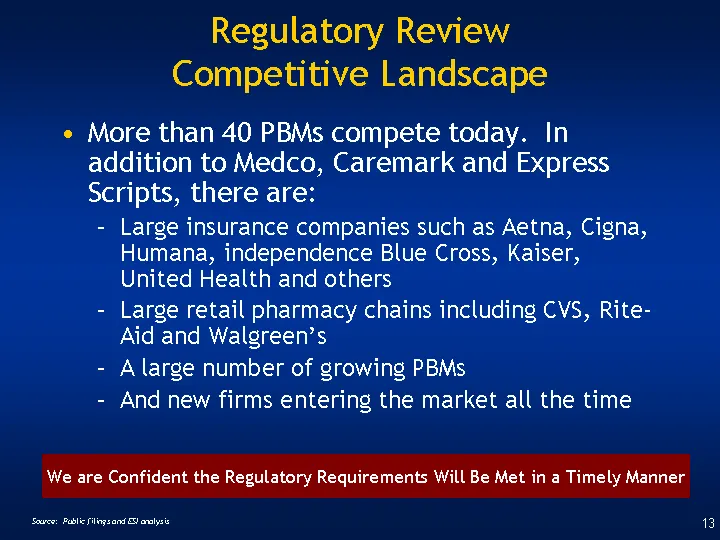
Regulatory Review Competitive Landscape More than 40 PBMs compete today. In addition to Medco, Caremark and Express Scripts, there are: Large insurance companies such as Aetna, Cigna, Humana, independence Blue Cross, Kaiser, United Health and others Large retail pharmacy chains including CVS, Rite-
Slide 13: Financial Highlights
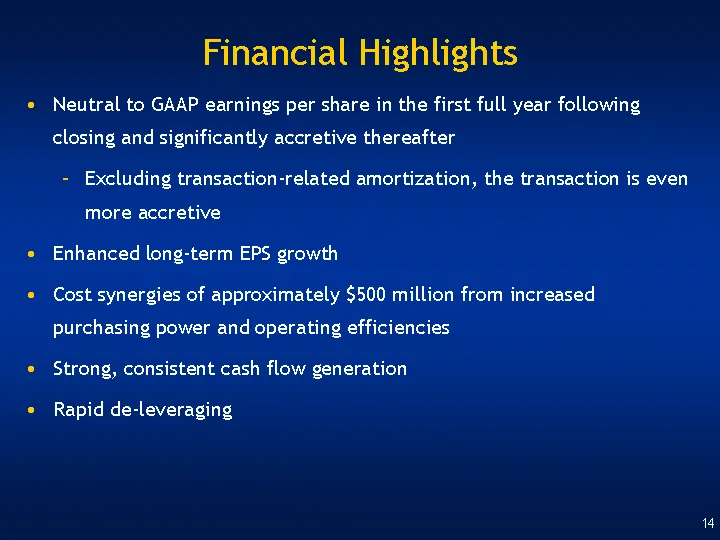
Financial Highlights Neutral to GAAP earnings per share in the first full year following closing and significantly accretive thereafter Excluding transaction-related amortization, the transaction is even more accretive Enhanced long-term EPS growth Cost synergies of approximately $500 million from i
Slide 14: Attractive Synergies
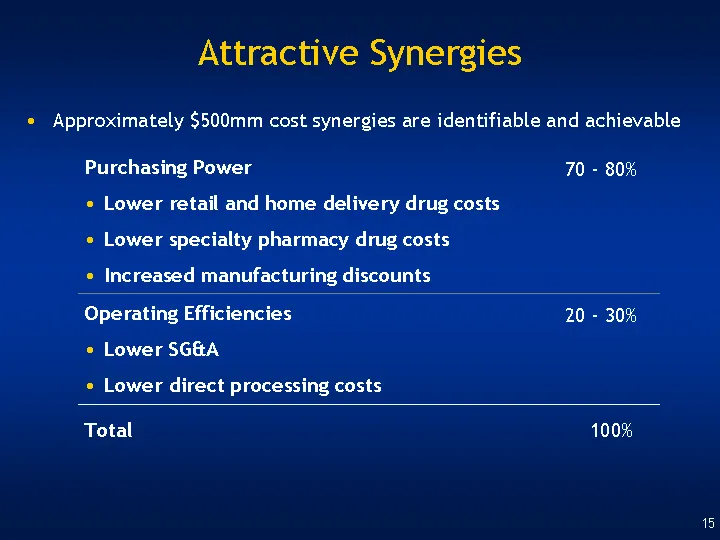
Attractive Synergies Purchasing Power Lower retail and home delivery drug costs Lower specialty pharmacy drug costs Increased manufacturing discounts 70 - 80% Operating Efficiencies Lower SG&A Lower direct processing costs 20 - 30% Total 100% Approximately $500mm cost synergies are identifiable and
Slide 15: Strong Credit Profile with Rapid Deleveraging
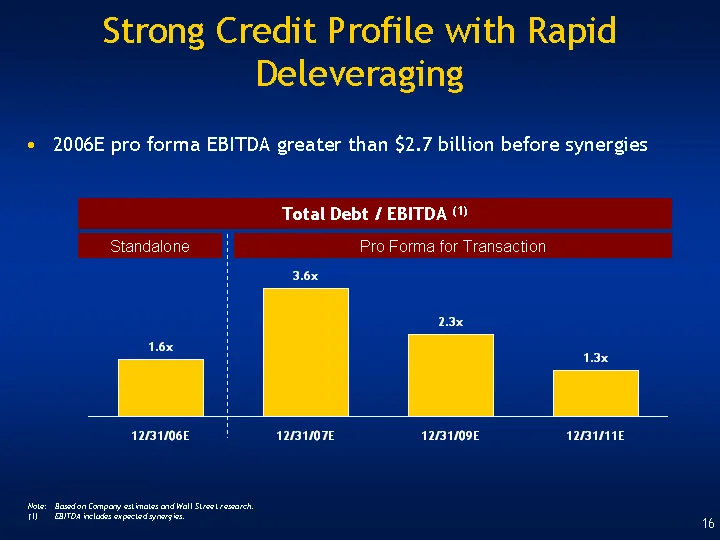
Strong Credit Profile with Rapid Deleveraging Note: Based on Company estimates and Wall Street research. (1) EBITDA includes expected synergies. 2006E pro forma EBITDA greater than $2.7 billion before synergies Standalone Pro Forma for Transaction Total Debt / EBITDA (1)
Slide 16: Acquisition Track Record - Leverage
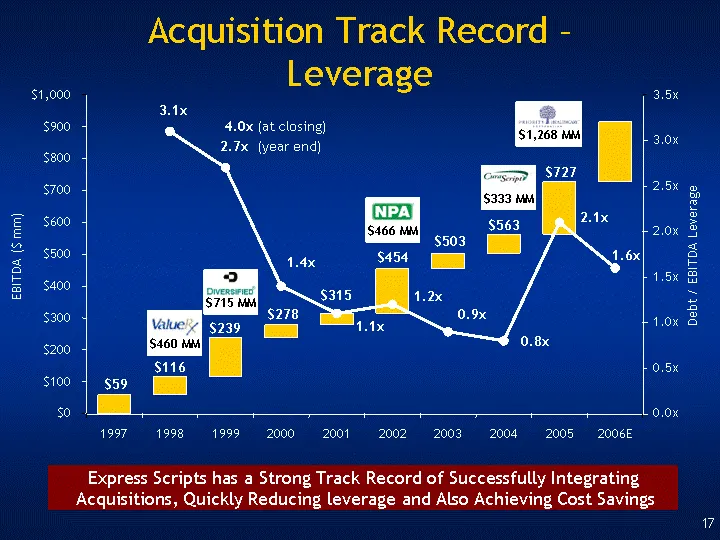
Acquisition Track Record - Leverage Express Scripts has a Strong Track Record of Successfully Integrating Acquisitions, Quickly Reducing leverage and Also Achieving Cost Savings $715 MM $460 MM $466 MM $333 MM $1,268 MM (year end) (at closing) 4.0x 0.8x 0.9x 1.2x 1.1x 1.4x 2.7x 3.1x 1.6x 2.1x $0 $10
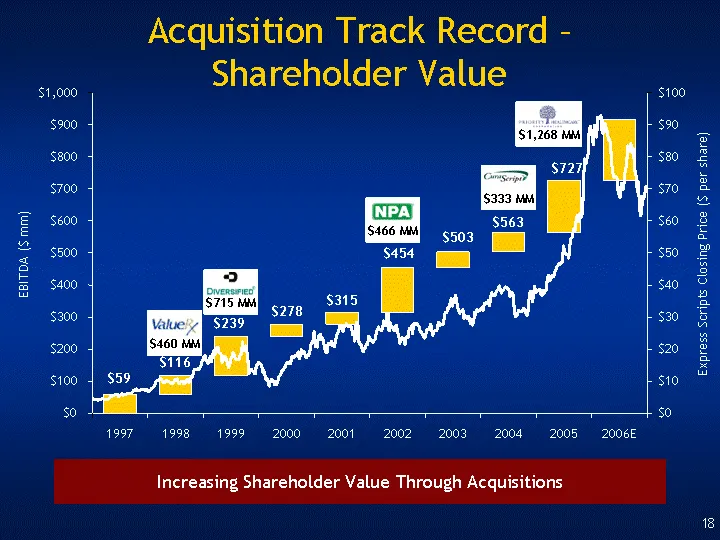
Slide 17: Acquisition Track Record - Shareholder Value
Acquisition Track Record - Shareholder Value Increasing Shareholder Value Through Acquisitions $715 MM $460 MM $466 MM $333 MM $1,268 MM $0 $100 $200 $300 $400 $500 $600 $700 $800 $900 $1,000 1997 1998 1999 2000 2001 2002 2003 2004 2005 2006E EBITDA ($ mm) $0 $10 $20 $30 $40 $50 $60 $70 $80 $90 $100
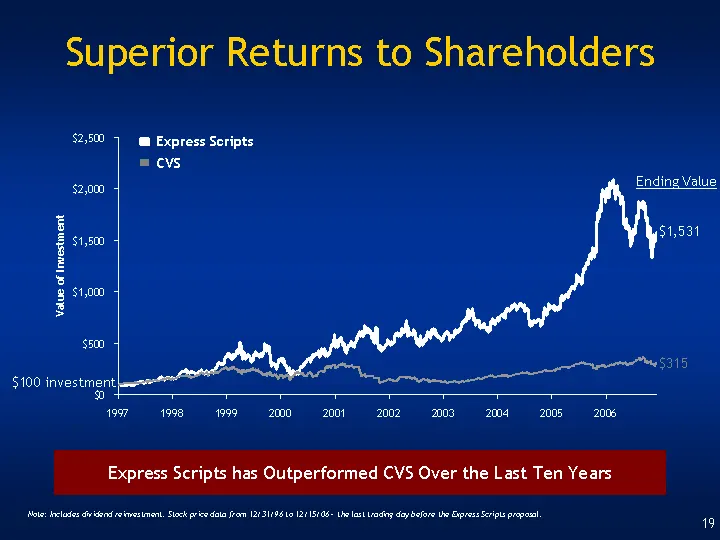
Slide 18: Superior Returns to Shareholders
Superior Returns to Shareholders Express Scripts has Outperformed CVS Over the Last Ten Years Express Scripts CVS $1,531 $315 Note: Includes dividend reinvestment. Stock price data from 12/31/96 to 12/15/06 - the last trading day before the Express Scripts proposal. $100 investment Ending Value
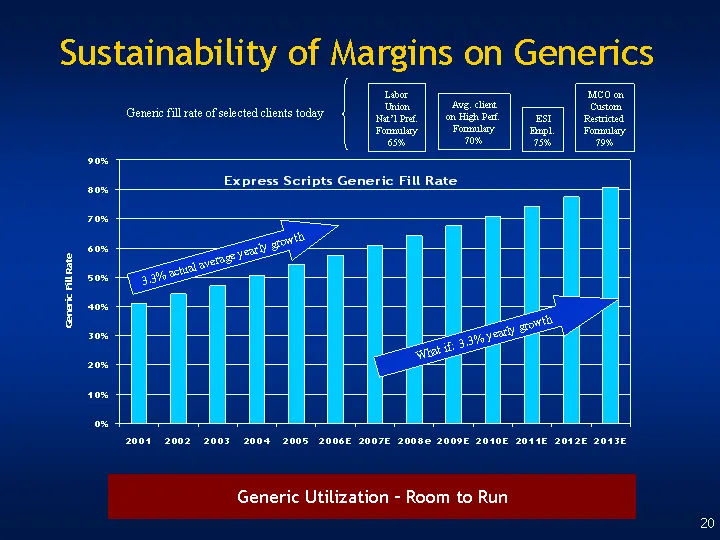
Slide 19: Sustainability of Margins on Generics
2001 2002 2003 2004 2005 2006E 2007E 2008e 2009E 2010E 2011E 2012E 2013E East 0.41 0.442 0.472 0.505 0.544 0.576 0.609 0.642 0.675 0.708 0.741 0.774 0.807 Sustainability of Margins on Generics 3.3% actual average yearly growth What if: 3.3% yearly growth Generic Utilization - Room to Run ESI Empl. 7
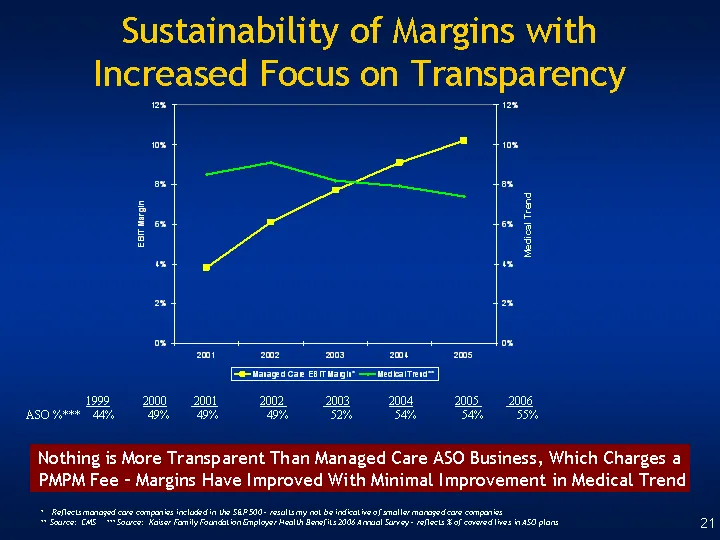
Slide 20: Sustainability of Margins with Increased Focus on Transparency
Sustainability of Margins with Increased Focus on Transparency 2001 2002 2003 2004 2005 Managed Care EBIT Margin* 0.038 0.061 0.077 0.091 0.102 Medical Trend** 0.085 0.091 0.082 0.079 0.074 * Reflects managed care companies included in the S&P 500 - results my not be indicative of smaller managed ca
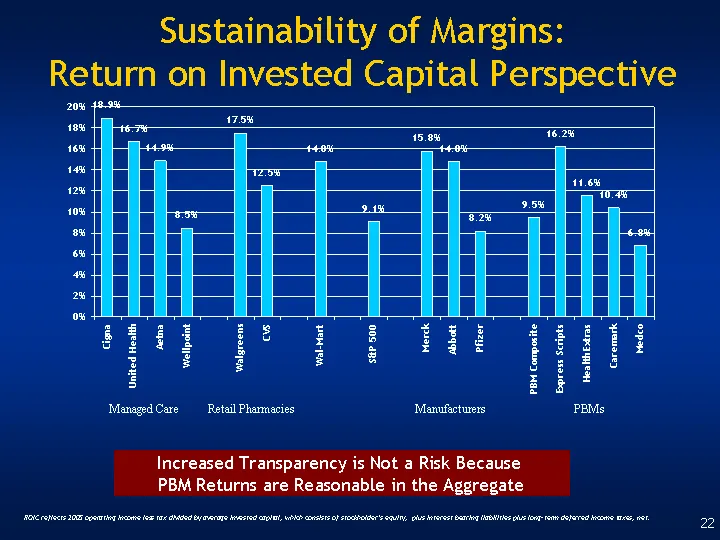
Slide 21: Sustainability of Margins: Return on Invested Capital Perspective
Cigna United Health Aetna Wellpoint Walgreens CVS Wal-Mart S&P 500 Merck Abbott Pfizer PBM Composite Express Scripts HealthExtras Caremark Medco ROIC 0.189 0.167 0.149 0.085 0.175 0.125 0.148 0.0913 0.158 0.148 0.082 0.095 0.162 0.116 0.104 0.068 Managed Care Retail Pharmacies Manufacturers PBMs ROI
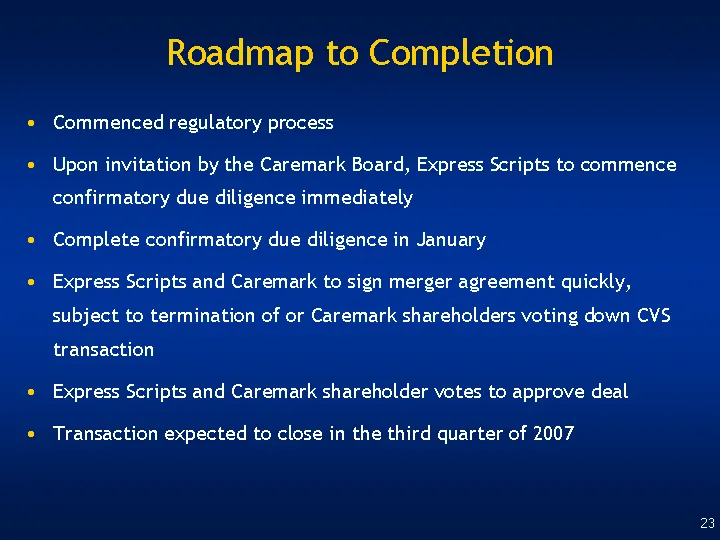
Slide 22: Roadmap to Completion
Roadmap to Completion Commenced regulatory process Upon invitation by the Caremark Board, Express Scripts to commence confirmatory due diligence immediately Complete confirmatory due diligence in January Express Scripts and Caremark to sign merger agreement quickly, subject to termination of or Care

Slide 23: Express Scripts
a3) EXPRESS SCRIPTS®
Source: SEC EDGAR · 425 filed Jan 8, 2007
More decks from Caremark Rx Inc
 Caremark RX — Merger or Acquisition (March 2007)20 slides · Mar 13, 2007
 Caremark RX — Proxy Contest (March 2007)15 slides · Mar 12, 2007
 Caremark RX — Proxy Contest (March 2007)14 slides · Mar 8, 2007
 Proxy Contest (February 2007)5 slides · Feb 12, 2007
 Merger or Acquisition (February 2007)23 slides · Feb 2, 2007
 Caremark RX — Merger or Acquisition (February 2007)34 slides · Feb 2, 2007