Anadarko Petroleum — Merger or Acquisition (April 2019)
29 slides from Anadarko Petroleum's merger presentation, Apr 24, 2019
Slide 1: Occidental Proposal to Acquire Anadarko
April 24, 2019 Occidental Proposal to Acquire Anadarko
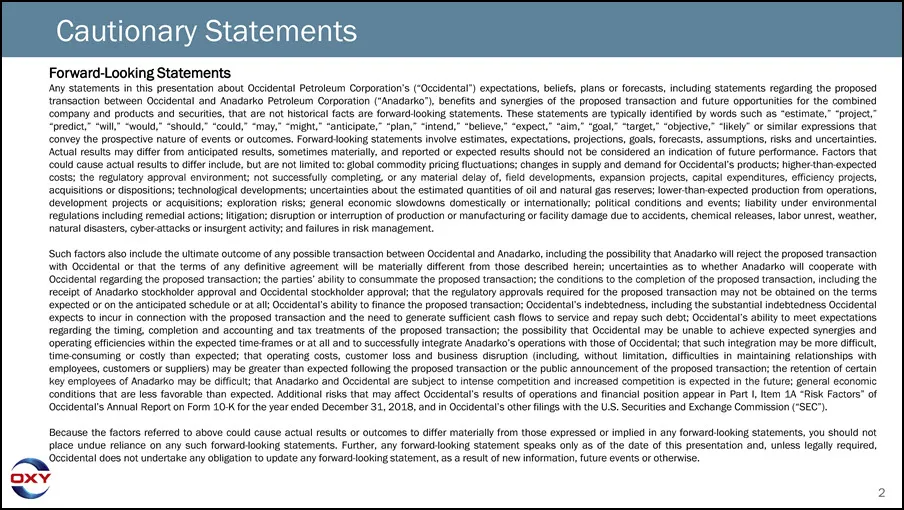
Slide 2: Cautionary Statements: Forward-Looking Statements
Cautionary Statements Forward-Looking Statements Any statements in this presentation about Occidental Petroleum Corporation’s (“Occidental”) expectations, beliefs, plans or forecasts, including statements regarding the proposed transaction between Occidental and Anadarko Petroleum Corporation (“Anad
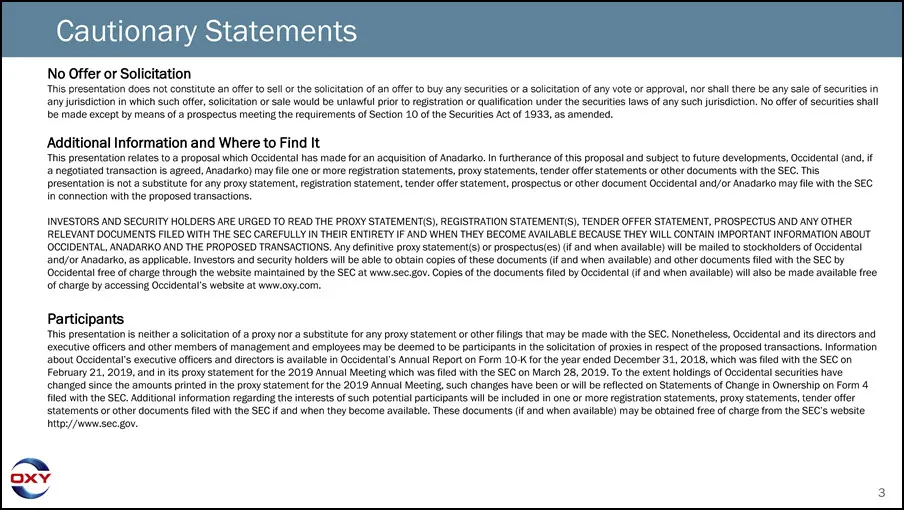
Slide 3: Cautionary Statements: No Offer or Solicitation
Cautionary Statements No Offer or Solicitation This presentation does not constitute an offer to sell or the solicitation of an offer to buy any securities or a solicitation of any vote or approval, nor shall there be any sale of securities in any jurisdiction in which such offer, solicitation or sa
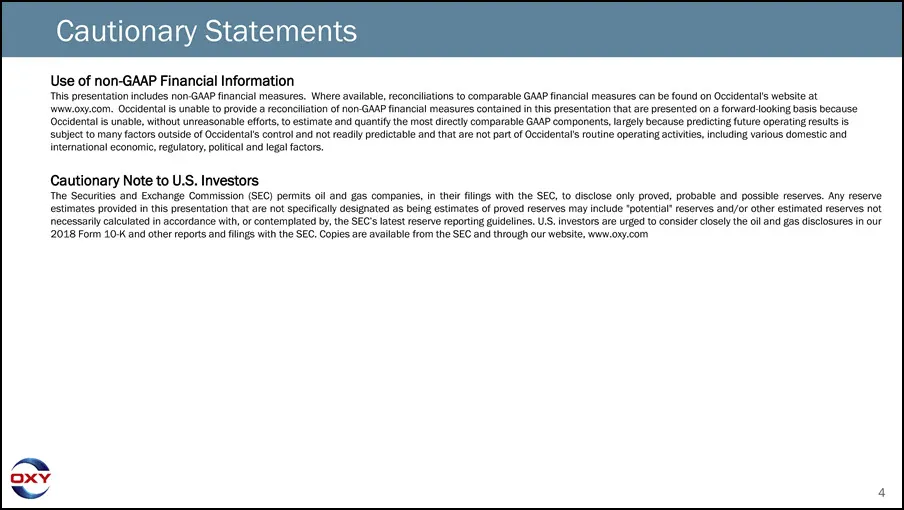
Slide 4: Cautionary Statements: Use of non-GAAP Financial Information
Cautionary Statements Use of non-GAAP Financial Information This presentation includes non-GAAP financial measures. Where available, reconciliations to comparable GAAP financial measures can be found on Occidental's website at www.oxy.com. Occidental is unable to provide a reconciliation of non-GAAP
Slide 5: Compelling Strategic & Financial Merits
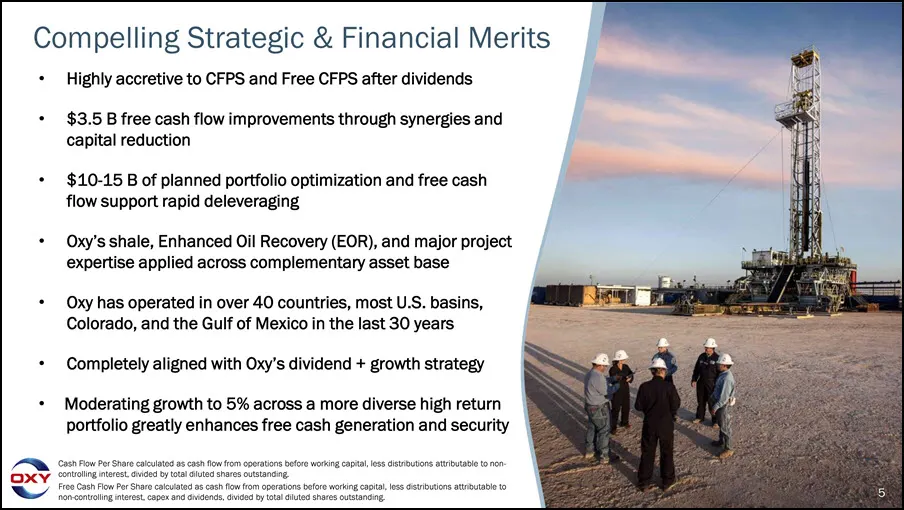
Compelling Strategic & Financial Merits Highly accretive to CFPS and Free CFPS after dividends $3.5 B free cash flow improvements through synergies and capital reduction $10-15 B of planned portfolio optimization and free cash flow support rapid deleveraging Oxy’s shale, Enhanced Oil Recovery (EOR),
Slide 6: Proposal Details
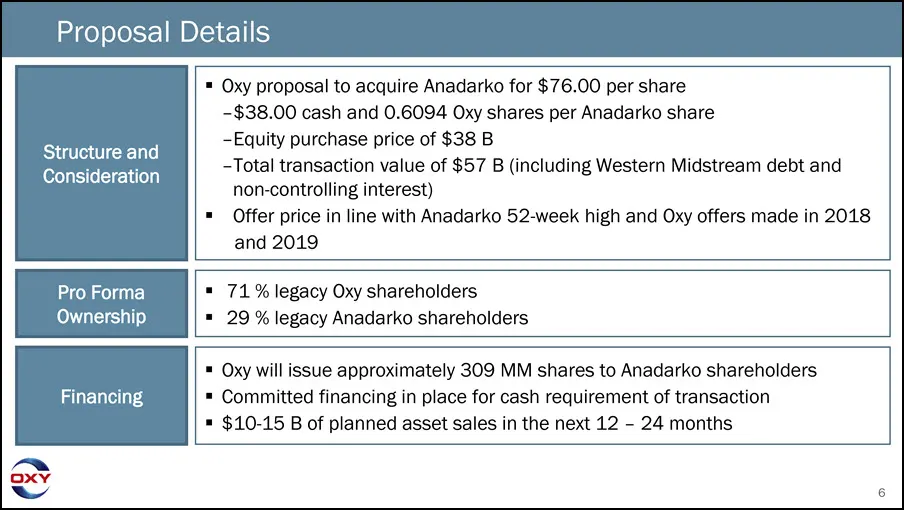
Proposal Details Structure and Consideration Oxy proposal to acquire Anadarko for $76.00 per share –$38.00 cash and 0.6094 Oxy shares per Anadarko share –Equity purchase price of $38 B –Total transaction value of $57 B (including Western Midstream debt and non-controlling interest) Offer price in li
Slide 7: Oxy & Anadarko: Creating A High Return Cash Generating Energy Company
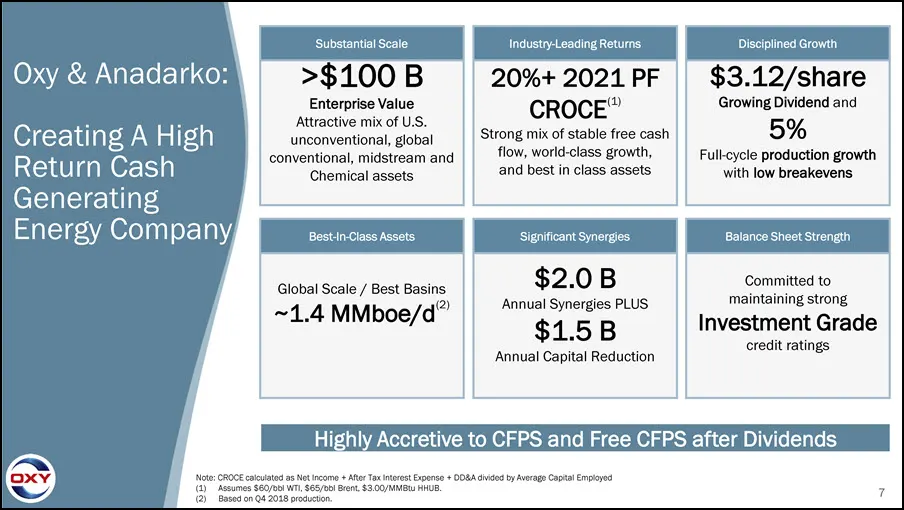
Oxy & Anadarko: Creating A High Return Cash Generating Energy Company Substantial Scale >$100 B Enterprise Value Attractive mix of U.S. unconventional, global conventional, midstream and Chemical assets Industry-Leading Returns 20%+ 2021 PFCROCE(1) Strong mix of stable free cash flow, world-class gr
Slide 8: Premier, Complementary Global Asset Portfolio
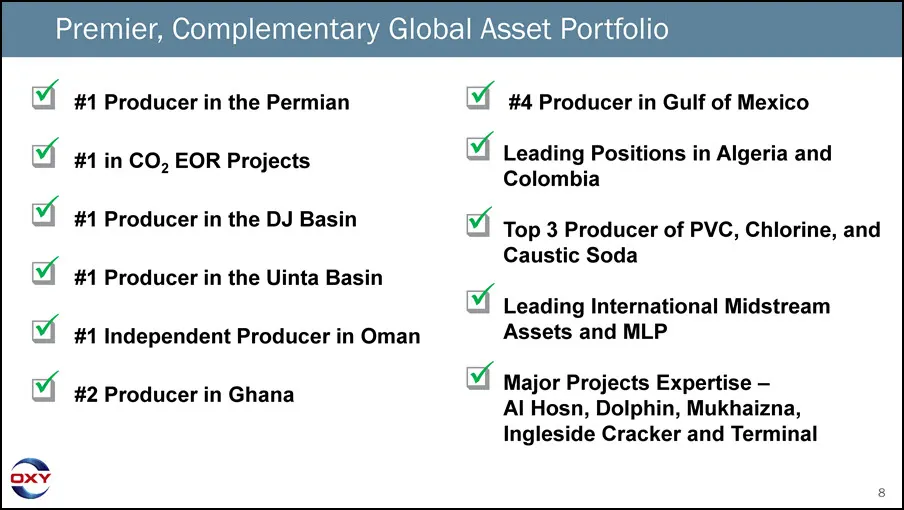
Premier, Complementary Global Asset Portfolio #1 Producer in the Permian #1 in CO2 EOR Projects #1 Producer in the DJ Basin #1 Producer in the Uinta Basin #1 Independent Producer in Oman #2 Producer in Ghana #4 Producer in Gulf of Mexico Leading Positions in Algeria and Colombia Top 3 Producer of PV
Slide 9: Combined global asset map and production
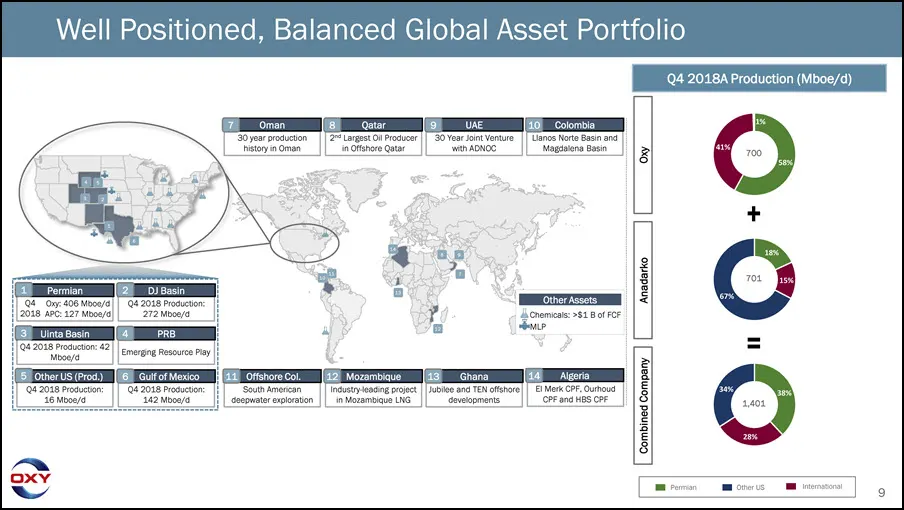
7 Oman 30 year production history in Oman 8 Qatar 2nd Largest Oil Producer in Offshore Qatar 9 UAE 30 Year Joint Venture with ADNOC 10 Colombia Llanos Norte Basin and Magdalena Basin Permian Q4 Oxy: 406 Mboe/d Uinta Basin Q4 2018 Production: 42 Mboe/d Other US (Prod.) Q4 2018 Production: 16Mboe/d DJ
Slide 10: Enhances Oxy as The Leading Operator in the Permian
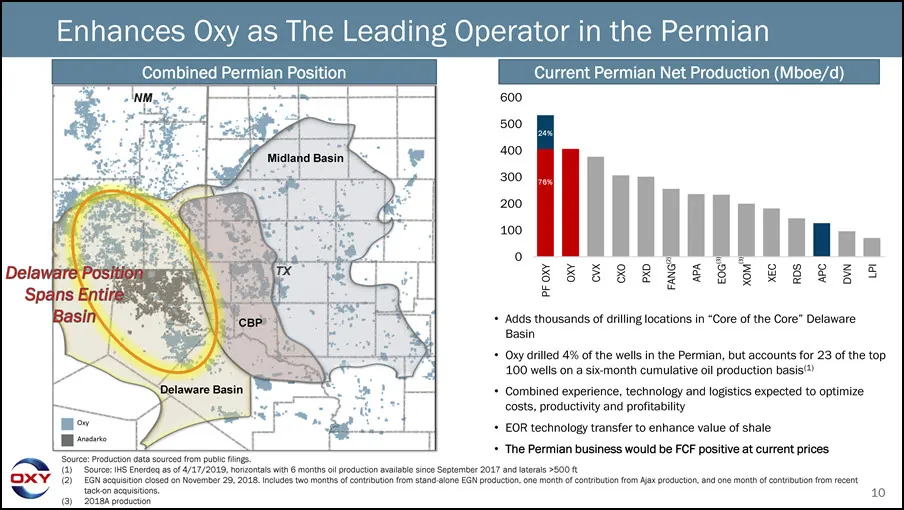
Enhances Oxy as The Leading Operator in the Permian Combined Permian Position Delaware Position Spans Entire Basin Source: Production data sourced from public filings. (1) Source: IHS Enerdeq as of 4/17/2019, horizontals with 6 months oil production available since September 2017 and laterals >500 f
Slide 11: Significant Identified Synergies with Potential Upside
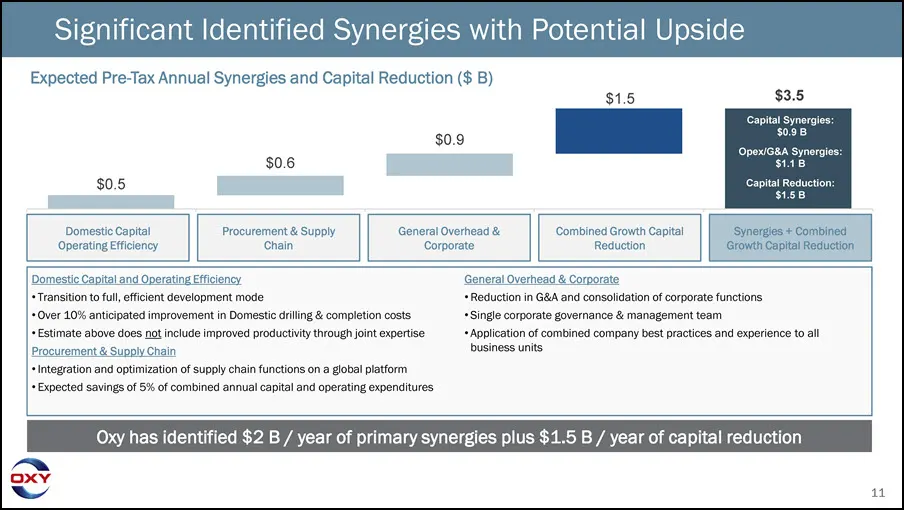
Significant Identified Synergies with Potential Upside Expected Pre-Tax Annual Synergies and Capital Reduction ($ B) $0.5 Domestic Capital and Operating Efficiency $0.6 Procurement & Supply Chain $0.9 General Overhead & Corporate $1.5 Combined Growth Capital Reduction $3.5 Capital Synergies: $0.9 B
Slide 12: Top Permian Basin Wells
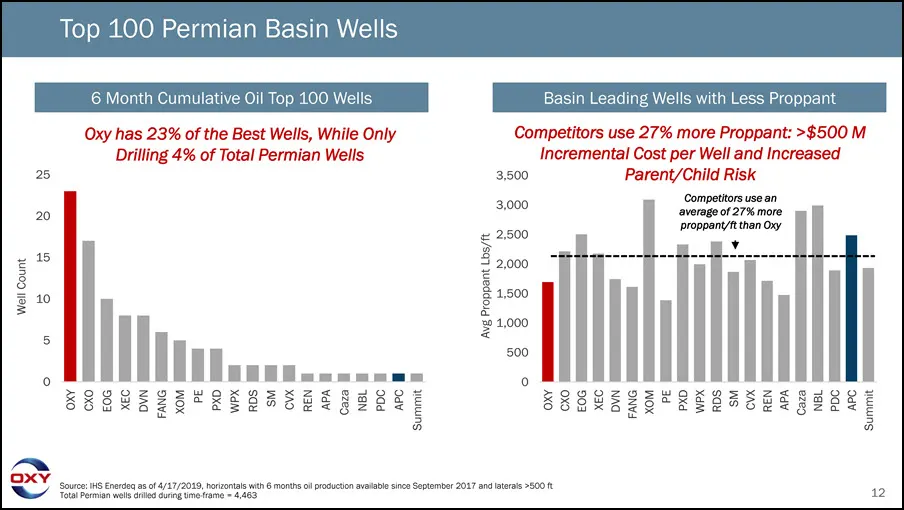
Top 100 Permian Basin Wells 6 Month Cumulative Oil Top 100 Wells Oxy has 23% of the Best Wells, While Only Drilling 4% of Total Permian Wells Basin Leading Wells with Less Proppant Competitors use 27% more Proppant: >$500 M Incremental Cost per Well and Increased Parent/Child Risk Competitors use an
Slide 13: Permian Expertise Applied Worldwide
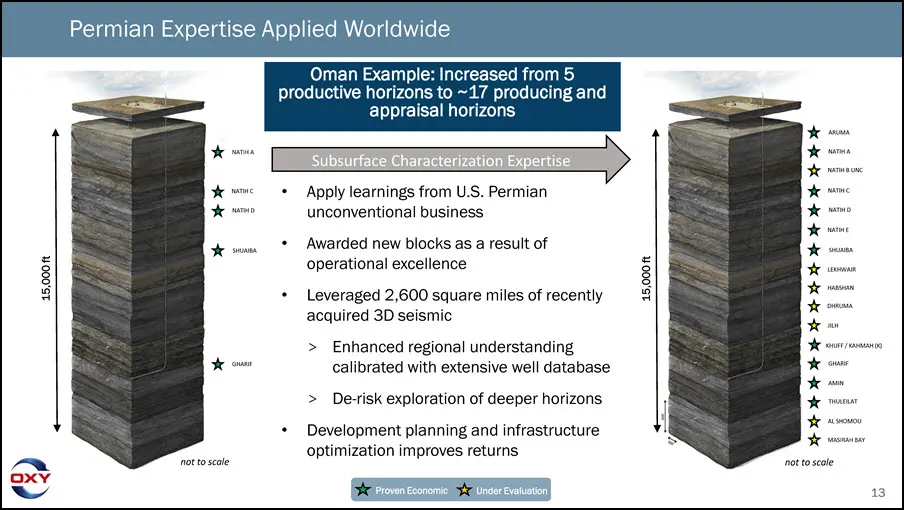
Permian Expertise Applied Worldwide 15,000 ft ARUMA NATIH A NATIH B UNC NATIH C NATIH D NATIH E SHUAIBA LEKHWAIR HABSHAN DHRUMA JILH GHARIF THULEILAT AL SHOMOU MASIRAH BAY Proven Economic Under Evaluation not to scale not to scale AMIN KHUFF / KAHMAH (K) NATIH A NATIH C NATIH D SHUAIBA GHARIF 15,000
Slide 14: Delivering Value
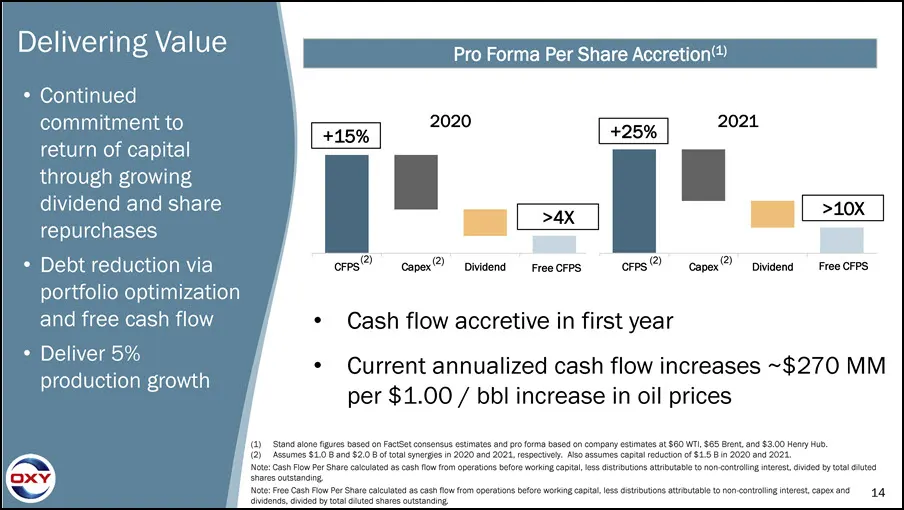
Delivering Value Continued commitment to return of capital through growing dividend and share repurchasesDebt reduction via portfolio optimization and free cash flowDeliver 5% production growth Stand alone figures based on FactSet consensus estimates and pro forma based on company estimates at $60 W
Slide 15: Appendix – World Class Upstream, Midstream, Chemicals, and Low Carbon Businesses
15 Appendix – World Class Upstream, Midstream, Chemicals, and Low Carbon Businesses
Slide 16: Oxy Consistently Returns Capital to Shareholders
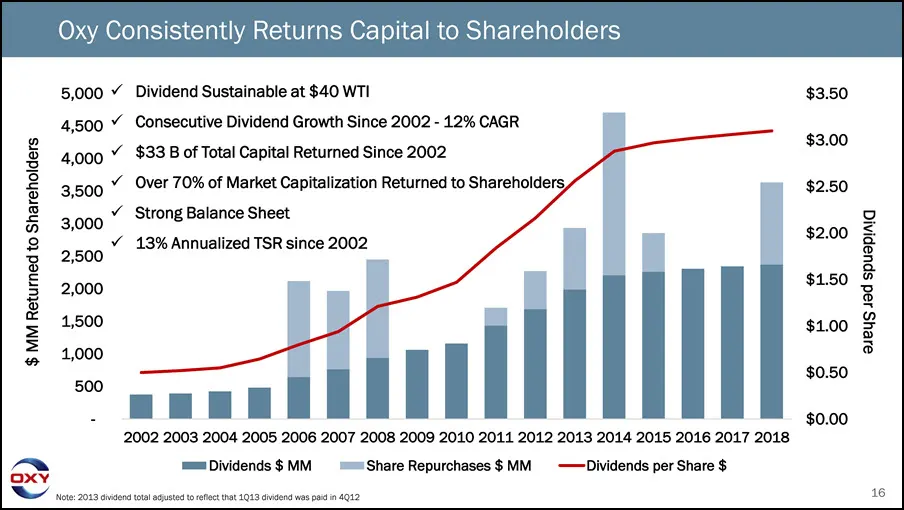
$0.00 $0.50 $1.00 $1.50 $2.00 $2.50 $3.00 $3.50 2,5002,0001,5001,000500- 4,000 2002 2003 2004 2005 2006 2007 2008 2009 2010 2011 2012 2013 2014 2015 2016 2017 2018 Oxy Consistently Returns Capital to Shareholders Dividends $ MM Share Repurchases $ MM Dividends per Share $Note: 2013 dividend total ad
Slide 17: Oxy's Complex, Major Project Capability
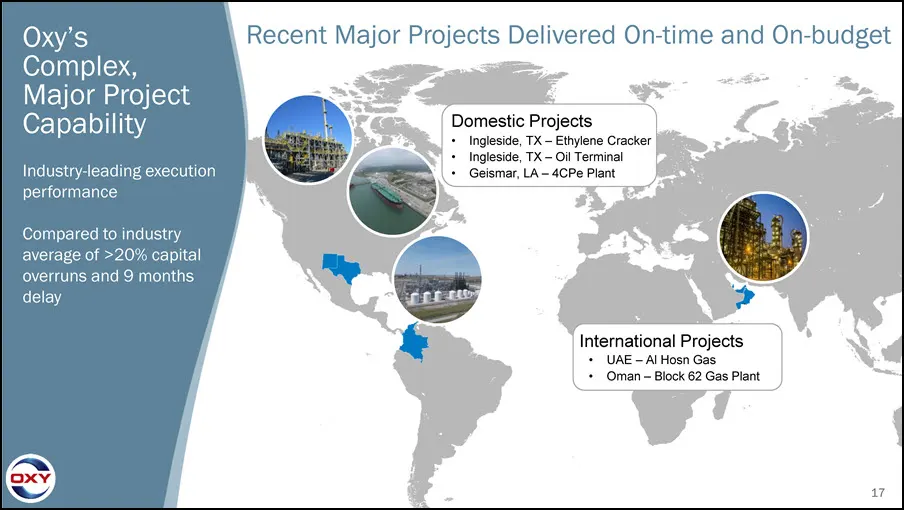
17 Oxy’s Complex, Major Project CapabilityIndustry-leading execution performanceCompared to industry average of >20% capital overruns and 9 months delay Domestic Projects Ingleside, TX – Ethylene CrackerIngleside, TX – Oil TerminalGeismar, LA – 4CPe Plant International ProjectsUAE – Al Hosn GasOman
Slide 18: DJ Basin – Free Cash Flow and Growth Potential
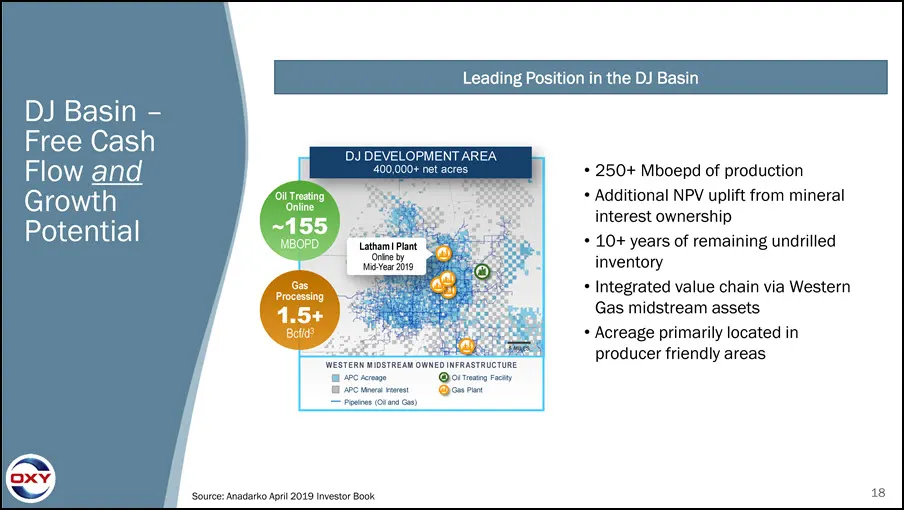
250+ Mboepd of production Additional NPV uplift from mineral interest ownership10+ years of remaining undrilled inventoryIntegrated value chain via Western Gas midstream assetsAcreage primarily located in producer friendly areas DJ Basin – Free Cash Flow and Growth Potential Source: Anadarko April 2
Slide 19: Gulf of Mexico – Stable Free Cash Flow
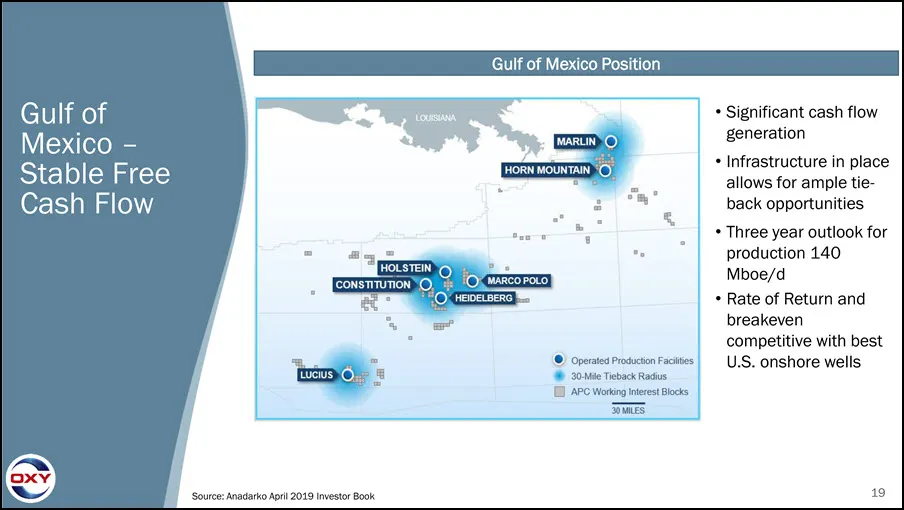
Gulf of Mexico – Stable Free Cash Flow Gulf of Mexico Position Significant cash flow generation Infrastructure in place allows for ample tie-back opportunitiesThree year outlook for production 140 Mboe/dRate of Return and breakeven competitive with best U.S. onshore wells Source: Anadarko April 2019
Slide 20: International Portfolio
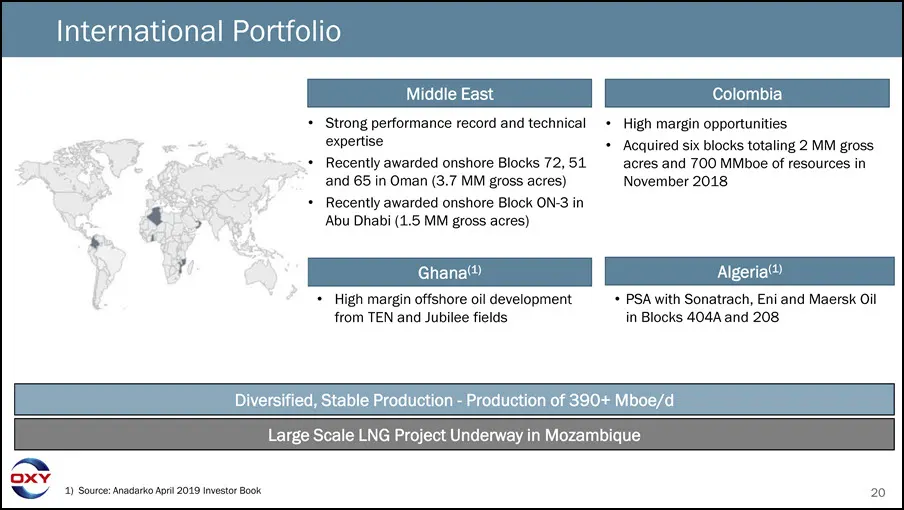
International Portfolio Strong performance record and technical expertiseRecently awarded onshore Blocks 72, 51and 65 in Oman (3.7 MM gross acres)Recently awarded onshore Block ON-3 in Abu Dhabi (1.5 MM gross acres) Colombia Middle East High margin opportunitiesAcquired six blocks totaling 2 MM gros
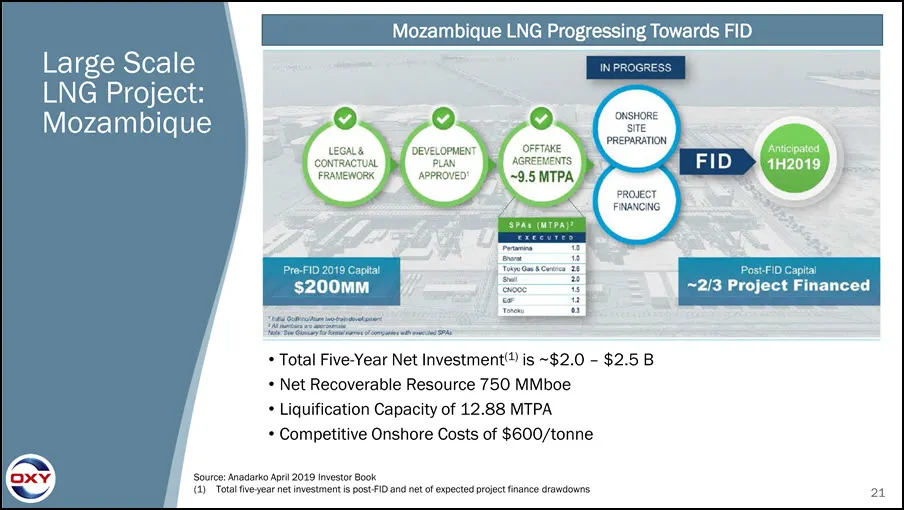
Slide 21: Large Scale LNG Project: Mozambique
Large Scale LNG Project: Mozambique Total Five-Year Net Investment(1) is ~$2.0 – $2.5 BNet Recoverable Resource 750 MMboeLiquification Capacity of 12.88 MTPACompetitive Onshore Costs of $600/tonne Source: Anadarko April 2019 Investor Book (1) Total five-year net investment is post-FID and net of exp
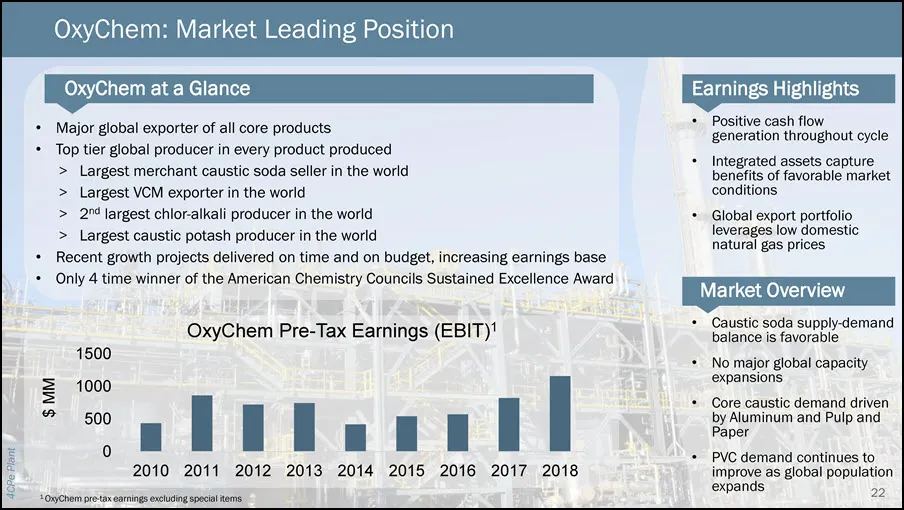
Slide 22: OxyChem: Market Leading Position
OxyChem: Market Leading Position 1 OxyChem pre-tax earnings excluding special items 2010 2011 2012 2013 2014 2015 2016 2017 2018 $ MM OxyChem Pre-Tax Earnings (EBIT)1 4CPe Plant Market Overview Caustic soda supply-demandbalance is favorableNo major global capacity expansionsCore caustic demand drive
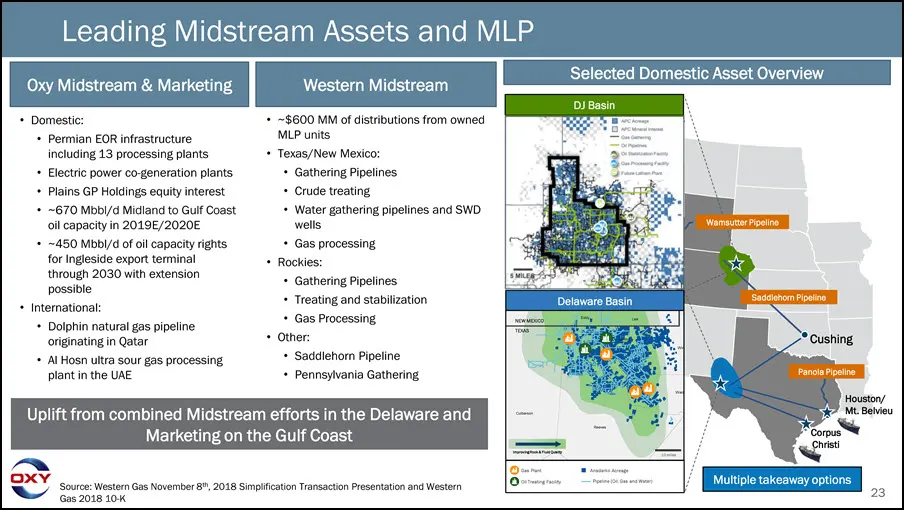
Slide 23: Leading Midstream Assets and MLP
Cushing Wamsutter Pipeline Saddlehorn Pipeline Panola Pipeline Delaware Basin DJ Basin Lea Loving Eddy W in W ard Reeves Culberson Improving Rock & Fluid Quality 10 miles NEW MEXICO TEXAS Gas Plant Anadarko Acreage Oil Treating Facility Pipeline (Oil, Gas and Water) Domestic: Permian EOR infrastruct
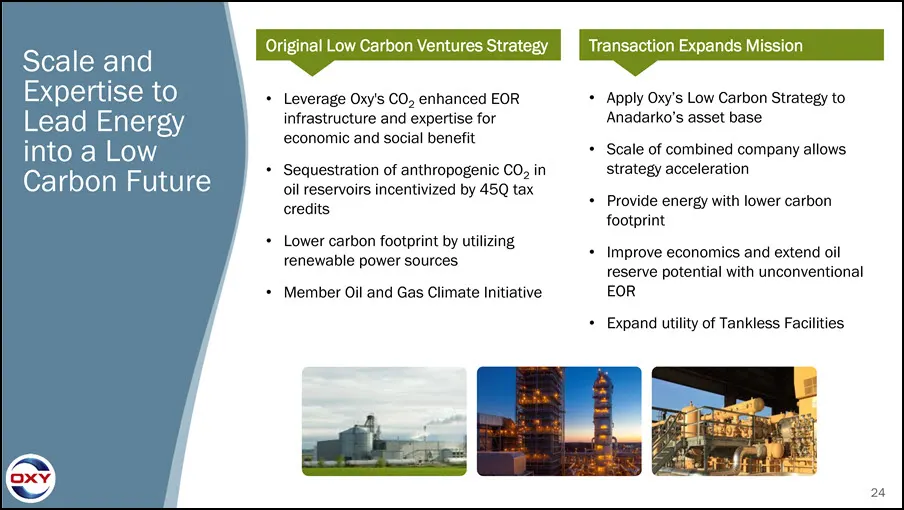
Slide 24: Apply Oxy's Low Carbon Strategy to Anadarko's asset base
24 Apply Oxy’s Low Carbon Strategy to Anadarko’s asset baseScale of combined company allows strategy accelerationProvide energy with lower carbon footprintImprove economics and extend oil reserve potential with unconventional EORExpand utility of Tankless Facilities Original Low Carbon Ventures Stra
Slide 25: Appendix – Permian Performance Enhancement Potential not Captured in Synergies
25 Appendix – Permian Performance Enhancement Potential not Captured in Synergies
Slide 26: Continuous Improvement in Permian Resources Well Performance
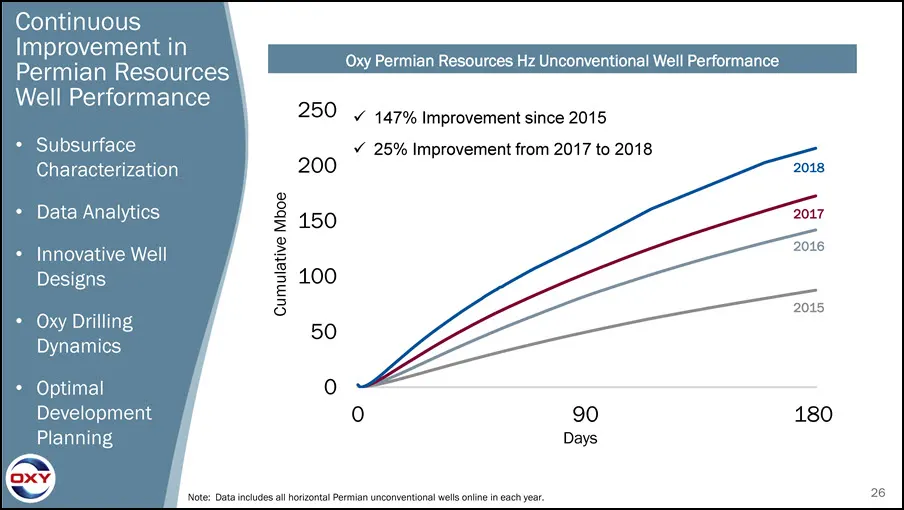
0 50 100 150 200 250 0 180 Oxy Permian Resources Hz Unconventional Well Performance Continuous Improvement in Permian Resources Well Performance Subsurface Characterization Data AnalyticsInnovative WellDesignsOxy Drilling DynamicsOptimal Development Planning 2015 2016 2017 2018 147% Improvement sinc
Slide 27: Oxy's Play Leading Delaware Basin Performance
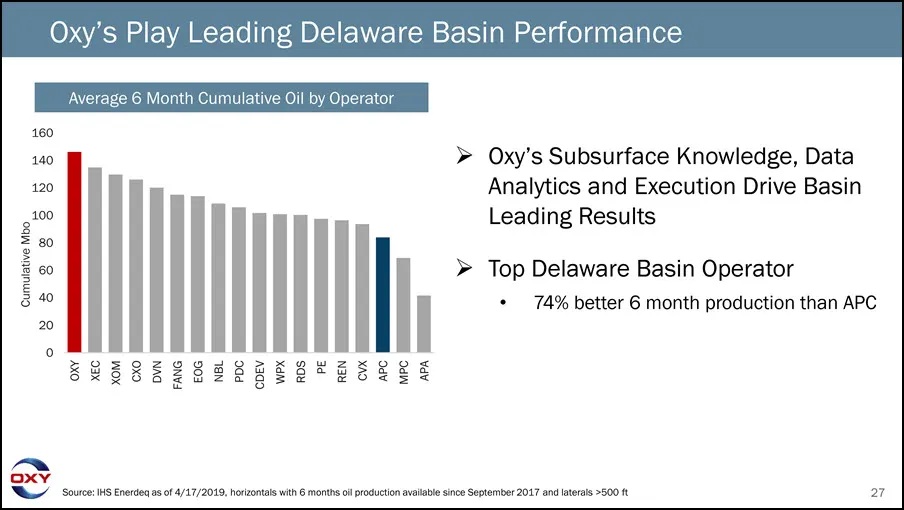
27 Oxy’s Play Leading Delaware Basin Performance Source: IHS Enerdeq as of 4/17/2019, horizontals with 6 months oil production available since September 2017 and laterals >500 ft Average 6 Month Cumulative Oil by Operator Oxy’s Subsurface Knowledge, Data Analytics and Execution Drive Basin Leading R
Slide 28: ! a so) iS (3) (ot, S, <x Other
! a so) iS (3) (ot, S, <x Other
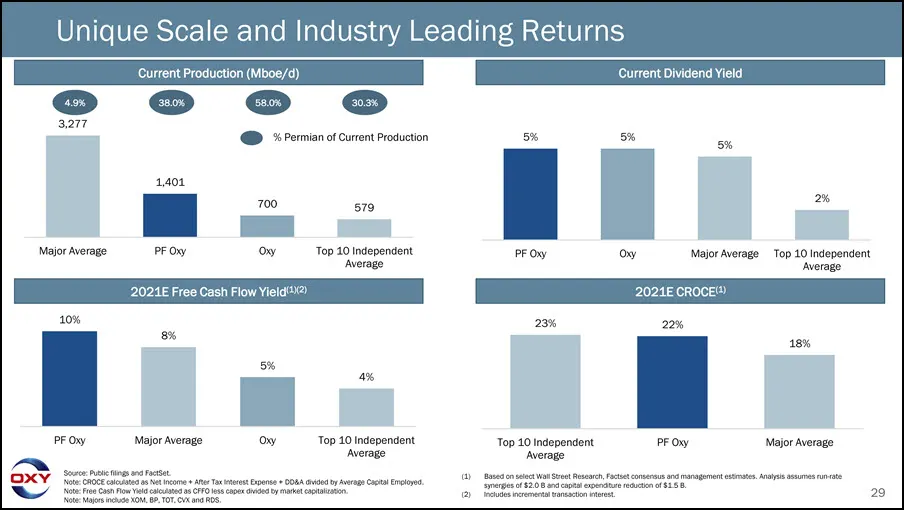
Slide 29: Unique Scale and Industry Leading Returns
29 1,401 700 579 Major Average PF Oxy Oxy Top 10 Independent Average Based on select Wall Street Research, Factset consensus and management estimates. Analysis assumes run-ratesynergies of $2.0 B and capital expenditure reduction of $1.5 B.Includes incremental transaction interest. Unique Scale and
Source: SEC EDGAR · 425 filed Apr 24, 2019
More decks from Anadarko Petroleum Corp
 Q2 2019 Earnings Presentation36 slides · Aug 1, 2019
 Merger or Acquisition (May 2019)45 slides · May 29, 2019
 Merger or Acquisition (May 2019)23 slides · May 6, 2019
 Q1 2019 Earnings Presentation20 slides · May 6, 2019
 Merger or Acquisition (April 2019)5 slides · Apr 24, 2019
 Merger or Acquisition (April 2019)15 slides · Apr 12, 2019