Orbitz Worldwide — Investor Day (November 2011)
87 slides from Orbitz Worldwide's investor day presentation, Nov 10, 2011
Slide 1: Analyst & Investor Day November 9, 2011
Analyst & Investor Day November 9, 2011
Slide 2: Agenda
Barney Harford Introduction Tamer Tamar International Chris Orton Orbitz.com & CheapTickets.com Ronnie Gurion Private Label Distribution Roger Liew Technology Russ Hammer Finance Barney Harford Wrap up Agenda page 2
Slide 3: Orbitz Worldwide: A Leading Global Online Travel Company
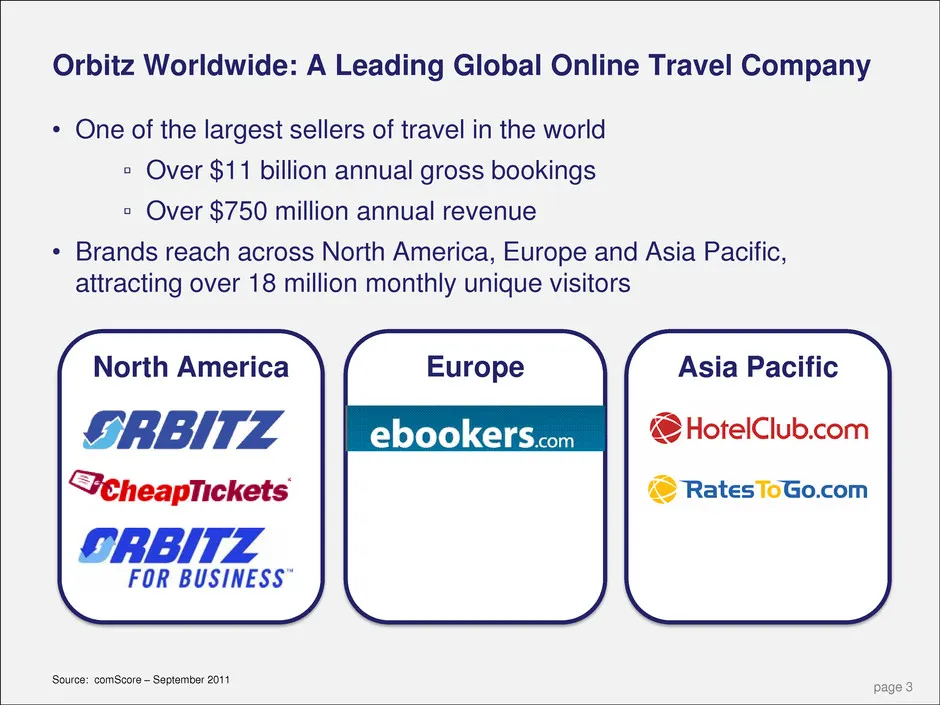
Europe Asia Pacific North America Orbitz Worldwide: A Leading Global Online Travel Company • One of the largest sellers of travel in the world ▫ Over $11 billion annual gross bookings ▫ Over $750 million annual revenue • Brands reach across North America, Europe and Asia Pacific, attracting over 18
Slide 4: Mission: top hotel distribution platform
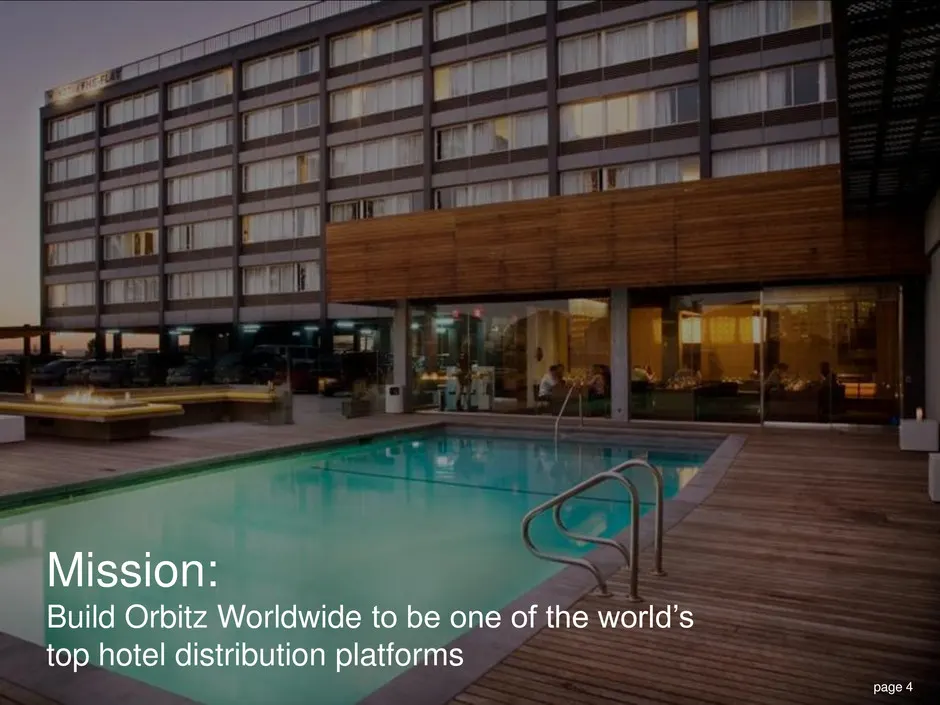
Mission: Build Orbitz Worldwide to be one of the world’s top hotel distribution platforms page 4
Slide 5: Why Hotel?
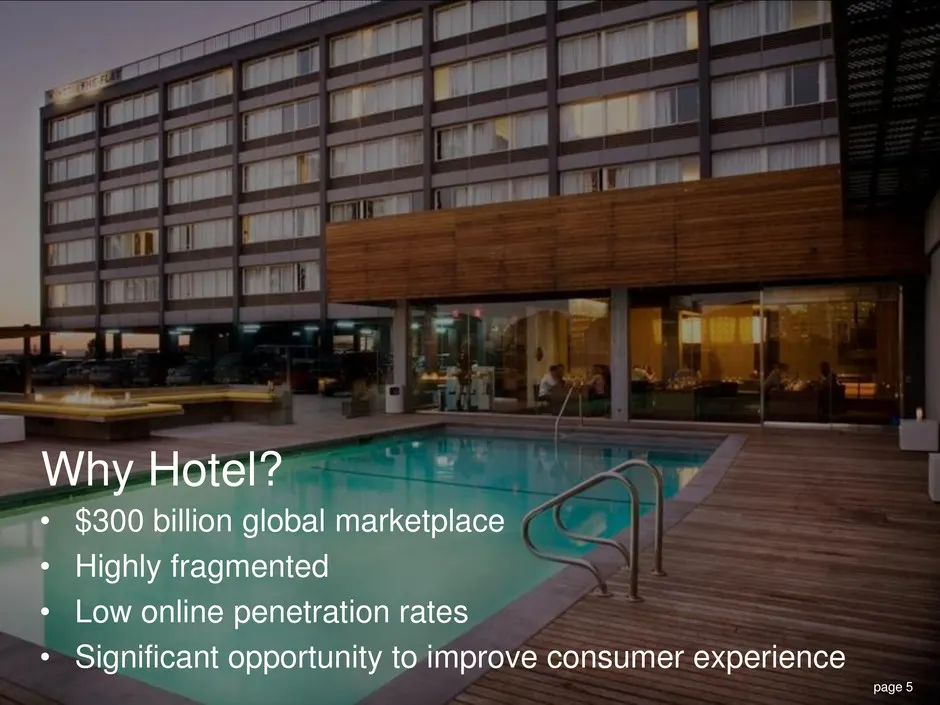
• $300 billion global marketplace • Highly fragmented • Low online penetration rates • Significant opportunity to improve consumer experience Why Hotel? page 5
Slide 6: Strongly Positioned for Long Term Growth
Orbitz Worldwide: Strongly Positioned for Long Term Growth • Global technology platform • Data infrastructure • Advanced analytics • International • Private label distribution page 6
Slide 7: Agenda
Barney Harford Introduction Tamer Tamar International Chris Orton Orbitz.com & CheapTickets.com Ronnie Gurion Private Label Distribution Roger Liew Technology Russ Hammer Finance Barney Harford Wrap up Agenda page 7
Slide 8: European Online Travel Segment
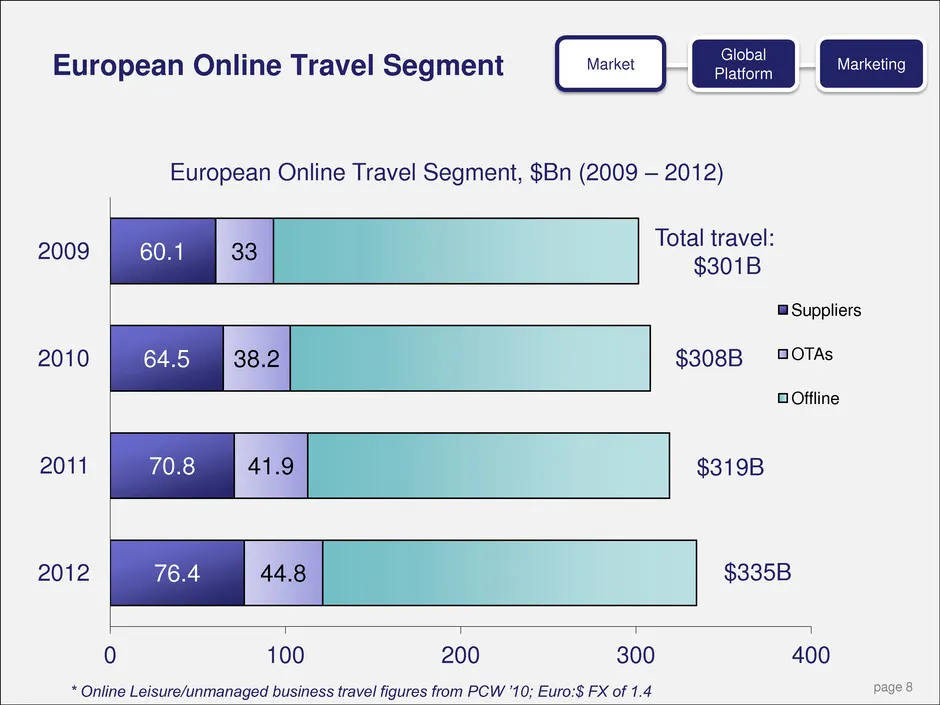
76.4 70.8 64.5 60.1 44.8 41.9 38.2 33 0 100 200 300 400 2012 2011 2010 2009 Suppliers OTAs Offline Total travel: $301B $308B $319B $335B European Online Travel Segment, $Bn (2009 – 2012) * Online Leisure/unmanaged business travel figures from PCW ’10; Euro:$ FX of 1.4 European Online Travel Segment
Slide 9: European Online Hotel Segment
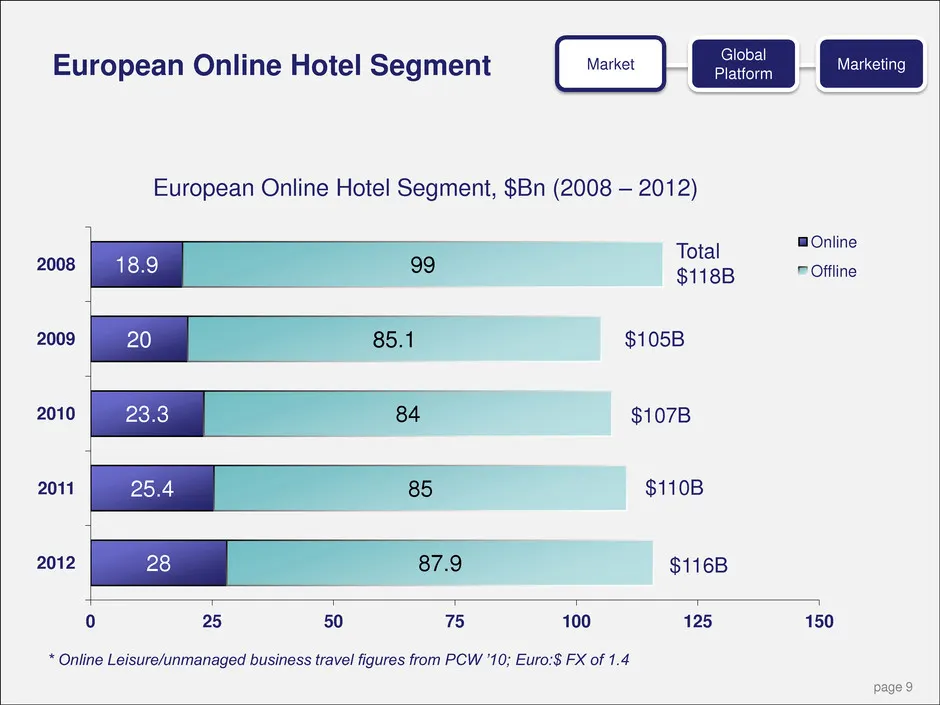
28 25.4 23.3 20 18.9 87.9 85 84 85.1 99 0 25 50 75 100 125 150 2012 2011 2010 2009 2008 Online Offline Total $118B $105B $107B $110B European Online Hotel Segment, $Bn (2008 – 2012) * Online Leisure/unmanaged business travel figures from PCW ’10; Euro:$ FX of 1.4 $116B European Online Hotel Segment
Slide 10: ebookers – 3 Regions, 12 Countries
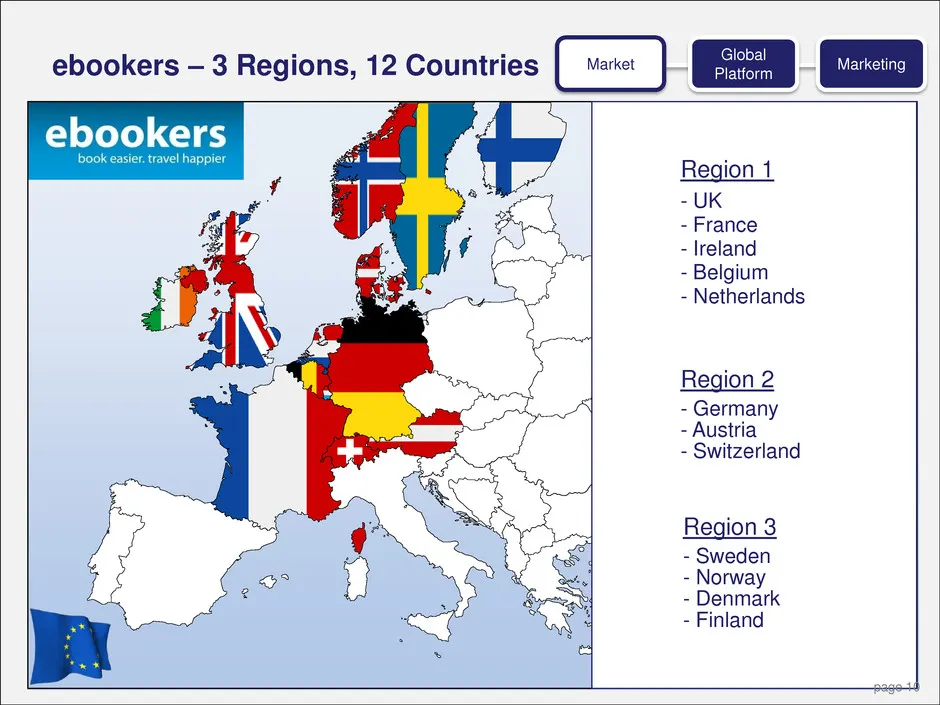
Region 1 - UK - France - Ireland - Belgium - Netherlands Region 2 - Germany - Austria - Switzerland Region 3 - Sweden - Norway - Denmark - Finland ebookers – 3 Regions, 12 Countries Market Global Platform Marketing page 10
Slide 11: Competitive Landscape
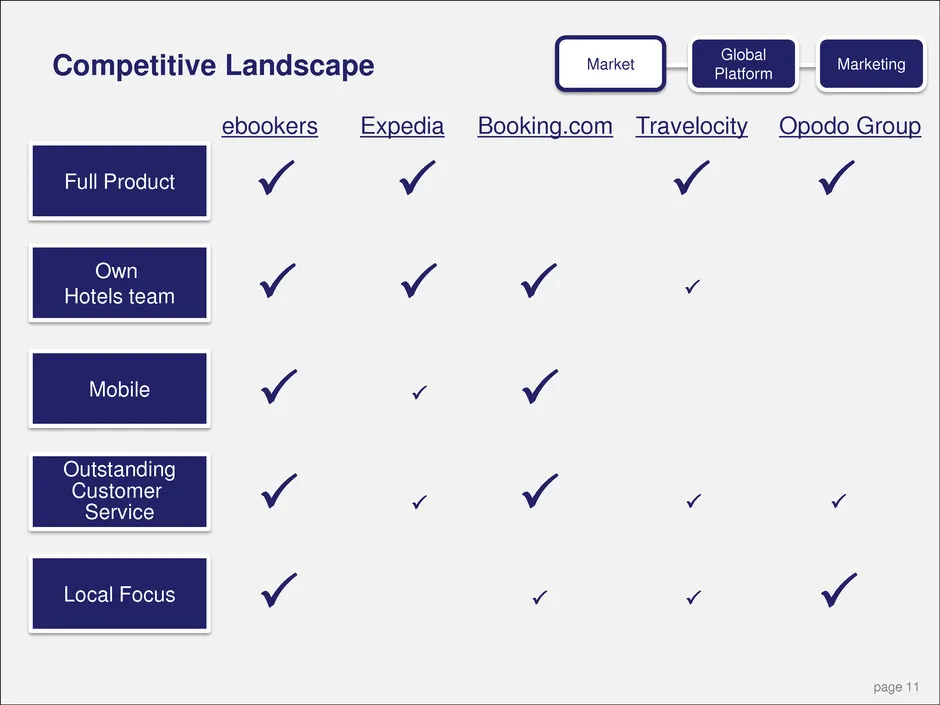
Full Product Own Hotels team Mobile Outstanding Customer Service Local Focus ebookers Expedia Booking.com Travelocity Opodo Group Competitive Landscape Market Global Platform Marketing page 11
Slide 12: ebookers Share Gains
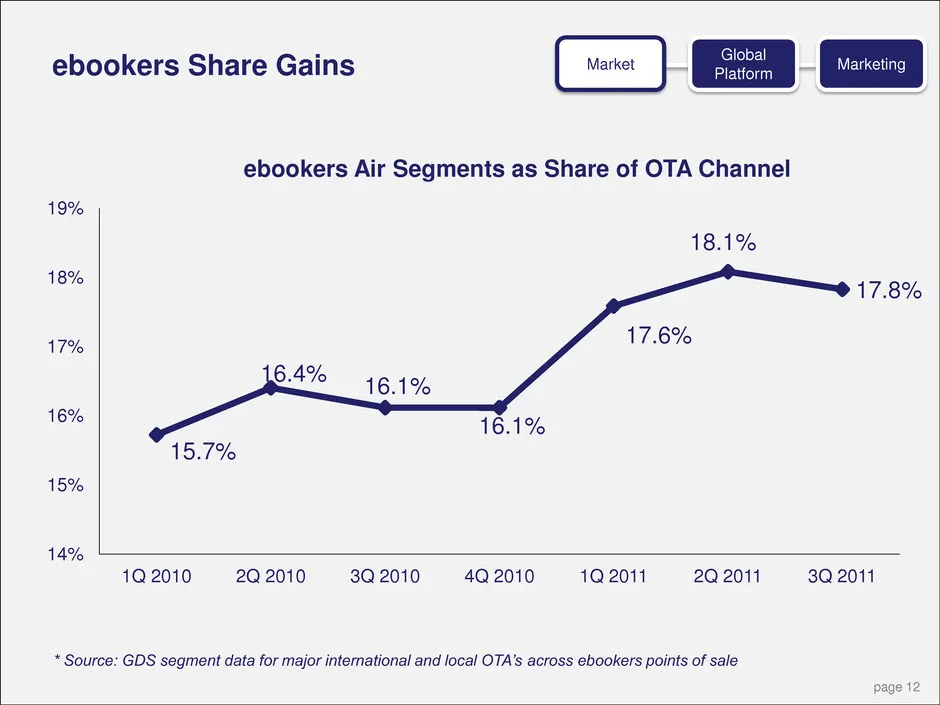
15.7% 16.4% 16.1% 16.1% 17.6% 18.1% 17.8% 14% 15% 16% 17% 18% 19% 1Q 2010 2Q 2010 3Q 2010 4Q 2010 1Q 2011 2Q 2011 3Q 2011 ebookers Air Segments as Share of OTA Channel * Source: GDS segment data for major international and local OTA’s across ebookers points of sale ebookers Share Gains Market Global
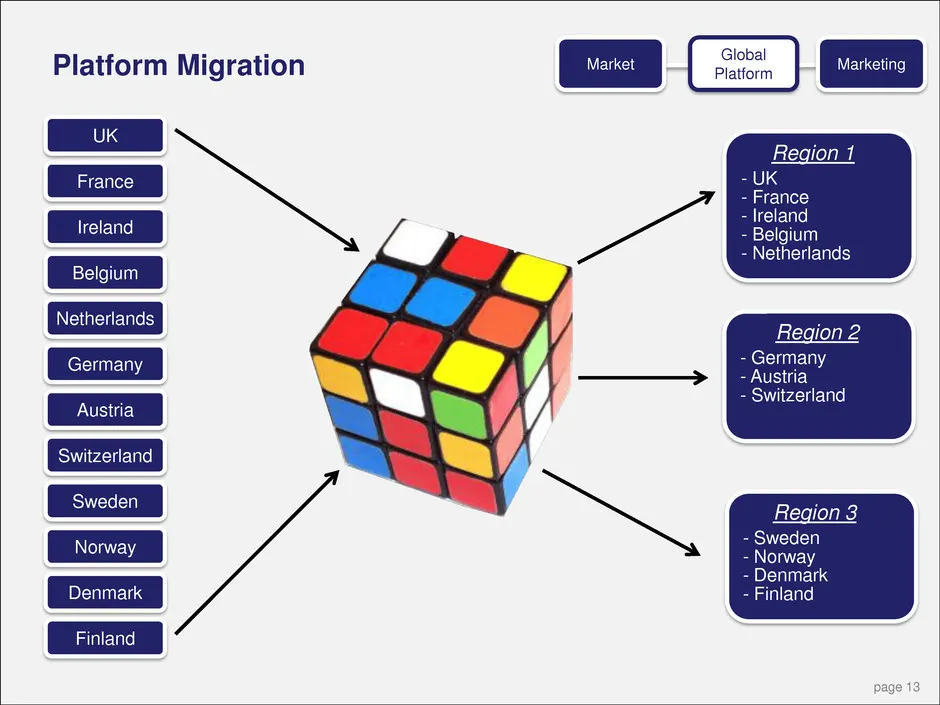
Slide 13: Platform Migration
UK France Ireland Belgium Netherlands Germany Austria Switzerland Sweden Norway Denmark Finland Region 1 - UK - France - Ireland - Belgium - Netherlands Region 2 - Germany - Austria - Switzerland Region 3 - Sweden - Norway - Denmark - Finland Market Global Platform Marketing Platform Migration page
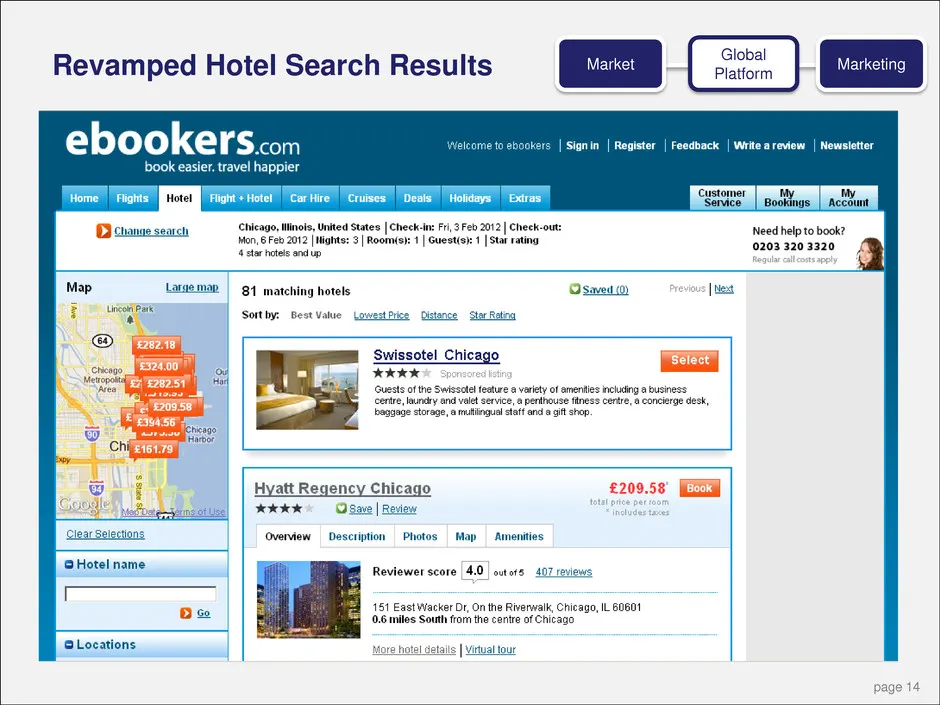
Slide 14: Revamped Hotel Search Results
Revamped Hotel Search Results Market Global Platform Marketing page 14
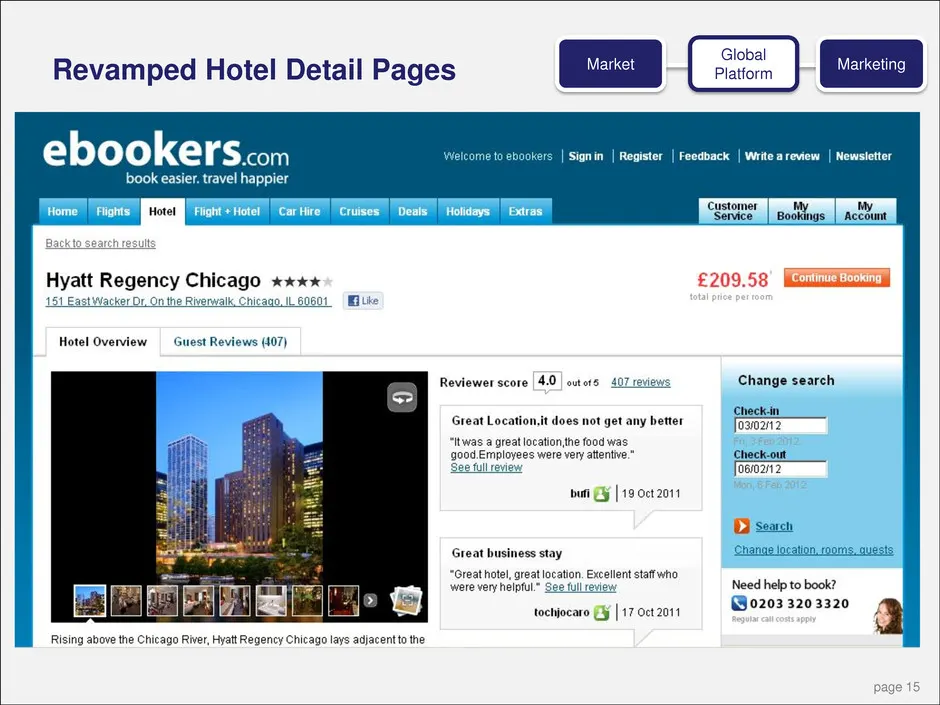
Slide 15: Revamped Hotel Detail Pages
Market Global Platform Marketing Revamped Hotel Detail Pages page 15
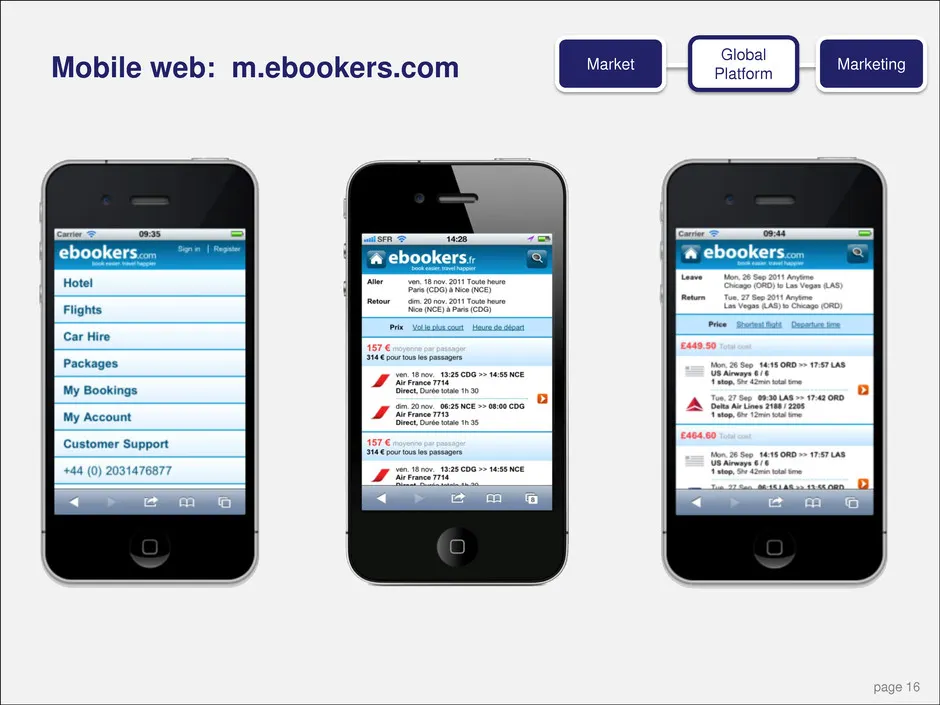
Slide 16: Mobile web: m.ebookers.com
Mobile web: m.ebookers.com Market Global Platform Marketing page 16
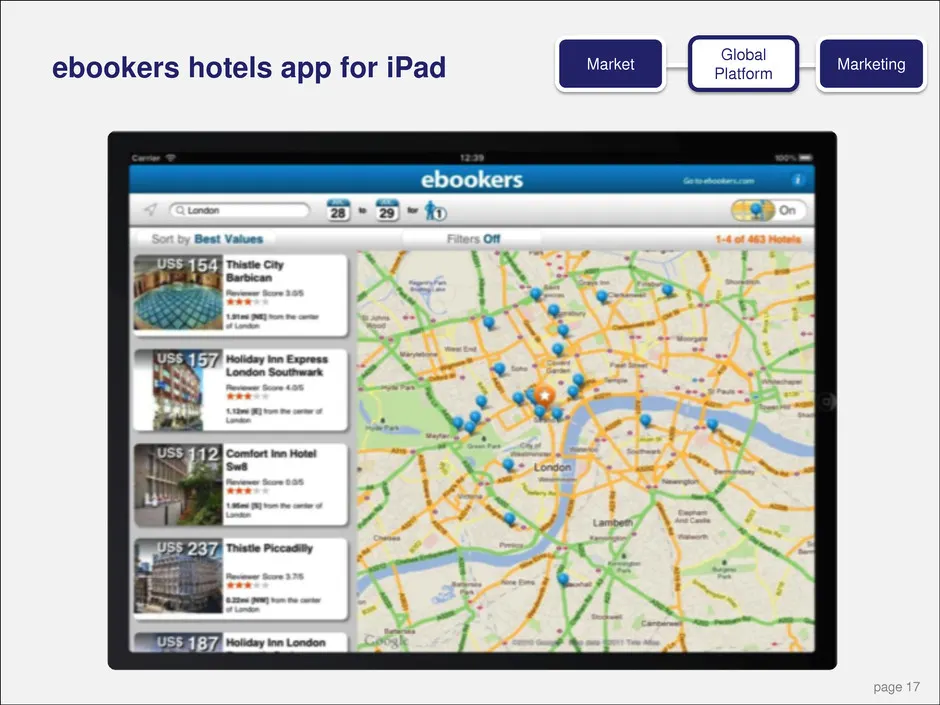
Slide 17: ebookers hotels app for iPad
ebookers hotels app for iPad Market Global Platform Marketing page 17
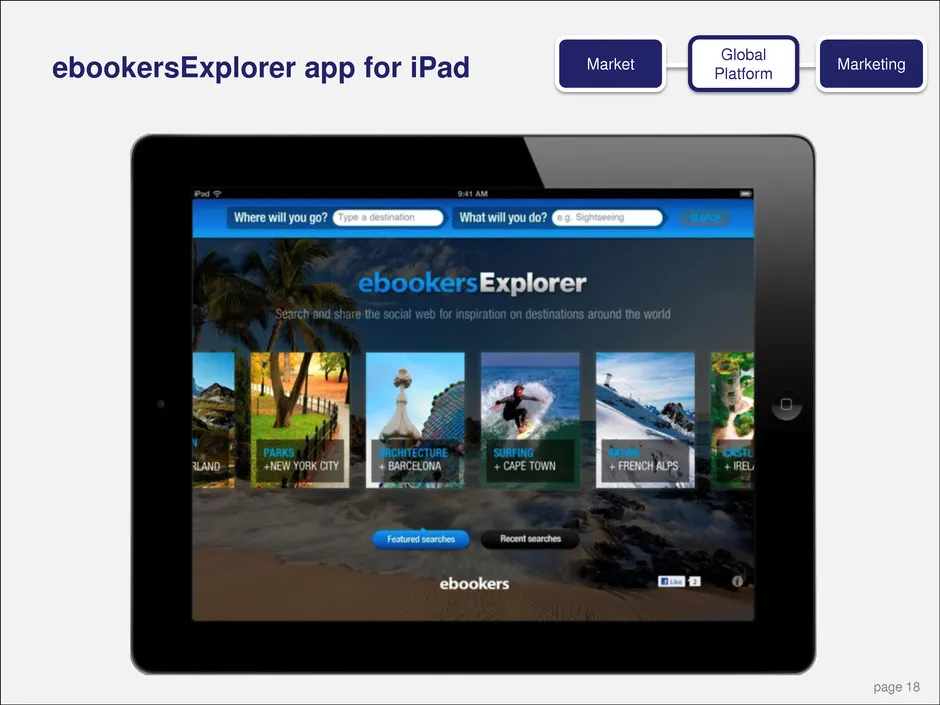
Slide 18: ebookersExplorer app for iPad
ebookersExplorer app for iPad Market Global Platform Marketing page 18
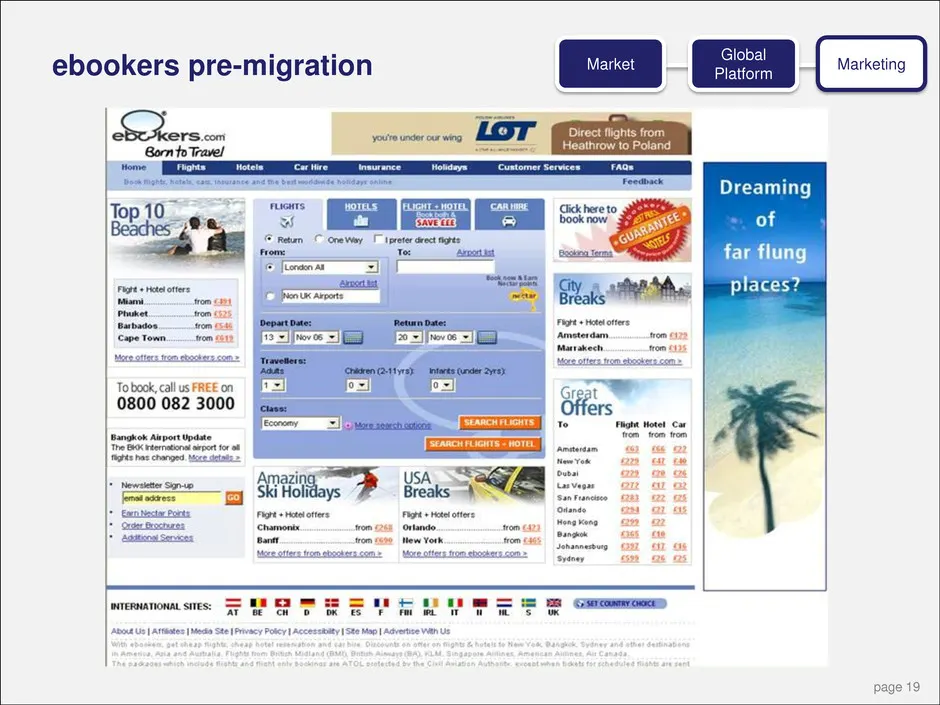
Slide 19: ebookers pre-migration
Market Global Platform Marketing ebookers pre-migration page 19
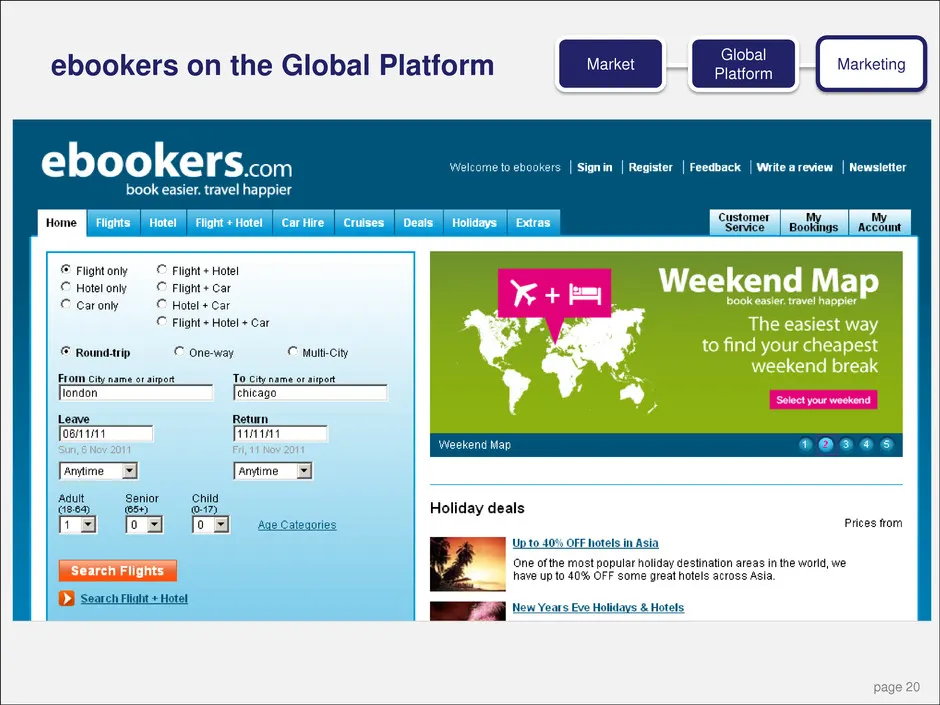
Slide 20: ebookers on the Global Platform
Market Global Platform Marketing ebookers on the Global Platform page 20
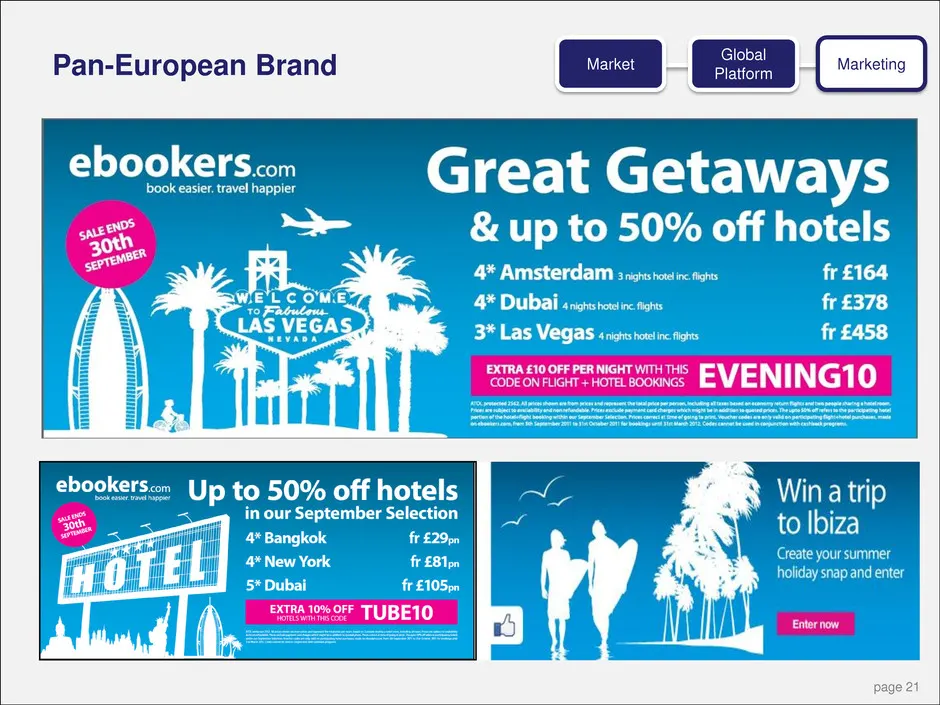
Slide 21: Pan-European Brand
Pan-European Brand Market Global Platform Marketing page 21
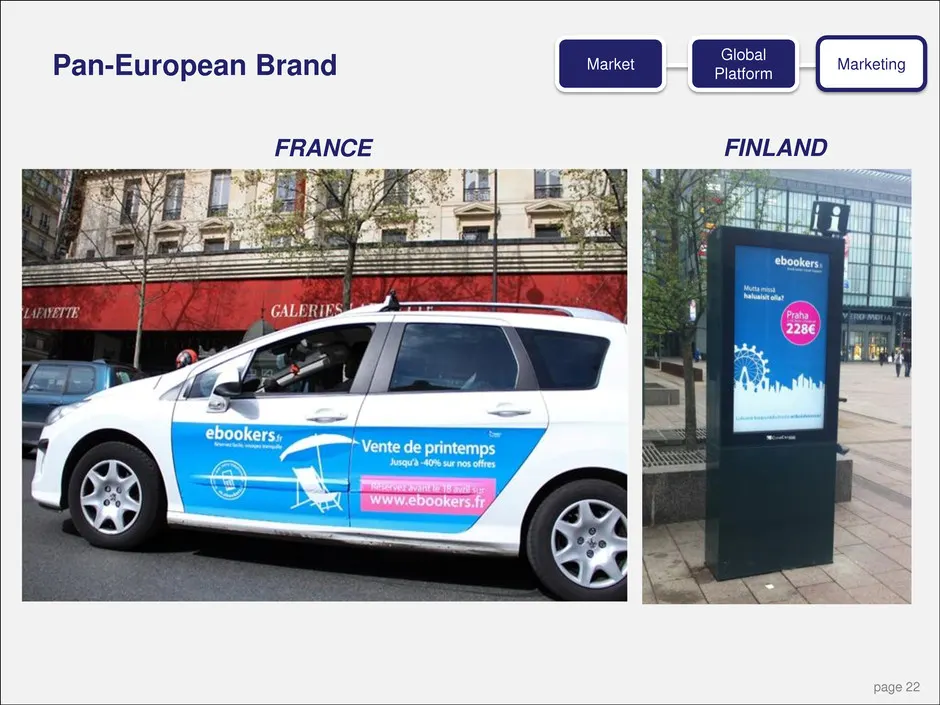
Slide 22: Pan-European Brand
FRANCE FINLAND Market Global Platform Marketing Pan-European Brand page 22
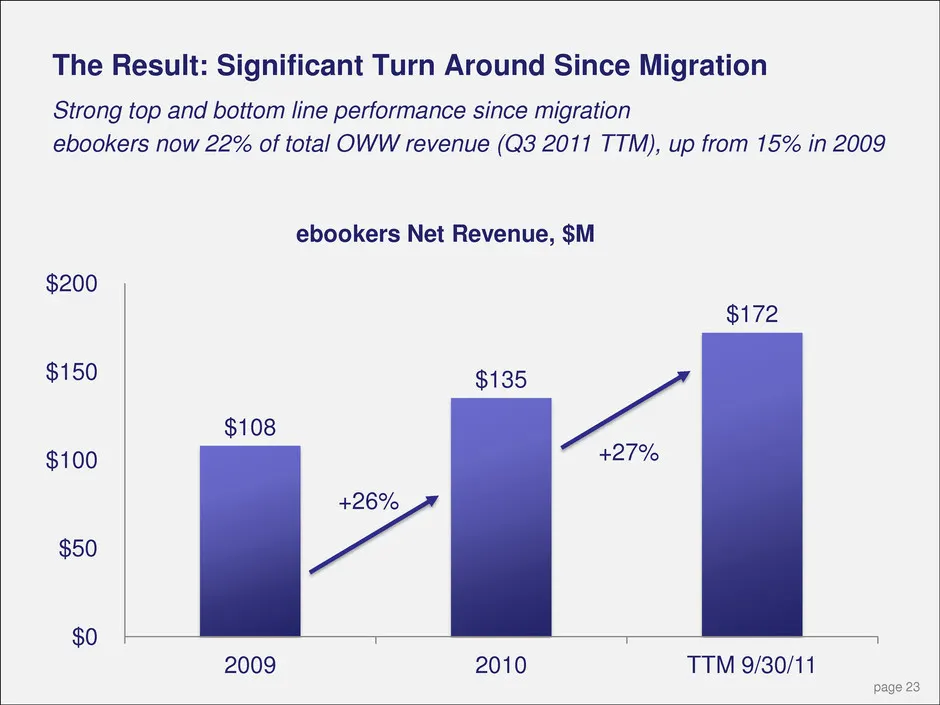
Slide 23: The Result: Significant Turn Around Since Migration
The Result: Significant Turn Around Since Migration $108 $135 $172 $0 $50 $100 $150 $200 2009 2010 TTM 9/30/11 ebookers Net Revenue, $M Strong top and bottom line performance since migration ebookers now 22% of total OWW revenue (Q3 2011 TTM), up from 15% in 2009 +26% +27% page 23

Slide 24: Clear strategy & focus
Clear strategy & focus page 24
Slide 25: Agenda
Barney Harford Introduction Tamer Tamar International Chris Orton Orbitz.com & CheapTickets.com Ronnie Gurion Private Label Distribution Roger Liew Technology Russ Hammer Finance Barney Harford Wrap up Agenda page 25
Slide 26: Agenda
Barney Harford Introduction Tamer Tamar International Chris Orton Orbitz.com & CheapTickets.com Ronnie Gurion Private Label Distribution Roger Liew Technology Russ Hammer Finance Barney Harford Wrap up Agenda page 26
Slide 27: Two Leading OTA Brands: Orbitz and CheapTickets
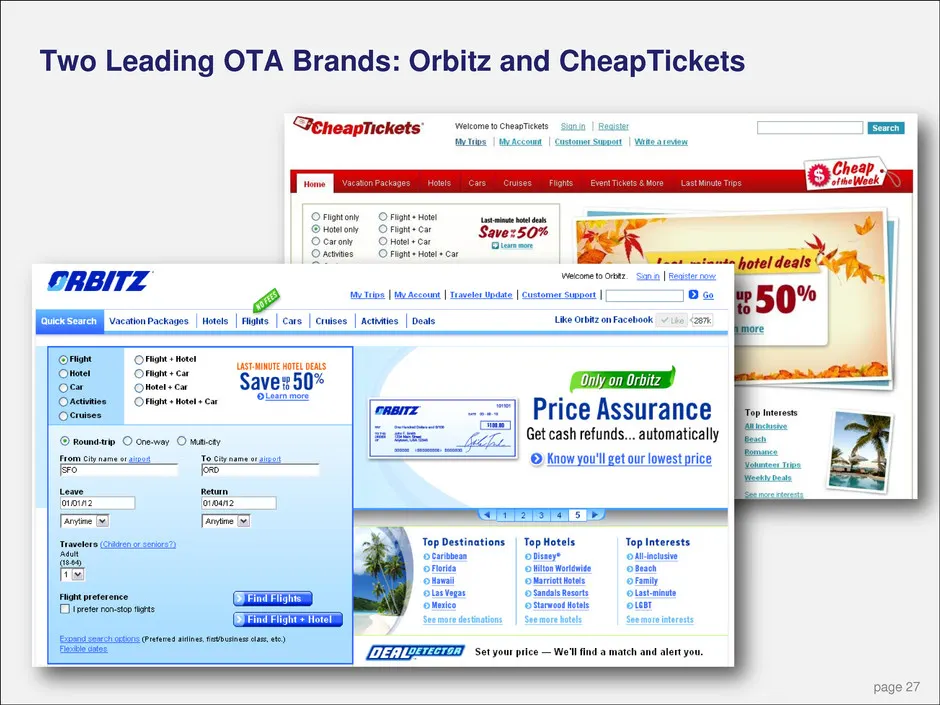
Two Leading OTA Brands: Orbitz and CheapTickets page 27
Slide 28: Improving Operating Performance
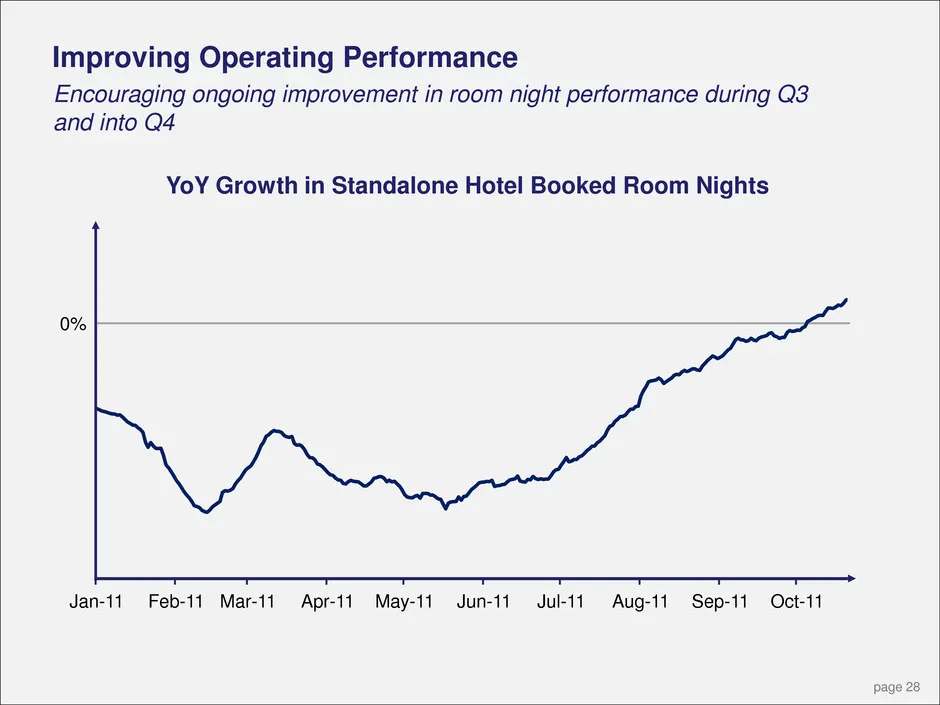
Improving Operating Performance -30% Jan-11 Feb-11 Mar-11 Apr-11 May-11 Jun-11 Jul-11 Aug-11 Sep-11 Oct-11 0% page 28 YoY Growth in Standalone Hotel Booked Room Nights Encouraging ongoing improvement in room night performance during Q3 and into Q4
Slide 29: Marketing Optimization
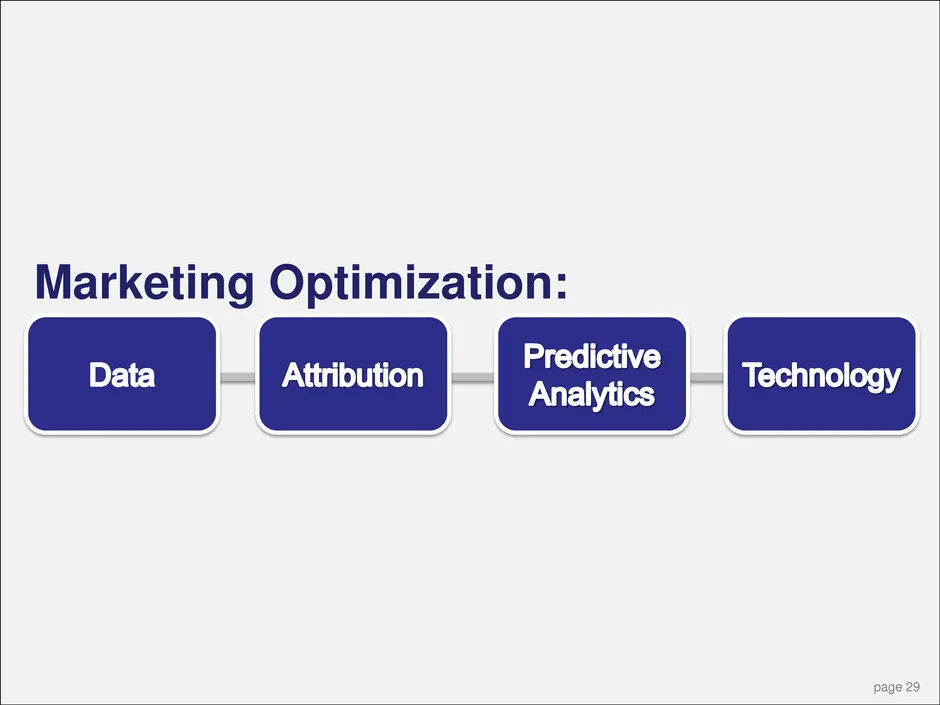
Marketing Optimization: page 29
Slide 30: Tracking
Tracking: Combining granular source data with onsite funnel metrics Marketing Optimization: Data Attribution Predictive Analytics Technology page 30
Slide 31: Attribution
Attribution: Differentiating between correlation and causation to optimize for incremental transactions Marketing Optimization: Data Attribution Predictive Analytics Technology page 31
Slide 32: Predictive Analytics
Predictive Analytics: Organizing sparse data to make better long-tail optimization decisions Marketing Optimization: Data Attribution Predictive Analytics Technology page 32
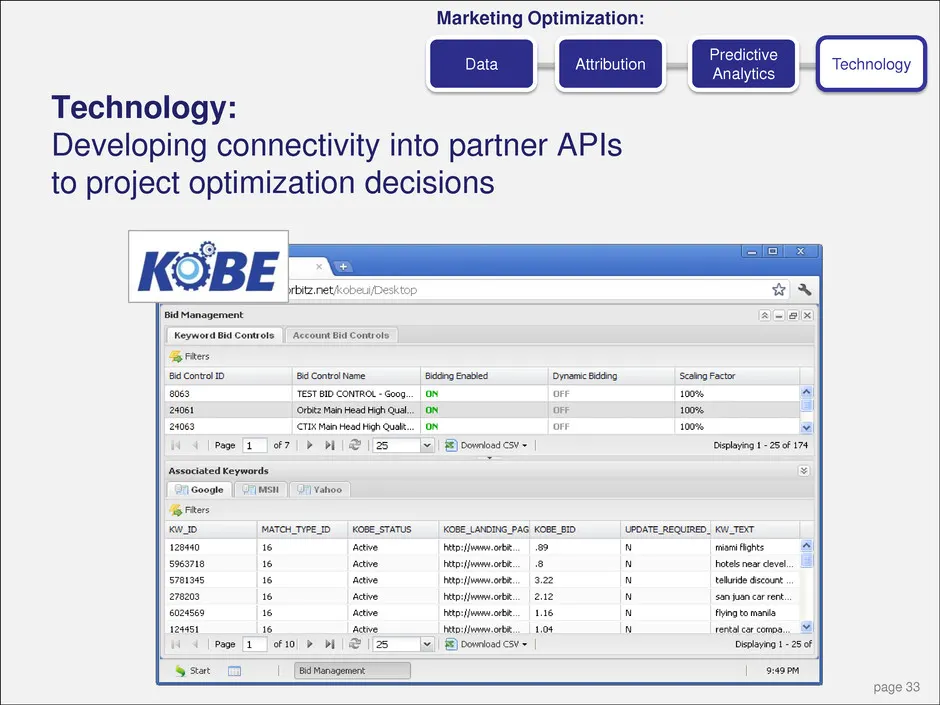
Slide 33: Technology
Technology: Developing connectivity into partner APIs to project optimization decisions Marketing Optimization: Data Attribution Predictive Analytics Technology page 33
Slide 34: Measurement
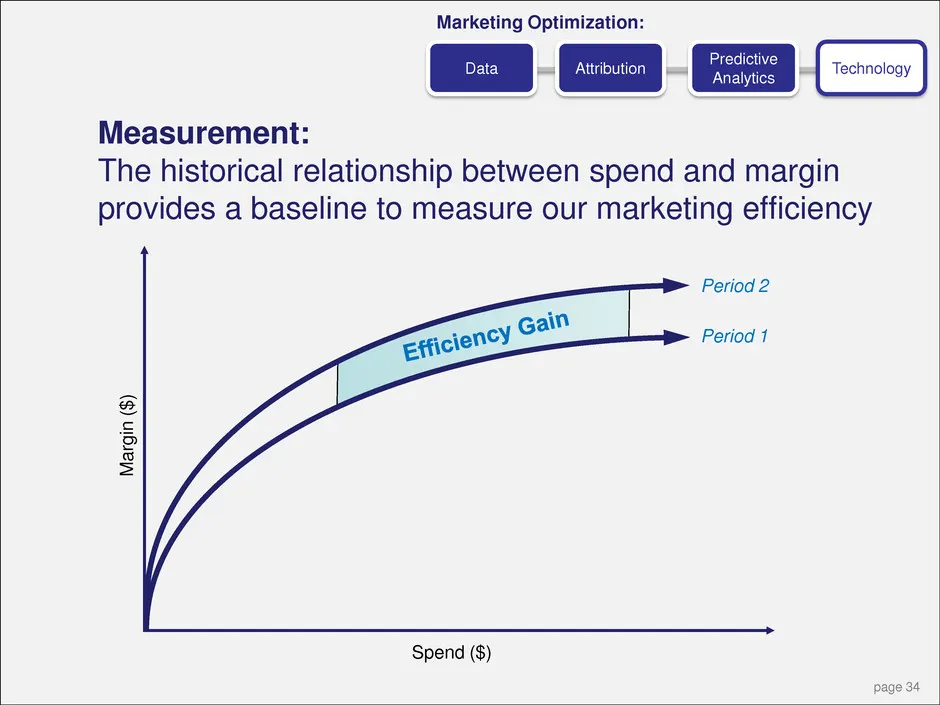
Measurement: The historical relationship between spend and margin provides a baseline to measure our marketing efficiency Spend ($) M argin ($ ) Period 1 Period 2 Marketing Optimization: Data Attribution Predictive Analytics Technology page 34
Slide 35: Results – SEM
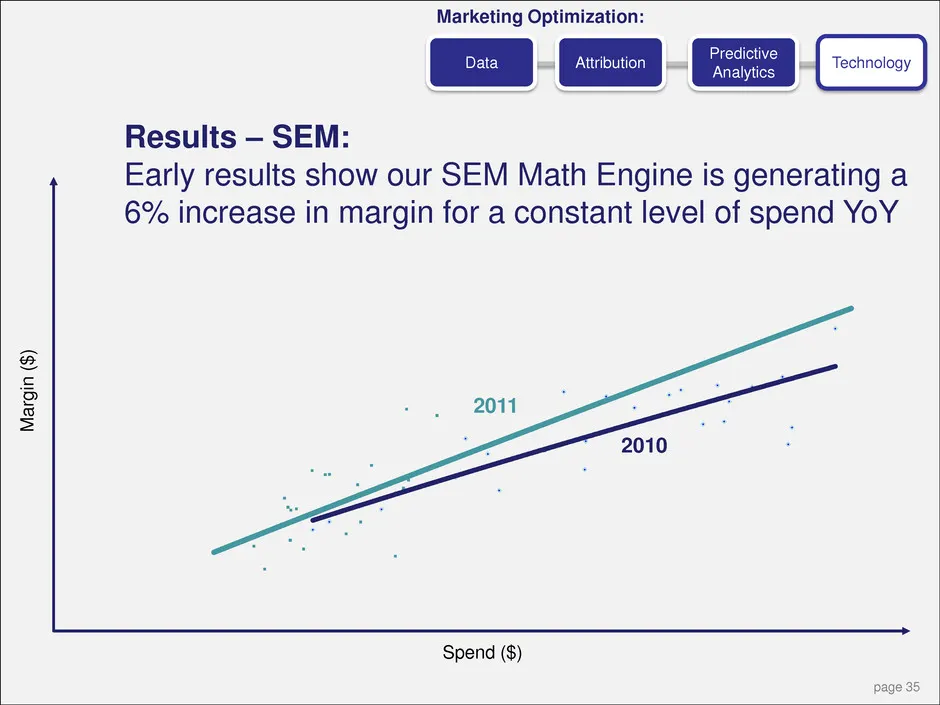
Marg in ( $ ) Spend ($) Results – SEM: Early results show our SEM Math Engine is generating a 6% increase in margin for a constant level of spend YoY 2010 2011 Marketing Optimization: Data Attribution Predictive Analytics Technology page 35
Slide 36: Results – Travel Research
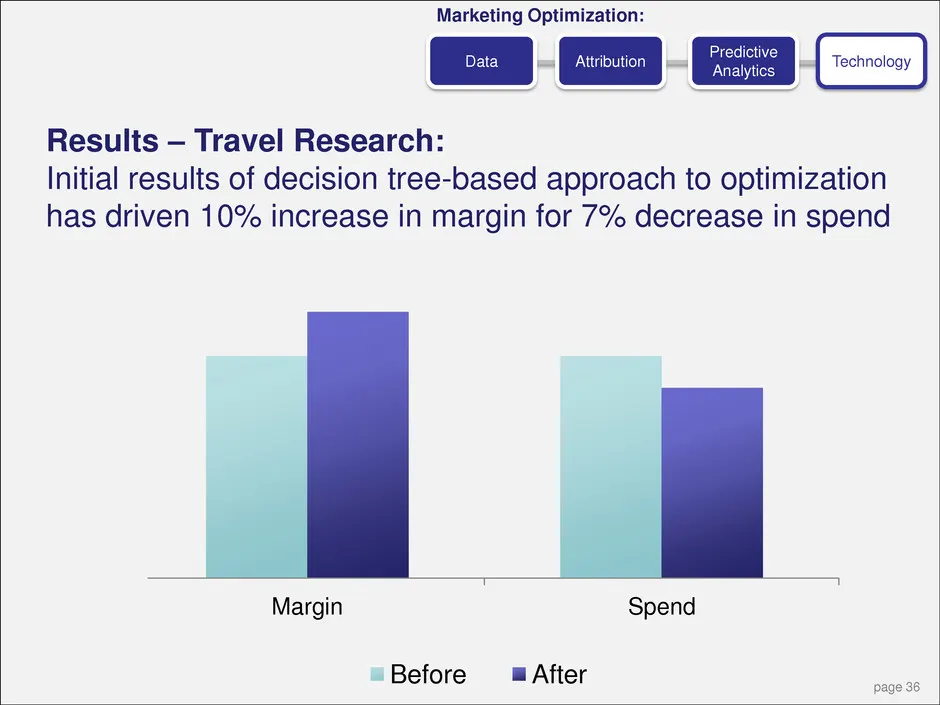
0.50 1.00 1.50 Margin Spend Before After Results – Travel Research: Initial results of decision tree-based approach to optimization has driven 10% increase in margin for 7% decrease in spend Marketing Optimization: Data Attribution Predictive Analytics Technology page 36
Slide 37: Funnel Optimization
Funnel Optimization: page 37
Slide 38: Landing Page Optimization Framework
Landing Page Optimization Framework (LPOF): Intelligently directing external traffic to pages with the highest converting configuration Funnel Optimization: Landing Page Site Performance Personalization Supply & Demand page 38
Slide 39: Landing page testing results
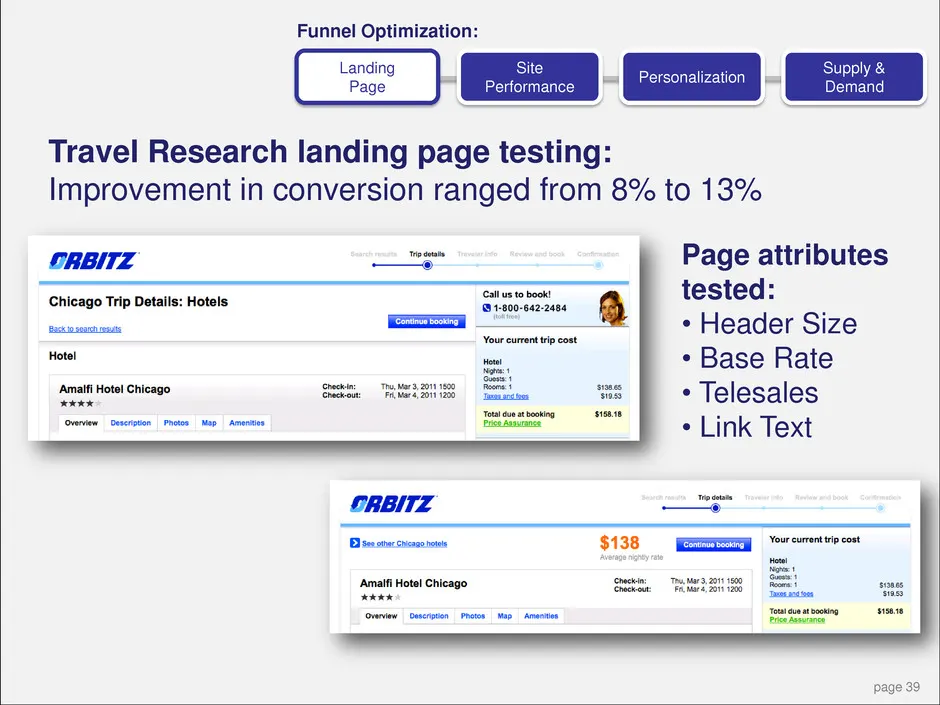
Page attributes tested: • Header Size • Base Rate • Telesales • Link Text Funnel Optimization: Landing Page Site Performance Personalization Supply & Demand Travel Research landing page testing: Improvement in conversion ranged from 8% to 13% page 39
Slide 40: Site Performance
Site Performance: Eliminating speed bumps to improve conversion rate Funnel Optimization: Landing Page Site Performance Personalization Supply & Demand page 40
Slide 41: Hotel Card
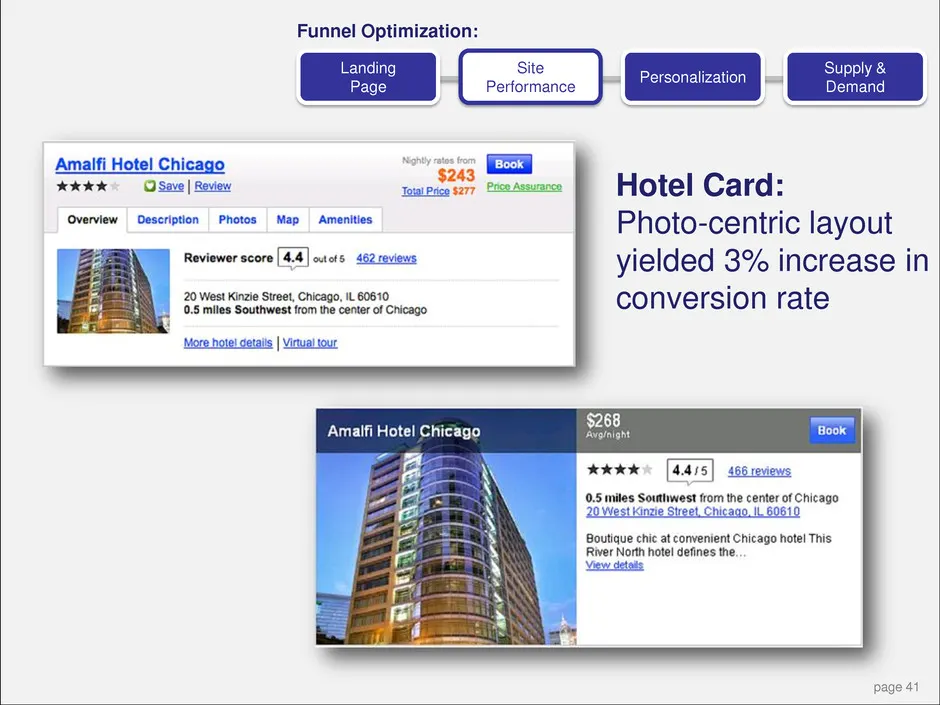
Hotel Card: Photo-centric layout yielded 3% increase in conversion rate Funnel Optimization: Landing Page Site Performance Personalization Supply & Demand page 41
Slide 42: Improving Conversion Trend
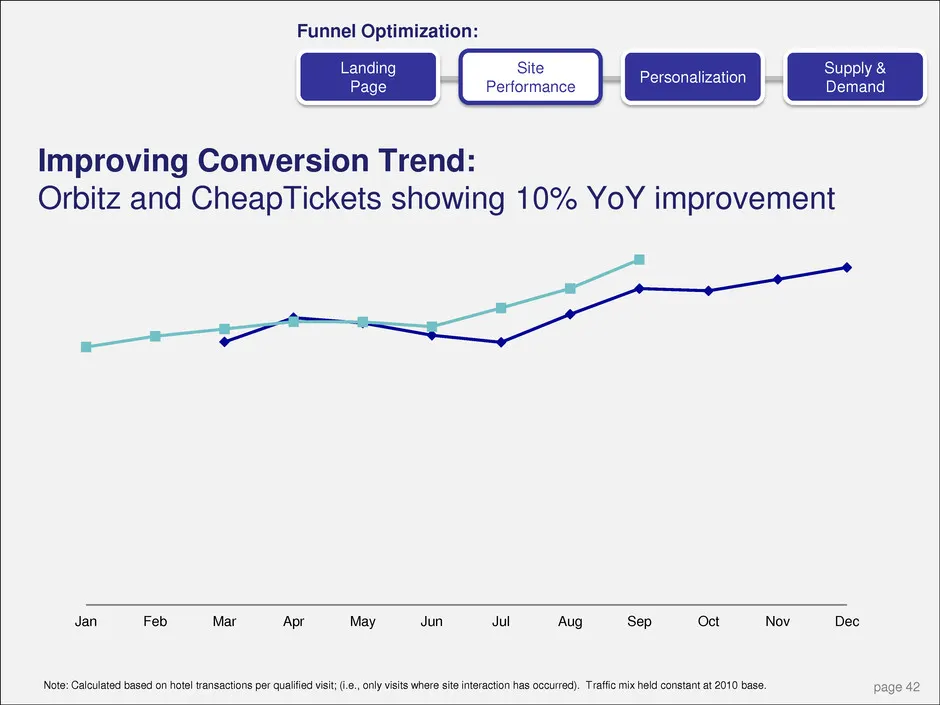
Jan Feb Mar Apr May Jun Jul Aug Sep Oct Nov Dec Improving Conversion Trend: Orbitz and CheapTickets showing 10% YoY improvement Funnel Optimization: Landing Page Site Performance Personalization Supply & Demand Note: Calculated based on hotel transactions per qualified visit; (i.e., only visits wher
Slide 43: Personalization
Personalization: Using data to customize the site experience for the specific context of each visit Funnel Optimization: Landing Page Site Performance Personalization Supply & Demand page 43
Slide 44: Recommended Hotels Module
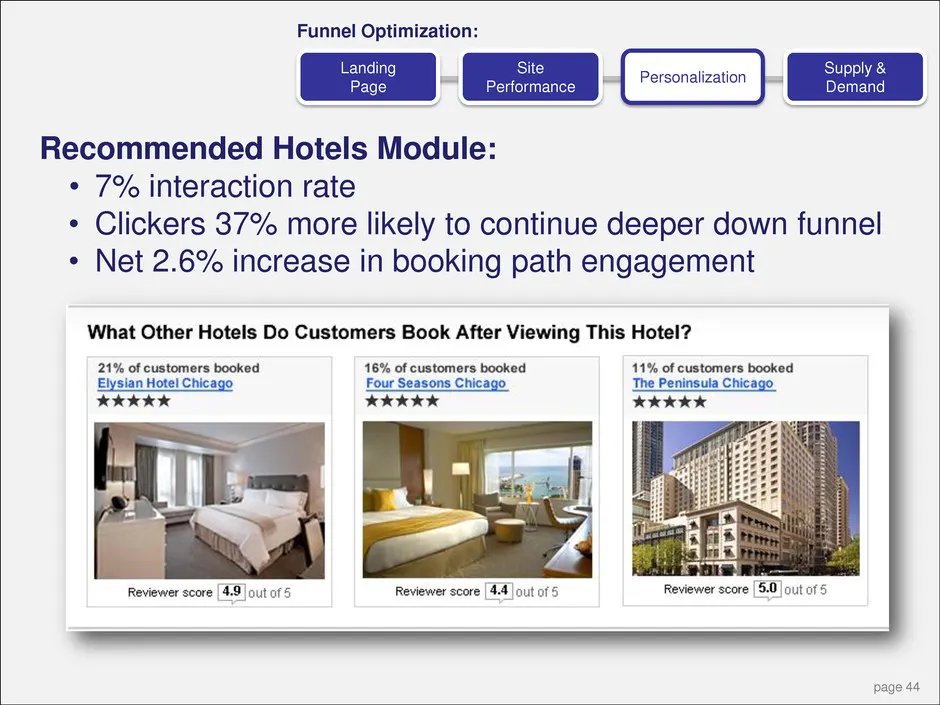
Note: Calculated based on hotel transactions per qualified visit; (i.e., only visits where site interaction has occurred). Traffic mix held constant at 2010 base. Recommended Hotels Module: • 7% interaction rate • Clickers 37% more likely to continue deeper down funnel • Net 2.6% increase in booking
Slide 45: Supply & Demand
Supply & Demand: Optimizing on- and off-site assets to maximize the conversion rate of visitors Funnel Optimization: Landing Page Site Performance Personalization Supply & Demand page 45
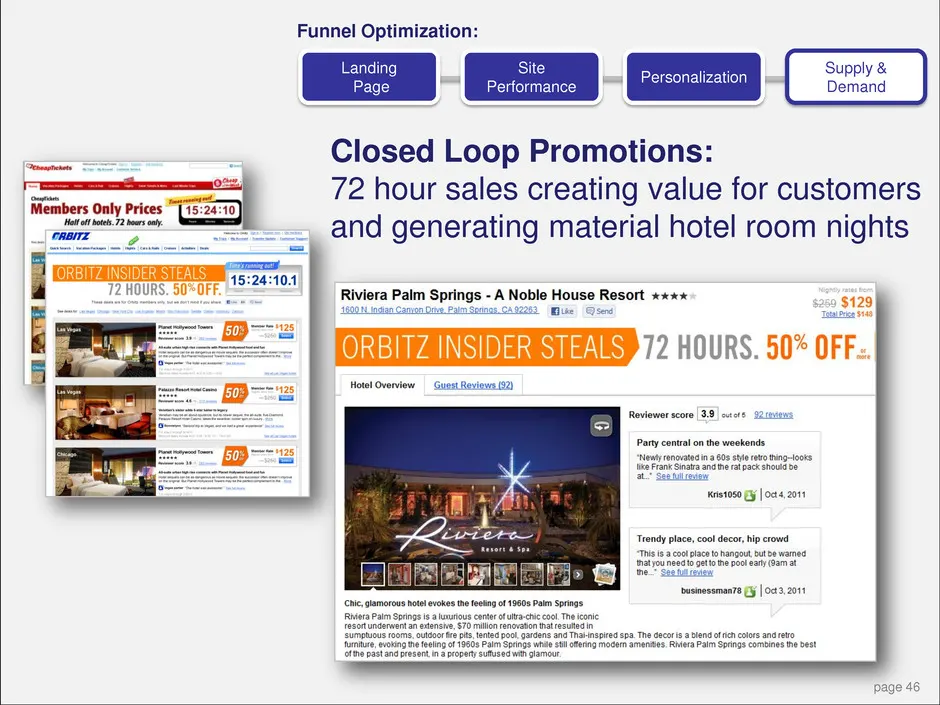
Slide 46: Closed Loop Promotions
Closed Loop Promotions: 72 hour sales creating value for customers and generating material hotel room nights Funnel Optimization: Landing Page Site Performance Personalization Supply & Demand page 46
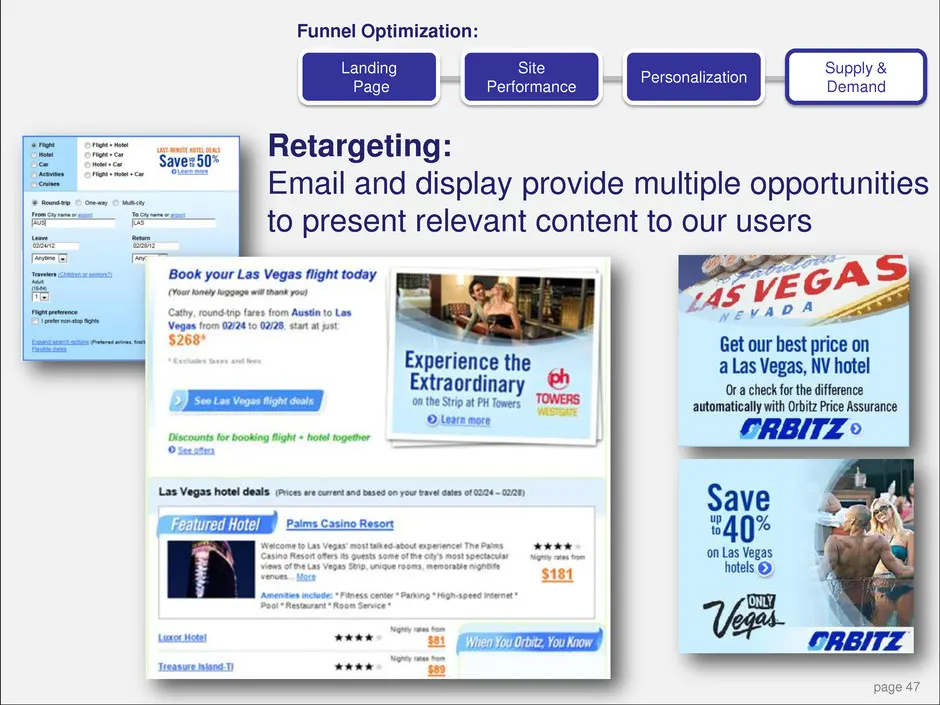
Slide 47: Retargeting
Retargeting: Email and display provide multiple opportunities to present relevant content to our users Funnel Optimization: Landing Page Site Performance Personalization Supply & Demand page 47
Slide 48: Agenda
Barney Harford Introduction Tamer Tamar International Chris Orton Orbitz.com & CheapTickets.com Ronnie Gurion Private Label Distribution Roger Liew Technology Russ Hammer Finance Barney Harford Wrap up Agenda page 48
Slide 49: Agenda
Barney Harford Introduction Tamer Tamar International Chris Orton Orbitz.com & CheapTickets.com Ronnie Gurion Private Label Distribution Roger Liew Technology Russ Hammer Finance Barney Harford Wrap up Agenda page 49
Slide 50: What is Private Label Distribution?
What is Private Label Distribution? Leveraging Orbitz Worldwide travel distribution assets to drive profitable incremental transactions on partners’ sites • Global supply infrastructure • Ecommerce experience • Customer service • Payment processing page 50
Slide 51: Expanding Stream of New Strategic Accounts
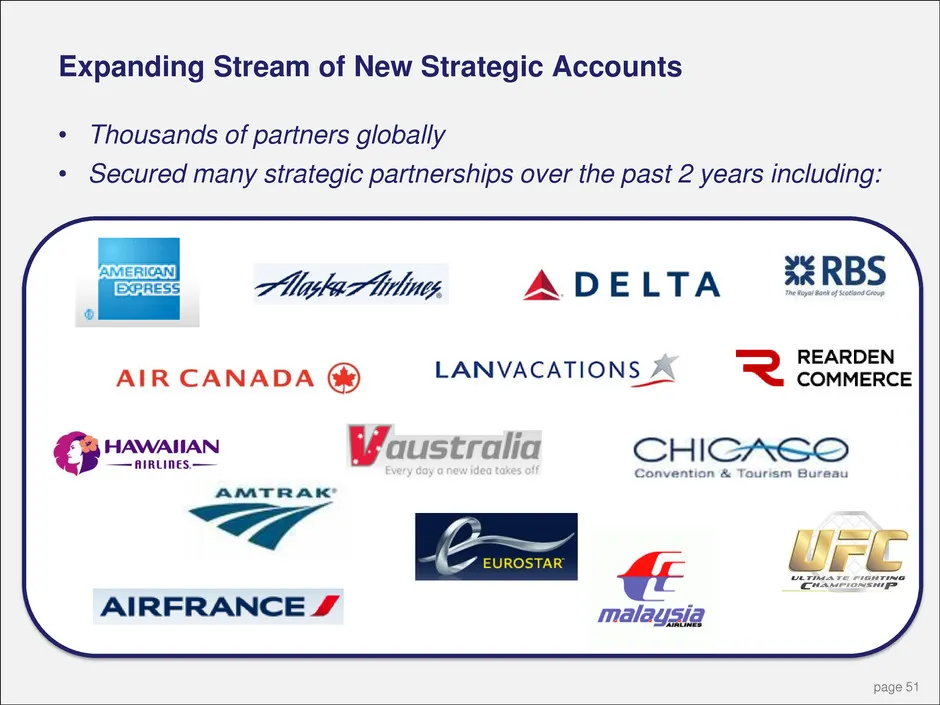
Expanding Stream of New Strategic Accounts • Thousands of partners globally • Secured many strategic partnerships over the past 2 years including: page 51
Slide 52: Variety of Private Label Solutions
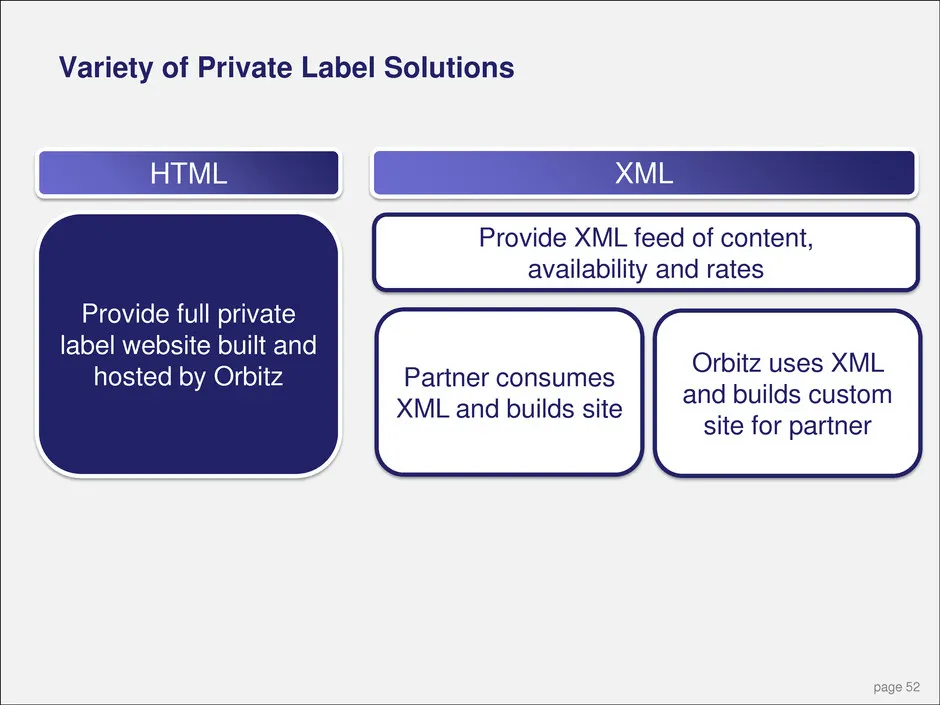
Variety of Private Label Solutions HTML Provide full private label website built and hosted by Orbitz XML Provide XML feed of content, availability and rates Partner consumes XML and builds site Orbitz uses XML and builds custom site for partner page 52
Slide 53: Functionality: Packaging
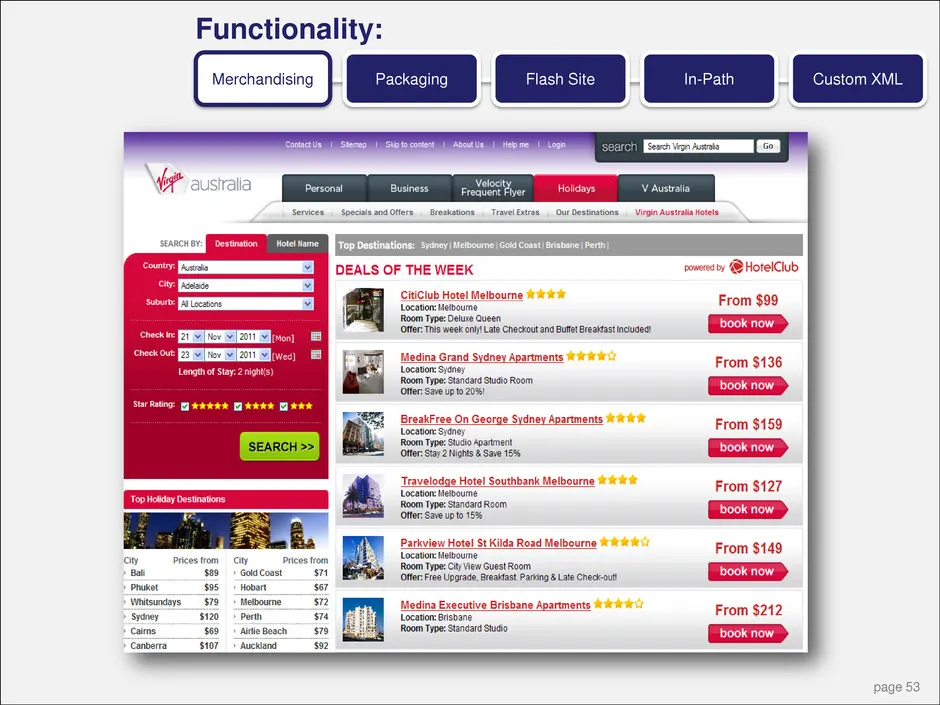
Functionality: Packaging Flash Site In-Path Custom XML Merchandising page 53
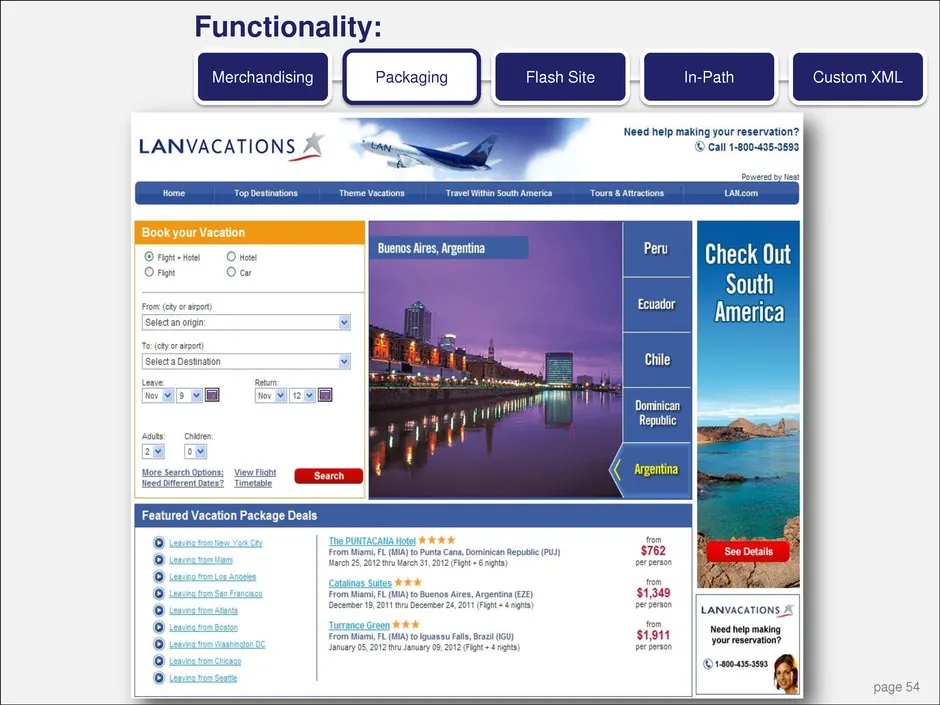
Slide 54: Functionality: Flash Site
Packaging Flash Site In-Path Custom XML Merchandising Functionality: page 54
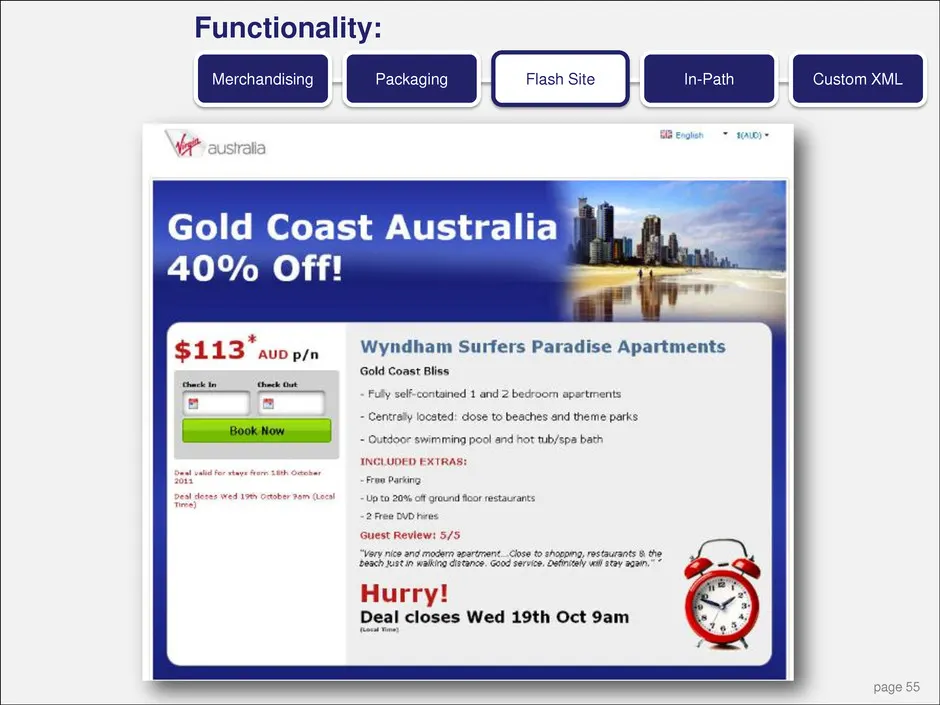
Slide 55: Functionality: In-Path
Packaging Flash Site In-Path Custom XML Merchandising Functionality: page 55
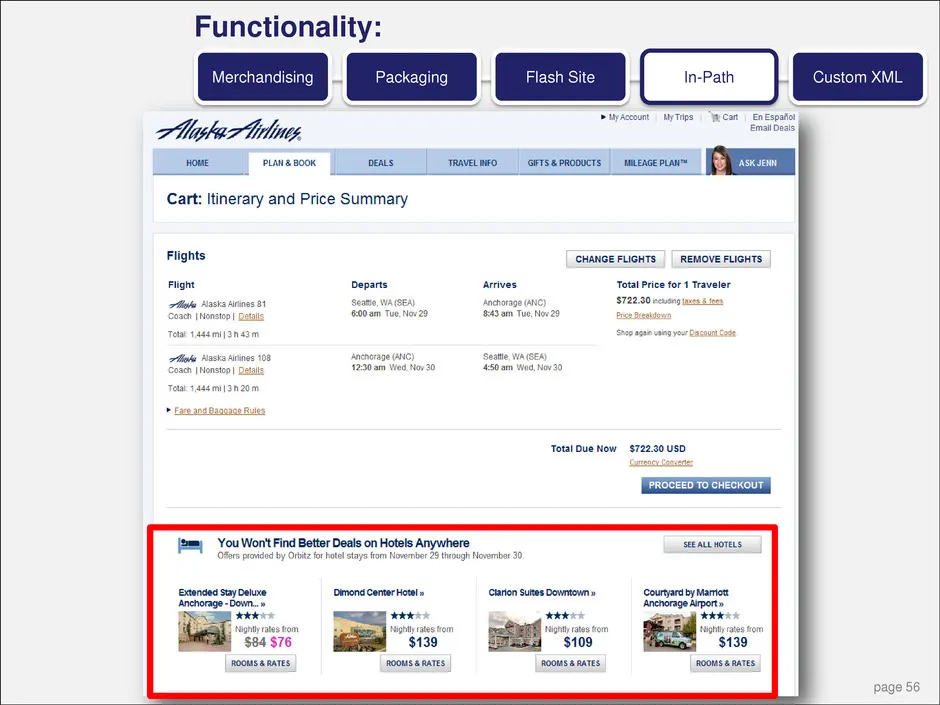
Slide 56: Functionality: Custom
Packaging Flash Site In-Path Custom XML Merchandising Functionality: page 56
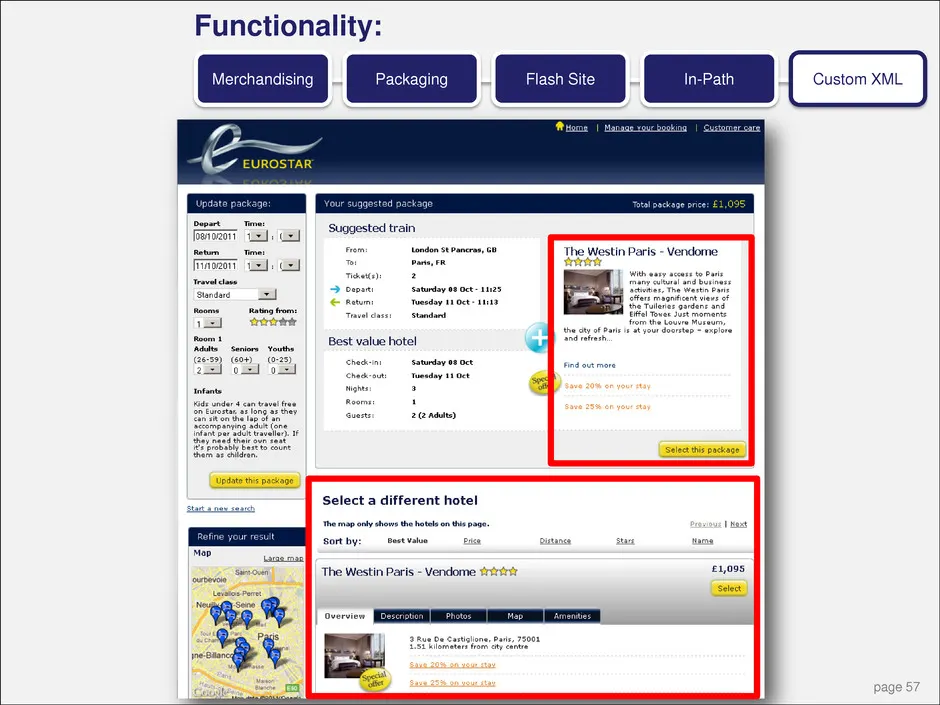
Slide 57: Functionality: XML Merchandising
Packaging Flash Site In-Path Custom XML Merchandising Functionality: page 57
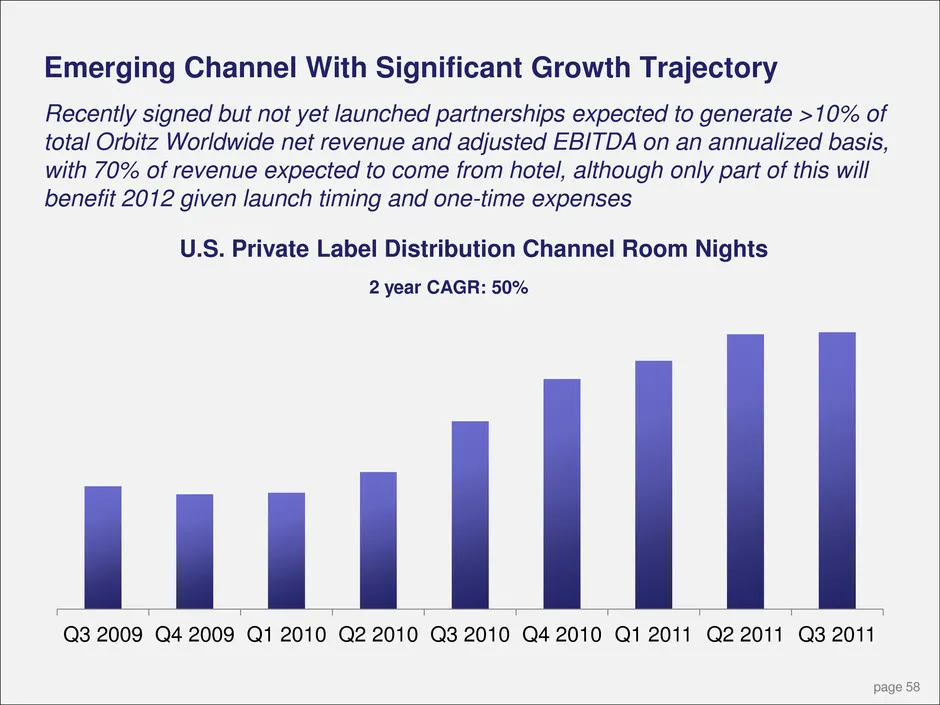
Slide 58: Emerging Channel With Significant Growth Trajectory
Q3 2009 Q4 2009 Q1 2010 Q2 2010 Q3 2010 Q4 2010 Q1 2011 Q2 2011 Q3 2011 Emerging Channel With Significant Growth Trajectory U.S. Private Label Distribution Channel Room Nights Recently signed but not yet launched partnerships expected to generate >10% of total Orbitz Worldwide net revenue and adjust
Slide 59: Agenda
Barney Harford Introduction Tamer Tamar International Chris Orton Orbitz.com & CheapTickets.com Ronnie Gurion Private Label Distribution Roger Liew Technology Russ Hammer Finance Barney Harford Wrap up Agenda page 59
Slide 60: Agenda
Barney Harford Introduction Tamer Tamar International Chris Orton Orbitz.com & CheapTickets.com Ronnie Gurion Private Label Distribution Roger Liew Technology Russ Hammer Finance Barney Harford Wrap up Agenda page 60
Slide 61: Creating technology to enable business agility
Creating technology to enable business agility Empowering customers Creating great products Intelligently using data page 61
Slide 62: Enabling business agility through Unification
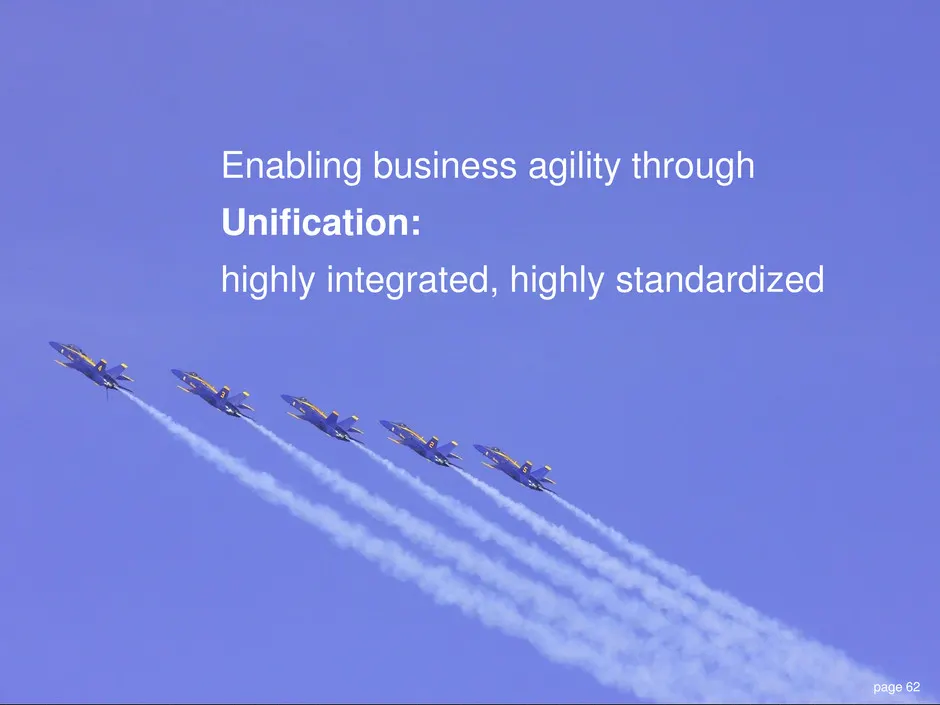
Enabling business agility through Unification: highly integrated, highly standardized page 62
Slide 63: Our People and Processes are the Foundation
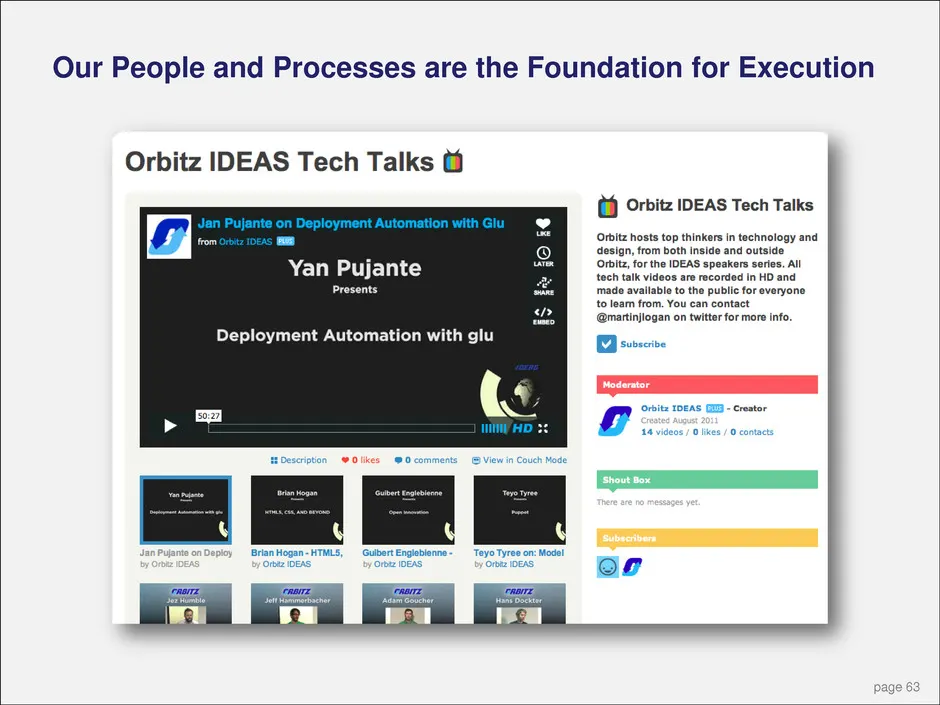
Our People and Processes are the Foundation for Execution page 63
Slide 64: Our People and Processes are the Foundation
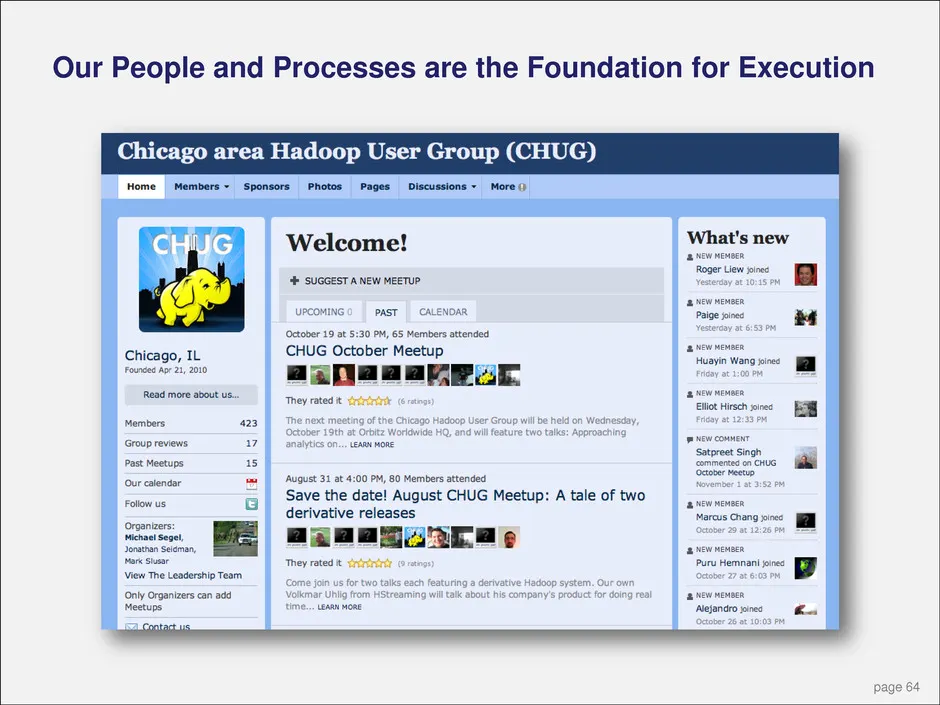
Our People and Processes are the Foundation for Execution page 64
Slide 65: Our People and Processes are the Foundation
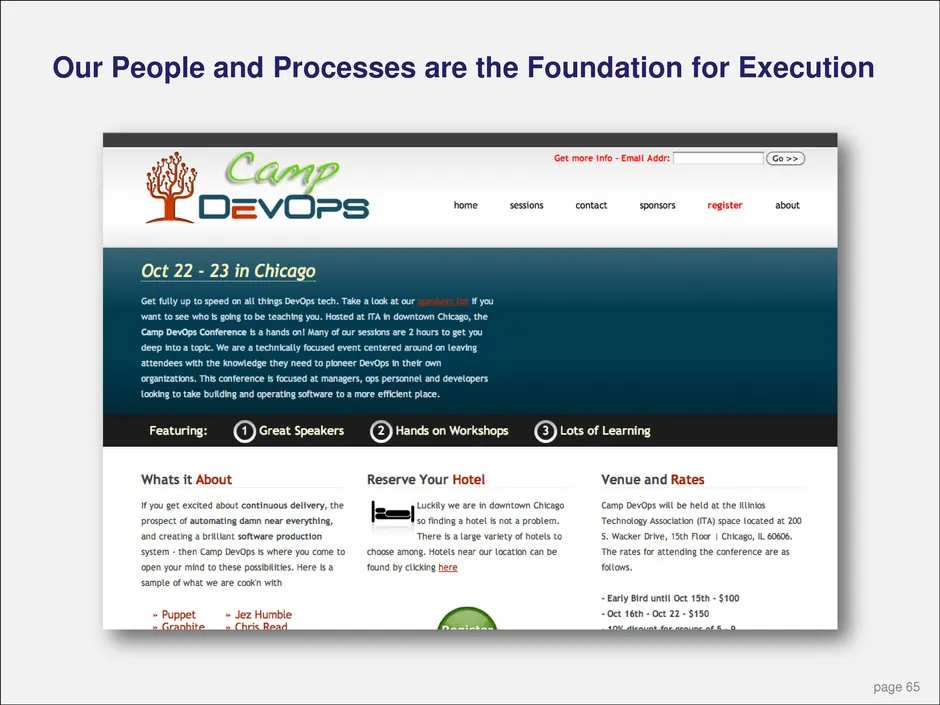
Our People and Processes are the Foundation for Execution page 65

Slide 66: page
page 66
Slide 67: Software Engineering Process at Orbitz
Software Engineering Process at Orbitz Agile development processes accommodating change page 67
Slide 68: Agile in the Large: Stories Closed
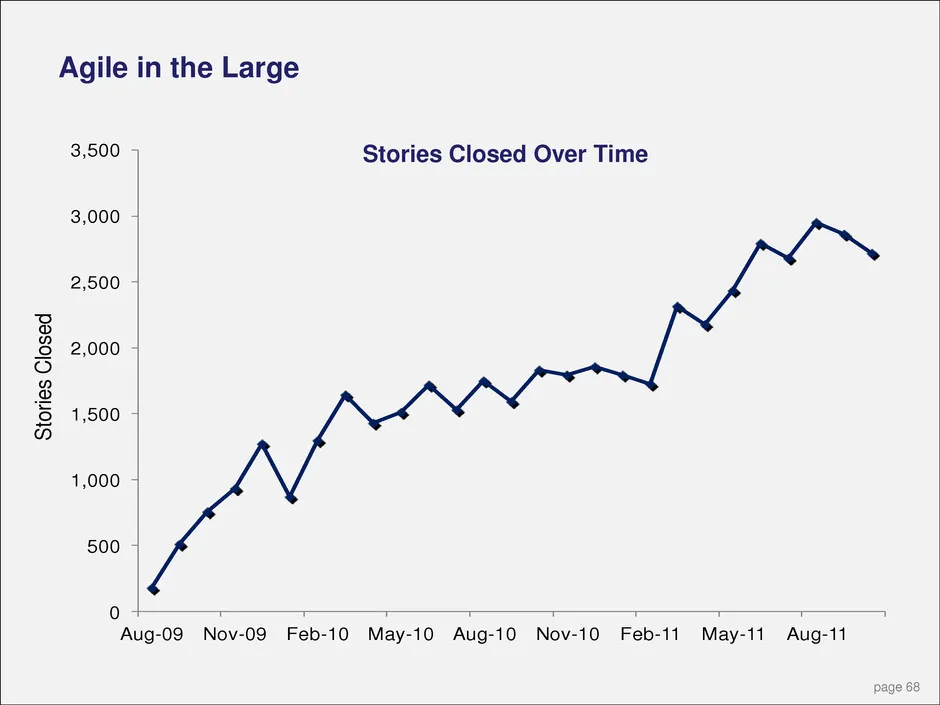
Agile in the Large 0 500 1,000 1,500 2,000 2,500 3,000 3,500 Aug-09 Nov-09 Feb-10 May-10 Aug-10 Nov-10 Feb-11 May-11 Aug-11 St or ies C los ed Stories Closed Over Time page 68
Slide 69: Agile in the Large: Production Releases
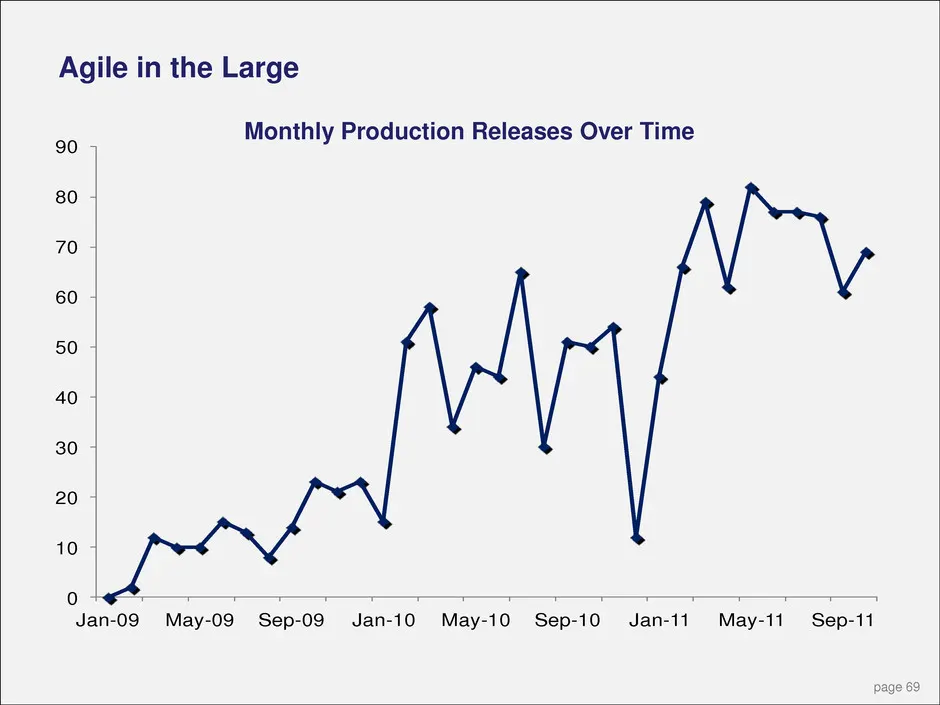
Agile in the Large 0 10 20 30 40 50 60 70 80 90 Jan-09 May-09 Sep-09 Jan-10 May-10 Sep-10 Jan-11 May-11 Sep-11 Monthly Production Releases Over Time page 69
Slide 70: Technology: Migration to the Global Platform
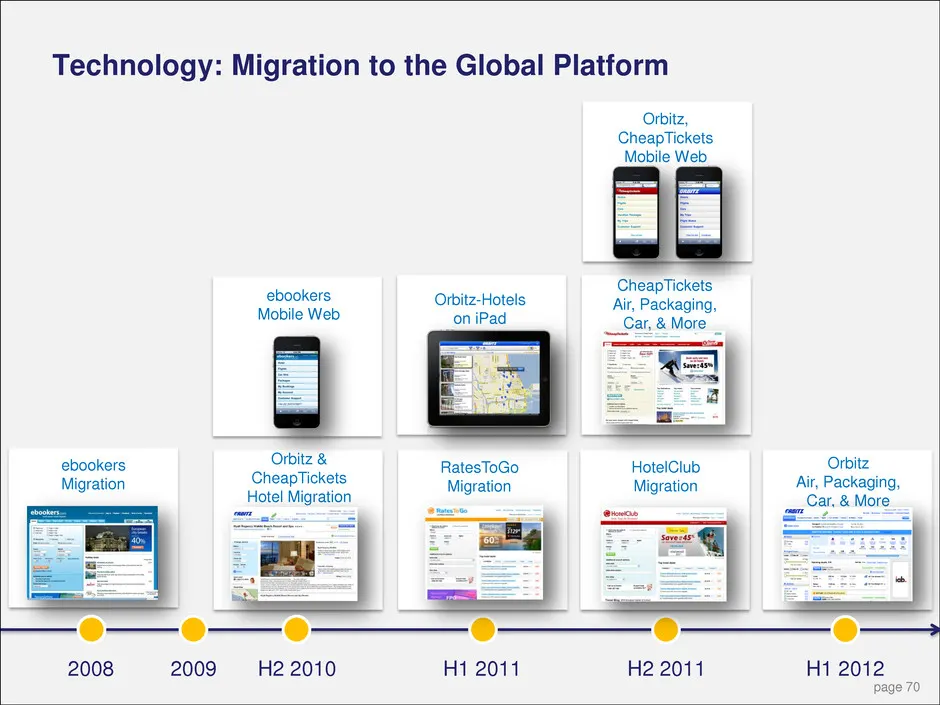
Technology: Migration to the Global Platform Orbitz & CheapTickets Hotel Migration 2009 H2 2010 H1 2011 H2 2011 RatesToGo Migration ebookers Migration Orbitz Air, Packaging, Car, & More ebookers Mobile Web Orbitz-Hotels on iPad 2008 H1 2012 HotelClub Migration CheapTickets Air, Packaging, Car, & Mor
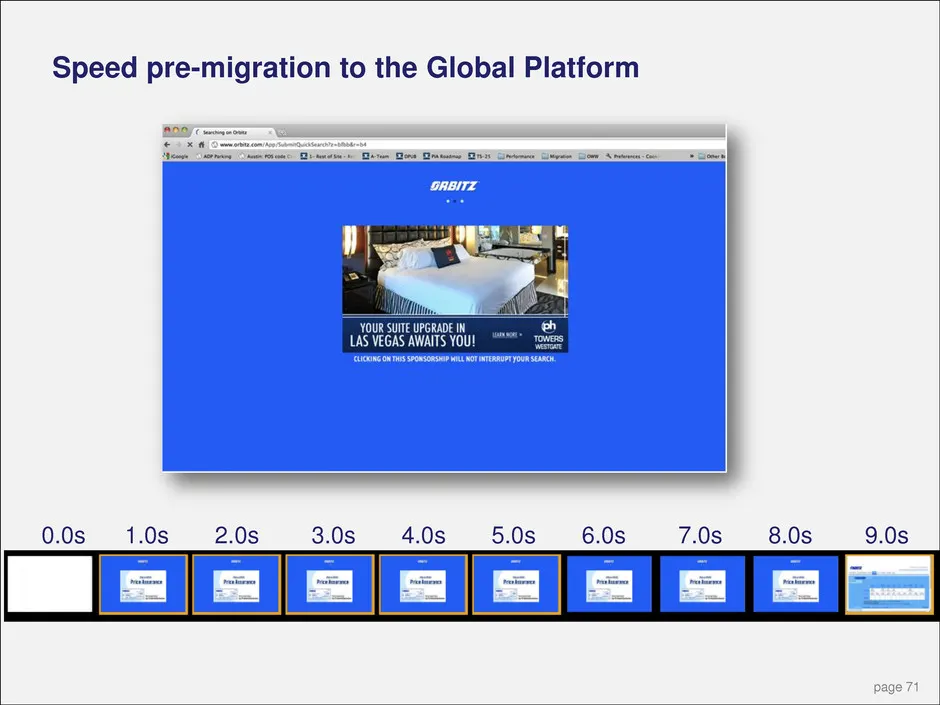
Slide 71: Speed pre-migration to the Global Platform
Speed pre-migration to the Global Platform 0.0s 1.0s 2.0s 3.0s 4.0s 5.0s 6.0s 7.0s 8.0s 9.0s page 71
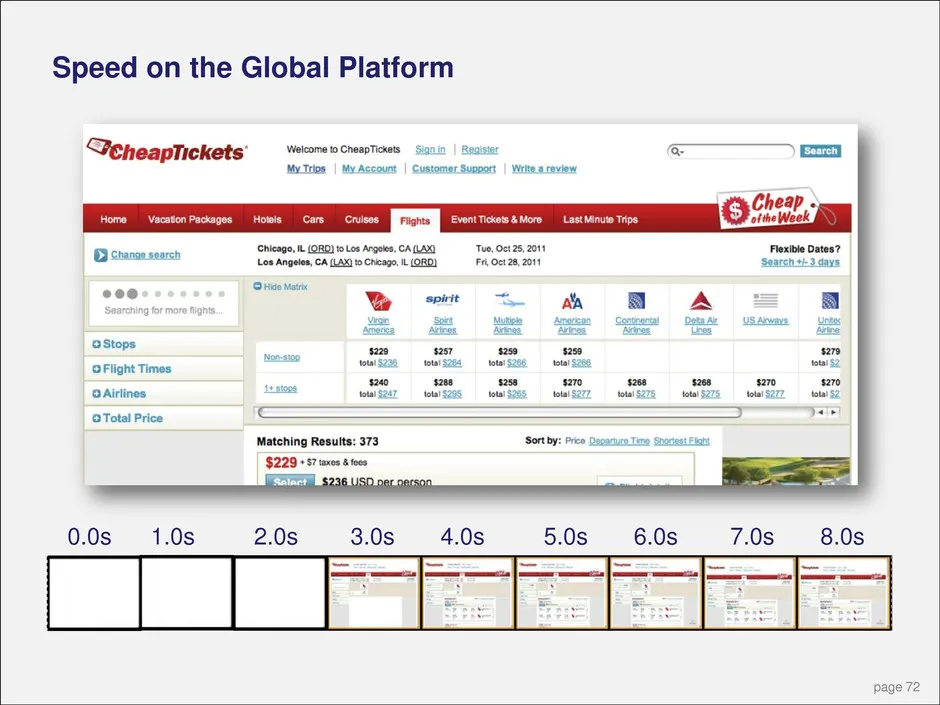
Slide 72: Speed on the Global Platform
Speed on the Global Platform 0.0s 1.0s 2.0s 3.0s 4.0s 5.0s 6.0s 7.0s 8.0s page 72
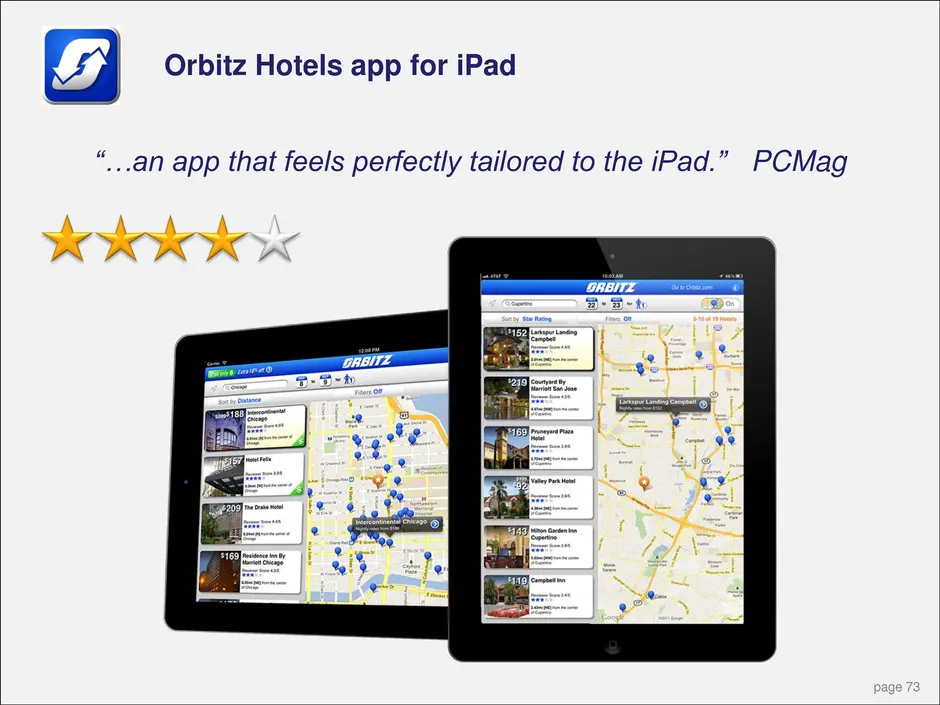
Slide 73: Orbitz Hotels app for iPad
Orbitz Hotels app for iPad “…an app that feels perfectly tailored to the iPad.” PCMag page 73
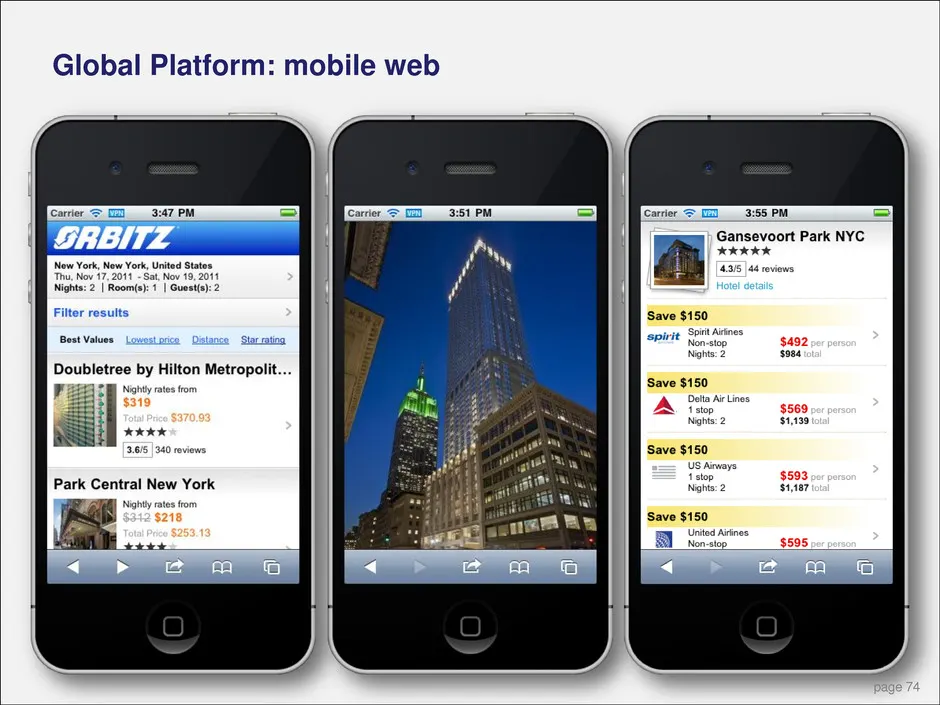
Slide 74: Global Platform: mobile web
Global Platform: mobile web page 74
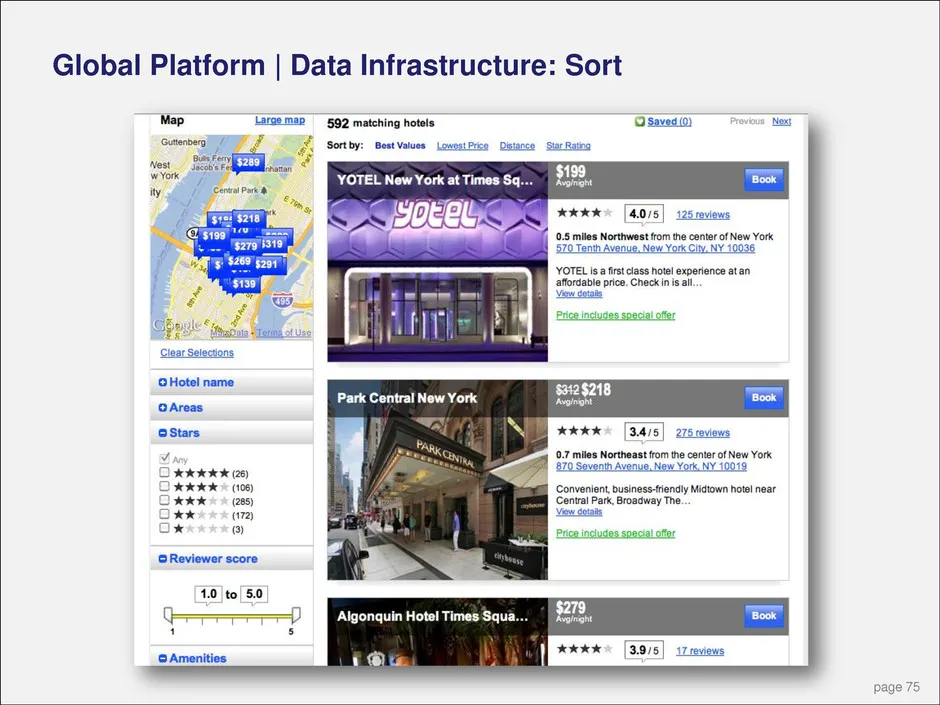
Slide 75: Global Platform | Data Infrastructure
Global Platform | Data Infrastructure: Sort page 75
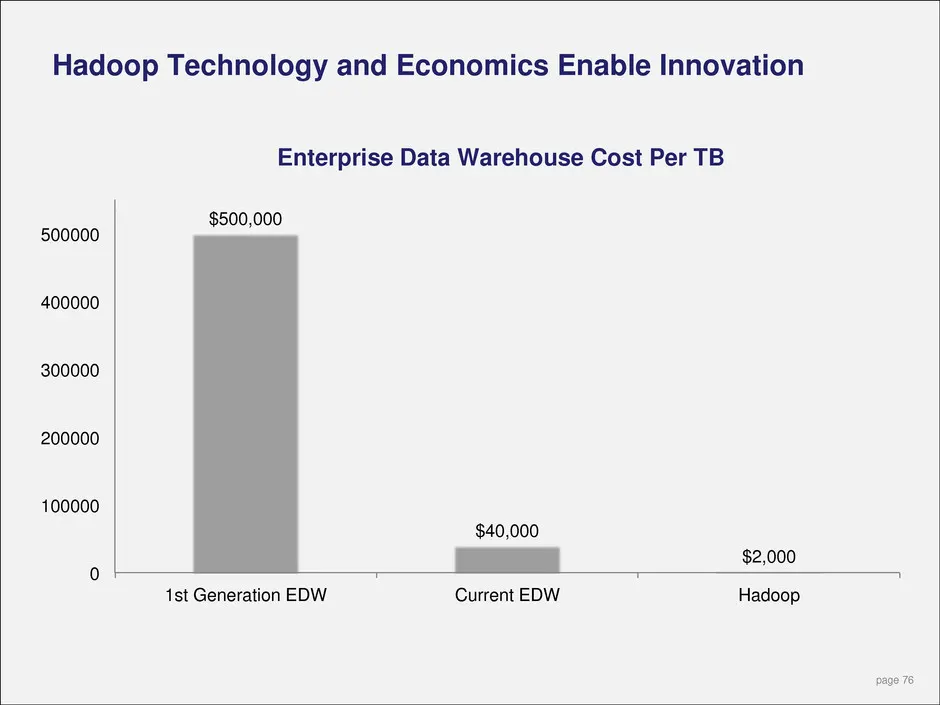
Slide 76: Hadoop Technology and Economics Enable Innovation
Hadoop Technology and Economics Enable Innovation page 76 $500,000 $40,000 $2,000 0 100000 200000 300000 400000 500000 1st Generation EDW Current EDW Hadoop Enterprise Data Warehouse Cost Per TB
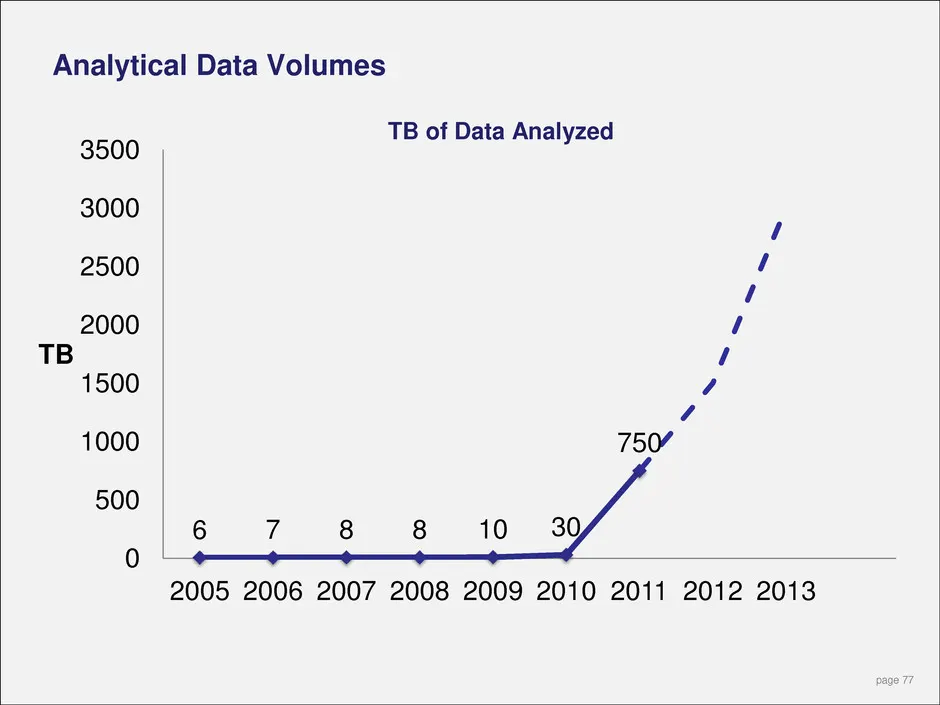
Slide 77: Analytical Data Volumes
Analytical Data Volumes 6 7 8 8 10 30 750 0 500 1000 1500 2000 2500 3000 3500 2005 2006 2007 2008 2009 2010 2011 2012 2013 TB page 77 TB of Data Analyzed

Slide 78: Orbitz Worldwide Technology
Orbitz Worldwide Technology page 78 The Global Platform is the agile integration of people, data and technology
Slide 79: Agenda
Barney Harford Introduction Tamer Tamar International Chris Orton Orbitz.com & CheapTickets.com Ronnie Gurion Private Label Distribution Roger Liew Technology Russ Hammer Finance Barney Harford Wrap up Agenda page 79
Slide 80: Agenda
Barney Harford Introduction Tamer Tamar International Chris Orton Orbitz.com & CheapTickets.com Ronnie Gurion Private Label Distribution Roger Liew Technology Russ Hammer Finance Barney Harford Wrap up Agenda page 80
Slide 81: Increasing International Mix
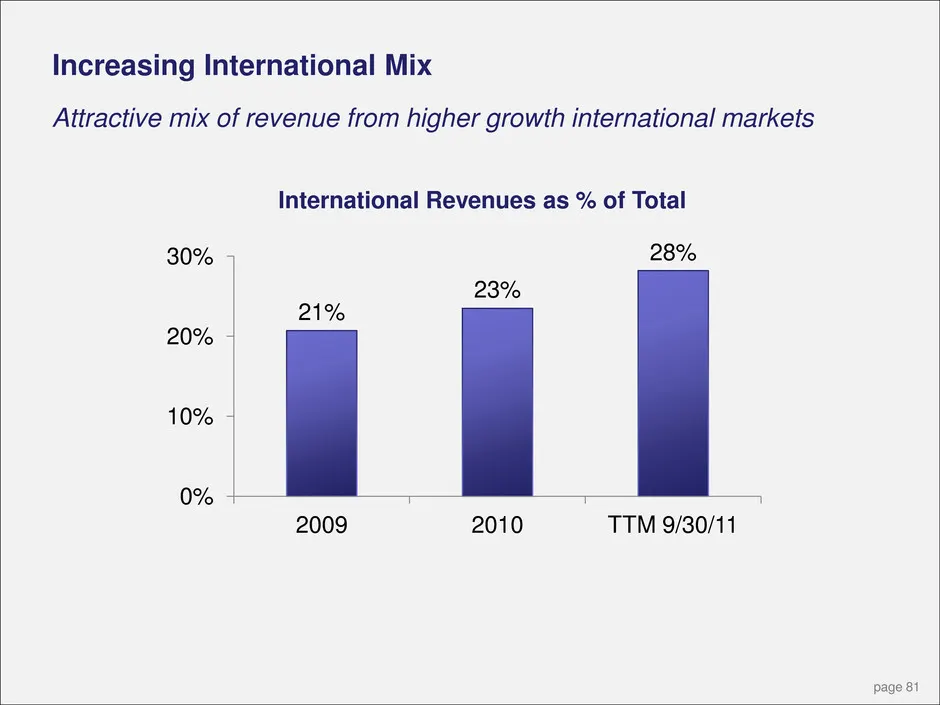
Increasing International Mix Attractive mix of revenue from higher growth international markets International Revenues as % of Total 21% 23% 28% 0% 10% 20% 30% 2009 2010 TTM 9/30/11 page 81
Slide 82: Increasing Hotel Mix
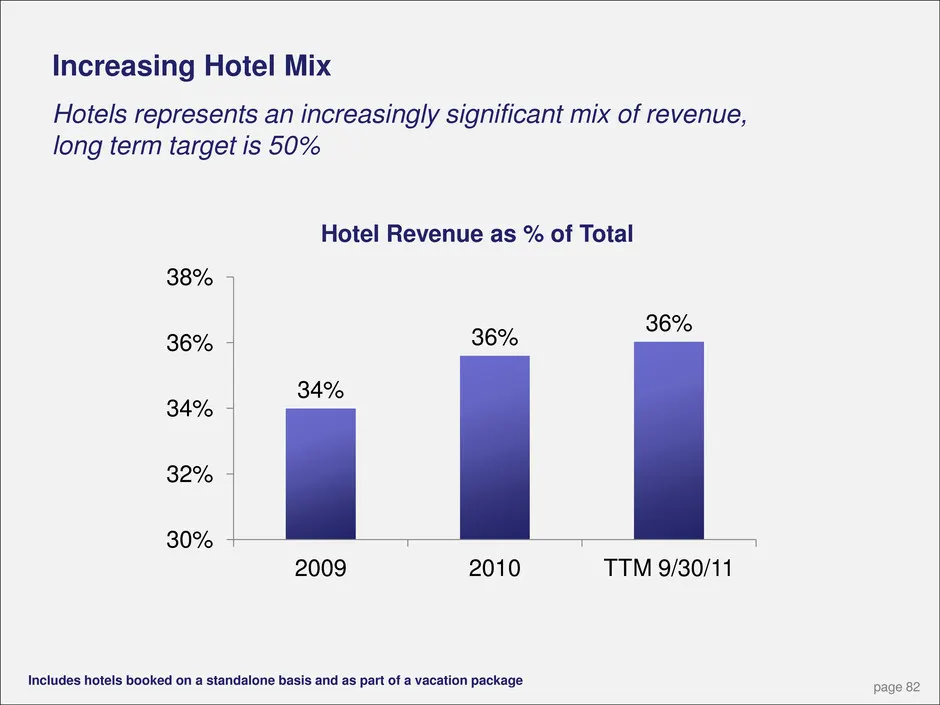
Hotels represents an increasingly significant mix of revenue, long term target is 50% Increasing Hotel Mix Hotel Revenue as % of Total 34% 36% 36% 30% 32% 34% 36% 38% 2009 2010 TTM 9/30/11 page 82 Includes hotels booked on a standalone basis and as part of a vacation package
Slide 83: Improving Adjusted EBITDA Quarterly Trend
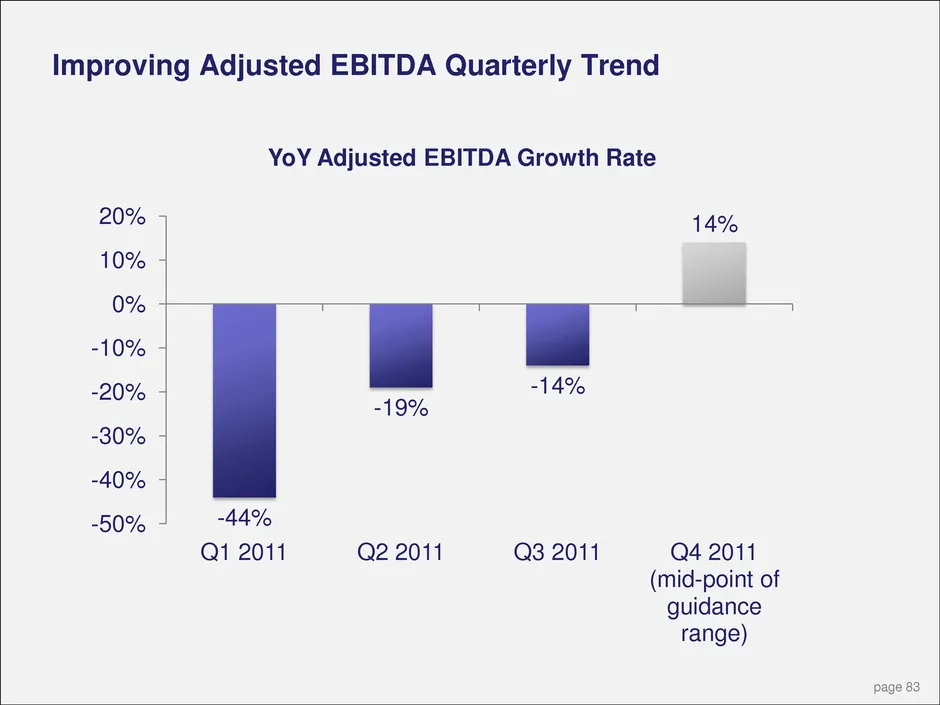
Improving Adjusted EBITDA Quarterly Trend -44% -19% -14% 14% -50% -40% -30% -20% -10% 0% 10% 20% Q1 2011 Q2 2011 Q3 2011 Q4 2011 (mid-point of guidance range) YoY Adjusted EBITDA Growth Rate page 83
Slide 84: Track Record of Decreasing Leverage
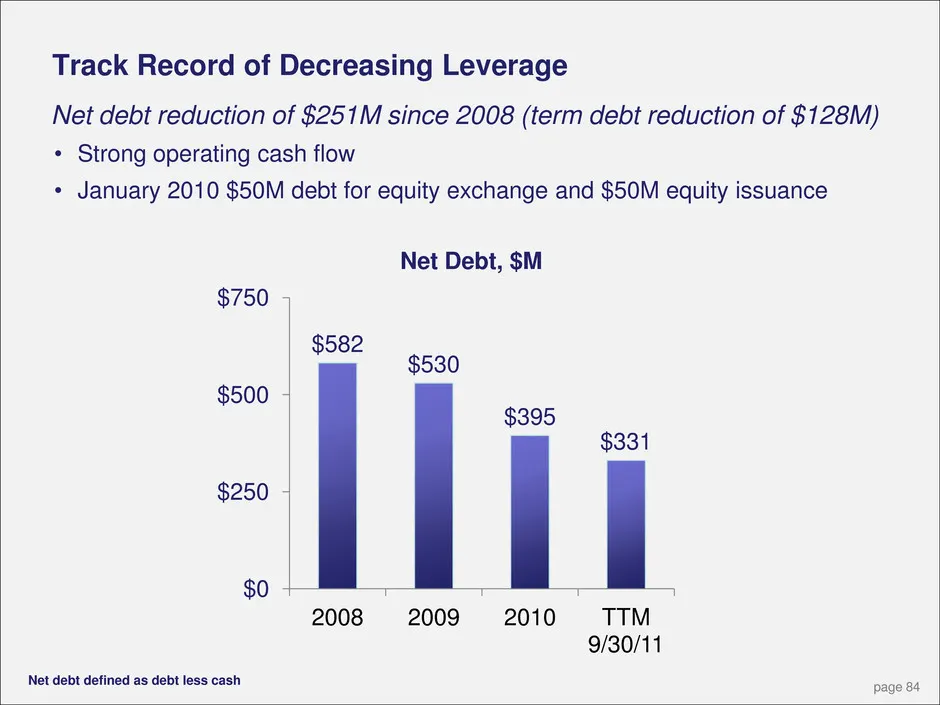
Track Record of Decreasing Leverage Net debt reduction of $251M since 2008 (term debt reduction of $128M) • Strong operating cash flow • January 2010 $50M debt for equity exchange and $50M equity issuance Net debt defined as debt less cash Net Debt, $M $582 $530 $395 $331 $0 $250 $500 $750 2008 2009
Slide 85: Agenda
Barney Harford Introduction Tamer Tamar International Chris Orton Orbitz.com & CheapTickets.com Ronnie Gurion Private Label Distribution Roger Liew Technology Russ Hammer Finance Barney Harford Wrap up Agenda page 85
Slide 86: Conclusion: Key Investment Highlights
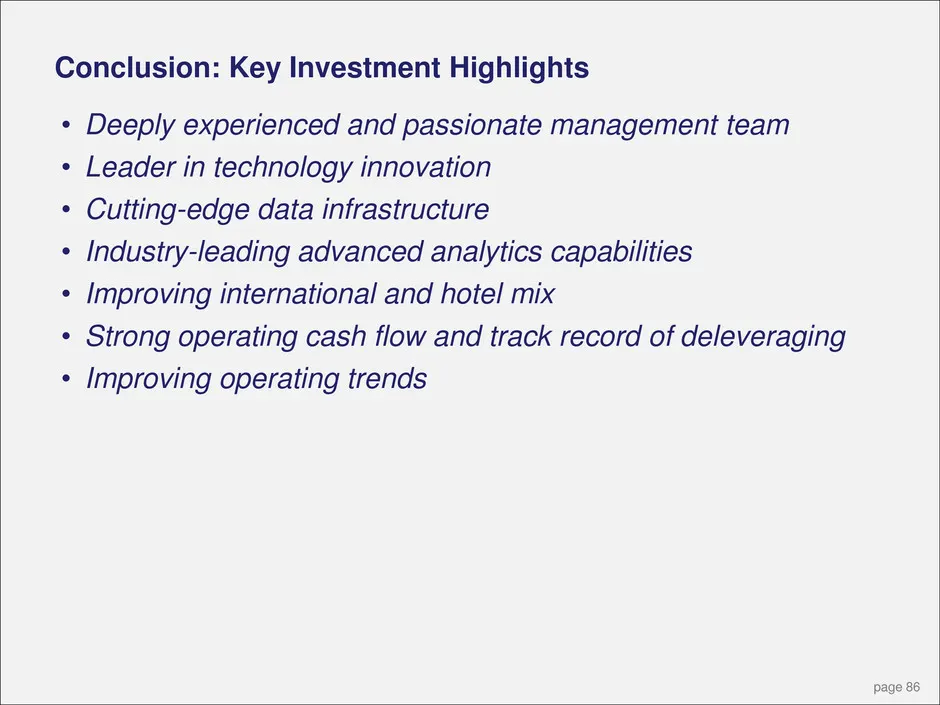
Conclusion: Key Investment Highlights • Deeply experienced and passionate management team • Leader in technology innovation • Cutting-edge data infrastructure • Industry-leading advanced analytics capabilities • Improving international and hotel mix • Strong operating cash flow and track record of d

Slide 87: page
page 87
Source: SEC EDGAR · 8-K filed Nov 10, 2011