Gulfmark Offshore — Howard Weil 42nd Annual Energy Conference 2014
28 slides from Gulfmark Offshore's conference presentation, Mar 26, 2014
Slide 1: Howard Weil 42nd Annual Energy Conference
Howard Weil a nd 42"¢ Annual Energy Conference GULEMARK March 2014 Gulfitark Offshore, Inc. NYSEGLF GULFMARK.COM
Slide 2: Forward Looking Statements
Forward Looking Statements Cautionary Statement Regarding Forward-Looking Statements Certain statements and information in this presentation may constitute “forward-looking statements” within the meaning of the Private Securities Litigation Reform Act of 1995. The words “believe,” “expect,” “anticip
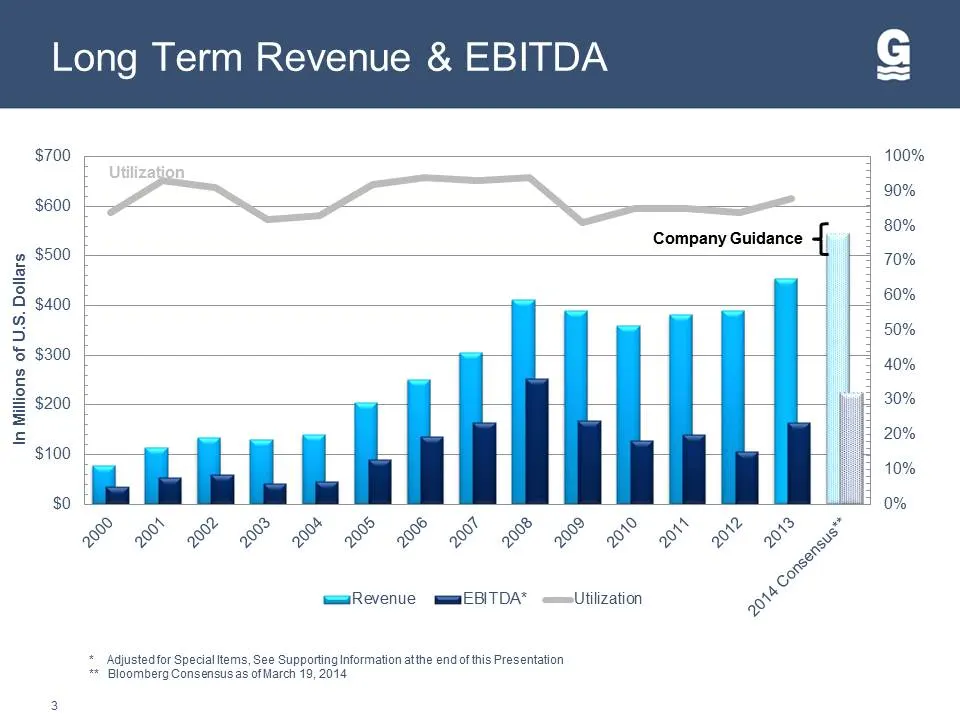
Slide 3: Long Term Revenue & EBITDA
Long Term Revenue & EBITDA $700 $600 e & 3 8 $400 $300 2 = °° a G =) ‘s ® ie $200 ~ $100 $0 waaaRevenue mmm@EBITDA* Utilization + Adjustedtfor Special tems, See Supporting Information atthe end of this Presentation * Bloomberg Consensusas ofMarch 19, 2014 100% 90% 80% 70% 60% 50% 40% 30% 20% 10% 0%
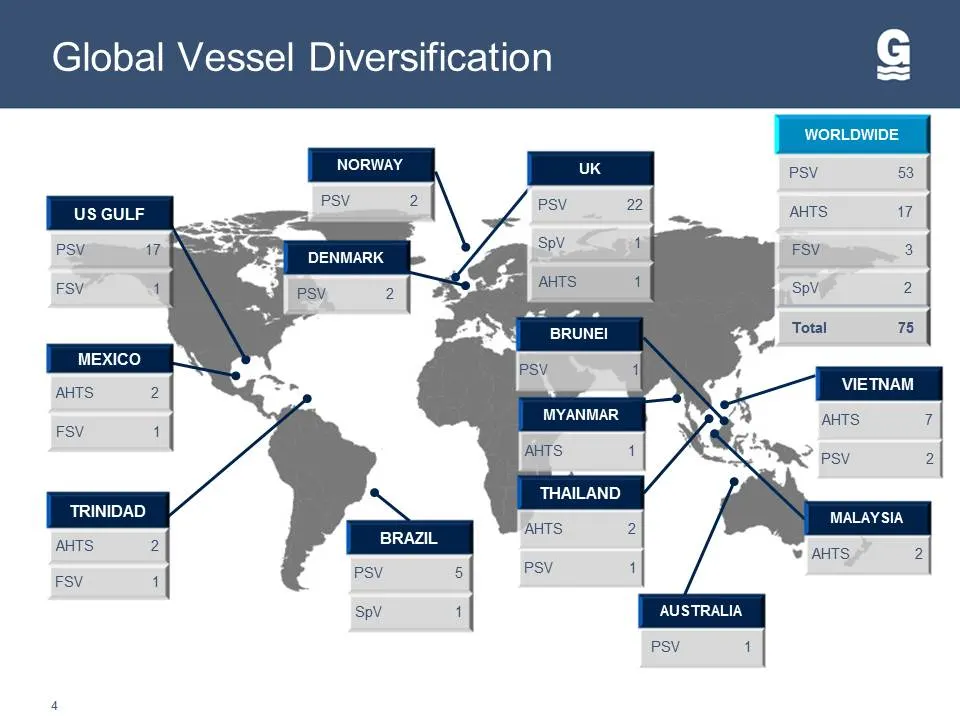
Slide 4: Global Vessel Diversification
Global Vessel Diversification US GULF _ a | DENMARK MEXICO TRINIDAD AUSTRALIA
Slide 5: The GulfMark Fleet
THE GULFMARK FLEET
Slide 6: Vessel Vintage by Year
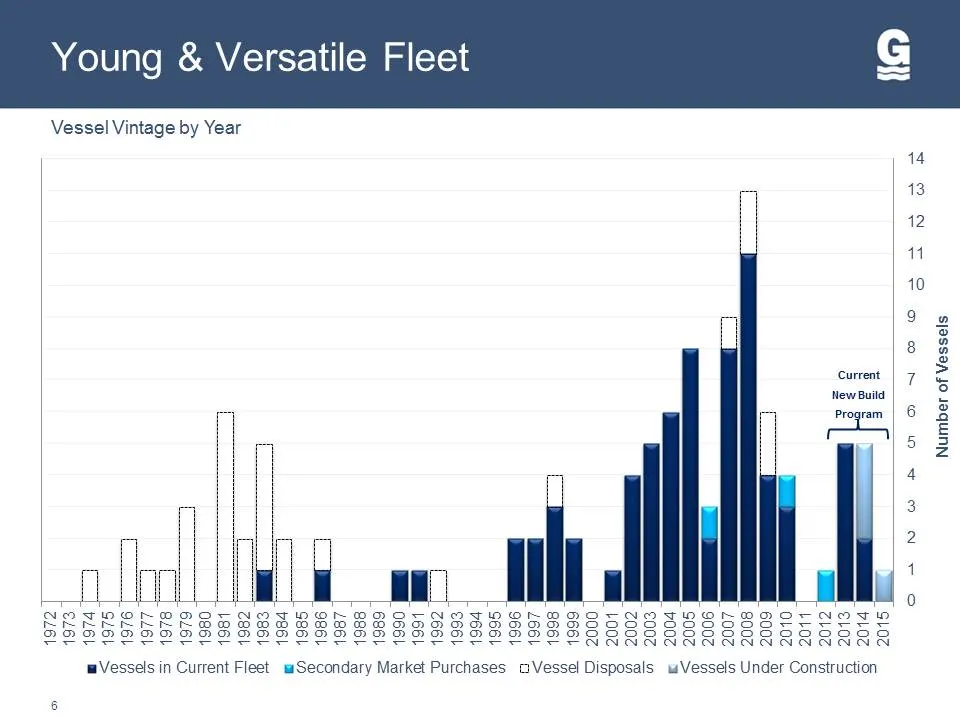
4 o a iw 2 = O 2) — ® > ro) D c =) = Vessel Vintage by Year s|asse, Jo 1equINN Current New Build wVessels in Current Fleet s#Secondary Market Purchases oVessel Disposals «Vessels Under Construction
Slide 7: A Changing Environment
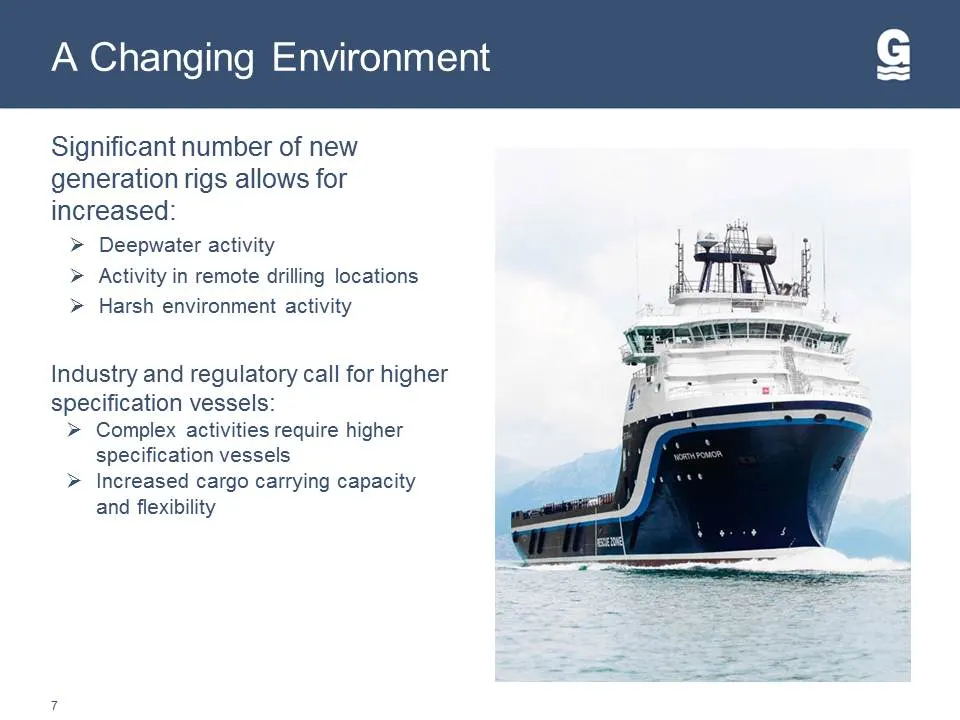
A Changing Environment Significant number of new generation rigs allows for increased: > Deepwater activity > Activity in remote drilling locations > Harsh environment activity Industry and regulatory call for higher specification vessels: > Complex activities require higher specification vessels >
Slide 8: Market Leading Arctic Class New Builds
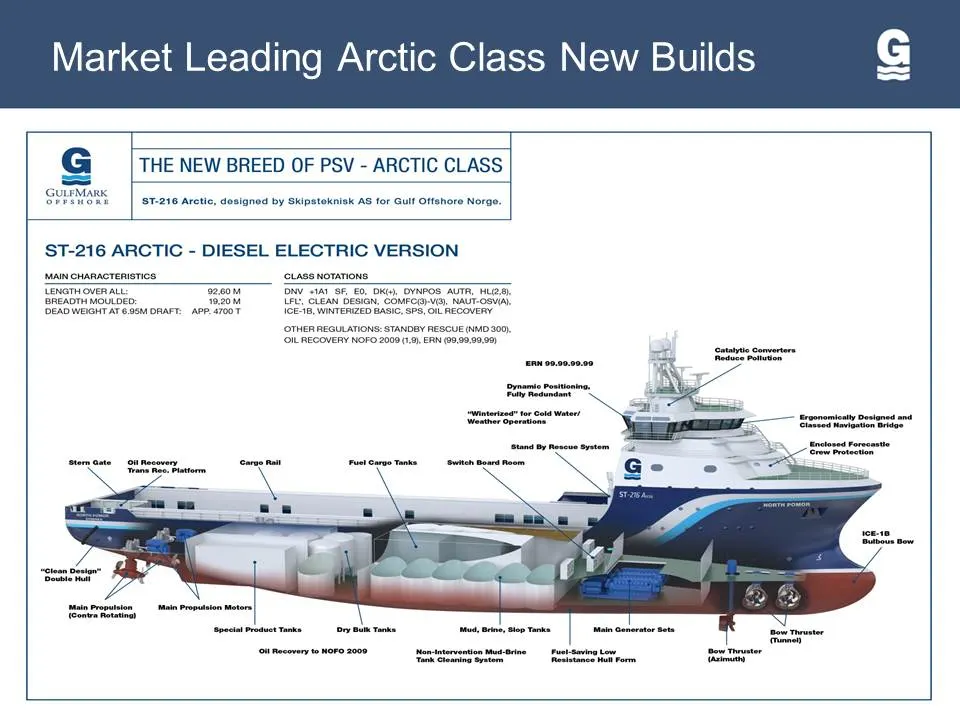
Market Leading Arctic Class New Builds G THE NEW BREED OF PSV - ARCTIC CLASS
Slide 9: New Construction Delivery Schedule
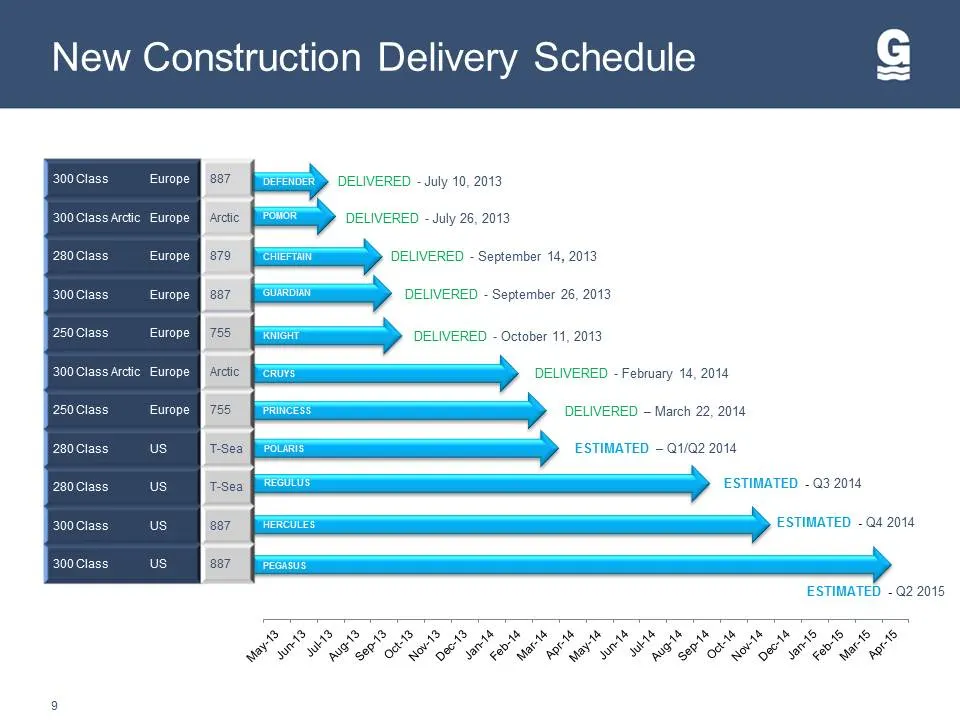
New Construction Delivery Schedule A Europe > DELIVERED - July 10, 2013 ud 200Class Arctic Europe BP DELIVERED - July 26, 2013 b Europe DELIVERED - September 14, 2013 Europe , DELIVERED - September 26, 2013 Europe > DELIVERED - October 11, 2013 Europe z > DELIVERED - February 14, 2014 Europe DELIVER
Slide 10: Vessel Enhancement Program
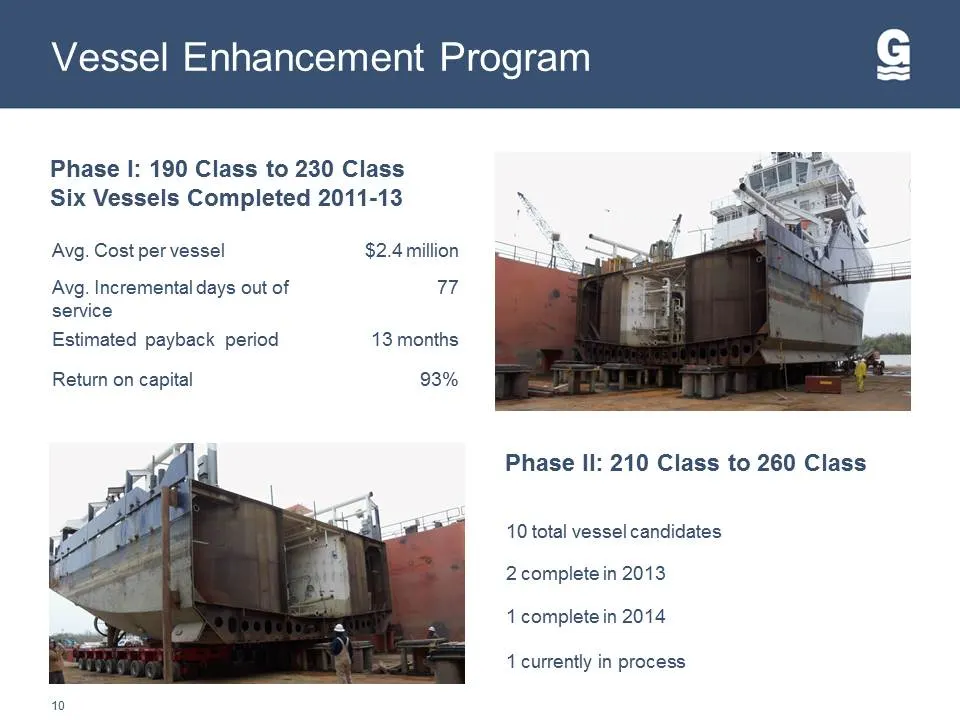
Vessel Enhancement Program Phase I: 190 Class to 230 Class Six Vessels Completed 2011-13 Avg. Cost per vessel $2.4 million Avg. Incremental days out of 77 service Estimated payback period 13 months Return on capital 93% Phase II: 210 Class to 260 Class 10 total vessel candidates 2 complete in 2013 1
Slide 11: Vessel Enhancement Completion Schedule
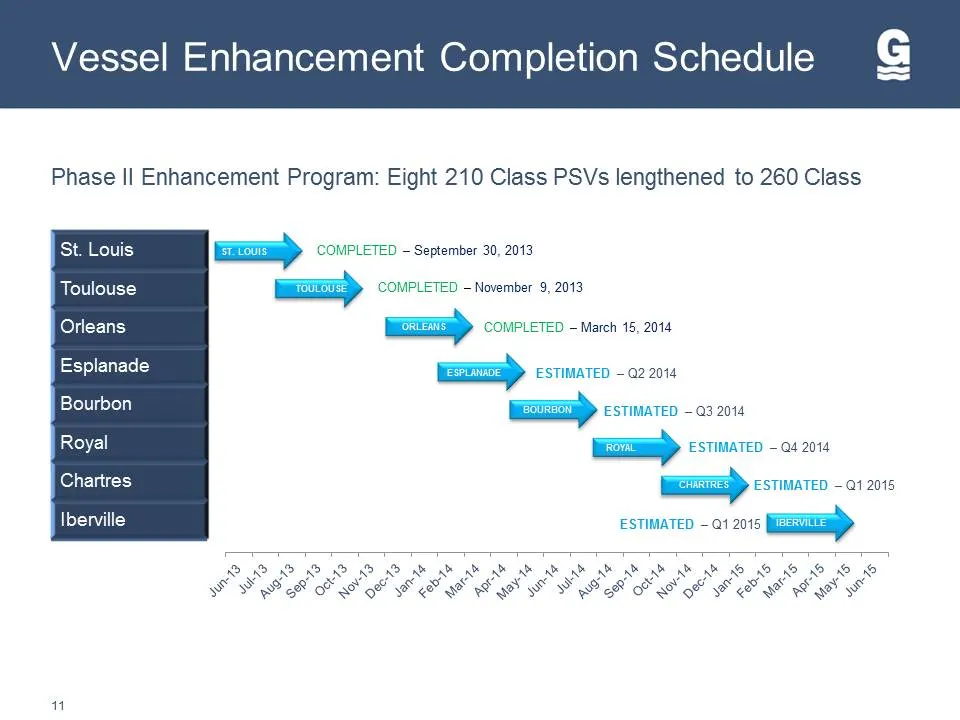
Vessel Enhancement Completion Schedule Phase Il Enhancement Program: Eight 210 Class PSVs lengthened to 260 Class St. Louis =» COMPLETED ~ September 30, 2013 Toulouse <=> COMPLETED - November 9, 2013 Orleans <==» COMPLETED - March 15, 2014 Esplanade ESTIMATED - @2 2014 Bourbon =» ESTIMATED —Q3 2014
Slide 12: Secondary Market Vessel Purchases
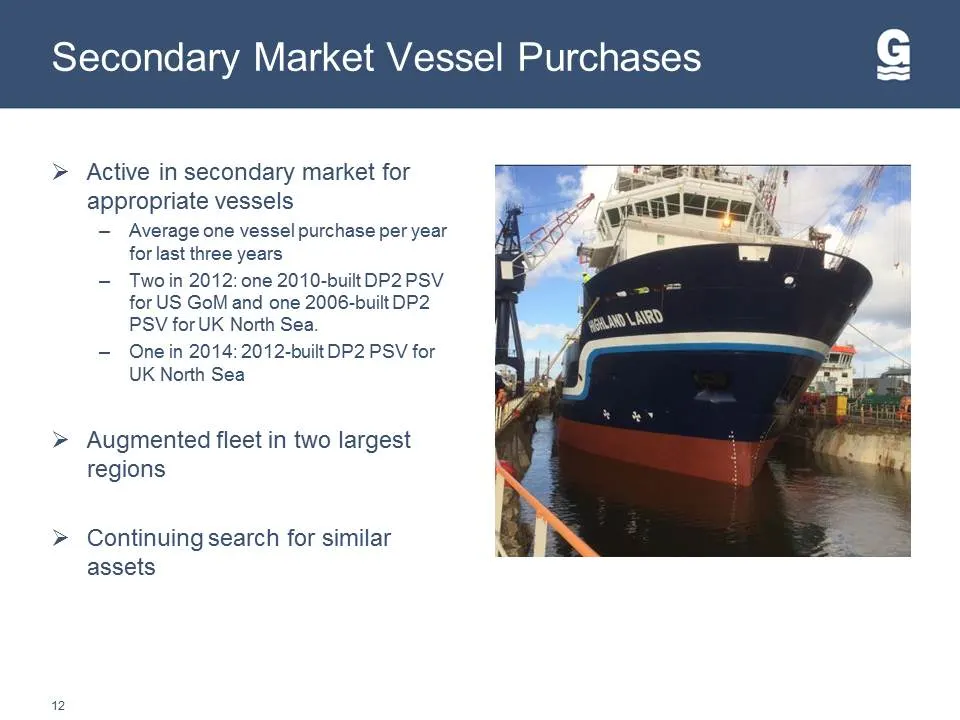
Secondary Market Vessel Purchases > Active in secondary market for appropriate vessels — Average one vessel purchase per year for last three years - Twoin 2012: one 2010-builtDP2 PSV for US GoM and one 2006-built DP2 PSV for UK North Sea. — One in 2014: 2012-built DP2 PSV for UK North Sea Vv Augment
Slide 13: Demand Drivers
DEMAND DRIVERS
Slide 14: Rig Count Growth — North Sea
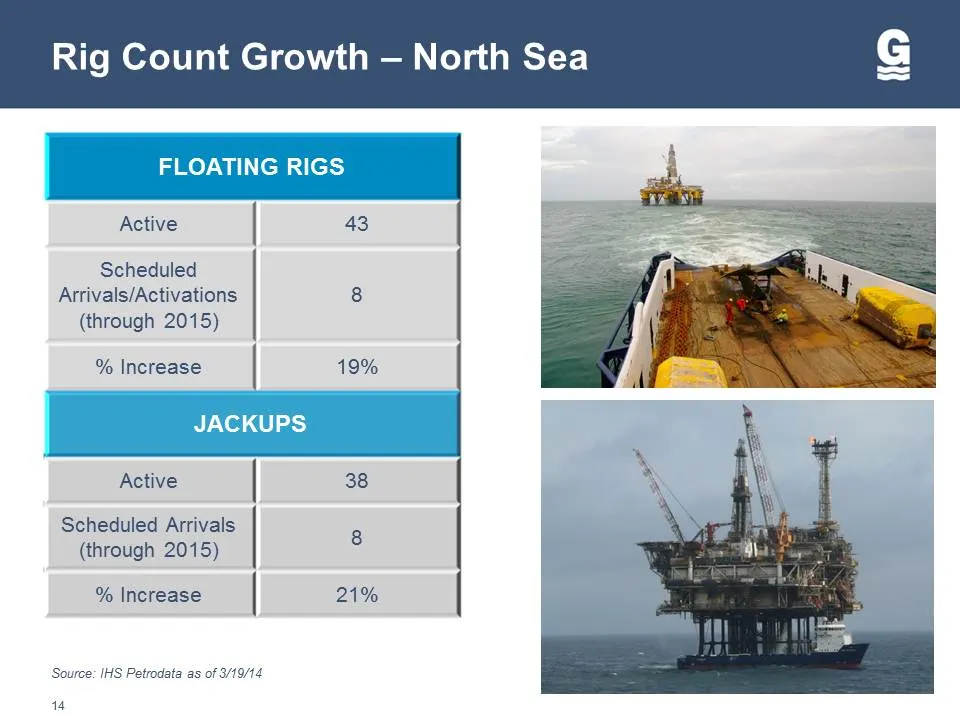
Rig Count Growth — North Sea Active 43 Scheduled Arrivals/Activations 8 (through 2015) % Increase 19% Active 38 Scheduled Arrivals (through 2015) % Increase 21% ‘Source: |HS Petrodata as of 3/19/14 14
Slide 15: Contracted Rig Growth
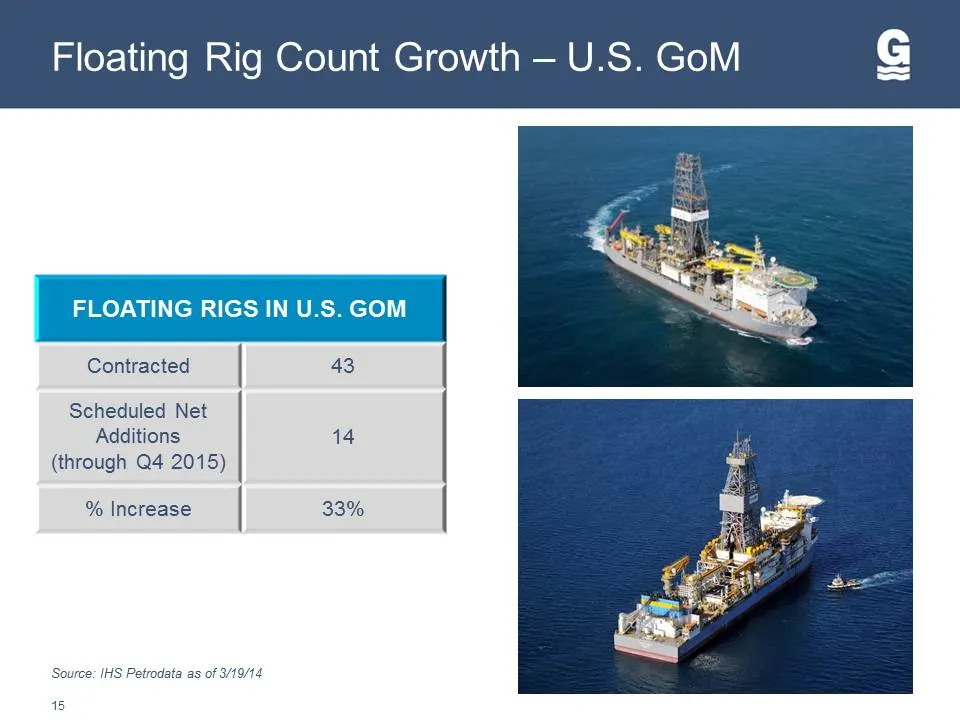
Contracted Scheduled Net Additions (through Q4 2015) % Increase | ‘Source: |HS Petrodata as of 3/19/14 15 43 14 33%
Slide 16: Vessel to Rig Ratio
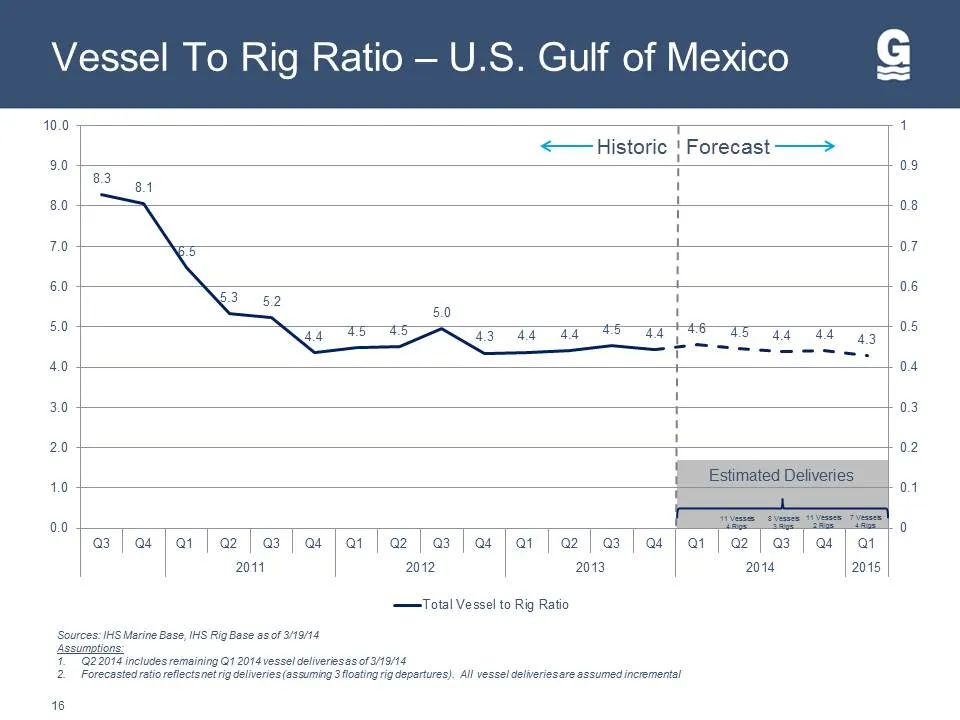
10.0 9.0 8.0 7.0 60 5.0 40 3.0 20 40 0.0 T <— Historic | Forecast ——> 1 83 a4 ' ~\ 1 1 1 L 1 Ma ' 3 52 ' 5.0 1 ae, ee 43.44 44% ays aa ag Prt tee ee? 1 1 1 1 T {__ Estimated Deliveries © ee ee = a3 | as | at | a2 | a3 | as Jar | a2 | a3 | a J at | a2 | a3 | as 2011 2012 2013 —Total Vessel to Rig Rat
Slide 17: Financial Information
FINANCIAL INFORMATION
Slide 18: 2013 GulfMark Revenue by Region
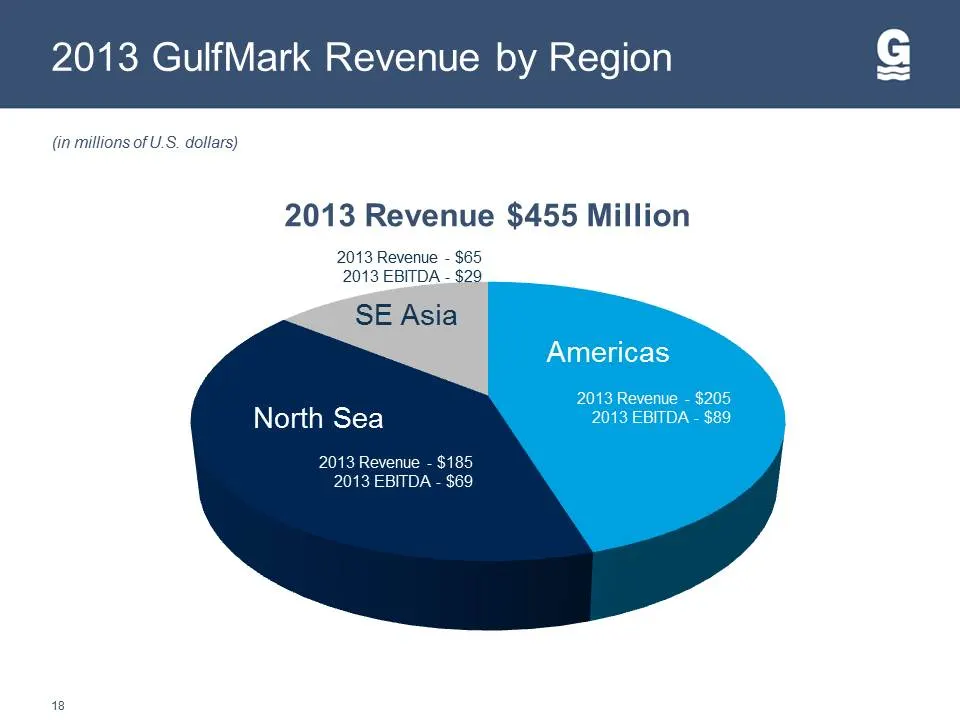
2013 GulfMark Revenue by Region (in millions of U.S. dollars) 2013 Revenue $455 Million 2013 Revenue - $65 2013 EBITDA - $29 SE Asia North Sea 2013 Revenue - $185 2013 EBITDA - $69 48
Slide 19: Strong Day Rates and Utilization
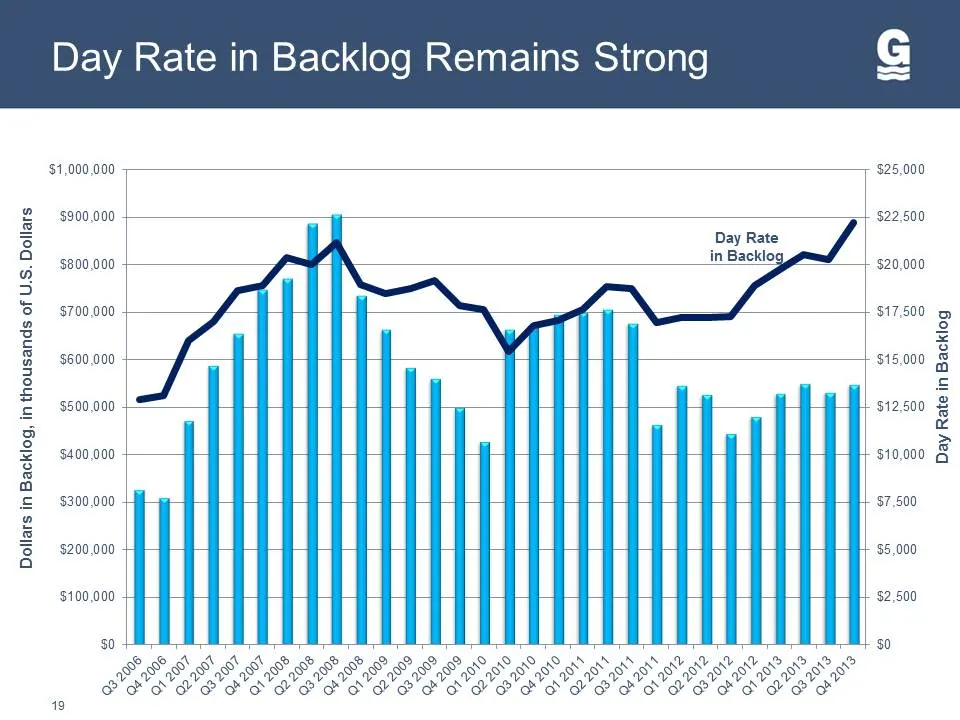
Strong INS © = ® o D ne} x S) © a In Day Rate Bojyoeg ul ayey Aeq 23 #8 za ae siejJog ‘s'f Jo spuesnotp u! ‘Boyyoeq ul sieljoq 19
Slide 20: Net Debt Position
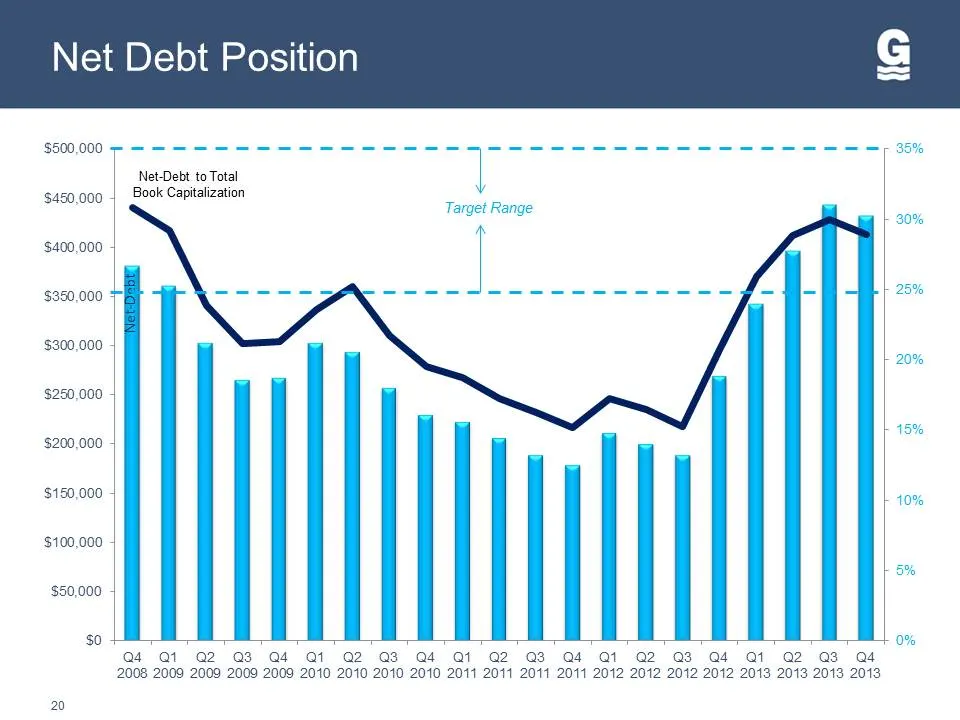
Net Debt Position $500,000 -# = ——-—-—------------~------------------- $480,000 $400,000 $350,000 $300,000 $260,000 $200,000 $150,000 $100,000 $60,000 $0 20 NetDebt to Total Book Capitalization Le —-\------&----- I Q4 Qi a2 Q3 Q4 Qi a2 G3 G4 Qi G2 G3 a4 QI G2 G3 G4 Qt a2 a3 as 2008 2009 2009 2009 20
Slide 21: 2014 - 2015 Non-Operating Uses of Cash
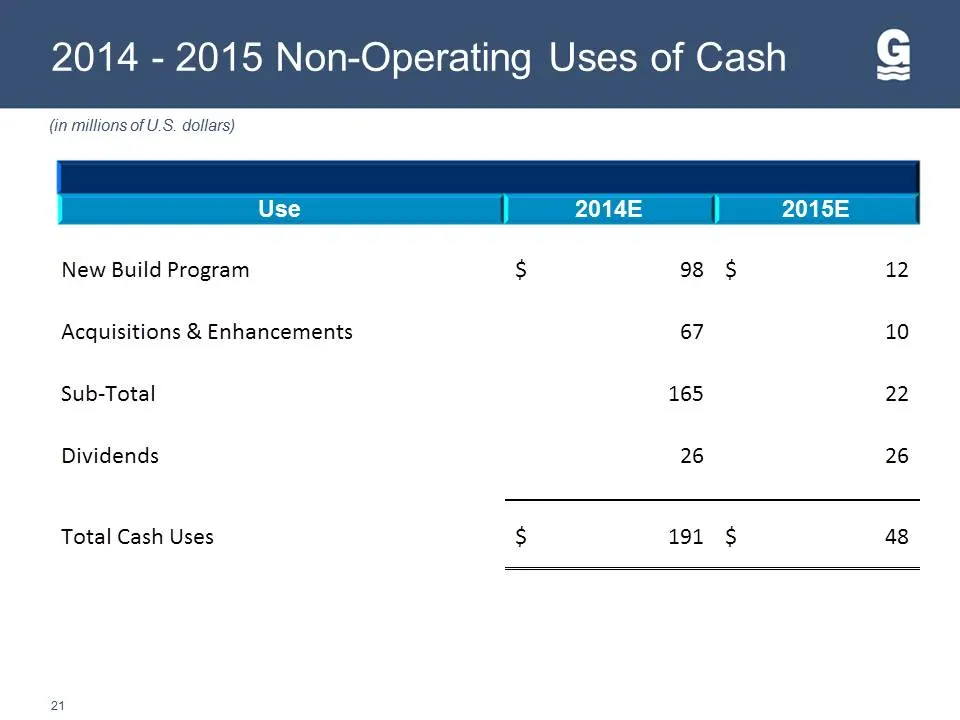
2014 - 2015 Non-Operating Uses of Cash (in millions of U.S. dollars) Use 2014E 2015E New Build Program $ 98 S$ q2 Acquisitions & Enhancements 67 10 Sub-Total 165 22 Dividends 26 26 Total Cash Uses $ 191 $ 48 2
Slide 22: GulfMark Investment Highlights
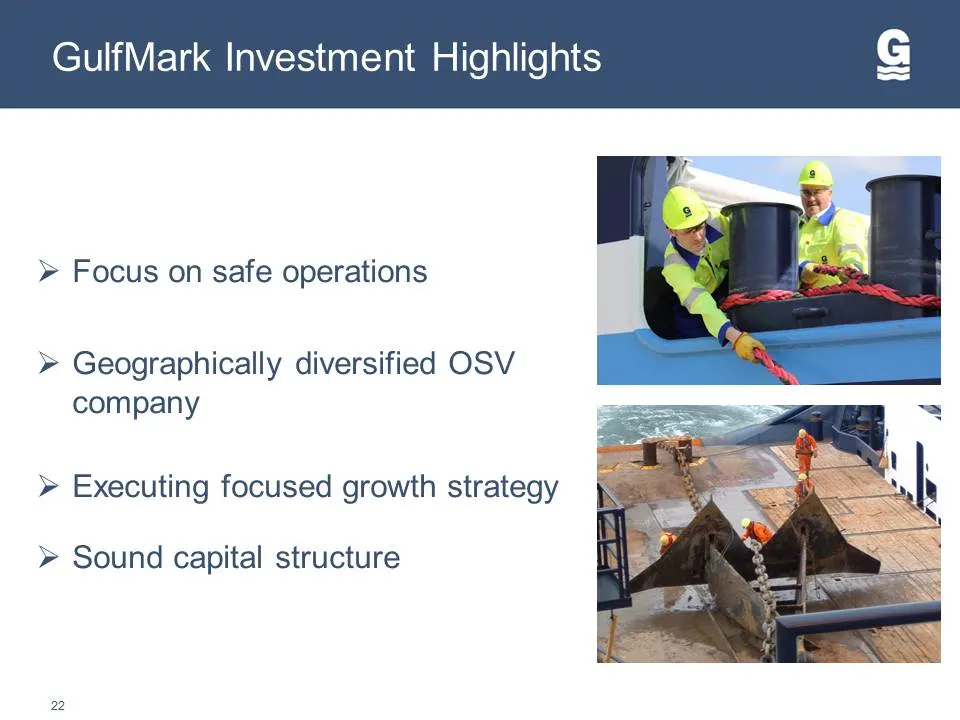
GulfMark Investment Highlights > Focus on safe operations >» Geographically diversified OSV company >» Executing focused growth strategy > Sound capital structure 22
Slide 23: Leaders in Global Offshore Marine Services
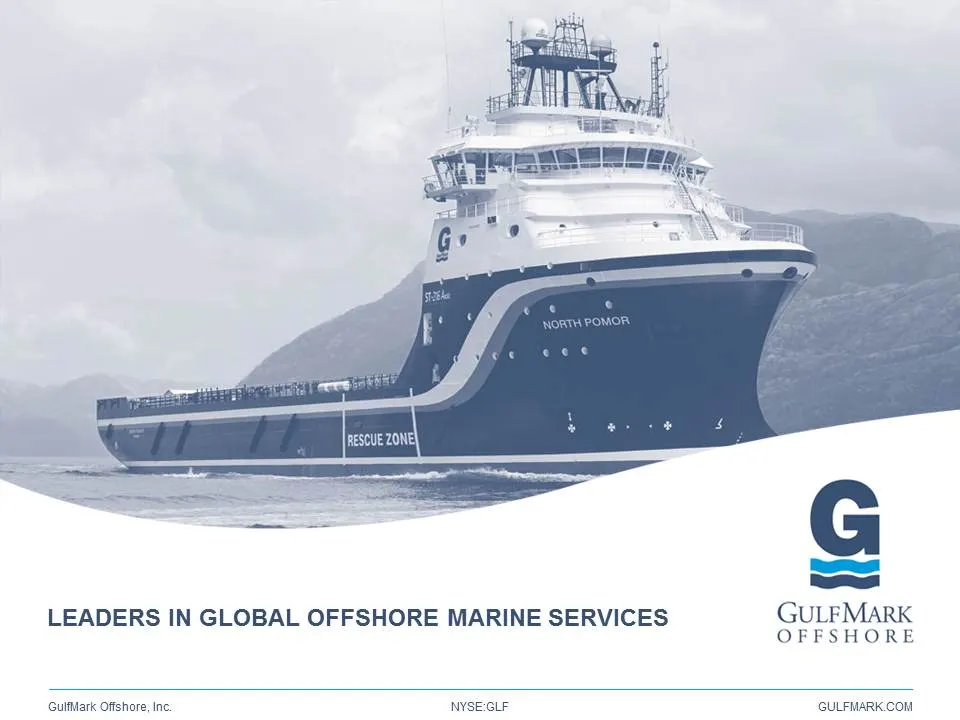
LEADERS IN GLOBAL OFFSHORE MARINE SERVICES GULEMARK Gulfitark Offshore, Inc. NYSEGLF GULFMARK.COM
Slide 24: Reconciliation of Adjusted EBITDA
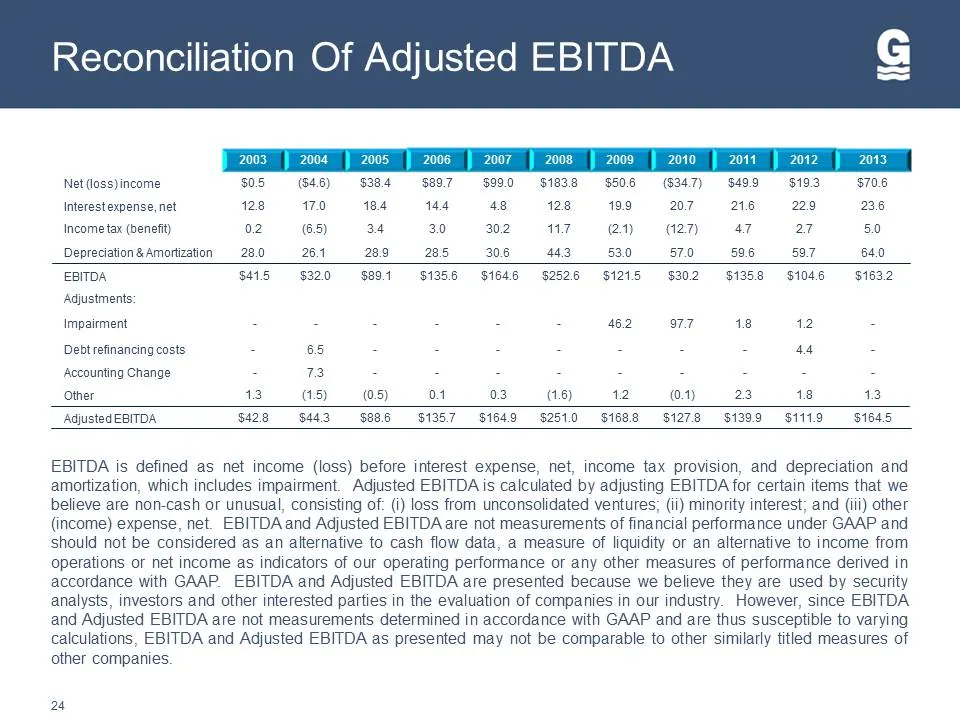
Reconciliation Of Adjusted EBITDA Net loss)income $05 ($48) S384 $897 $990 $1838 $506 ($347) S499 $193 $708 Interest expense, net, 12800170 184144 438 12806199 O72 229 23.8 Income tax (benefit) 02 (65) 34 30 30200« 17 @t)127)— 47 27 50 Depreciation& Amortization 28.0 26.1 289-285 308 443530 87.0898

Slide 25

Slide 26

Slide 27
Slide 28: GulfMark Offshore
GULFMARK OFFSHORE THE DIFFERENCE IS OUR PEOPLE GULFMARK.COM
Source: SEC EDGAR · 8-K filed Mar 26, 2014
More decks from Gulfmark Offshore Inc
 Merger or Acquisition (July 2018)11 slides · Jul 16, 2018
 Merger or Acquisition (July 2018)15 slides · Jul 16, 2018
 Investor Presentation (March 2018)22 slides · Mar 6, 2018
 Debt Investor Presentation (October 2017)16 slides · Oct 2, 2017
 Debt Investor Presentation (May 2017)41 slides · May 18, 2017
 Debt Investor Presentation (November 2016)28 slides · Nov 28, 2016