Malvern Bancorp — Investor Presentation (November 2013)
23 slides from Malvern Bancorp's investor presentation, Nov 4, 2013

Slide 1: Investor Presentation November 4, 2013
Investor Presentation November 4, 2013
Slide 2: Forward looking statements
Certain comments in this presentation contain certain forward looking statements (as defined in the Securities Exchange Act of 1934 and the regulations hereunder). Forward looking statements are not historical facts but instead represent only the beliefs, expectations or opinions of Malvern Bancorp,
Slide 3: Company Profile
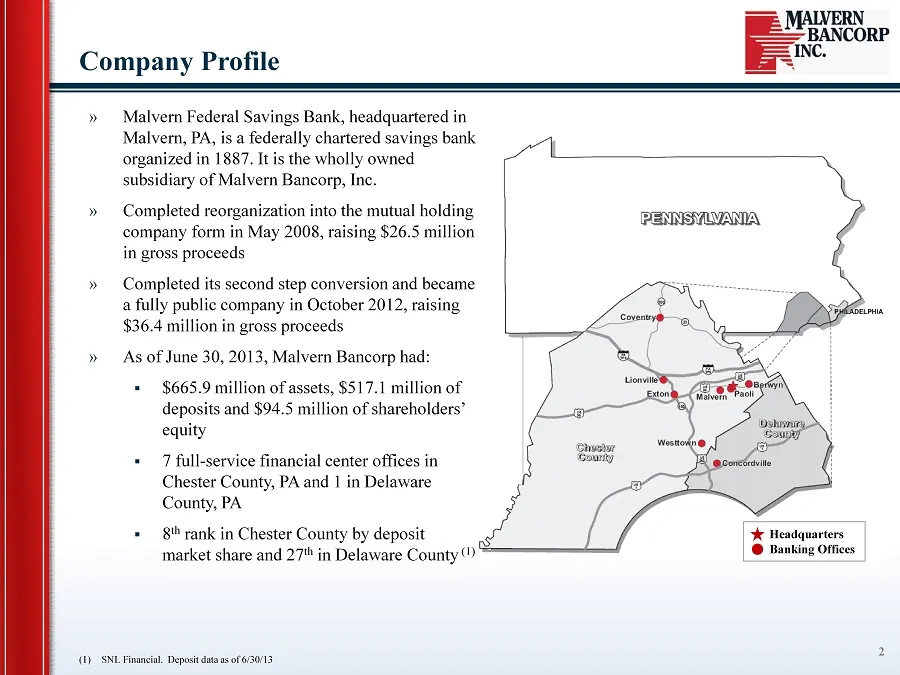
Company Profile 2 » Malvern Federal Savings Bank, headquartered in Malvern, PA, is a federally chartered savings bank organized in 1887. It is the wholly owned subsidiary of Malvern Bancorp, Inc. » Completed reorganization into the mutual holding company form in May 2008, raising $26.5 million in gr
Slide 4: Market Overview & Demographics
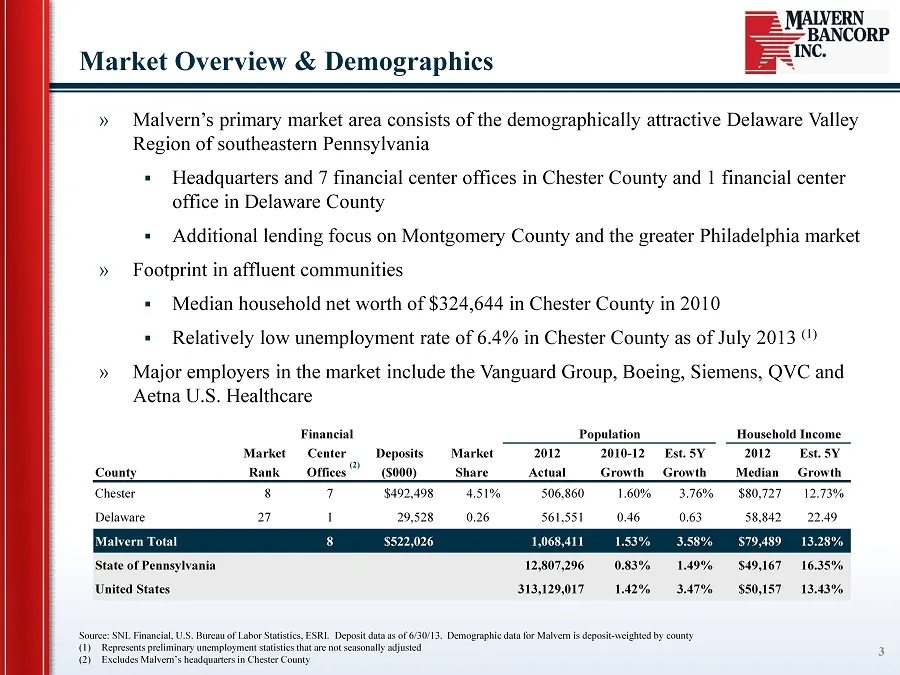
» Malvern’s primary market area consists of the demographically attractive Delaware Valley Region of southeastern Pennsylvania ▪ Headquarters and 7 financial center offices in Chester County and 1 financial center office in Delaware County ▪ Additional lending focus on Montgomery County and the grea
Slide 5: Deposit Market Share
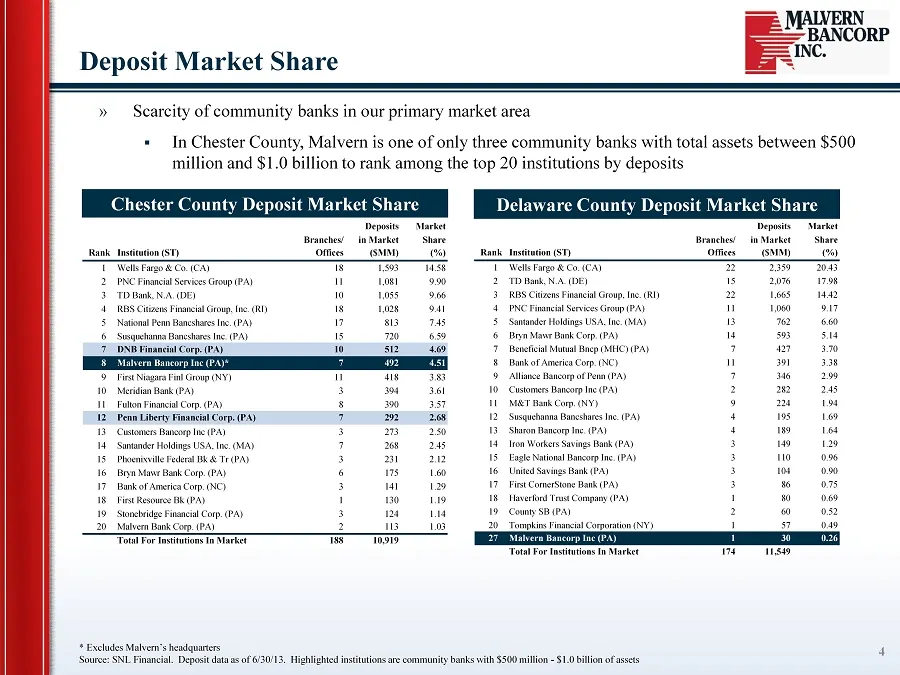
Deposits Market Branches/ in Market Share Rank Institution (ST) Offices ($MM) (%) 1 Wells Fargo & Co. (CA) 22 2,359 20.43 2 TD Bank, N.A. (DE) 15 2,076 17.98 3 RBS Citizens Financial Group, Inc. (RI) 22 1,665 14.42 4 PNC Financial Services Group (PA) 11 1,060 9.17 5 Santander Holdings USA, Inc. (MA)
Slide 6: Recent Developments
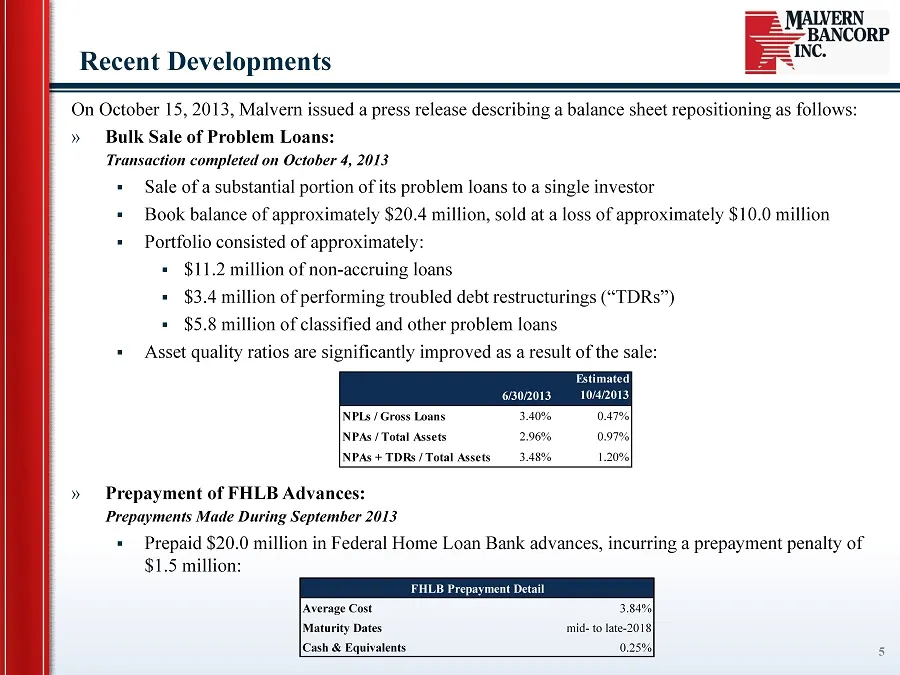
Recent Developments 5 On October 15, 2013, Malvern issued a press release describing a balance sheet repositioning as follows: » Bulk Sale of Problem Loans: Transaction completed on October 4, 2013 ▪ Sale of a substantial portion of its problem loans to a single investor ▪ Book balance of approximat
Slide 7: Recent Developments (Continued)
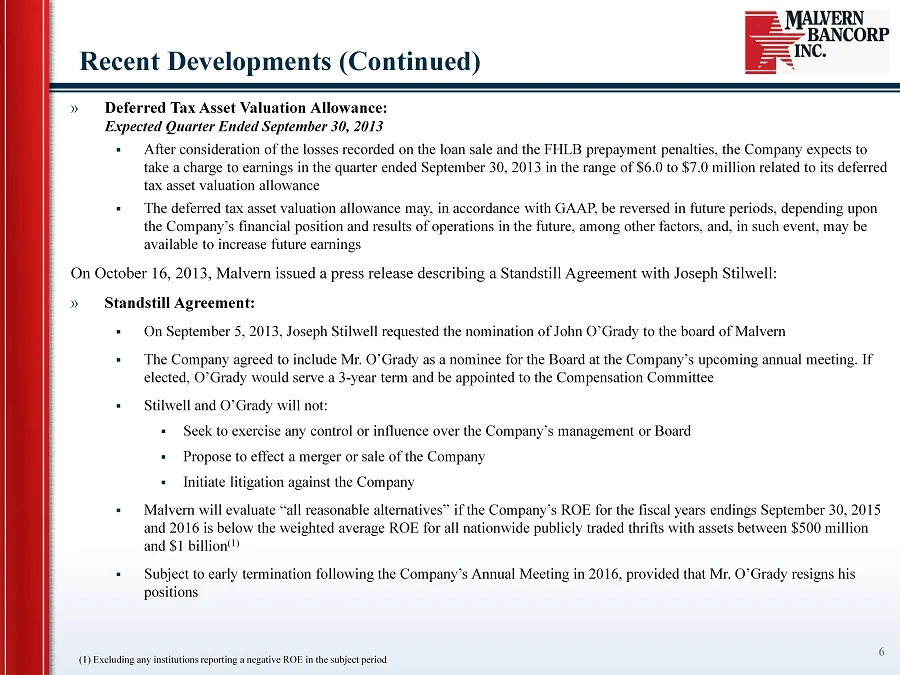
Recent Developments (Continued) 6 » Deferred Tax Asset Valuation Allowance: Expected Quarter Ended September 30, 2013 ▪ After consideration of the losses recorded on the loan sale and the FHLB prepayment penalties, the Company expects to take a charge to earnings in the quarter ended September 30, 2
Slide 8: Business Strategy
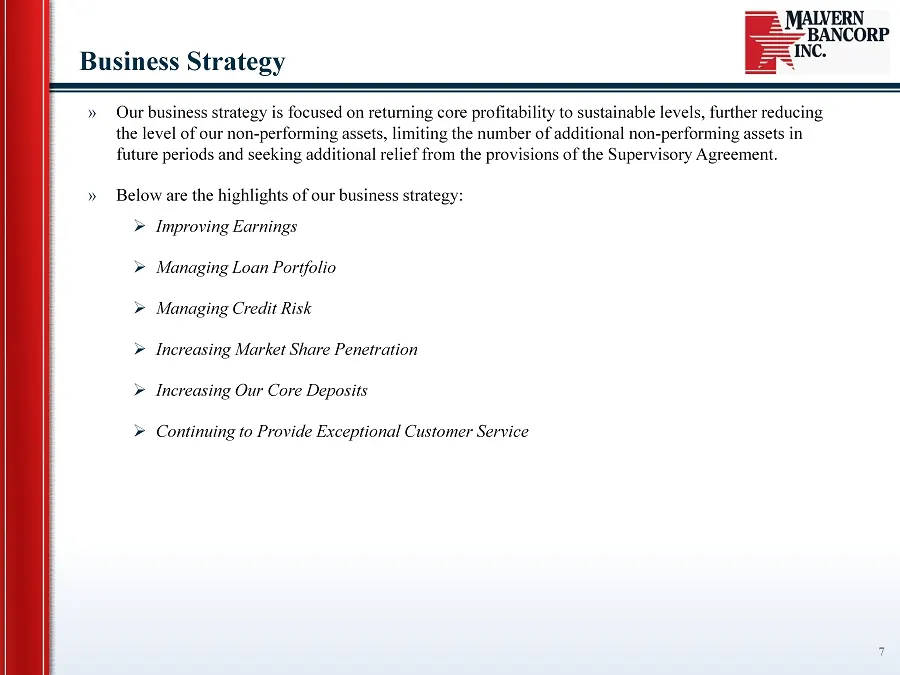
» Our business strategy is focused on returning core profitability to sustainable levels, further reducing the level of our non - performing assets, limiting the number of additional non - performing assets in future periods and seeking additional relief from the provisions of the Supervisory Agreem
Slide 9: Overview of Management Team
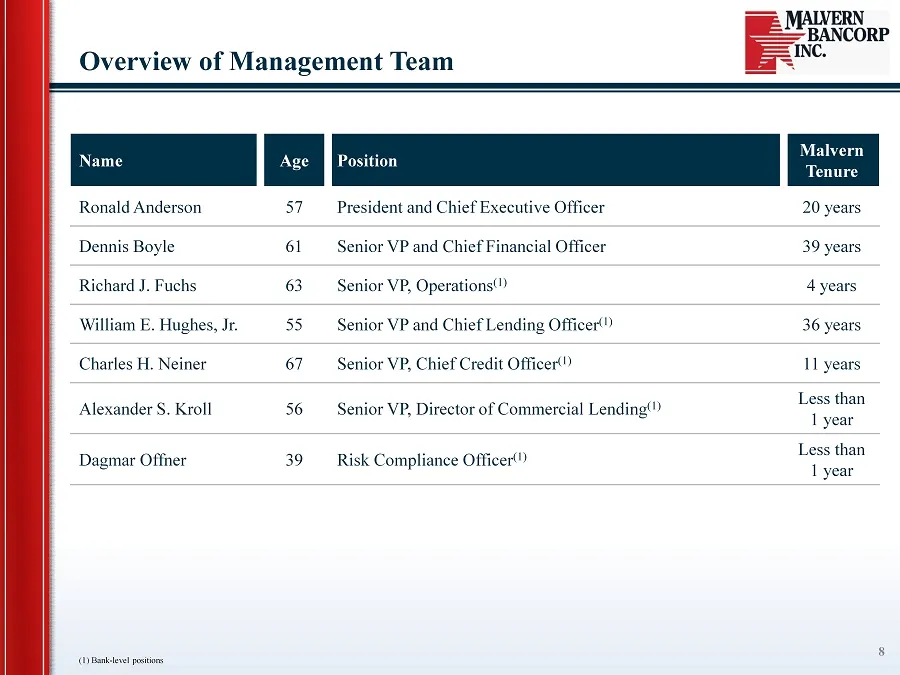
Overview of Management Team 8 Name Age Position Malvern Tenure Ronald Anderson 57 President and Chief Executive Officer 20 years Dennis Boyle 61 Senior VP and Chief Financial Officer 39 years Richard J. Fuchs 63 Senior VP, Operations (1) 4 years William E. Hughes, Jr. 55 Senior V P and Chief Lending
Slide 10: Financial Highlights
BANCORP Financial Highlights
Slide 11: Financial Overview
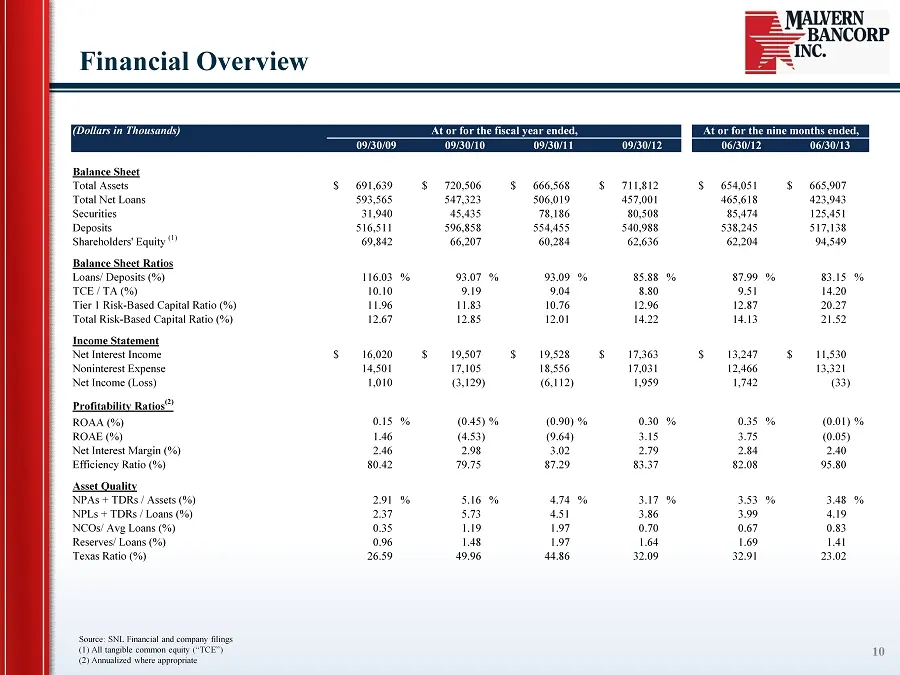
Financial Overview 10 (Dollars in Thousands) At or for the fiscal year ended, At or for the nine months ended, 09/30/09 09/30/10 09/30/11 09/30/12 06/30/12 06/30/13 Balance Sheet Total Assets 691,639$ 720,506$ 666,568$ 711,812$ 654,051$ 665,907$ Total Net Loans 593,565 547,323 506,019 457,001 465,61
Slide 12: Asset Quality
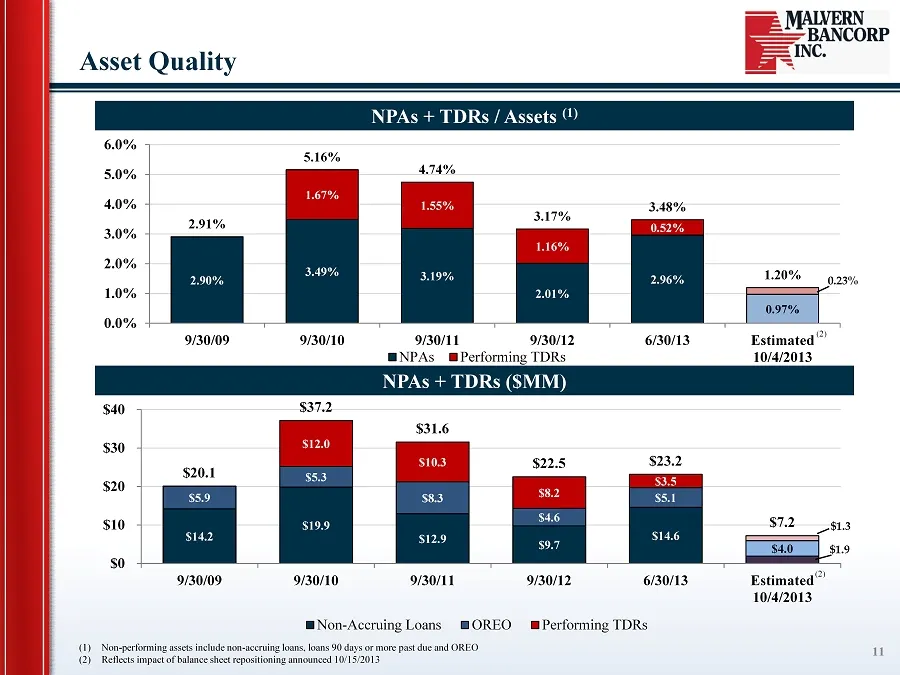
2.90% 3.49% 3.19% 2.01% 2.96% 0.97% 1.67% 1.55% 1.16% 0.52% 2.91% 5.16% 4.74% 3.17% 3.48% 1.20% 0.0% 1.0% 2.0% 3.0% 4.0% 5.0% 6.0% 9/30/09 9/30/10 9/30/11 9/30/12 6/30/13 Estimated 10/4/2013 NPAs Performing TDRs NPAs + TDRs ($MM) Asset Quality 11 NPAs + TDRs / Assets (1) (1) Non - performing assets
Slide 13: Loan Portfolio
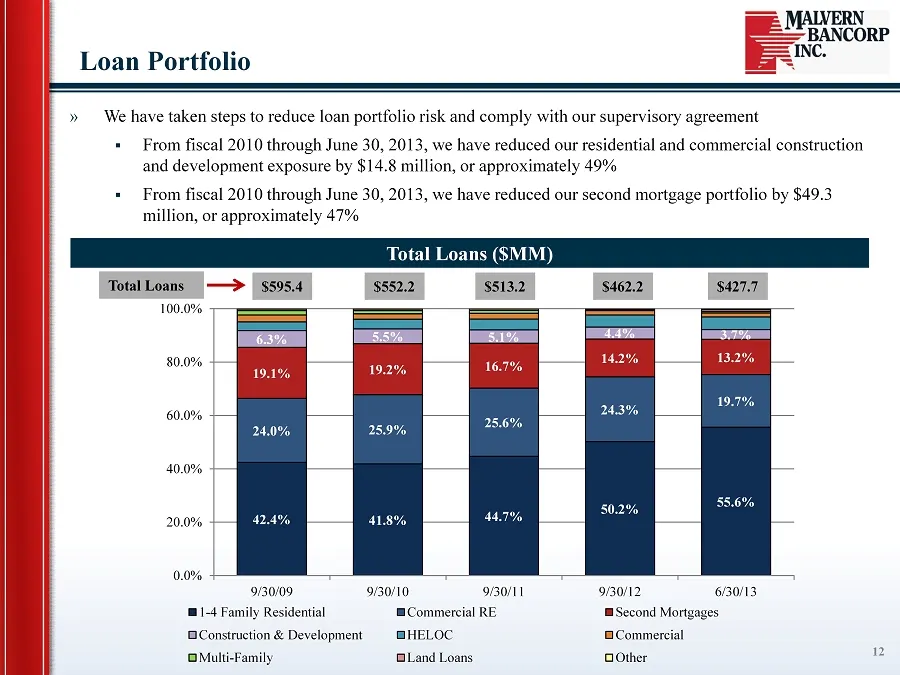
42.4% 41.8% 44.7% 50.2% 55.6% 24.0% 25.9% 25.6% 24.3% 19.7% 19.1% 19.2% 16.7% 14.2% 13.2% 6.3% 5.5% 5.1% 4.4% 3.7% 0.0% 20.0% 40.0% 60.0% 80.0% 100.0% 9/30/09 9/30/10 9/30/11 9/30/12 6/30/13 1-4 Family Residential Commercial RE Second Mortgages Construction & Development HELOC Commercial Multi-Famil
Slide 14: Securities
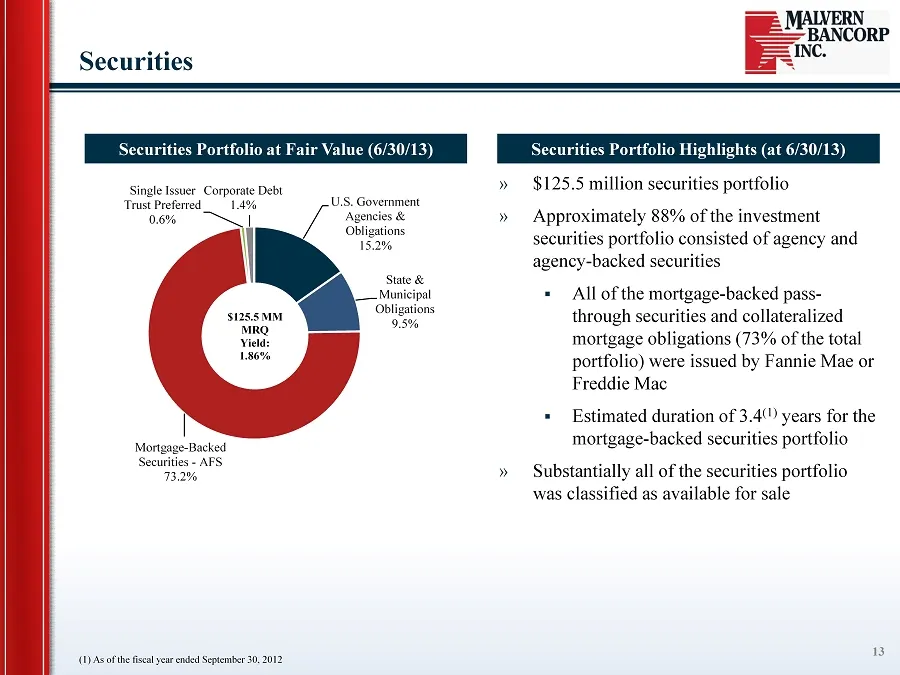
Securities 13 » $125.5 million securities portfolio » Approximately 88% of the investment securities portfolio consisted of agency and agency - backed securities ▪ All of the mortgage - backed pass - through securities and collateralized mortgage obligations (73% of the total portfolio) were issued
Slide 15: Deposits
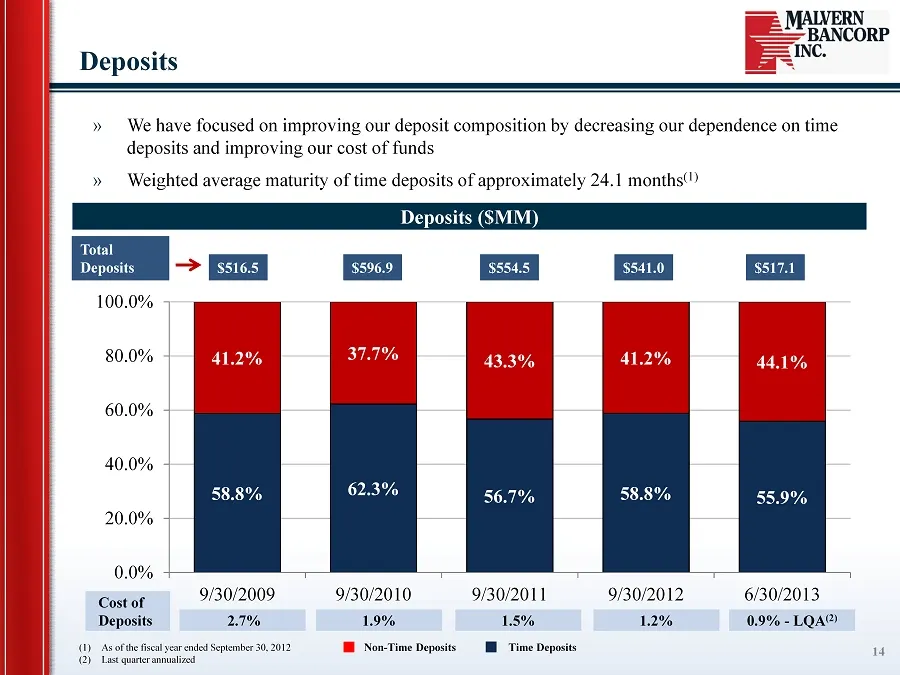
58.8% 62.3% 56.7% 58.8% 55.9% 41.2% 37.7% 43.3% 41.2% 44.1% 0.0% 20.0% 40.0% 60.0% 80.0% 100.0% 9/30/2009 9/30/2010 9/30/2011 9/30/2012 6/30/2013 Deposits » W e have focused on improving our deposit composition by decreasing our dependence on time deposits and improving our cost of funds » Weighted
Slide 16: Capital
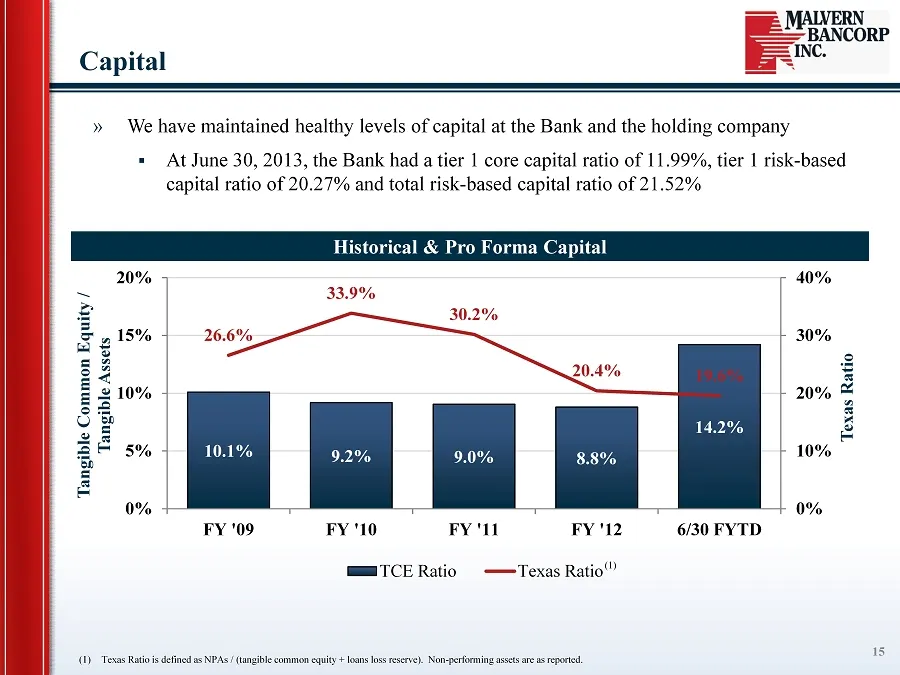
10.1% 9.2% 9.0% 8.8% 14.2% 26.6% 33.9% 30.2% 20.4% 19.6% 0% 10% 20% 30% 40% 0% 5% 10% 15% 20% FY '09 FY '10 FY '11 FY '12 6/30 FYTD Texas Ratio Tangible Common Equity / Tangible Assets TCE Ratio Texas Ratio Capital » We have maintained healthy levels of capital at the Bank and the holding company ▪
Slide 17: Market Statistics
BANCORP Market Statistics
Slide 18: MLVF Stock Price Performance
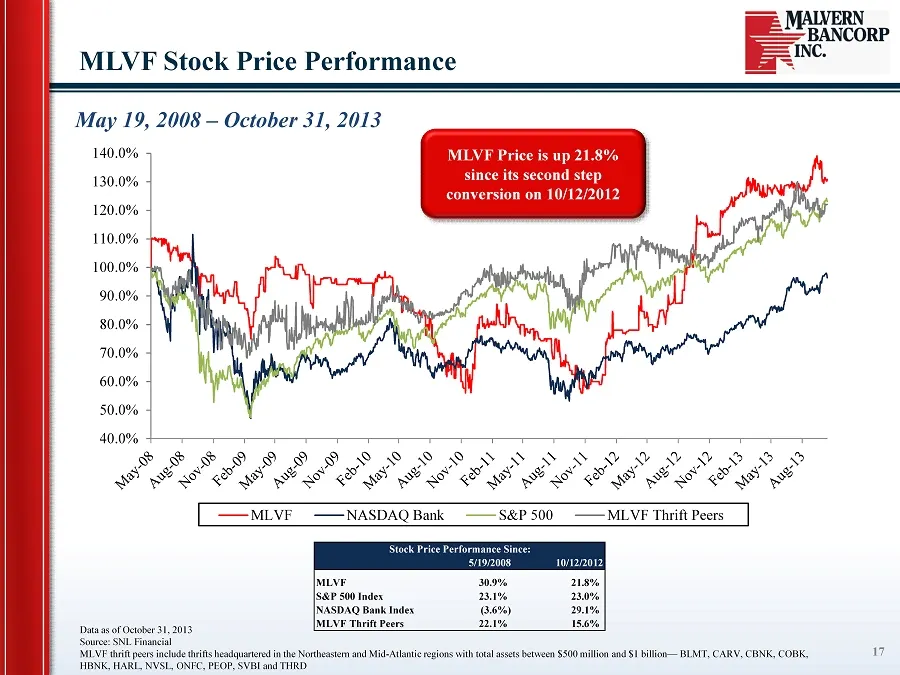
40.0% 50.0% 60.0% 70.0% 80.0% 90.0% 100.0% 110.0% 120.0% 130.0% 140.0% MLVF NASDAQ Bank S&P 500 MLVF Thrift Peers May 19, 2008 – October 31, 2013 MLVF Stock Price Performance 17 Data as of October 31, 2013 Source: SNL Financial MLVF thrift peers include thrifts headquartered in the Northeastern and
Slide 19: MLVF vs. Public Thrifts
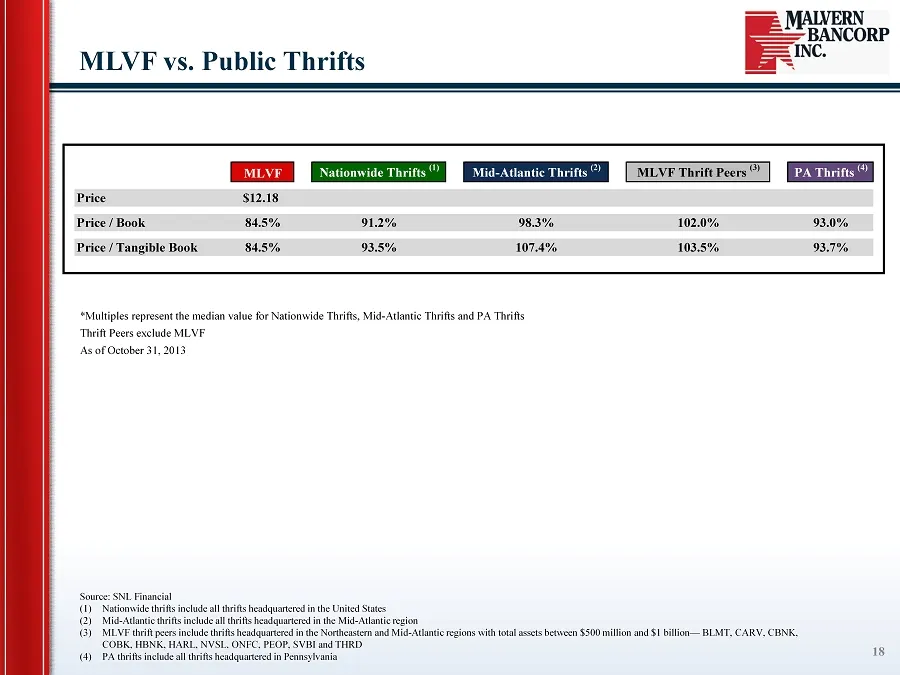
Source : SNL Financial (1) Nationwide thrifts include all thrifts headquartered in the United States (2) Mid - Atlantic thrifts include all thrifts headquartered in the Mid - Atlantic region (3) MLVF thrift peers include thrifts headquartered in the Northeastern and Mid - Atlantic regions with total
Slide 20: Appendix
Appendix 19
Slide 21: MLVF Thrift Peer Group Components
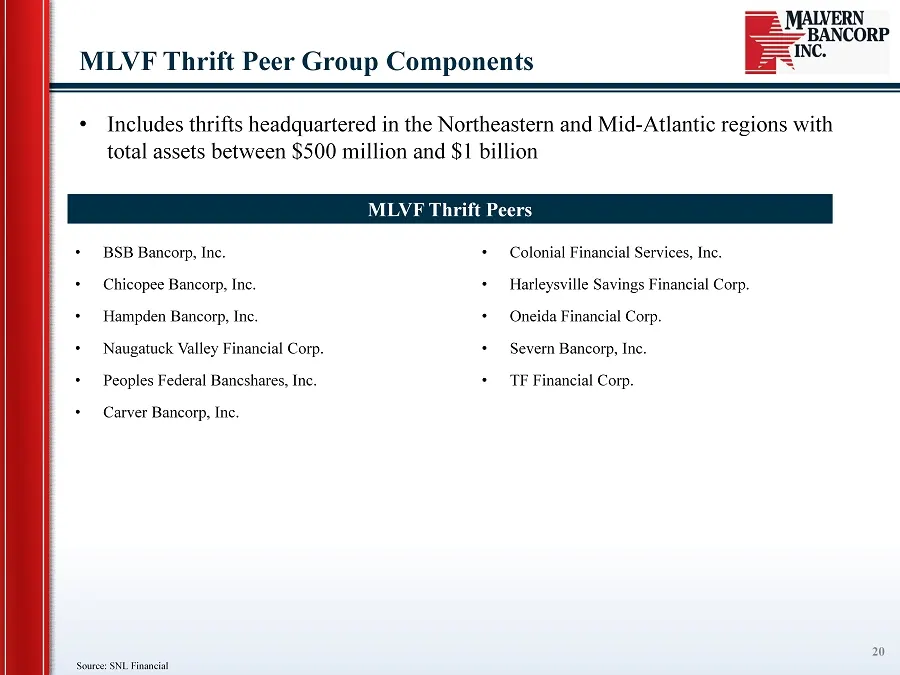
Source : SNL Financial MLVF Thrift Peer Group Components 20 • Includes thrifts headquartered in the Northeastern and Mid - Atlantic regions with total assets between $500 million and $1 billion MLVF Thrift Peers • BSB Bancorp, Inc. • Chicopee Bancorp, Inc. • Hampden Bancorp, Inc. • Naugatuck Valley
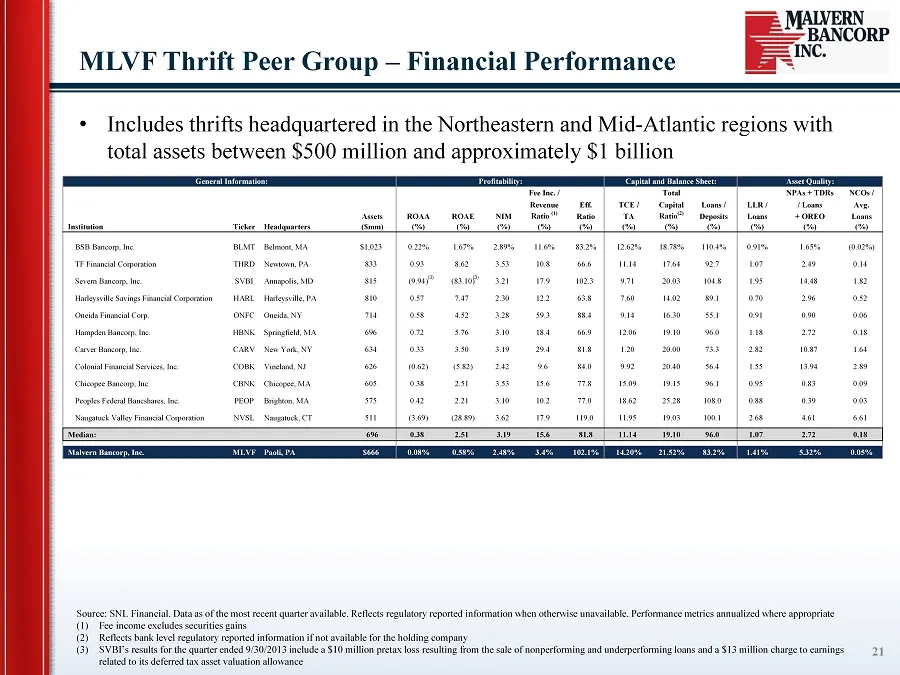
Slide 22: MLVF Thrift Peer Group – Financial Performance
MLVF Thrift Peer Group – Financial Performance 21 • Includes thrifts headquartered in the Northeastern and Mid - Atlantic regions with total assets between $500 million and approximately $1 billion Source : SNL Financial. Data as of the most recent quarter available. Reflects regulatory reported inf
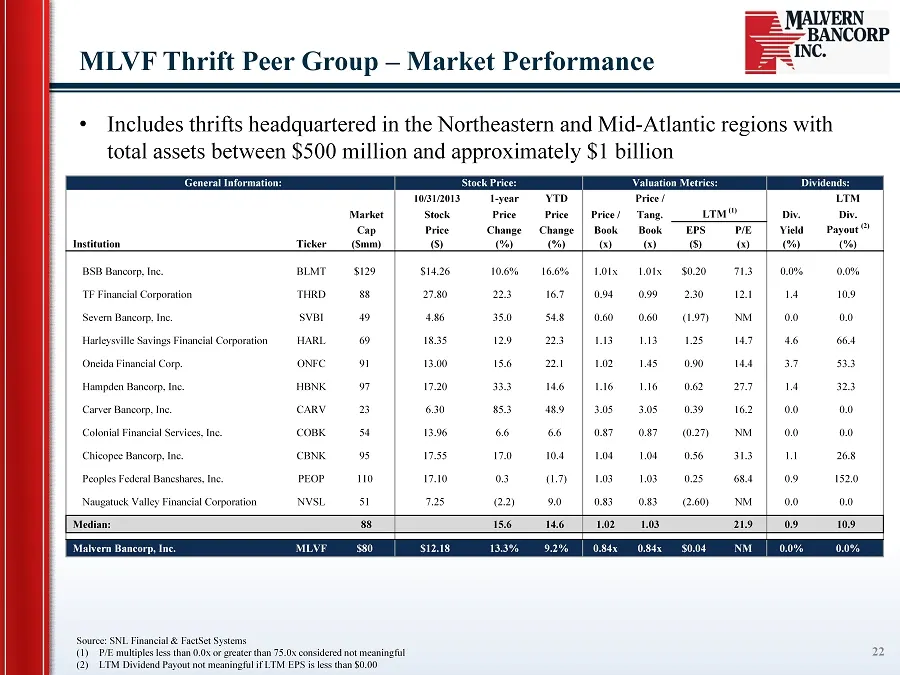
Slide 23: MLVF Thrift Peer Group – Market Performance
Source : SNL Financial & FactSet Systems (1) P/E multiples less than 0.0x or greater than 75.0x considered not meaningful (2) LTM Dividend Payout not meaningful if LTM EPS is less than $0.00 MLVF Thrift Peer Group – Market Performance 22 • Includes thrifts headquartered in the Northeastern and Mid -
Source: SEC EDGAR · 8-K filed Nov 4, 2013