Holly Energy Partners LP — Investor Presentation (November 2008)
31 slides from Holly Energy Partners LP's investor presentation, Nov 20, 2008
Slide 1: Partnership Update / Capital Development & Growth Plans Winter 2008
Partnership Update / Capital Development & Growth Plans Winter 2008
Slide 2: Safe Harbor Disclosure Statement
Safe Harbor Disclosure Statement Statements made during the course of this presentation that are not historical facts are "forward- looking statements" within the meaning of the U.S. Private Securities Litigation Reform Act of 1995. Forward-looking statements are inherently uncertain and necessarily
Slide 3: Presentation Topics
Presentation Topics History of HEP Strong Track Record Low Risk Profile Focused Growth Orientation Summary Appendix
Slide 4: Presentation Topics
Presentation Topics History of HEP Strong Track Record Low Risk Profile Focused Growth Orientation Summary Appendix
Slide 5: History of HEP
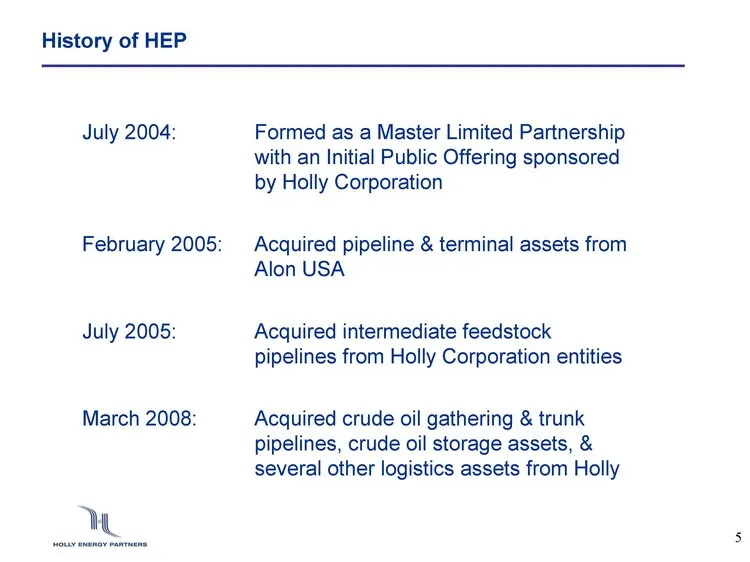
History of HEP July 2004: Formed as a Master Limited Partnership with an Initial Public Offering sponsored by Holly Corporation February 2005: Acquired pipeline & terminal assets from Alon USA July 2005: Acquired intermediate feedstock pipelines from Holly Corporation entities March 2008: Acquired c
Slide 6: HEP Assets: Current Footprint
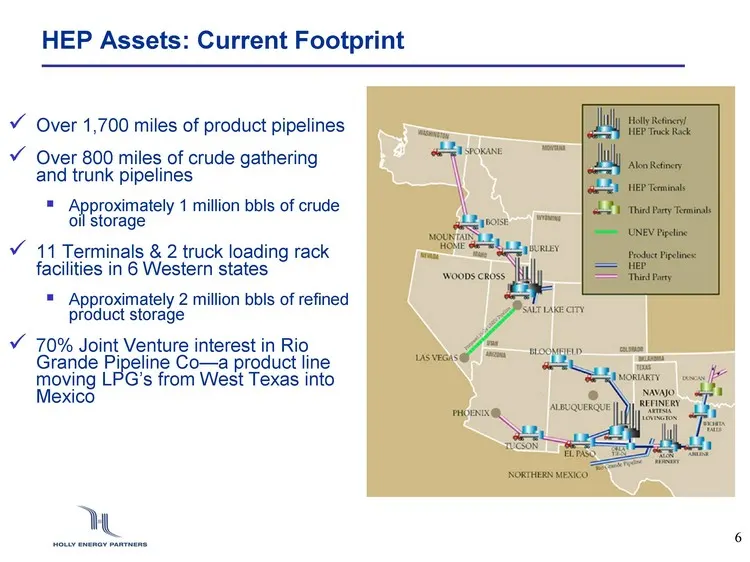
HEP Assets: Current Footprint Over 1,700 miles of product pipelines Over 800 miles of crude gathering and trunk pipelines Approximately 1 million bbls of crude oil storage 11 Terminals & 2 truck loading rack facilities in 6 Western states Approximately 2 million bbls of refined product storage 70% J
Slide 7: Presentation Topics
Presentation Topics History of HEP Strong Track Record Low Risk Profile Focused Growth Orientation Summary Appendix
Slide 8: Pipeline Volume Growth
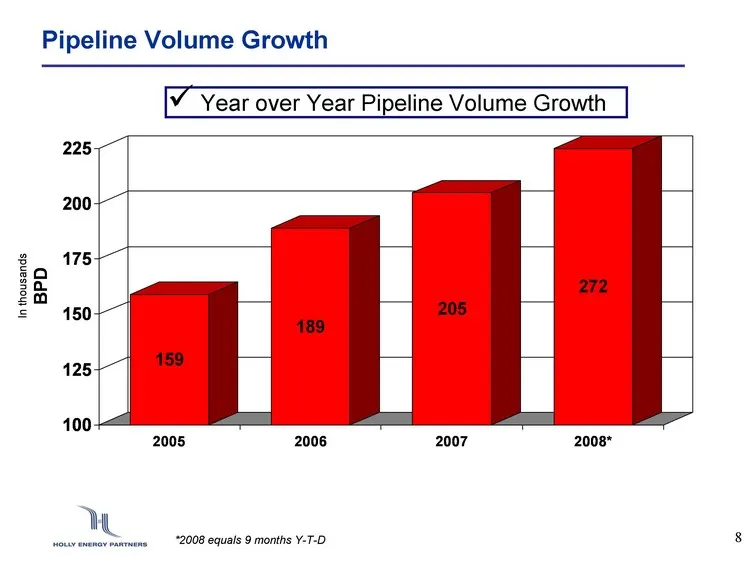
Pipeline Volume Growth 2005 2006 2007 2008* East 159 189 205 272 In thousands Year over Year Pipeline Volume Growth *2008 equals 9 months Y-T-D
Slide 9: HEP Steady State EBITDA
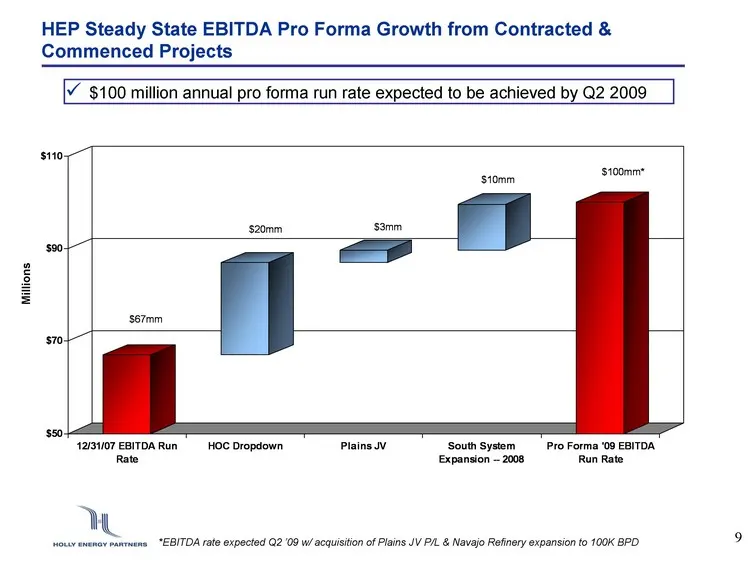
HEP Steady State EBITDA Pro Forma Growth from Contracted & Commenced Projects 12/31/07 EBITDA Run Rate HOC Dropdown Plains JV South System Expansion -- 2008 Pro Forma '09 EBITDA Run Rate East 67 67 87 89.6 0 20 2.6 10 100 Millions $100 million annual pro forma run rate expected to be achieved by Q2
Slide 10: Distributable Cash Flow Growth
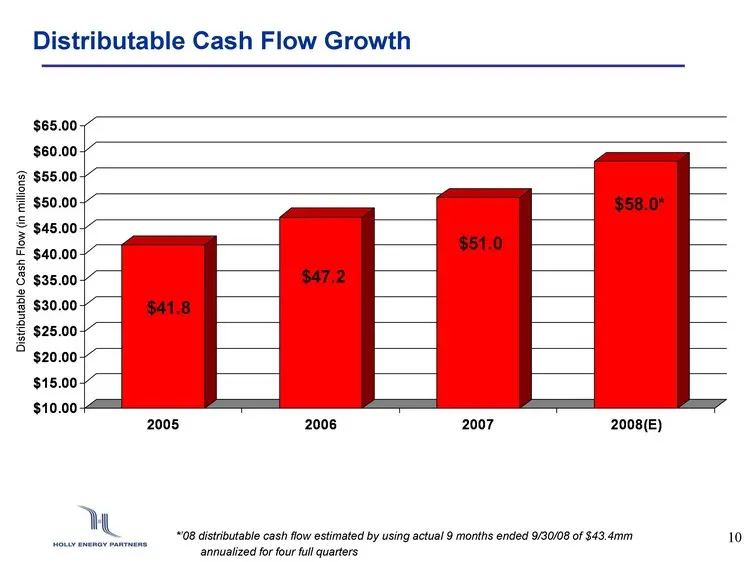
Distributable Cash Flow Growth 2005 2006 2007 2008(E) East 41.8 47.2 51 58 Distributable Cash Flow (in millions) *'08 distributable cash flow estimated by using actual 9 months ended 9/30/08 of $43.4mm annualized for four full quarters
Slide 11: Distribution Growth
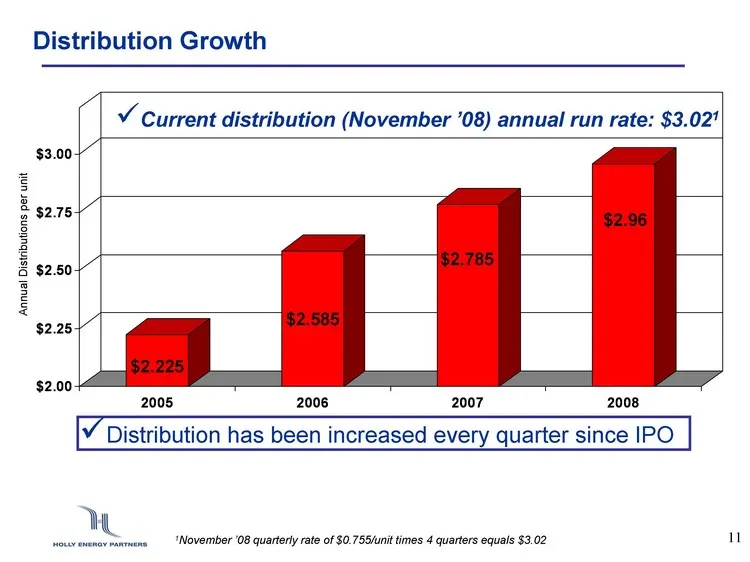
Distribution Growth 2005 2006 2007 2008 East 2.225 2.585 2.785 2.96 Annual Distributions per unit 1November '08 quarterly rate of $0.755/unit times 4 quarters equals $3.02 Distribution has been increased every quarter since IPO Current distribution (November '08) annual run rate: $3.021
Slide 12: Presentation Topics
Presentation Topics History of HEP Strong Track Record Low Risk Profile Focused Growth Orientation Summary Appendix
Slide 13: Low Risk Profile-Commodity Risk
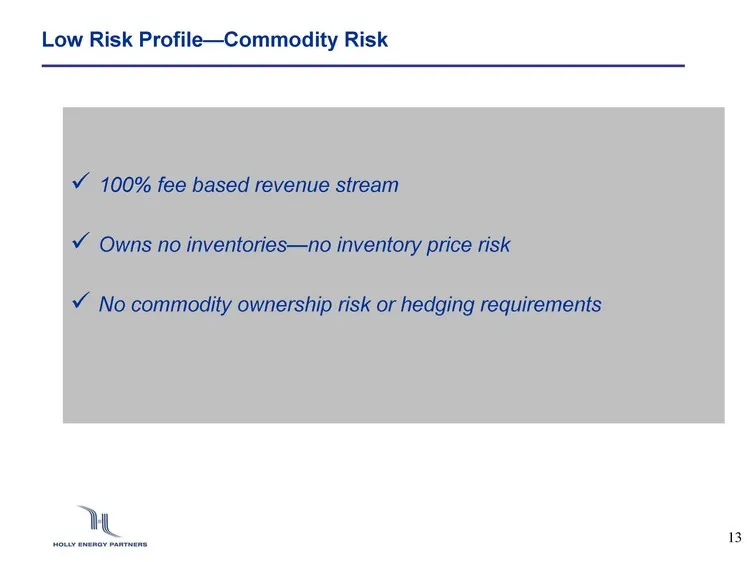
Low Risk Profile-Commodity Risk 100% fee based revenue stream Owns no inventories-no inventory price risk No commodity ownership risk or hedging requirements
Slide 14: Low Risk Profile-Revenue Stability
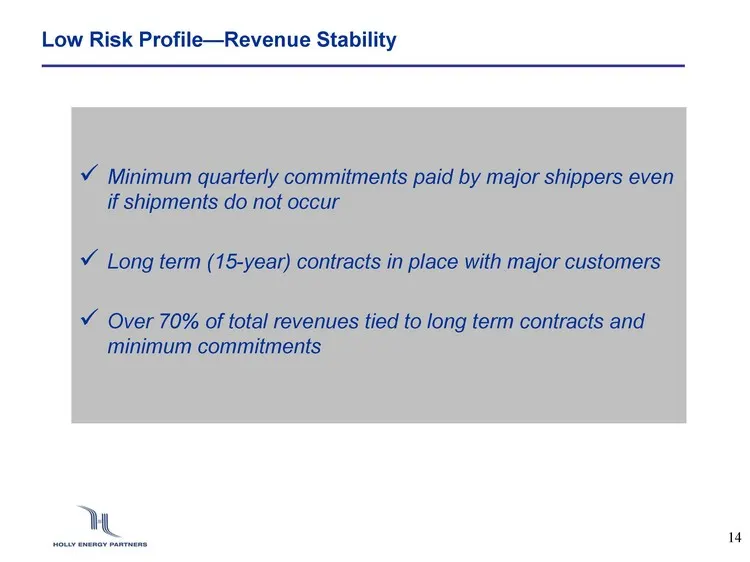
Low Risk Profile-Revenue Stability Minimum quarterly commitments paid by major shippers even if shipments do not occur Long term (15-year) contracts in place with major customers Over 70% of total revenues tied to long term contracts and minimum commitments
Slide 15: Low Risk Profile-Revenue Stability: Minimum Commitments
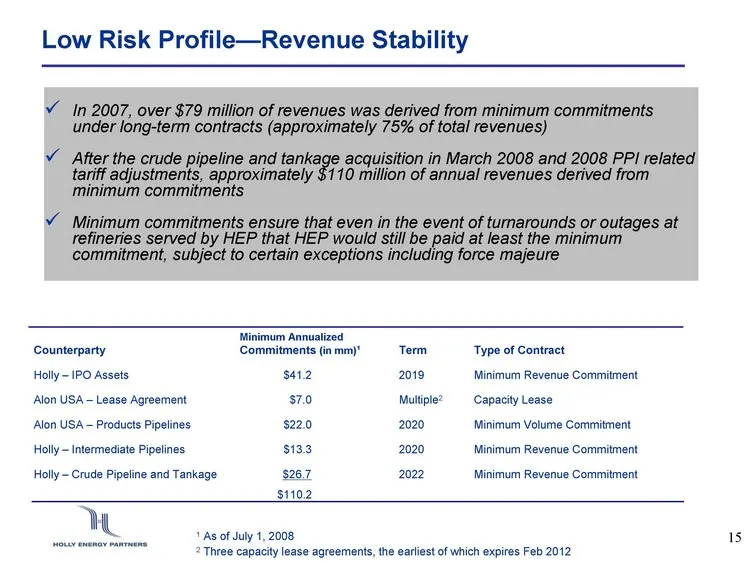
Low Risk Profile-Revenue Stability In 2007, over $79 million of revenues was derived from minimum commitments under long-term contracts (approximately 75% of total revenues) After the crude pipeline and tankage acquisition in March 2008 and 2008 PPI related tariff adjustments, approximately $110 mil
Slide 16: Liquidity
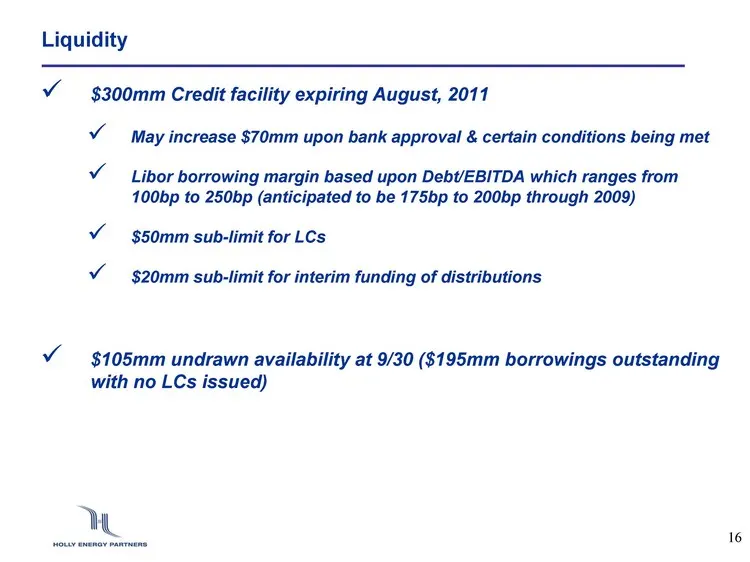
Liquidity $300mm Credit facility expiring August, 2011 May increase $70mm upon bank approval & certain conditions being met Libor borrowing margin based upon Debt/EBITDA which ranges from 100bp to 250bp (anticipated to be 175bp to 200bp through 2009) $50mm sub-limit for LCs $20mm sub-limit for inter
Slide 17: Debt Outstanding - 9/30/08
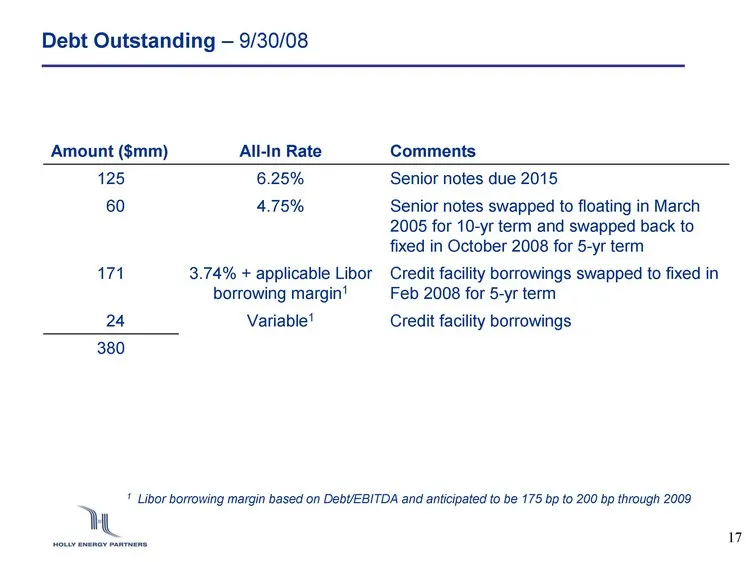
Debt Outstanding - 9/30/08 Amount ($mm) All-In Rate Comments 125 6.25% Senior notes due 2015 60 4.75% Senior notes swapped to floating in March 2005 for 10-yr term and swapped back to fixed in October 2008 for 5-yr term 171 3.74% + applicable Libor borrowing margin1 Credit facility borrowings swappe
Slide 18: Presentation Topics
Presentation Topics History of HEP Strong Track Record Low Risk Profile Focused Growth Orientation Summary Appendix
Slide 19: HEP Capital Projects
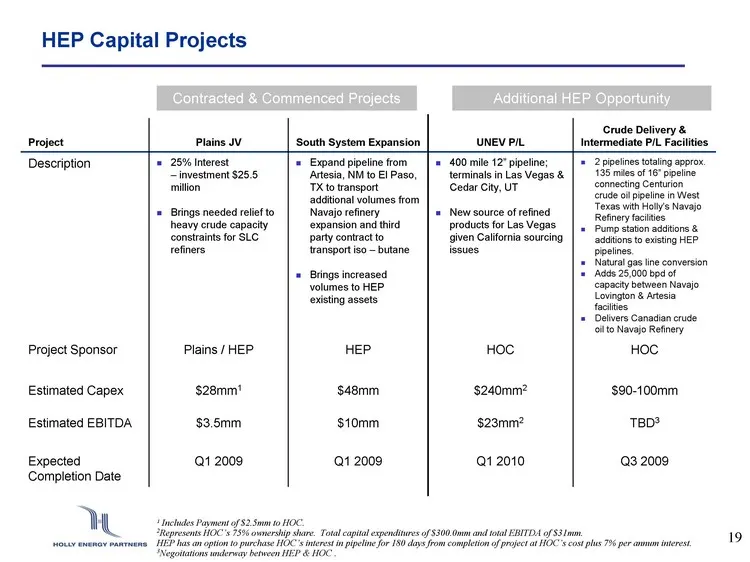
HEP Capital Projects 1 Includes Payment of $2.5mm to HOC. 2Represents HOC's 75% ownership share. Total capital expenditures of $300.0mm and total EBITDA of $31mm. HEP has an option to purchase HOC's interest in pipeline for 180 days from completion of project at HOC's cost plus 7% per annum interest
Slide 20: Key HEP Strengths & Highlights
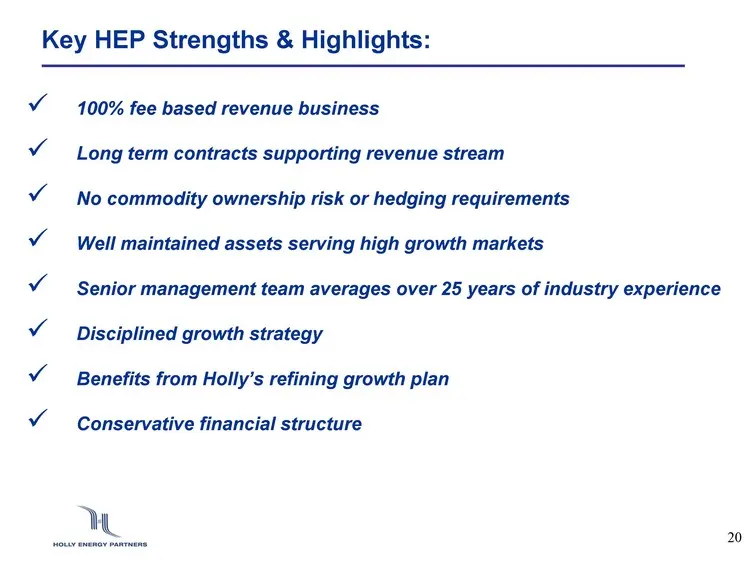
Key HEP Strengths & Highlights: 100% fee based revenue business Long term contracts supporting revenue stream No commodity ownership risk or hedging requirements Well maintained assets serving high growth markets Senior management team averages over 25 years of industry experience Disciplined growth
Slide 21: Holly Energy Partners, L.P. (HEP)
Holly Energy Partners, L.P. (HEP) Holly Energy Partners, L.P. (NYSE: HEP) 100 Crescent Court, Suite 1600 Dallas, Texas 75201 (214) 871-3555 David G. Blair, Senior Vice President Bruce R. Shaw, Senior VP-Chief Financial Officer M. Neale Hickerson, VP-Investor Relations
Slide 22: Appendix
Appendix
Slide 23: Acquisition History: Alon USA Transaction, February 2005
Acquisition History: Alon USA Transaction, February 2005 Alon USA pipeline & terminal acquisition : (February 2005) 4 refined products pipelines aggregating 500 miles 2 refined product terminals with 350,000 bbls of storage Refined product tank farm facility Purchase price: $120 million in cash & 93
Slide 24: Acquisition History: Holly Intermediate Pipelines, July 2005
Acquisition History: Holly Intermediate Pipelines, July 2005 Holly intermediate feedstock / product pipelines : (July 2005) Two 65-mile parallel pipelines which move intermediate feedstock from Holly's Lovington, NM facility to its Artesia, NM facility 84,000 bpd of throughput capacity Purchase pric
Slide 25: Acquisition of Holly Crude Oil & Product Transportation Assets, March 2008
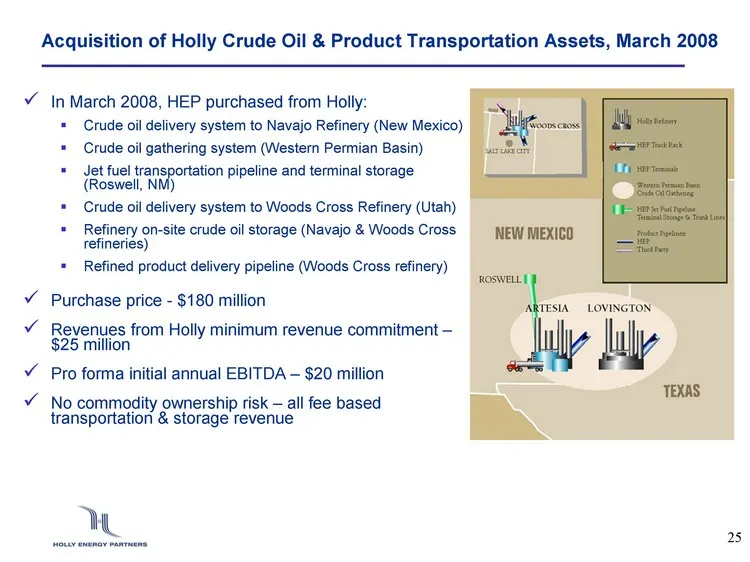
Acquisition of Holly Crude Oil & Product Transportation Assets, March 2008 In March 2008, HEP purchased from Holly: Crude oil delivery system to Navajo Refinery (New Mexico) Crude oil gathering system (Western Permian Basin) Jet fuel transportation pipeline and terminal storage (Roswell, NM) Crude o
Slide 26: Overview of Plains JV - Q1 2009
Overview of Plains JV - Q1 2009 Description: 95-mile intrastate pipeline being constructed by Plains All American Pipeline Replaces previous HEP Porcupine Ridge Pipeline project Location: Transports crude from Wyoming and Utah and the Utah Terminus of the Frontier Pipeline into the Salt Lake City ar
Slide 27: Overview of South System Expansion - Q1 2009
Overview of South System Expansion - Q1 2009 Description: Expand capacity of pipeline from Artesia, NM to EI Paso, TX to transport increased volumes from Navajo due to refinery expansion from 85,000 bpd to 100,000 bpd Provides additional refinery feedstock transport capability (up to 10,000 bpd) 85
Slide 28: Overview of Las Vegas Pipeline - Q1 2010
Overview of Las Vegas Pipeline - Q1 2010 Description: 75% interest in 400 mile refined products pipeline from Salt Lake City to Las Vegas with terminals in Cedar City, UT and Las Vegas, NV Holly entity owns through construction phase HEP has option to purchase Holly's ownership interest Sinclair is
Slide 29: Crude Delivery & Intermediate Pipeline Facilities - Q3 2009
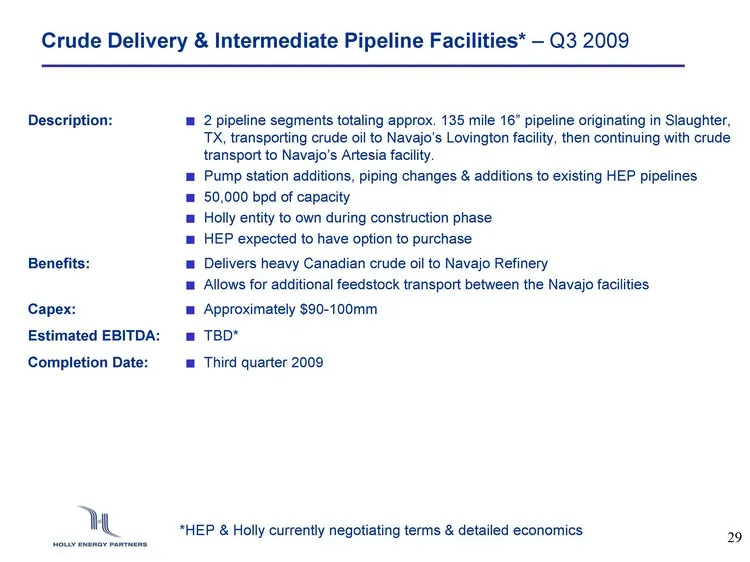
Crude Delivery & Intermediate Pipeline Facilities* - Q3 2009 Description: 2 pipeline segments totaling approx. 135 mile 16" pipeline originating in Slaughter, TX, transporting crude oil to Navajo's Lovington facility, then continuing with crude transport to Navajo's Artesia facility. Pump station ad
Slide 30: Minimum Commitments Overview-Deferred Revenue Classification
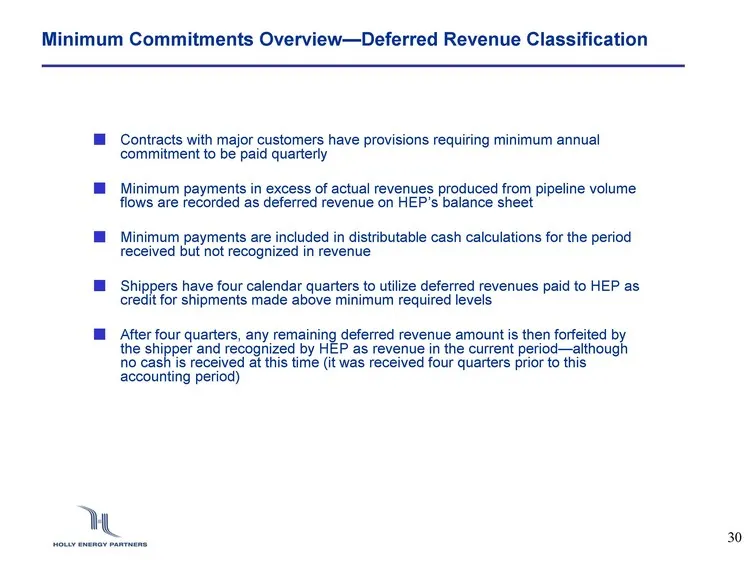
Minimum Commitments Overview-Deferred Revenue Classification Contracts with major customers have provisions requiring minimum annual commitment to be paid quarterly Minimum payments in excess of actual revenues produced from pipeline volume flows are recorded as deferred revenue on HEP's balance she
Slide 31: Holly Energy Partners, L.P. (HEP) Definitions
Holly Energy Partners, L.P. (HEP) BPD: Barrels per day EBITDA: Earnings before interest, taxes, depreciation and amortization which is calculated as net income plus (i) interest expense net of interest income and (ii) depreciation and amortization. EBITDA is not a calculation based upon U.S. general
Source: SEC EDGAR · 8-K filed Nov 20, 2008
More decks from Holly Energy Partners LP
 Investor Presentation (March 2023)20 slides · Mar 2, 2023
 Investor Presentation (August 2022)24 slides · Aug 16, 2022
 Investor Presentation (May 2022)23 slides · May 17, 2022
 Investor Presentation (March 2022)12 slides · Mar 22, 2022
 Investor Presentation (March 2022)18 slides · Mar 1, 2022
 Investor Presentation (December 2021)18 slides · Dec 9, 2021