NuStar Energy LP — Pipeline, MLP and Utility Symposium 2017 (Wells Fargo)
30 slides from NuStar Energy LP's conference presentation, Dec 6, 2017
Slide 1: Pipeline, MLP and Utility Symposium 2017 Wells Fargo
Pipeline, MLP and Utility Symposium 2017 Wells Fargo December 6, 2017 Exhibit 99.1
Slide 2: Forward-Looking Statements
Forward-Looking Statements 2 Statements contained in this presentation other than statements of historical fact are forward-looking statements. While these forward-looking statements, and any assumptions upon which they are based, are made in good faith and reflect our current judgment regarding the
Slide 3: NuStar Overview
= a NuStar Overview Se een Hy —— ee SS
Slide 4: Two Publicly Traded Companies
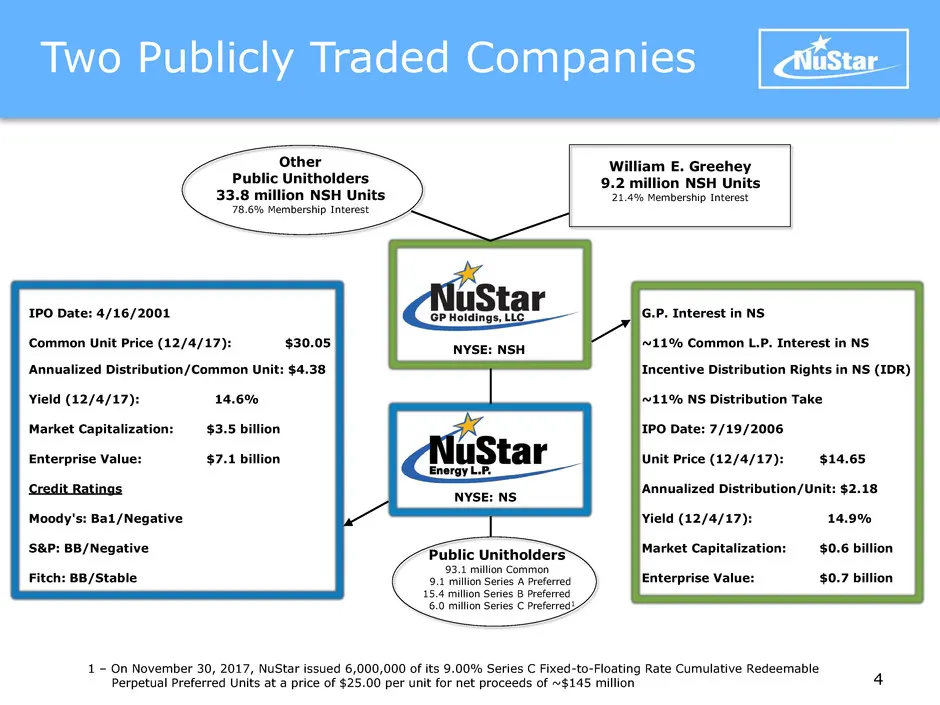
Two Publicly Traded Companies 4 1 – On November 30, 2017, NuStar issued 6,000,000 of its 9.00% Series C Fixed-to-Floating Rate Cumulative Redeemable Perpetual Preferred Units at a price of $25.00 per unit for net proceeds of ~$145 million IPO Date: 4/16/2001 G.P. Interest in NS Common Unit Price (12
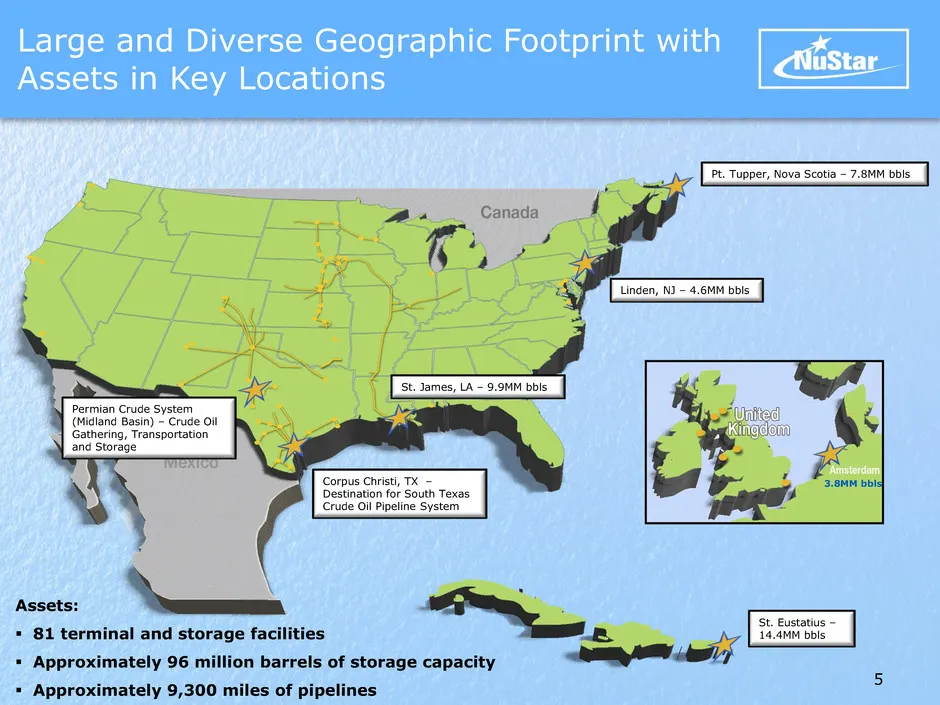
Slide 5: Large and Diverse Geographic Footprint with Assets in Key Locations
Assets: 81 terminal and storage facilities Approximately 96 million barrels of storage capacity Approximately 9,300 miles of pipelines Corpus Christi, TX – Destination for South Texas Crude Oil Pipeline System St. James, LA – 9.9MM bbls Pt. Tupper, Nova Scotia – 7.8MM bbls Linden, NJ – 4.6MM b
Slide 6: Focus Has Been on De-Risking the Business
Focus Has Been on De-Risking the Business
Slide 7: De-Risk the Business and put Ourselves in a Position to Grow
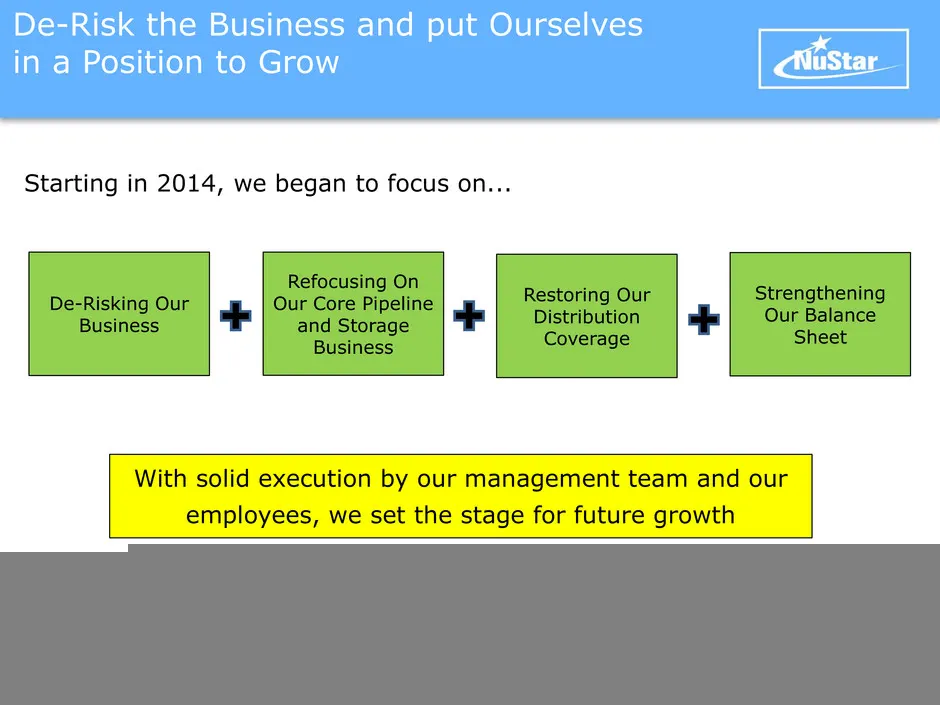
De-Risk the Business and put Ourselves in a Position to Grow 7 Starting in 2014, we began to focus on... Strengthening Our Balance Sheet Restoring Our Distribution Coverage De-Risking Our Business Refocusing On Our Core Pipeline and Storage Business With solid execution by our management team and ou
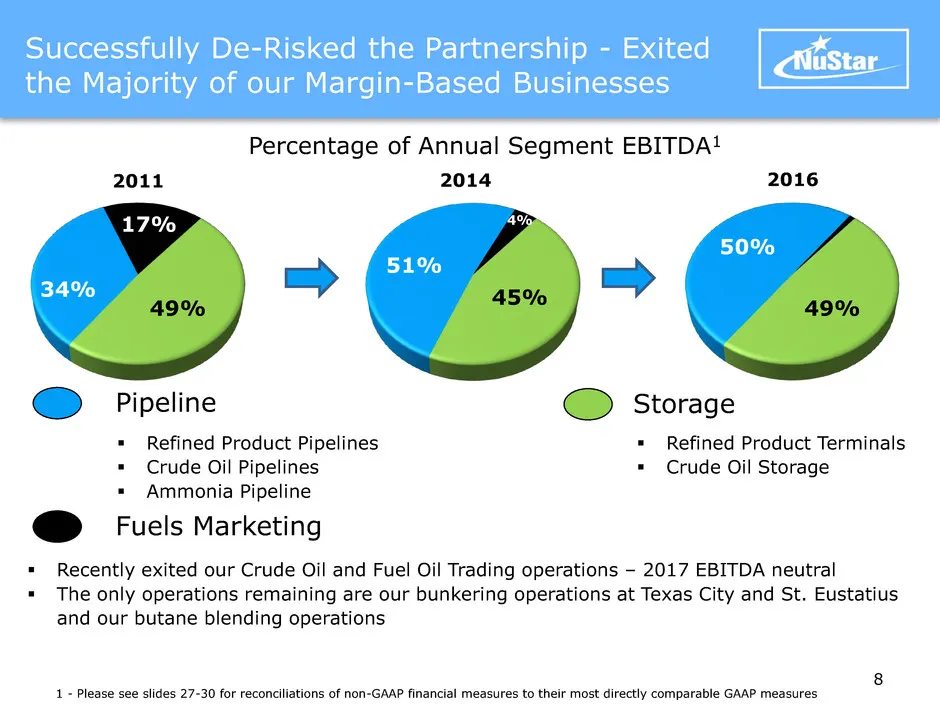
Slide 8: Successfully De-Risked the Partnership - Exited the Majority of our Margin-Based Businesses
Refined Product Pipelines Crude Oil Pipelines Ammonia Pipeline Refined Product Terminals Crude Oil Storage Fuels Marketing Recently exited our Crude Oil and Fuel Oil Trading operations – 2017 EBITDA neutral The only operations remaining are our bunkering operations at Texas City and St
Slide 9: Pipeline Segment – Committed and Diversified
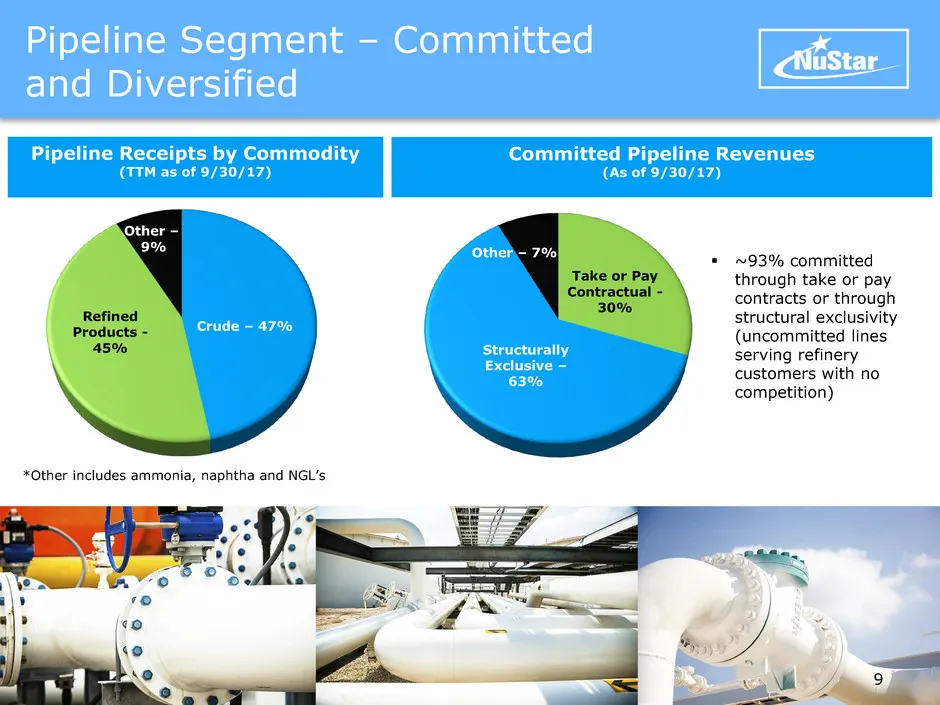
Take or Pay Contractual - 30% Structurally Exclusive – 63% Other – 7% Crude – 47% Refined Products - 45% Other – 9% Pipeline Segment – Committed and Diversified Pipeline Receipts by Commodity (TTM as of 9/30/17) *Other includes ammonia, naphtha and NGL’s ~93% committed through take or pay contract
Slide 10: Storage Segment – Effectively Full Storage Lease Utilization
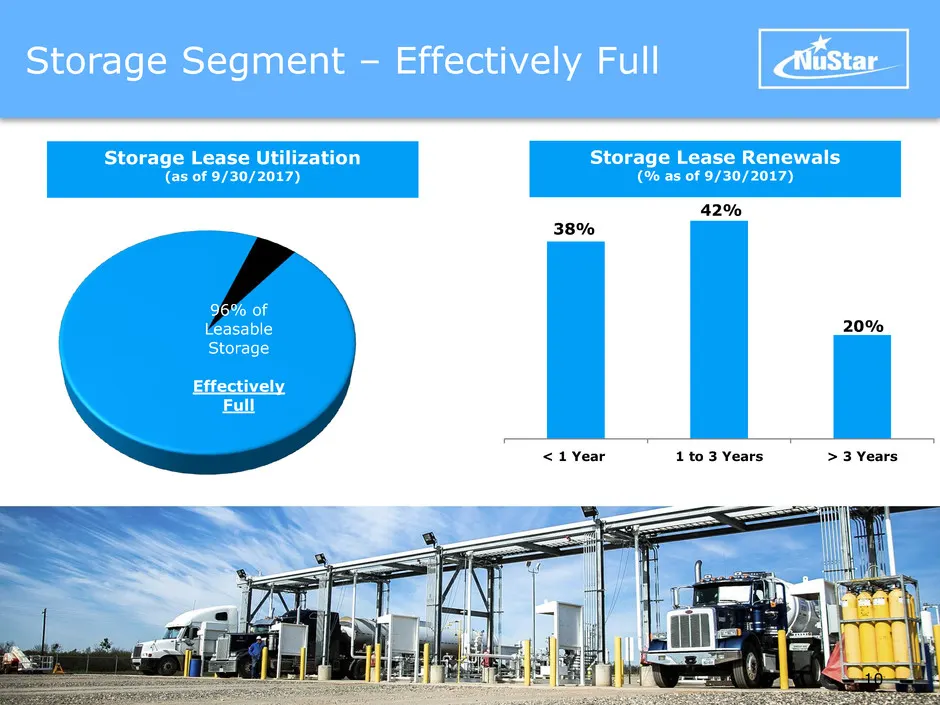
Storage Segment – Effectively Full Storage Lease Utilization (as of 9/30/2017) Storage Lease Renewals (% as of 9/30/2017) 96% of Leasable Storage Effectively Full 10 38% 42% 20% < 1 Year 1 to 3 Years > 3 Years
Slide 11: Base Business EBITDA – Consistent Performance in Various Market Conditions
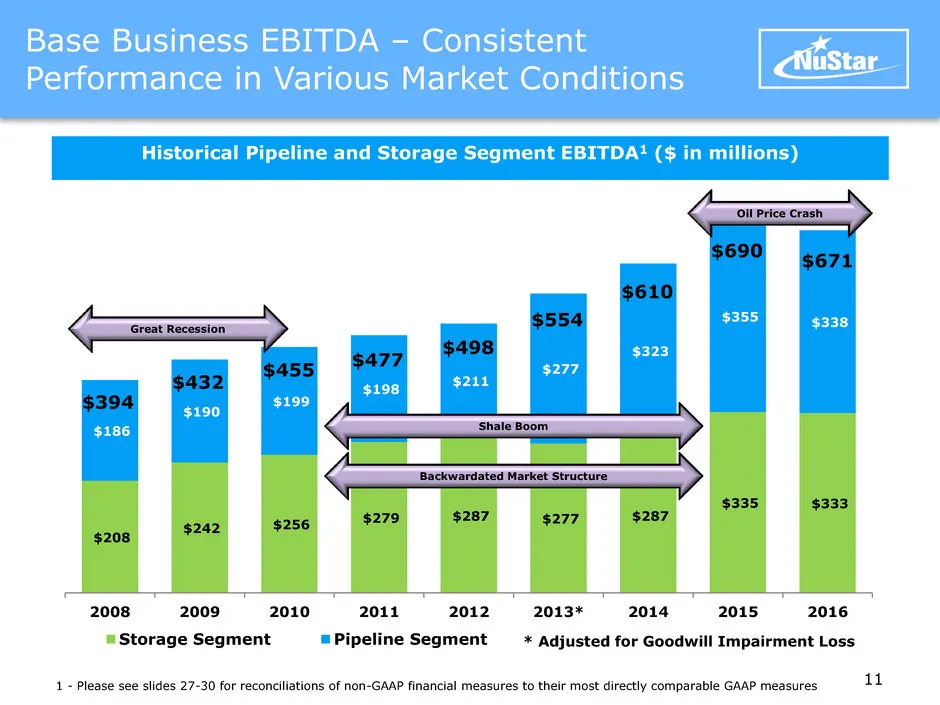
$208 $242 $256 $279 $287 $277 $287 $335 $333 $186 $190 $199 $198 $211 $277 $323 $355 $338 2008 2009 2010 2011 2012 2013* 2014 2015 2016 Storage Segment Pipeline Segment * Adjusted for Goodwill Impairment Loss $610 $394 $432 $455 $477 $498 $554 $690 $671 Historical Pipeline and Storage Segment EBITDA
Slide 12: Acquisition Overview Permian Crude System Overview
Acquisition Overview Permian Crude System Overview
Slide 13: Permian Crude System Overview
Permian Crude System Overview 13 On May 4, NuStar acquired the Permian Crude System from First Reserve Energy Infrastructure Fund for ~$1.5 billion in cash Our system is a leading crude oil gathering, transportation and storage system in the “core of the core” of the Midland Basin in the Permian
Slide 14: Our System is Located in the Center of the Permian Basin
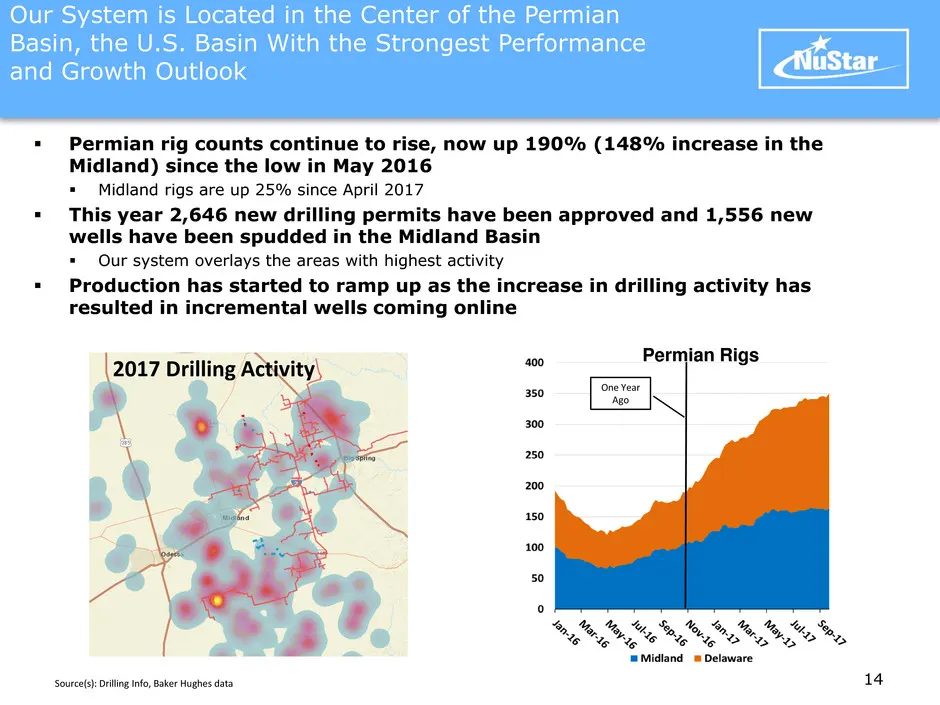
14 Our System is Located in the Center of the Permian Basin, the U.S. Basin With the Strongest Performance and Growth Outlook Permian rig counts continue to rise, now up 190% (148% increase in the Midland) since the low in May 2016 Midland rigs are up 25% since April 2017 This year 2,646 new d
Slide 15: Our Permian Crude System is in the Most Active Areas of the Midland
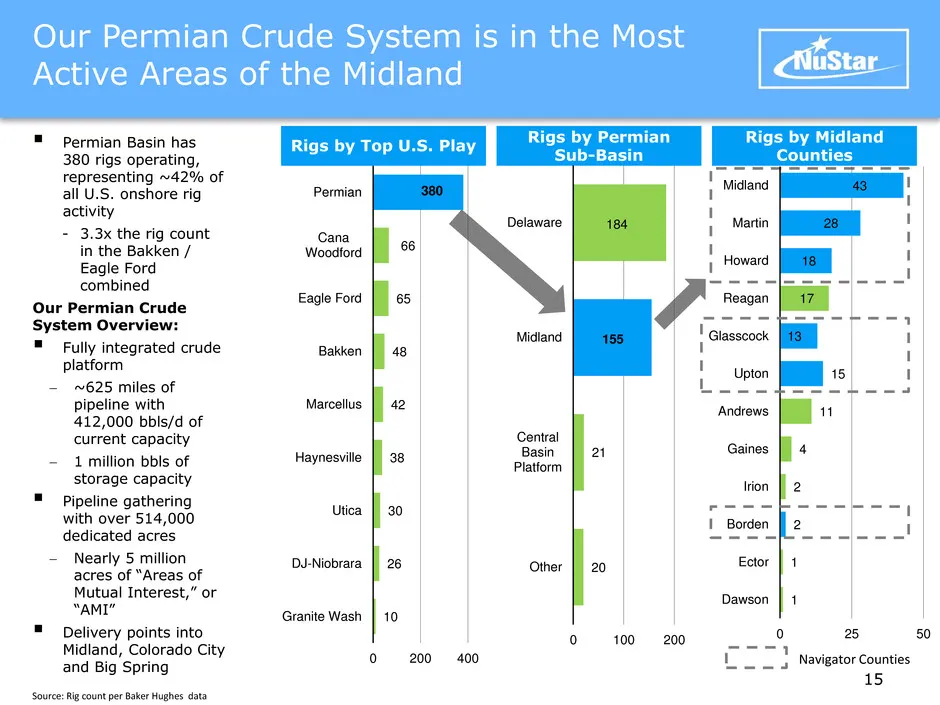
Our Permian Crude System is in the Most Active Areas of the Midland Permian Basin has 380 rigs operating, representing ~42% of all U.S. onshore rig activity - 3.3x the rig count in the Bakken / Eagle Ford combined Our Permian Crude System Overview: Fully integrated crude platform ~625 miles of
Slide 16: Our Permian Crude System is an Integrated Crude System
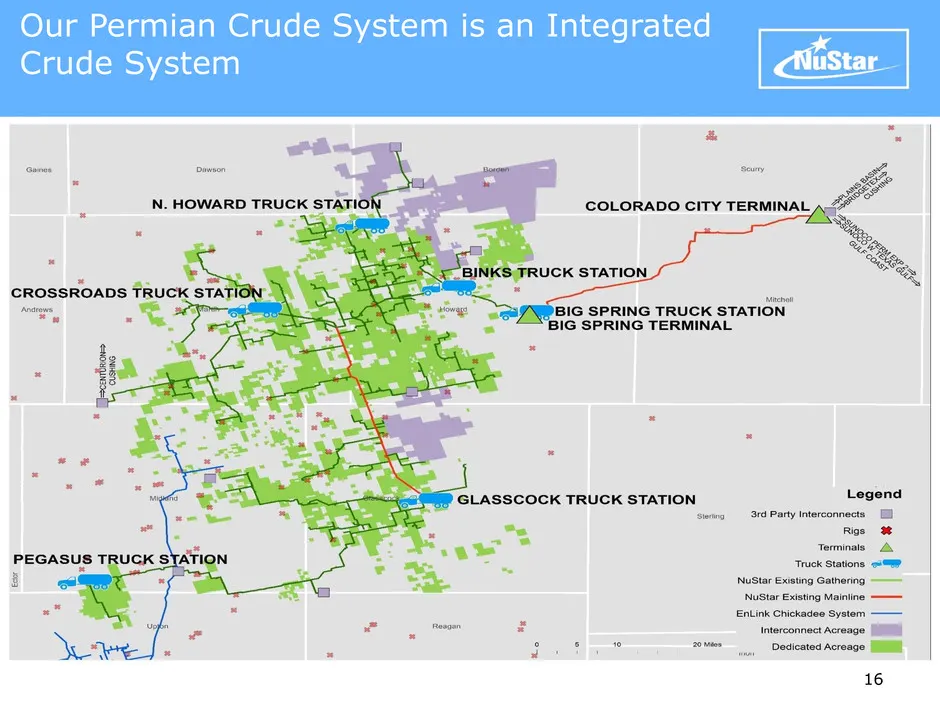
16 Our Permian Crude System is an Integrated Crude System
Slide 17: South Texas Crude Pipeline System
South Texas Crude Pipeline System
Slide 18: South Texas Crude Pipeline System: Eagle Ford Update
As expected, the Eagle Ford has seen a modest recovery, with rig counts up a significant 35 rigs from its low on July 29, 2016 (Source: Baker Hughes) Even with this recovery, pipeline capacity in the Eagle Ford currently exceeds production and production is below aggregate minimum volume commitm
Slide 19: Finance Update
Finance Update
Slide 20: Internal Growth Spending Expected to be $360 to $380 Million in 2017
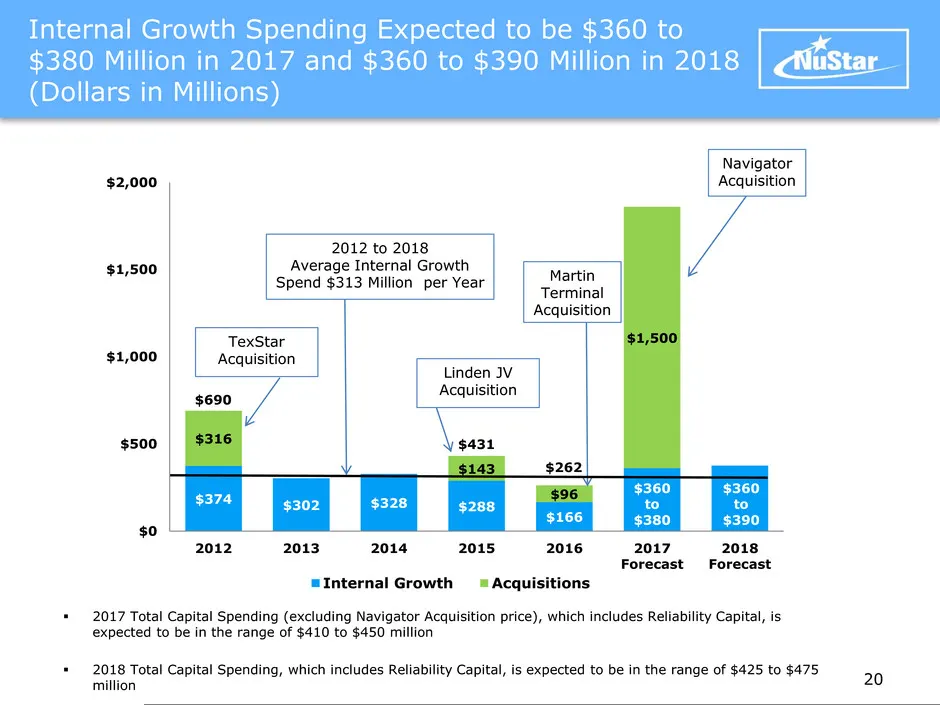
$374 $302 $328 $288 $166 $360 to $380 $360 to $390 $316 $143 $96 $1,500 $0 $500 $1,000 $1,500 $2,000 2012 2013 2014 2015 2016 2017 Forecast 2018 Forecast Internal Growth Acquisitions $262 TexStar Acquisition Internal Growth Spending Expected to be $360 to $380 Million in 2017 and $360 to $390 Millio
Slide 21: Growth Projects – Currently Evaluating $1.0 to $1.5 Billion
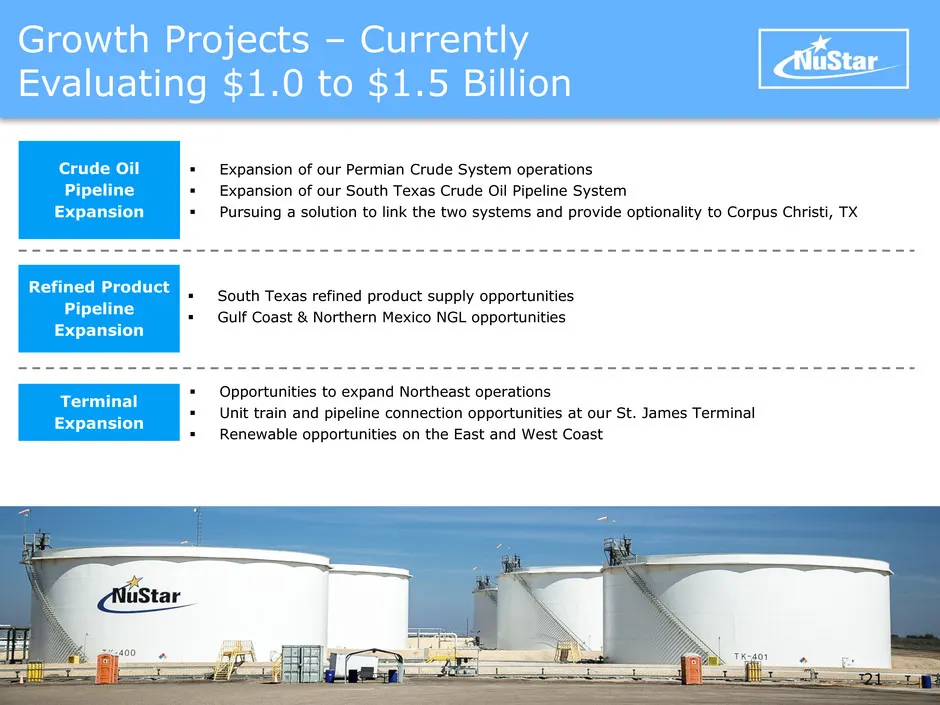
Expansion of our Permian Crude System operations Expansion of our South Texas Crude Oil Pipeline System Pursuing a solution to link the two systems and provide optionality to Corpus Christi, TX Crude Oil Pipeline Expansion South Texas refined product supply opportunities Gulf Coast & North
Slide 22: Just $350 Million of Debt Maturing Before 2020
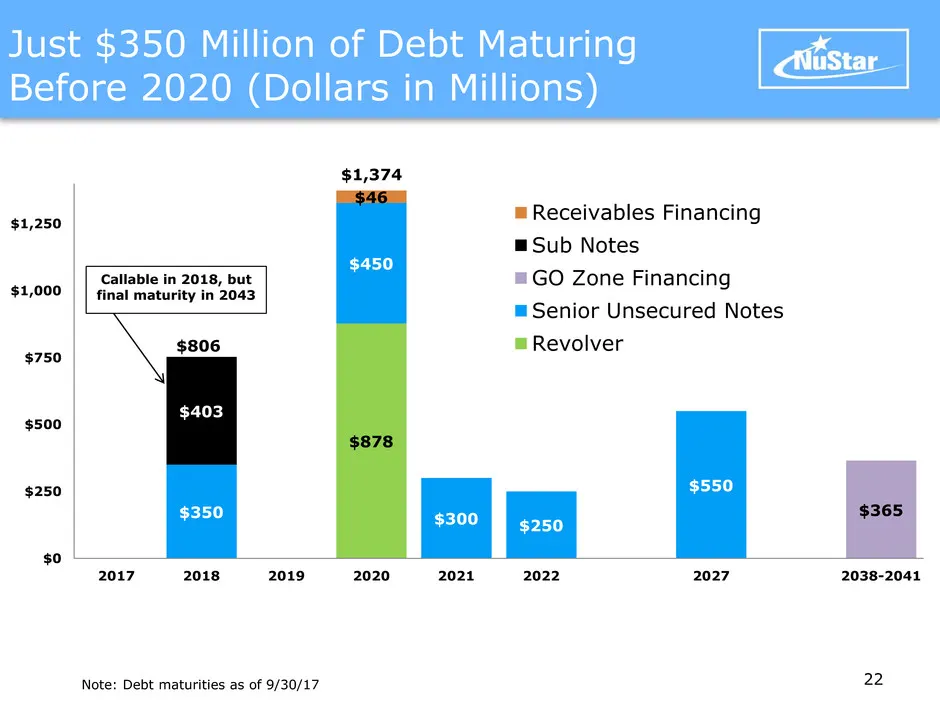
$878 $350 $450 $300 $250 $550 $365 $403 $46 $0 $250 $500 $750 $1,000 $1,250 2017 2018 2019 2020 2021 2022 2027 2038-2041 Receivables Financing Sub Notes GO Zone Financing Senior Unsecured Notes Revolver$806 $1,374 Just $350 Million of Debt Maturing Before 2020 (Dollars in Millions) Callable in 2018,
Slide 23: 2017 & 2018 Guidance Summary
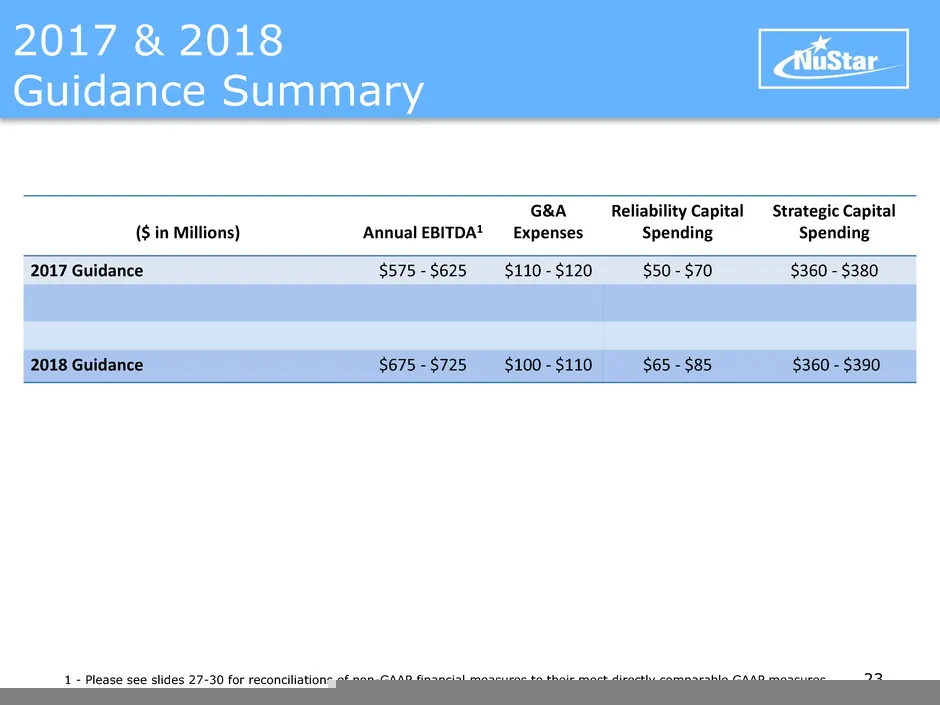
2017 & 2018 Guidance Summary ($ in Millions) Annual EBITDA1 G&A Expenses Reliability Capital Spending Strategic Capital Spending 2017 Guidance $575 - $625 $110 - $120 $50 - $70 $360 - $380 2018 Guidance $675 - $725 $100 - $110 $65 - $85 $360 - $390 1 - Please see slides 27-30 for reconciliations of

Slide 24: Appendix
Appendix
Slide 25: Capital Structure
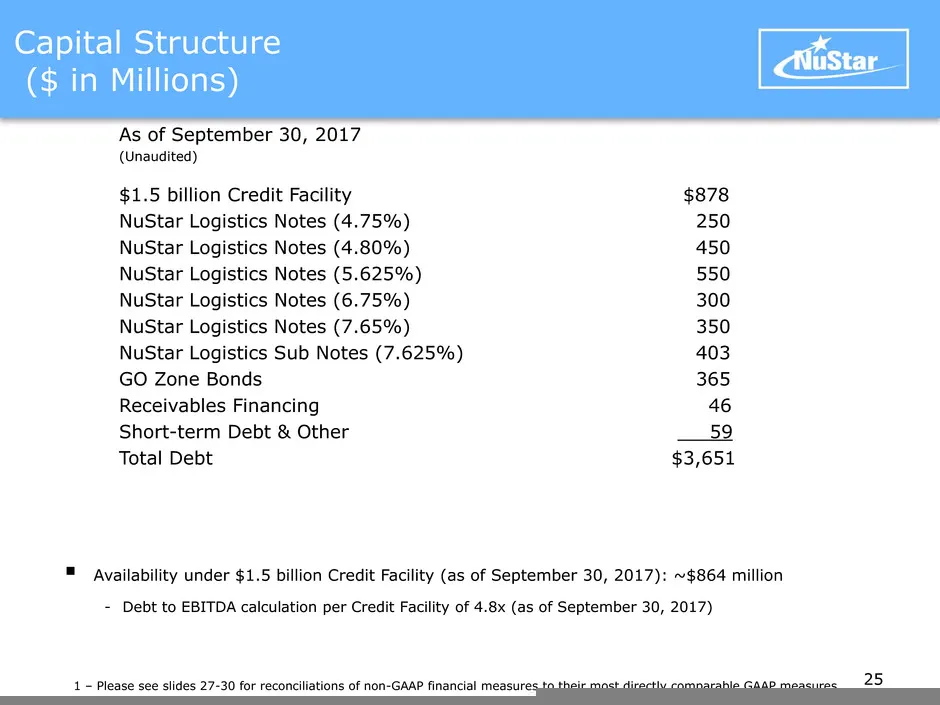
Capital Structure ($ in Millions) As of September 30, 2017 (Unaudited) $1.5 billion Credit Facility $878 NuStar Logistics Notes (4.75%) 250 NuStar Logistics Notes (4.80%) 450 NuStar Logistics Notes (5.625%) 550 NuStar Logistics Notes (6.75%) 300 NuStar Logistics Notes (7.65%) 350 NuStar Logistics Su
Slide 26: Capital Structure (continued)
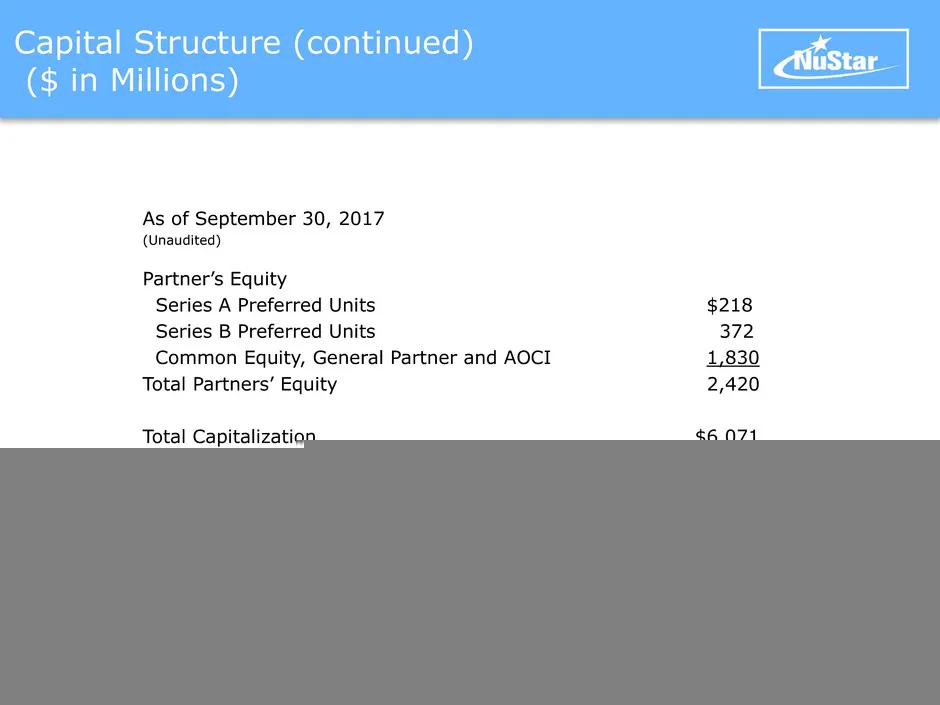
Capital Structure (continued) ($ in Millions) As of September 30, 2017 (Unaudited) Partner’s Equity Series A Preferred Units $218 Series B Preferred Units 372 Common Equity, General Partner and AOCI 1,830 Total Partners’ Equity 2,420 Total Capitalization $6,071 26
Slide 27: Reconciliation of Non-GAAP Financial Information
Reconciliation of Non-GAAP Financial Information 27 NuStar Energy L.P. utilizes financial measures, such as earnings before interest, taxes, depreciation and amortization (EBITDA), distributable cash flow (DCF) and distribution coverage ratio, which are not defined in U.S. generally accepted account
Slide 28: Reconciliation of Non-GAAP Financial Information (continued)
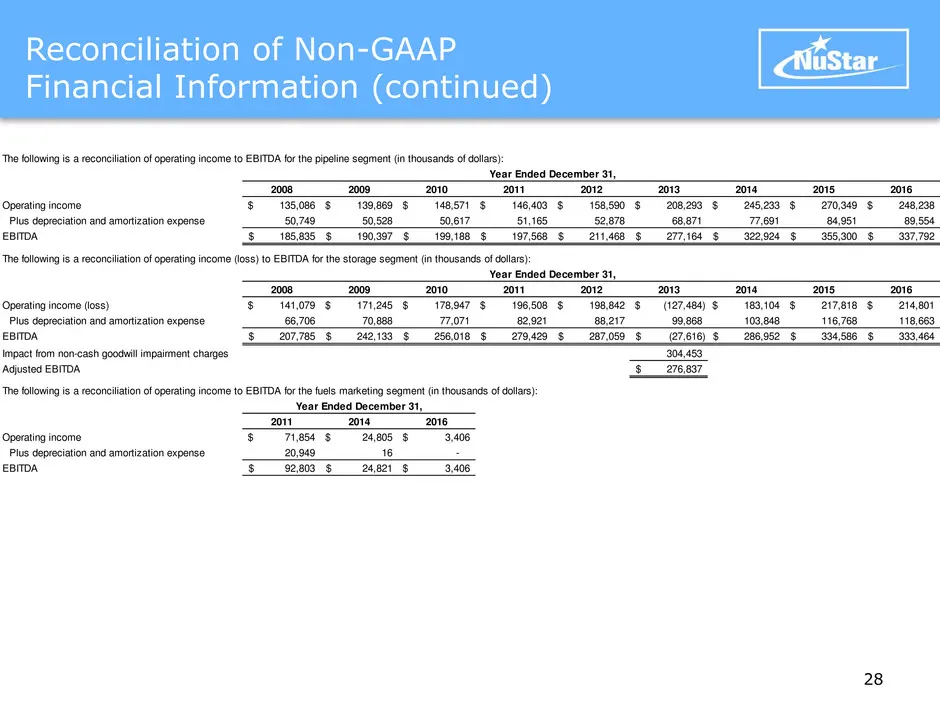
Reconciliation of Non-GAAP Financial Information (continued) 28 2008 2009 2010 2011 2012 2013 2014 2015 2016 Operating income 135,086$ 139,869$ 148,571$ 146,403$ 158,590$ 208,293$ 245,233$ 270,349$ 248,238$ Plus depreciation and amortization expense 50,749 50,528 50,617 51,165 52,878 68,871 77,691 8
Slide 29: Reconciliation of Non-GAAP Financial Information (continued)
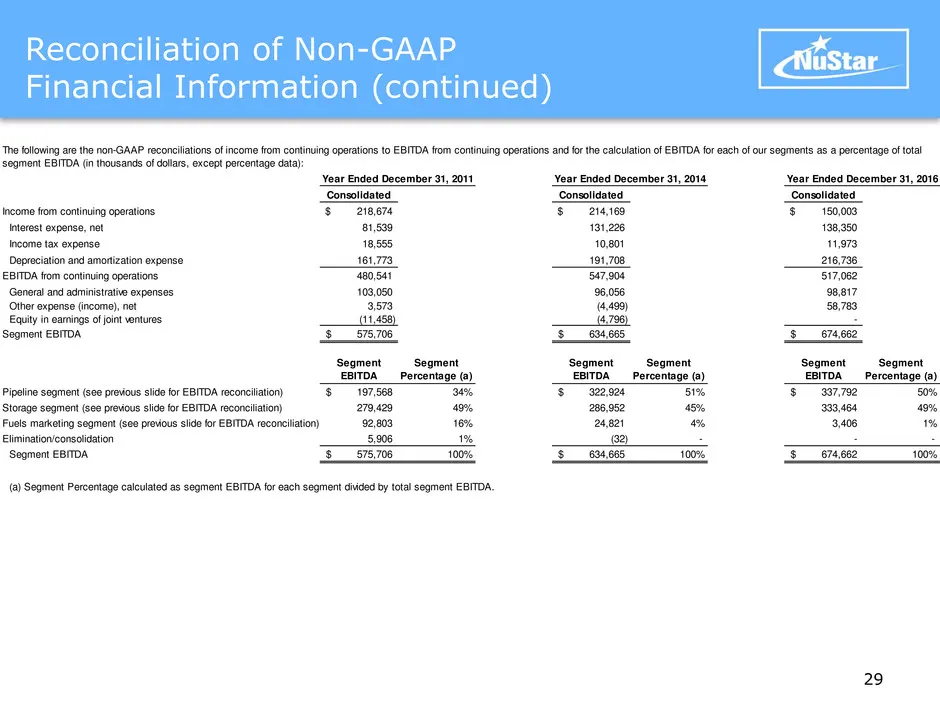
Reconciliation of Non-GAAP Financial Information (continued) 29 Consolidated Consolidated Consolidated Income from continuing operations 218,674$ 214,169$ 150,003$ Interest expense, net 81,539 131,226 138,350 Income tax expense 18,555 10,801 11,973 Depreciation and amortization expense 161,773 191,7
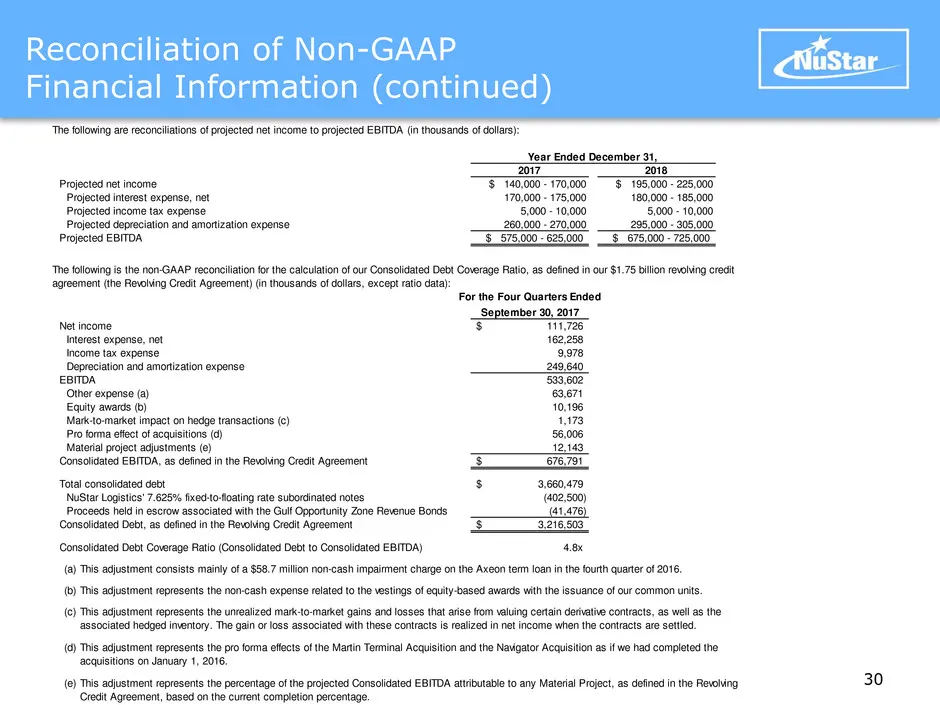
Slide 30: Reconciliation of Non-GAAP Financial Information (continued)
Reconciliation of Non-GAAP Financial Information (continued) 30 The following are reconciliations of projected net income to projected EBITDA (in thousands of dollars): 2017 2018 Projected net income $ 140,000 - 170,000 $ 195,000 - 225,000 Projected interest expense, net 170,000 - 175,000 180,000 -
Source: SEC EDGAR · 8-K filed Dec 6, 2017
More decks from NuStar Energy LP
 Merger or Acquisition (January 2024)14 slides · Jan 22, 2024
 Investor Presentation (December 2023)35 slides · Dec 5, 2023
 Raymond James Virtual Energy Supply Chain Conference 2023; Pickering Energy Partners TE&MF36 slides · Sep 19, 2023
 Barclays CEO Energy-Power Conference 202336 slides · Sep 6, 2023
 Citi One-on-One Midstream/Energy Infrastructure Conference 202336 slides · Aug 22, 2023
 8th Annual J.P. Morgan Energy, Power & Renewables Conference 202336 slides · Jun 21, 2023