Discover Financial Services — William Blair 37th Annual Growth Stock Conference (June 2017)
22 slides from Discover Financial Services's conference presentation, Jun 15, 2017

Slide 1: William Blair 37th Annual Growth Stock Conference
William Blair 37th Annual Growth Stock Conference David Nelms Chairman & Chief Executive Officer June 15, 2017 ©2017 DISCOVER FINANCIAL SERVICES Exhibit 99.1
Slide 2: Notice
Notice The following slides are part of a presentation by Discover Financial Services (the "Company") and are intended to be viewed as part of that presentation. No representation is made that the information in these slides is complete. This presentation is available on the Company’s website (www.d
Slide 3: Franchise Overview – Positioned as the leading U.S. direct bank & payments partner
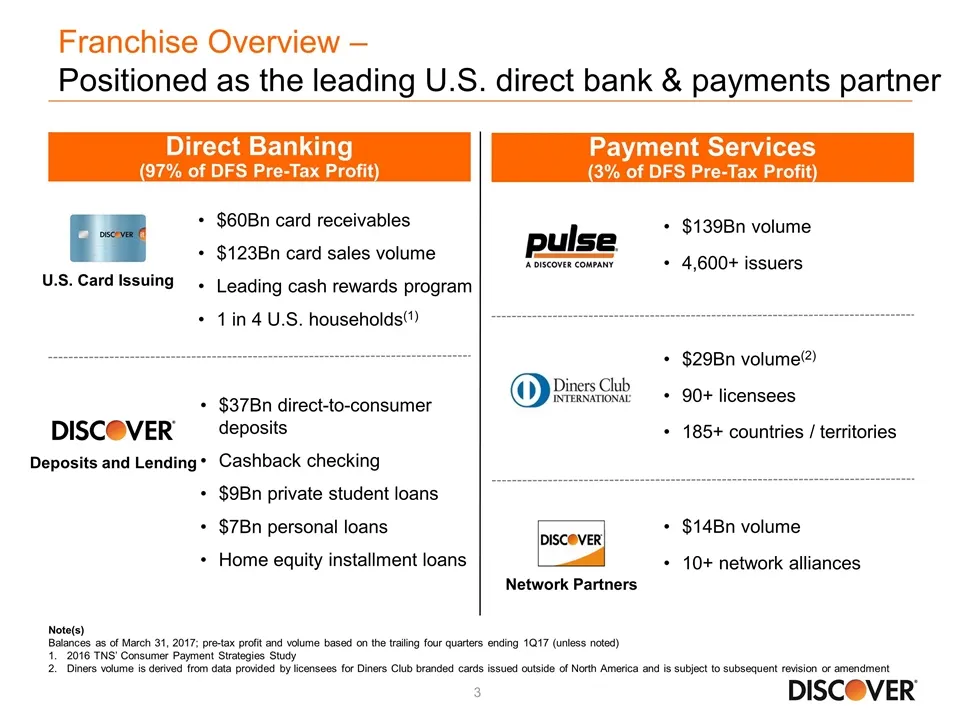
Franchise Overview – Positioned as the leading U.S. direct bank & payments partner Note(s) Balances as of March 31, 2017; pre-tax profit and volume based on the trailing four quarters ending 1Q17 (unless noted) 2016 TNS’ Consumer Payment Strategies Study Diners volume is derived from data provided b
Slide 4: Franchise Overview – Vision, strategic objectives and goal
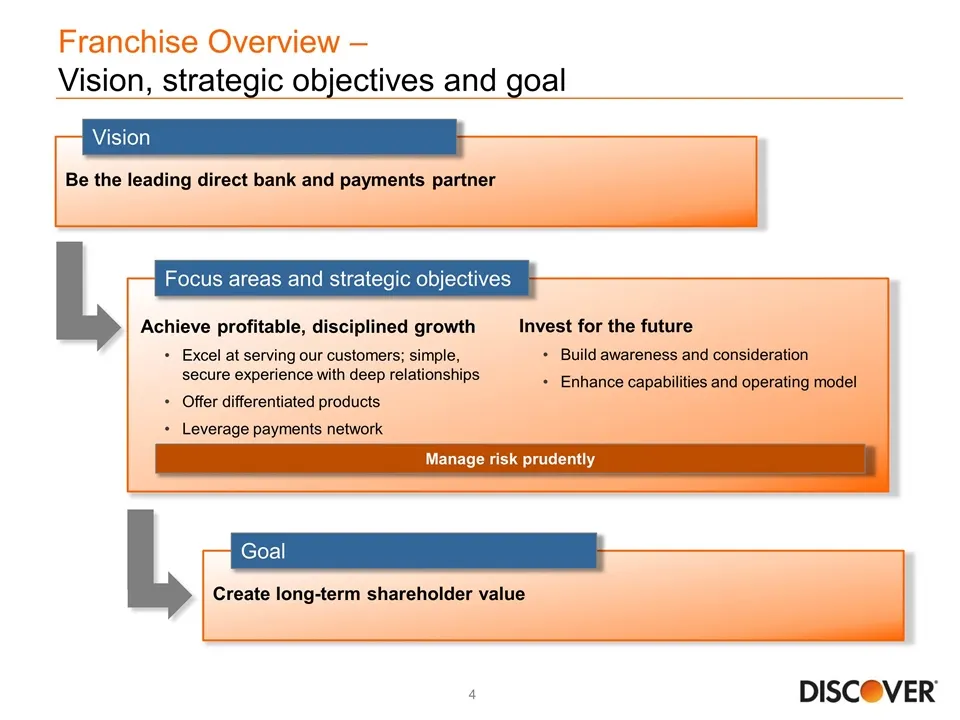
Be the leading direct bank and payments partner Franchise Overview – Vision, strategic objectives and goal Vision Create long-term shareholder value Goal Focus areas and strategic objectives Invest for the future Build awareness and consideration Enhance capabilities and operating model Achieve prof
Slide 5: Franchise Overview – Business model has expanded and diversified
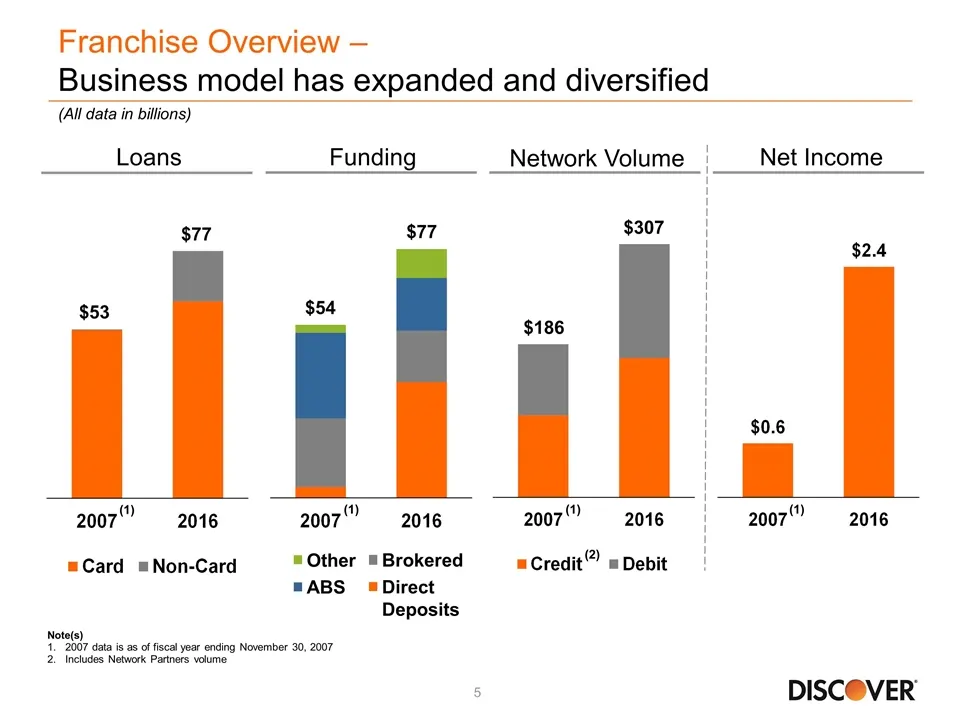
Franchise Overview – Business model has expanded and diversified Loans Funding Network Volume Other ABS Brokered Direct Deposits Note(s) 2007 data is as of fiscal year ending November 30, 2007 Includes Network Partners volume Net Income (All data in billions) $53 $77 $54 $77 $186 $307 (2) (1) (1) (1
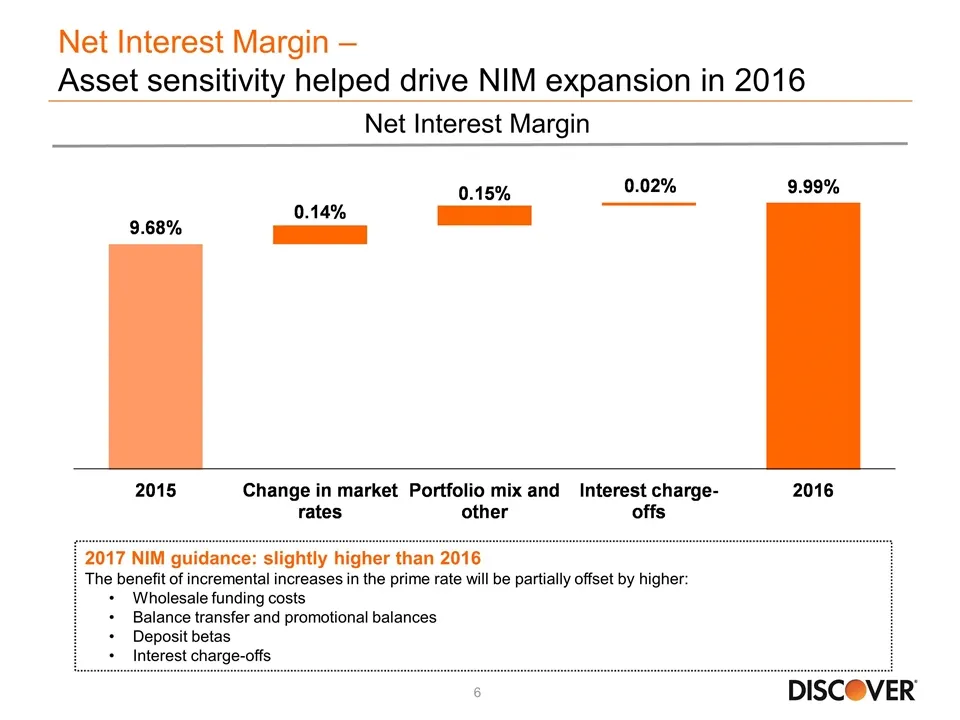
Slide 6: Net Interest Margin – Asset sensitivity helped drive NIM expansion in 2016
Net Interest Margin – Asset sensitivity helped drive NIM expansion in 2016 Net Interest Margin 2017 NIM guidance: slightly higher than 2016 The benefit of incremental increases in the prime rate will be partially offset by higher: Wholesale funding costs Balance transfer and promotional balances Dep
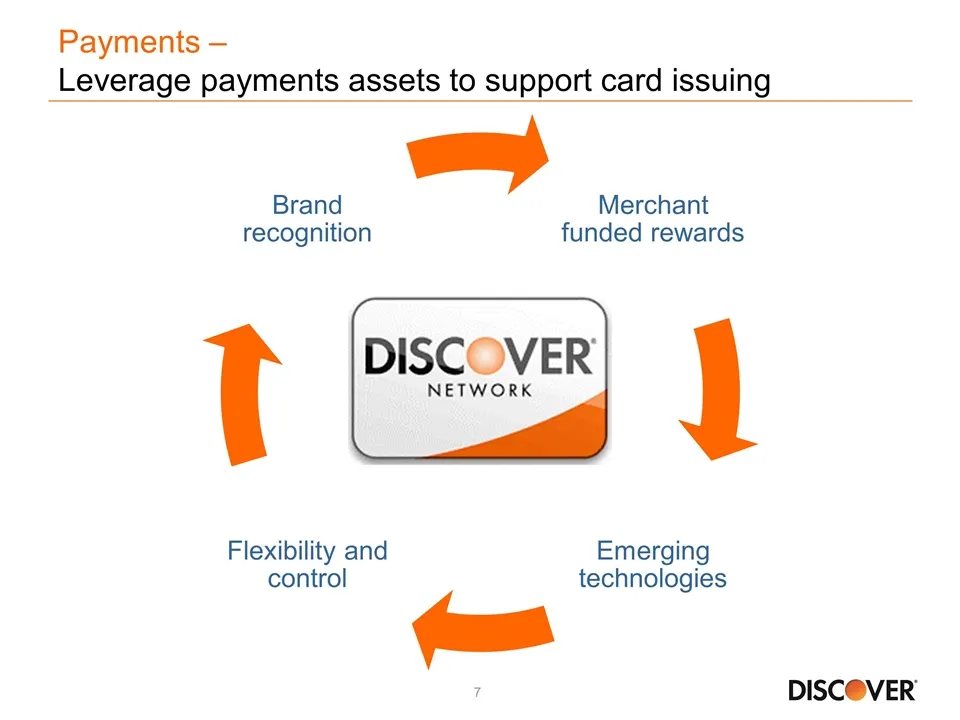
Slide 7: Payments – Leverage payments assets to support card issuing
Payments – Leverage payments assets to support card issuing Merchant funded rewards Emerging technologies Flexibility and control Brand recognition
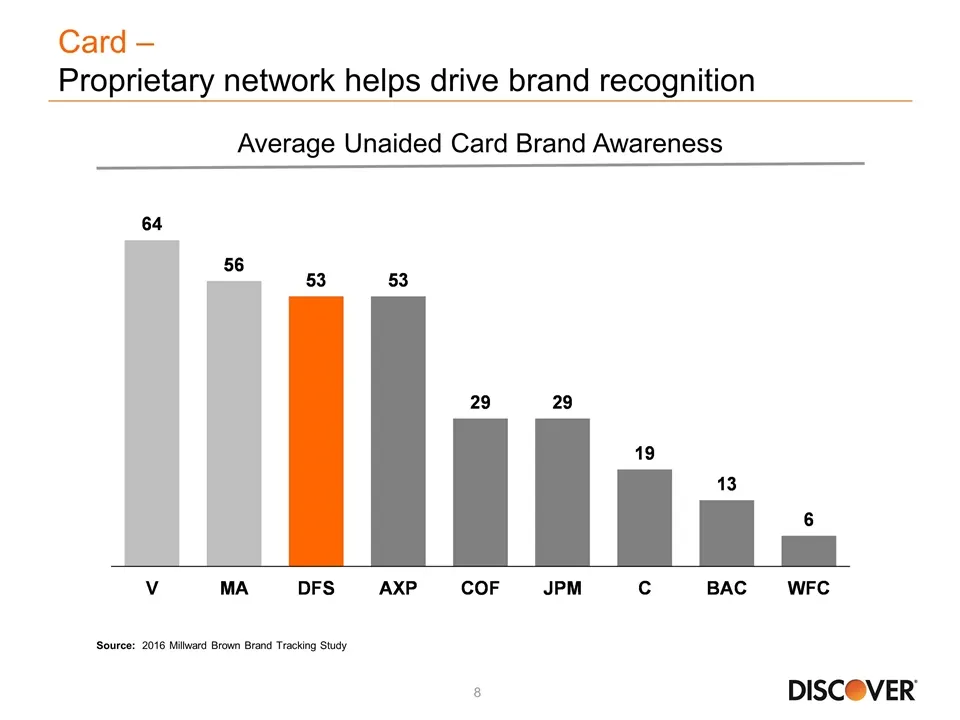
Slide 8: Proprietary network helps drive brand recognition
Card – Proprietary network helps drive brand recognition Source: 2016 Millward Brown Brand Tracking Study Average Unaided Card Brand Awareness
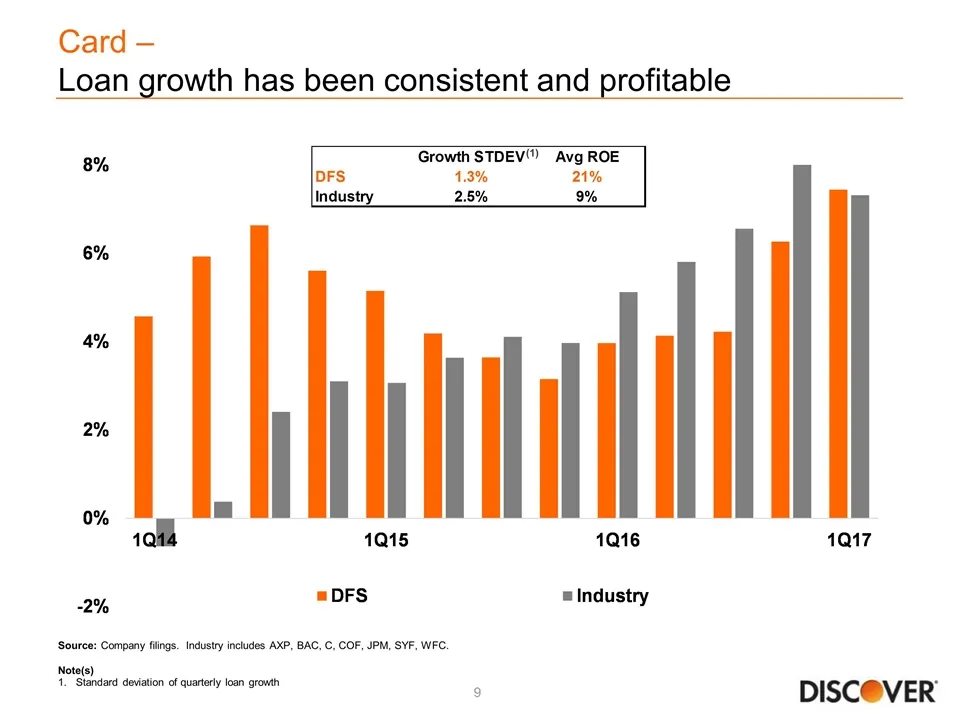
Slide 9: Loan growth has been consistent and profitable
Card – Loan growth has been consistent and profitable Source: Company filings. Industry includes AXP, BAC, C, COF, JPM, SYF, WFC. Note(s) Standard deviation of quarterly loan growth (1)
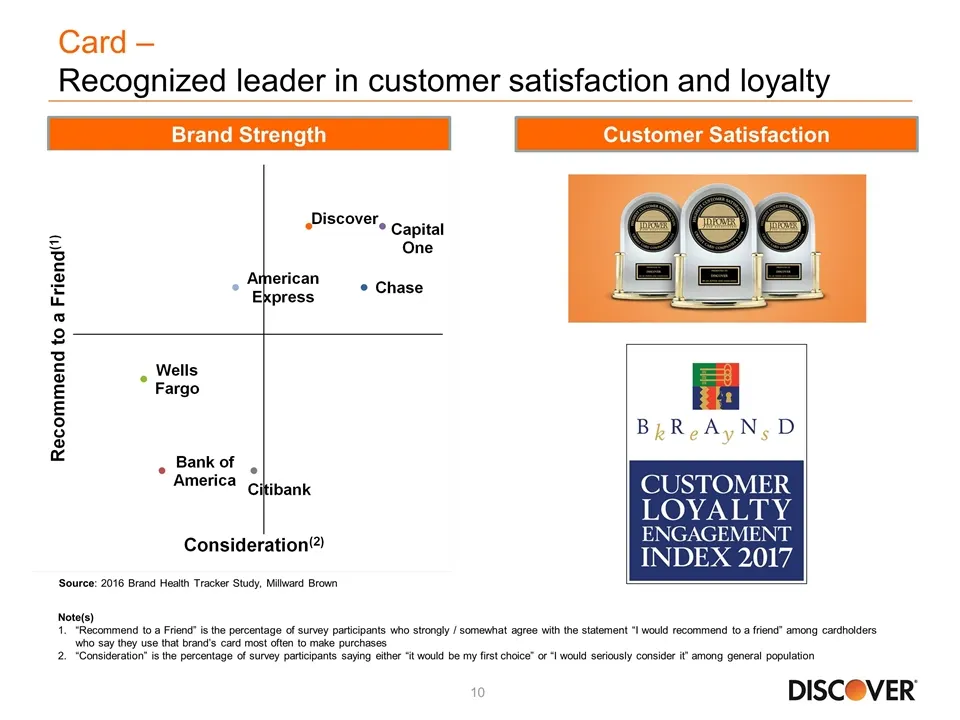
Slide 10: Recognized leader in customer satisfaction and loyalty
Card – Recognized leader in customer satisfaction and loyalty Note(s) “Recommend to a Friend” is the percentage of survey participants who strongly / somewhat agree with the statement “I would recommend to a friend” among cardholders who say they use that brand’s card most often to make purchases “C
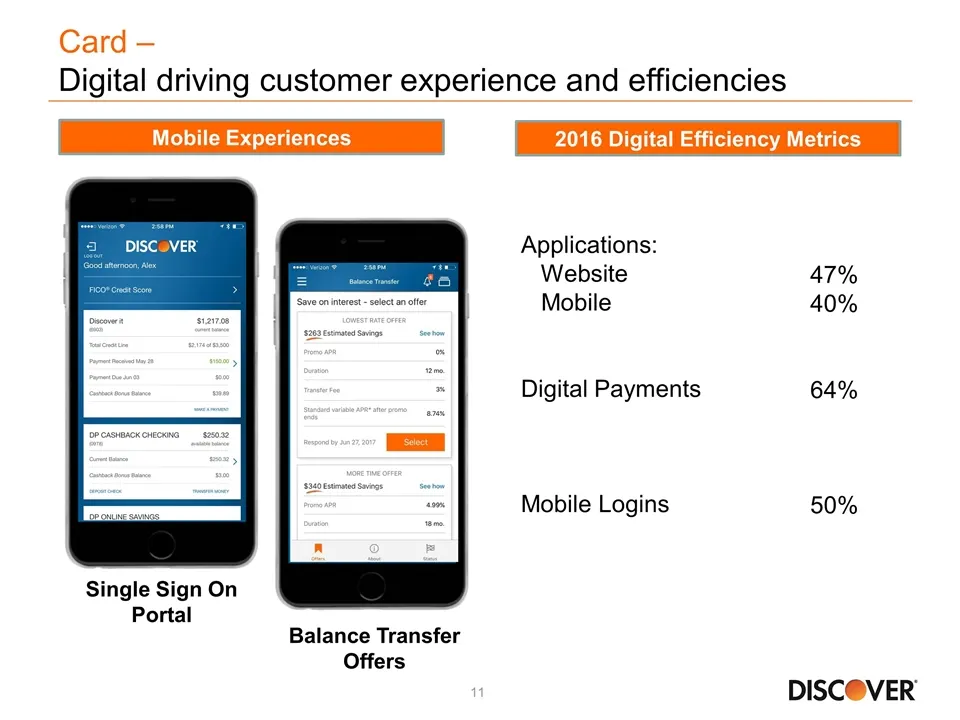
Slide 11: Digital driving customer experience and efficiencies
Card – Digital driving customer experience and efficiencies Applications: Website Mobile Digital Payments Mobile Logins 47% 40% 64% 50% Balance Transfer Offers Single Sign On Portal Mobile Experiences 2016 Digital Efficiency Metrics
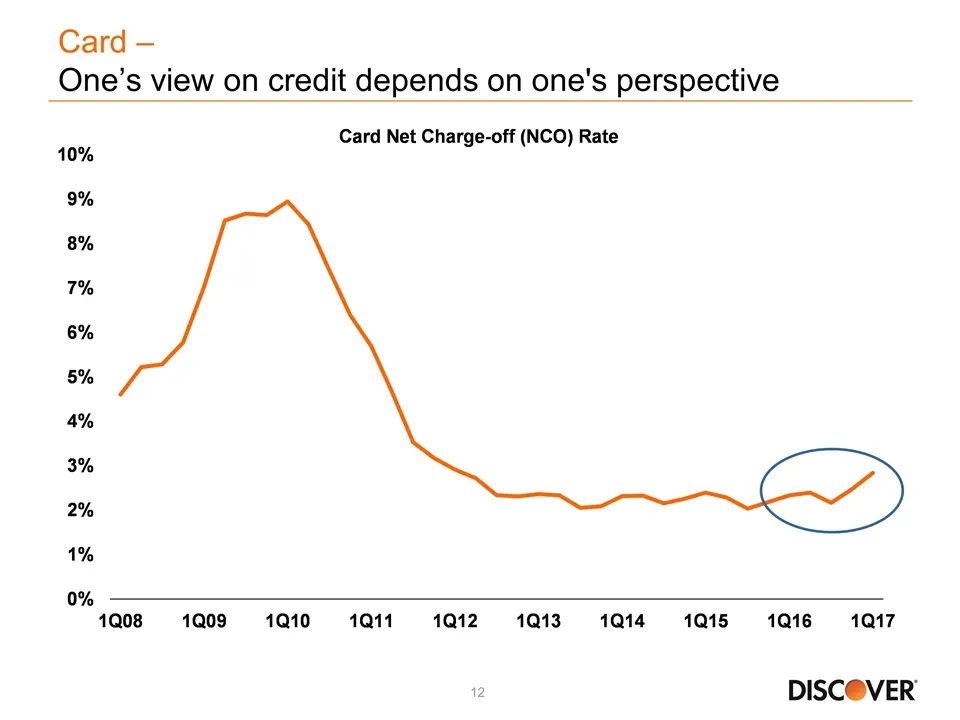
Slide 12: One's view on credit depends on one's perspective
Card – One’s view on credit depends on one's perspective
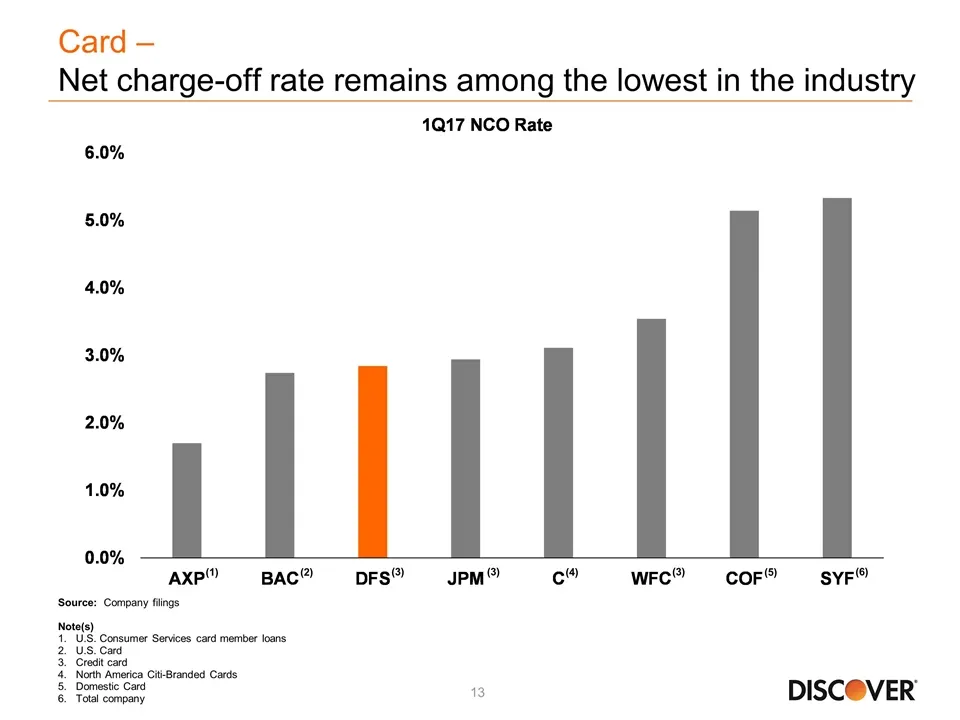
Slide 13: Net charge-off rate remains among the lowest in the industry
Card – Net charge-off rate remains among the lowest in the industry Source: Company filings Note(s) U.S. Consumer Services card member loans U.S. Card Credit card North America Citi-Branded Cards Domestic Card Total company (1) (2) (4) (5) (6) (3) (3) (3)
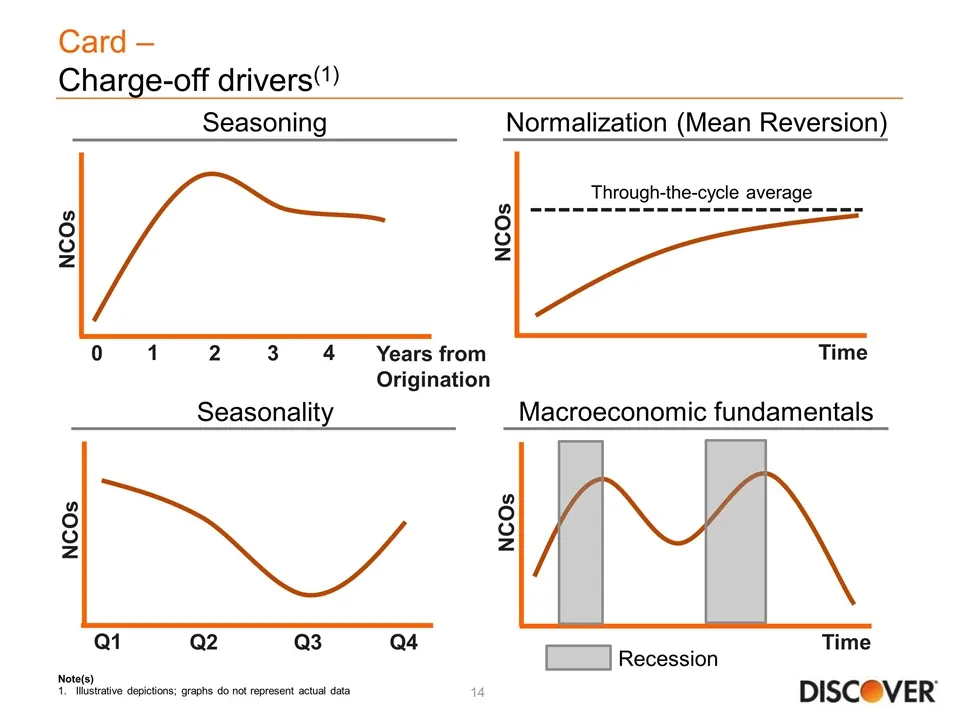
Slide 14: Charge-off drivers
Card – Charge-off drivers(1) Seasonality Seasoning Normalization (Mean Reversion) Macroeconomic fundamentals NCOs NCOs Through-the-cycle average Time Time Recession 1 2 3 0 NCOs Years from Origination 4 Q1 Q2 Q3 Q4 NCOs Note(s) Illustrative depictions; graphs do not represent actual data
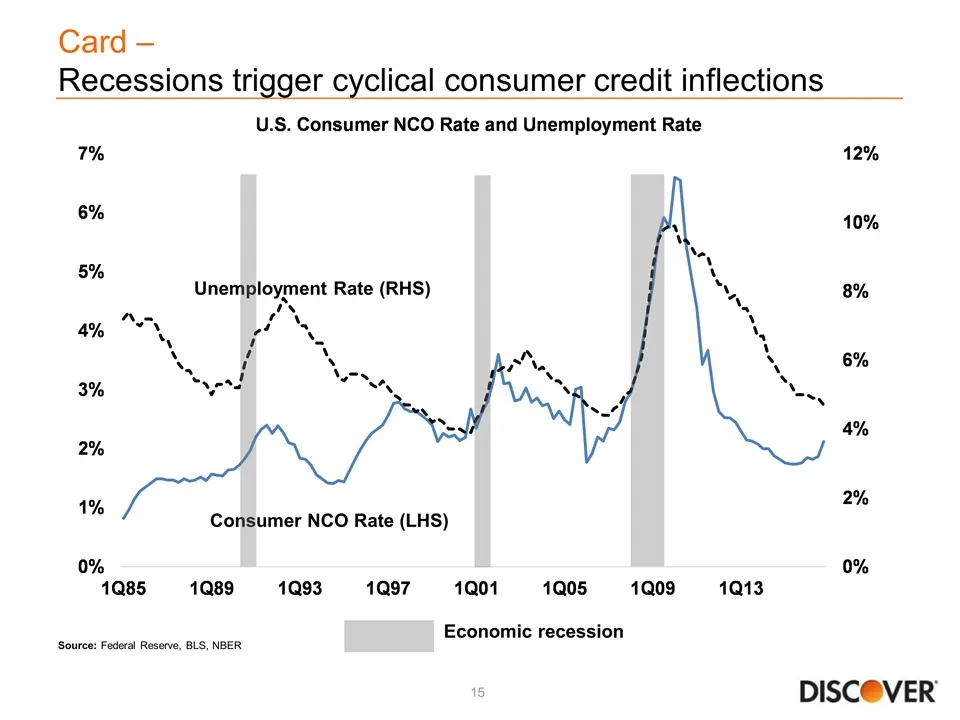
Slide 15: Recessions trigger cyclical consumer credit inflections
Card – Recessions trigger cyclical consumer credit inflections Consumer NCO Rate (LHS) Unemployment Rate (RHS) Economic recession Source: Federal Reserve, BLS, NBER
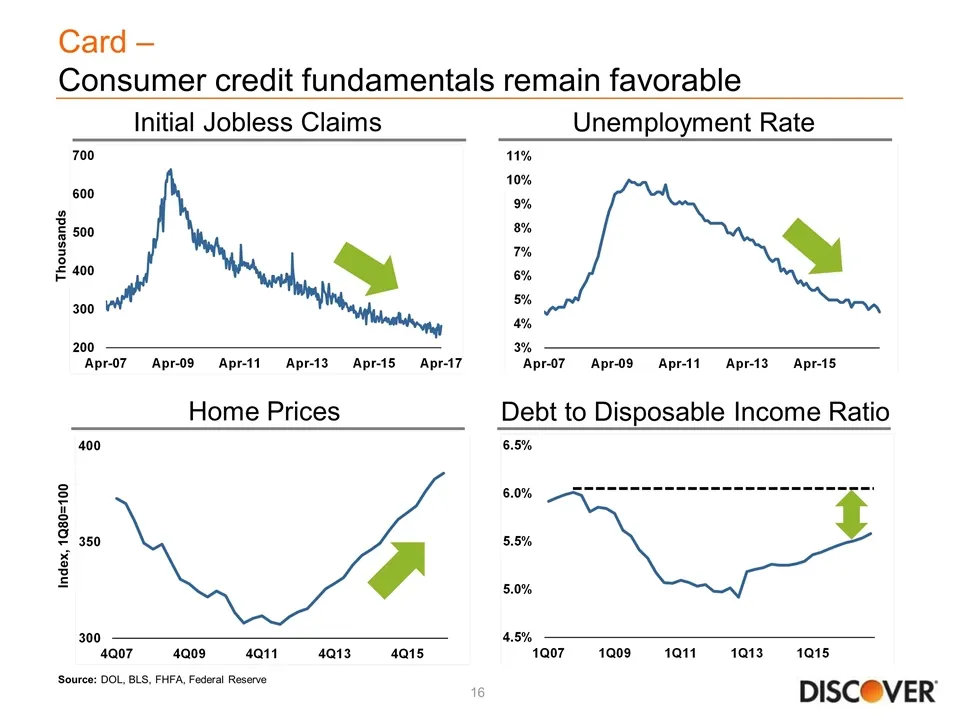
Slide 16: Consumer credit fundamentals remain favorable
Card – Consumer credit fundamentals remain favorable Initial Jobless Claims Unemployment Rate Home Prices Debt to Disposable Income Ratio Source: DOL, BLS, FHFA, Federal Reserve Index, 1Q80=100 Thousands
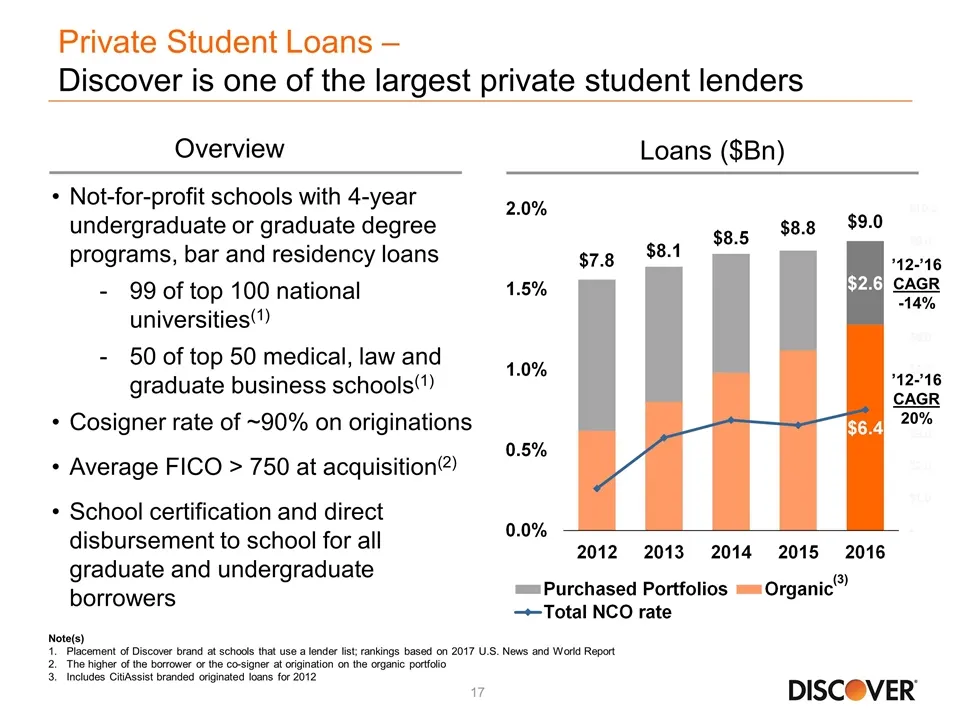
Slide 17: Private Student Loans – Discover is one of the largest private student lenders
Private Student Loans – Discover is one of the largest private student lenders Overview Not-for-profit schools with 4-year undergraduate or graduate degree programs, bar and residency loans 99 of top 100 national universities(1) 50 of top 50 medical, law and graduate business schools(1) Cosigner rat
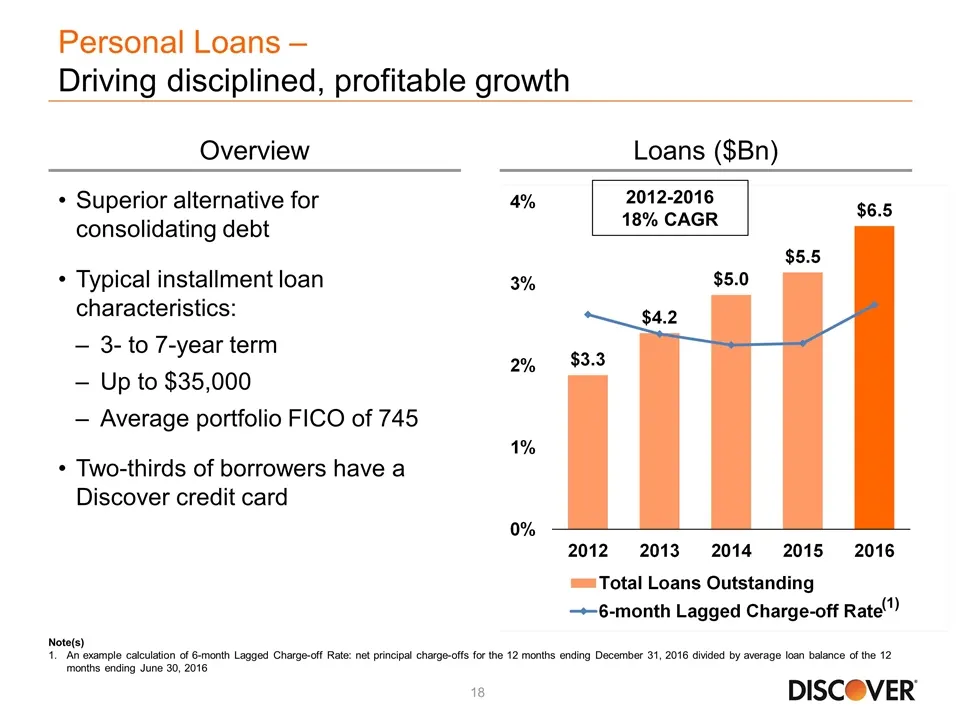
Slide 18: Personal Loans – Driving disciplined, profitable growth
Personal Loans – Driving disciplined, profitable growth Overview Loans ($Bn) Superior alternative for consolidating debt Typical installment loan characteristics: 3- to 7-year term Up to $35,000 Average portfolio FICO of 745 Two-thirds of borrowers have a Discover credit card 2012-2016 18% CAGR (1)
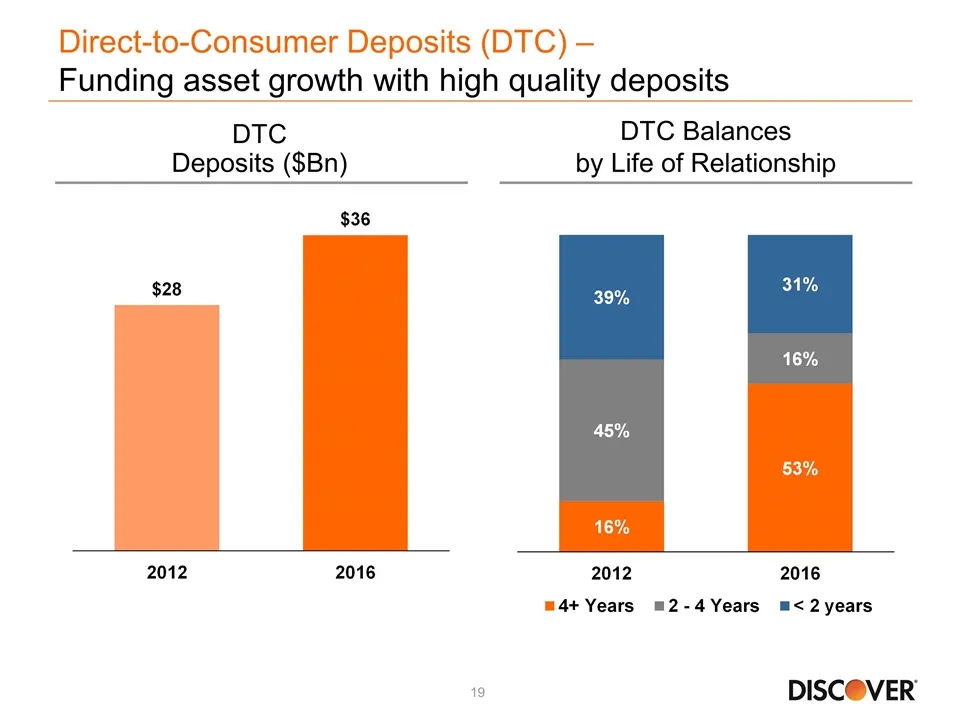
Slide 19: Direct-to-Consumer Deposits – Funding asset growth with high quality deposits
Direct-to-Consumer Deposits (DTC) – Funding asset growth with high quality deposits DTC Deposits ($Bn) DTC Balances by Life of Relationship
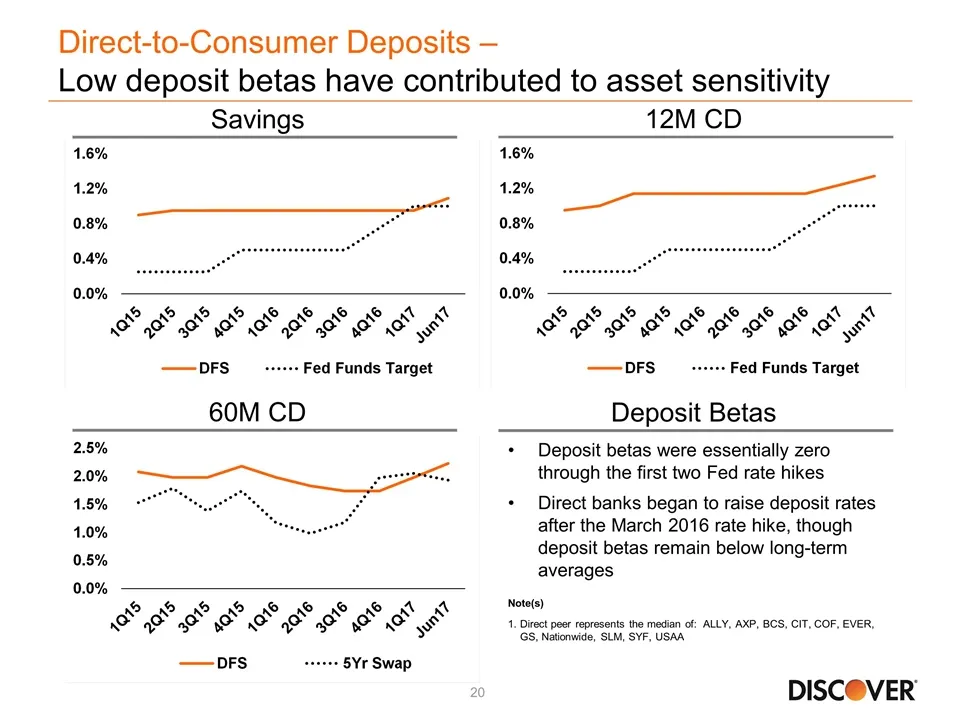
Slide 20: Direct-to-Consumer Deposits – Low deposit betas have contributed to asset sensitivity
Direct-to-Consumer Deposits – Low deposit betas have contributed to asset sensitivity Savings 12M CD 60M CD Deposit Betas Deposit betas were essentially zero through the first two Fed rate hikes Direct banks began to raise deposit rates after the March 2016 rate hike, though deposit betas remain bel
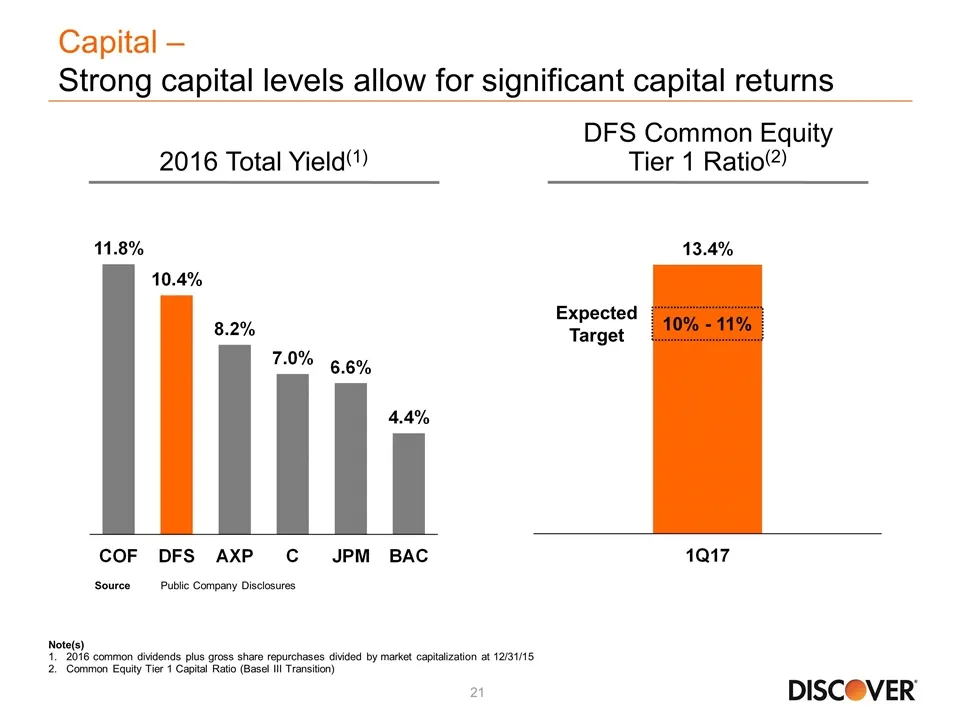
Slide 21: Capital – Strong capital levels allow for significant capital returns
Capital – Strong capital levels allow for significant capital returns Note(s) 2016 common dividends plus gross share repurchases divided by market capitalization at 12/31/15 Common Equity Tier 1 Capital Ratio (Basel III Transition) DFS Common Equity Tier 1 Ratio(2) 10% - 11% 2016 Total Yield(1) Sour

Slide 22: Discover
DISC®VER
Source: SEC EDGAR · 8-K filed Jun 15, 2017
More decks from Discover Financial Services
 Q1 2025 Earnings Presentation15 slides · Apr 23, 2025
 Q4 2024 Earnings Presentation17 slides · Jan 22, 2025
 Q3 2024 Earnings Presentation17 slides · Oct 16, 2024
 Q2 2024 Earnings Presentation17 slides · Jul 17, 2024
 Q1 2024 Earnings Presentation17 slides · Apr 17, 2024
 Merger or Acquisition (February 2024)27 slides · Feb 20, 2024