Rowan Companies — Howard Weil Energy Conference 2007
24 slides from Rowan Companies's conference presentation, Apr 4, 2007
Slide 1: Howard Weil Energy Conference
Howard Weil Energy Conference Rowan Companies, Inc. D.F. McNease Chairman and CEO April 2007

Slide 2: Forward Looking Statements
This report contains forward looking statements within the meaning of the Private Securities Litigation Reform Act of 1995, including, without limitation, statements as to the expectations, beliefs and future expected financial performance of the Company that are based on current expectations and ar
Slide 3: Rowan Companies, Inc. Revenues
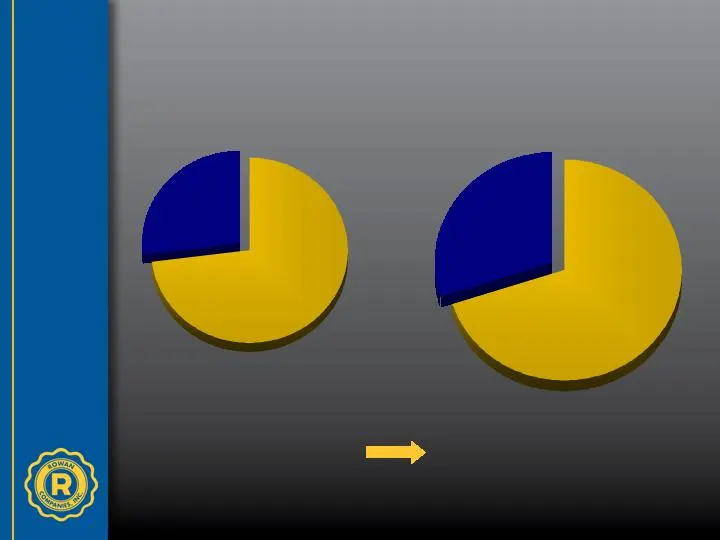
Drilling 73% Manufacturing 27% Drilling 71% Manufacturing 29% 2005 2006 Total Revenue: $1.1 billion Total Revenue: $1.5 billion Rowan Companies, Inc. Revenues

Slide 4: Operations and Backlog
( $ in millions) External revenues $443.3 $293.4 Margin* (% of revenues) $98.9 (22%) $65.7 (22%) Operating income** (% of revenues) $38.0 (9%) $ 7.7 (3%) External backlog $530 $388 Internal volume to Rowan $230 $118 * Equals external revenues less direct cost of sales ** Equals margin less SG&A, Eng
Slide 5: LeTourneau Technologies, Inc. – Worldwide Operations
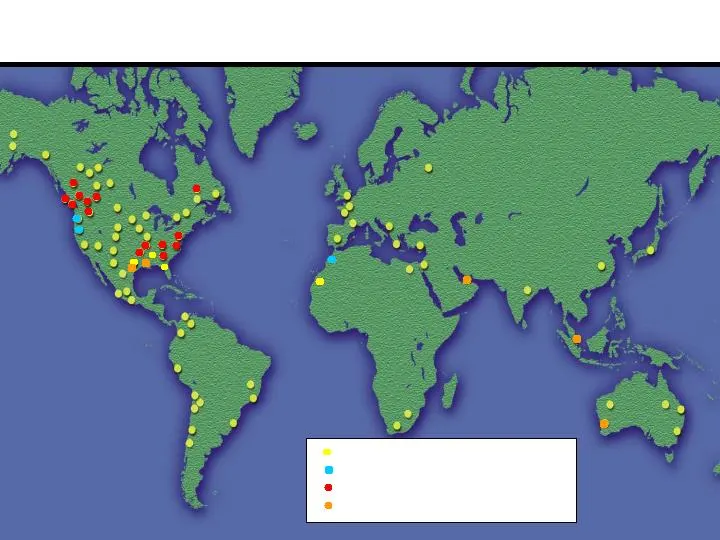
Forestry & Mining Mining Distribution Forestry Distribution Drilling Products Distribution LeTourneau Technologies, Inc. – Worldwide Operations
Slide 6: LeTourneau Technologies, Inc.
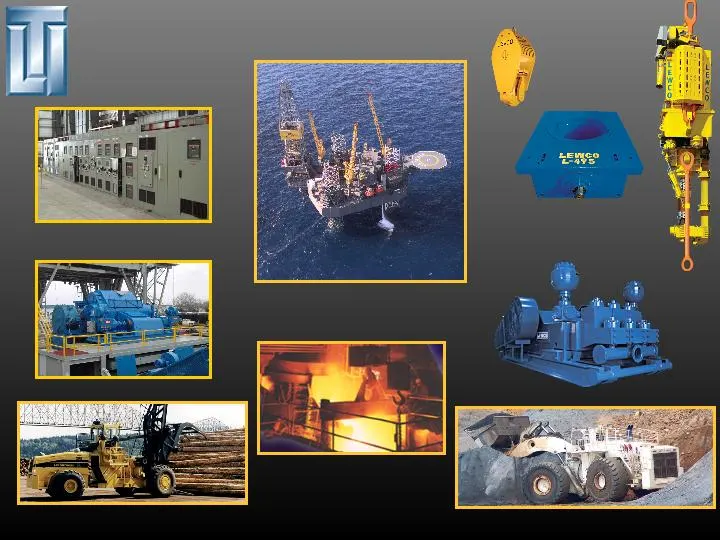
Mining Products Drilling Systems Power Systems Forestry Products Steel Products Offshore Products LeTourneau Technologies, Inc.
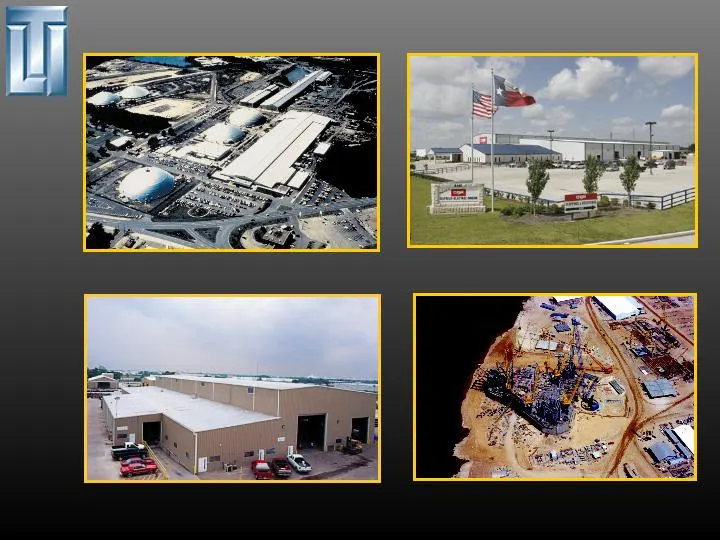
Slide 7: LeTourneau Technologies, Inc. Facilities
LeTourneau, Inc. - Longview OEM - Houston LeTourneau, Inc. - Vicksburg LEWCO - Houston LeTourneau Technologies, Inc. Facilities
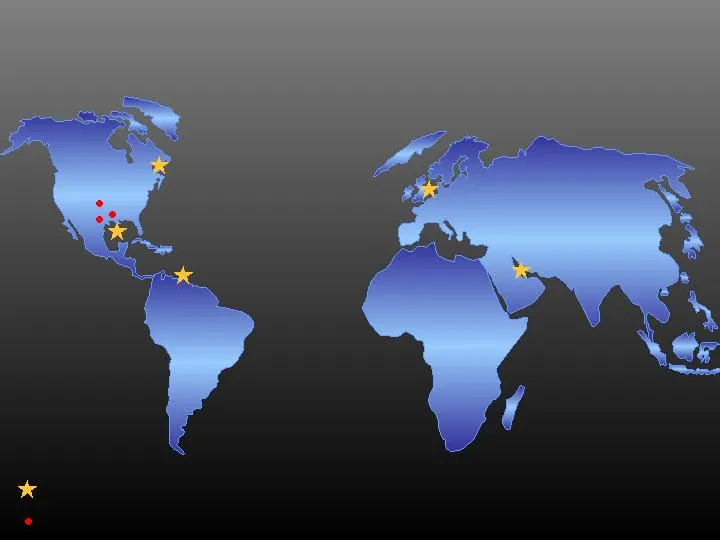
Slide 8: Rowan's Worldwide Drilling Operations
U.S. Gulf of Mexico 9 Jack-ups Trinidad 1 Jack-up Eastern Canada Operations Office North Sea 3 Jack-ups Middle East 8 Jack-ups 27 Land Rigs Rowan’s Worldwide Drilling Operations Jack-up Rigs Land Rigs
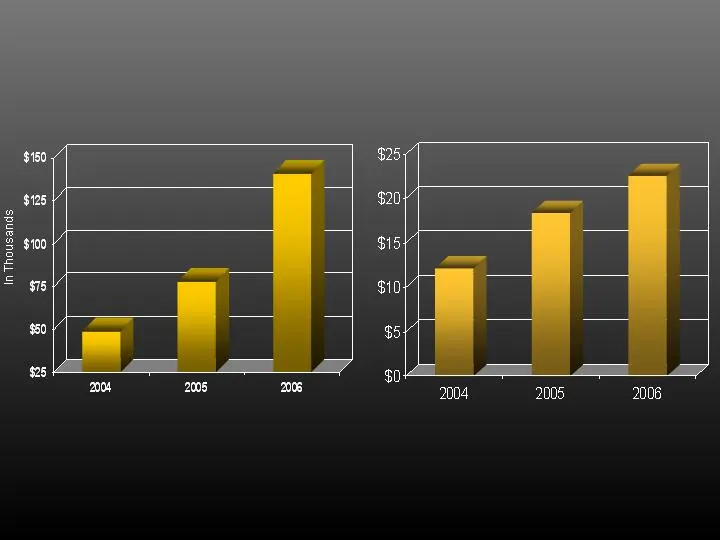
Slide 9: Rowan Companies, Inc. Average Dayrates
Offshore Land 4th quarter 2006 average day rate: $ 144,500 4th quarter 2006 average day rate: $ 22,700 Rowan Companies, Inc. Average Dayrates
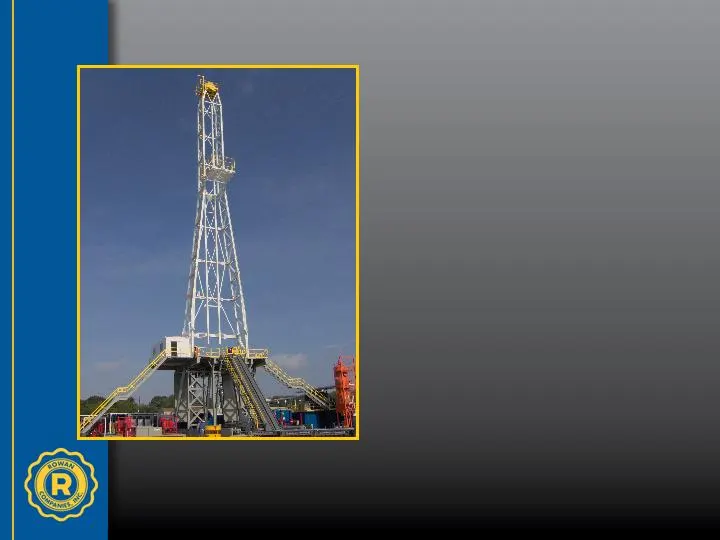
Slide 10: Rowan's Land Fleet
27 Land rigs currently operating in Texas, Louisiana & Oklahoma 18 of the 27 rigs are on term contracts Current Average Well Depth: 15,400’ Rowan Newbuild – Rig 60 Rowan’s Land Fleet • • •
Slide 11: Projected Land Rig Additions
Source: RigData and The Land Rig Newsletter Horsepower Q204 - Q406 Additions 2007E Additions Total Additions 500 to 999 178 79 257 1,000 to 1,499 123 133 256 1,500 to 1,999 83 68 151 405 292 697 Projected Land Rig Additions 2,000+

Slide 12: What happens if we slow drilling?
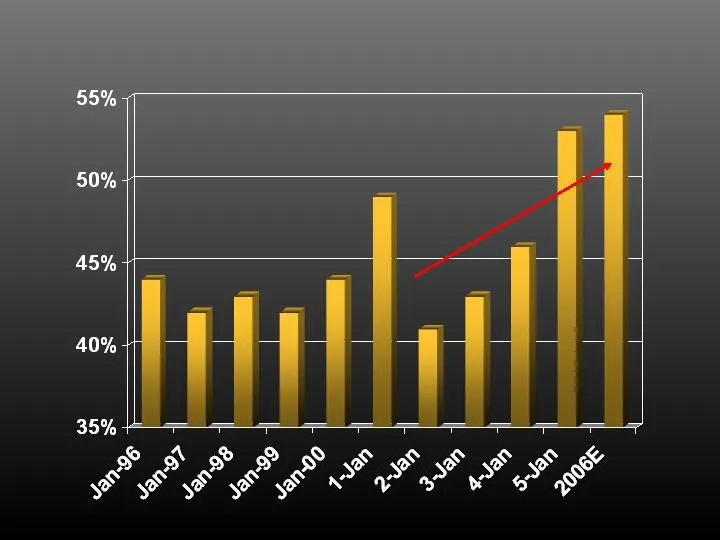
1 st Year Production Decline Rates from Gas Resource Plays South Texas 71% Mountain Front 60% Barnett Shale 67% Sahara 63% Ark-La-Tex 66% Granite 74% Devonian Shale 67% Source: Raymond James / Chesapeake Energy Fayette Shale 55% Deep Haley 65% Delaware Basin 37% Woodford Shale 66% Deep Bossier 66% W
Slide 13: First Year U.S. Gas Well Decline Rates
Source: Raymond James / EOG Resources First Year U.S. Gas Well Decline Rates
Slide 14: Rowan's Offshore Fleet – 21 Total Jack-ups
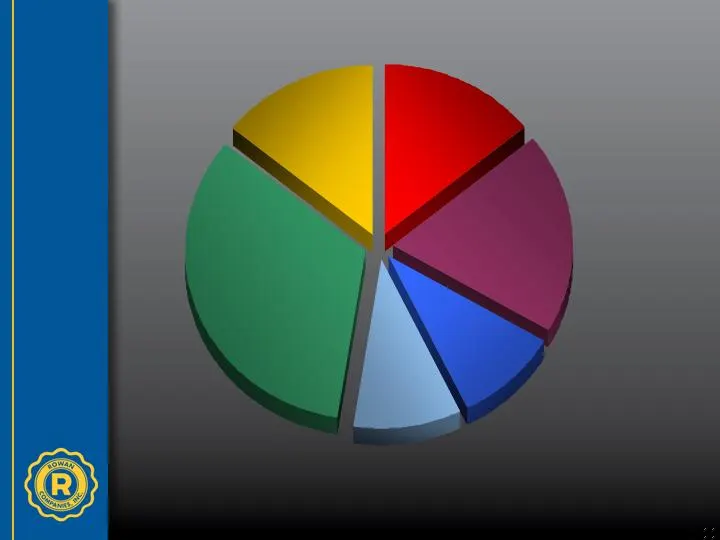
250’- 300’Slot 2 Rigs 10% Super Gorilla Three additional rigs are under construction / on order. Rowan’s Offshore Fleet – 21 Total Jack-ups Gorilla Class Rigs 14% 300-350’ 116-C Rigs 33% 350’ Slot Rigs 10% TARZAN CLASS 3 Rigs 14% Class Rigs 19%
Slide 15: Rowan's Worldwide Offshore Fleet
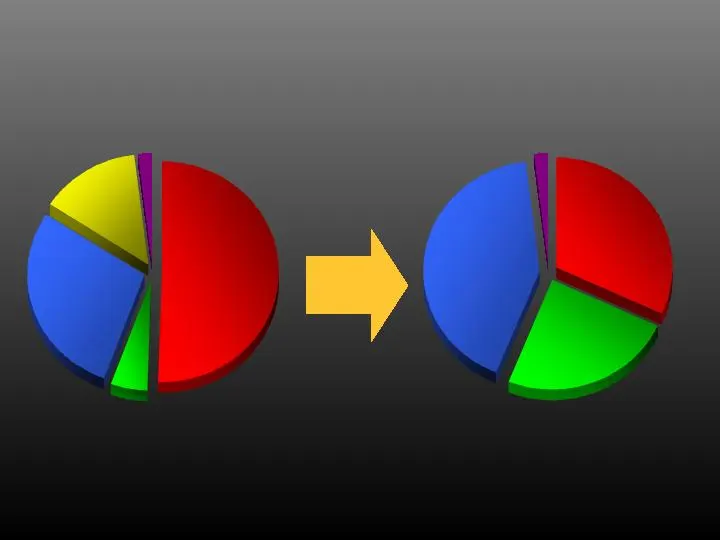
Middle East 5% North Sea North Sea Trinidad 1 st Quarter 2007 Trinidad 2% 4th Quarter 2006 The Middle East and the U.S. Gulf of Mexico are the two dominant jack-up markets that make up roughly 50% of the world fleet Eastern Canada 13% 29% U.S. Gulf of Mexico 32% Middle East 24% U.S. Gulf of Mexico 5
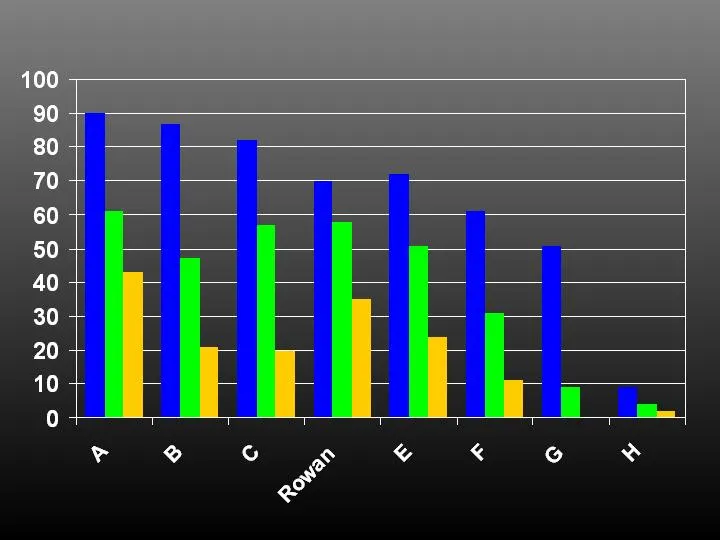
Slide 16: Jack-up Contract Coverage
Source: Morgan Stanley / ODS-Petrodata Offshore drillers operating internationally have longer-term contracts 90% 87% 82% 70% 72% 61% 51% 9% 2% Jack-up Contract Coverage 2007E 2008E 2009E 61% 43% 47% 21% 57% 20% 58% 35% 51% 24% 31% 11% 9% 4%

Slide 17: Rowan Companies, Inc. - ROI Analysis
4 year income - after taxes $203 million 4 year cash flow - after taxes $241 million Rowan Companies, Inc. - ROI Analysis Annual ROI - after taxes 20% Saudi Aramco Contract: 2 TARZAN Rigs - 4 year period

Slide 18: Rowan Companies, Inc. Revenue Deferral
$ in Millions Scooter Yeargain Hank Boswell Total Contract value $283.8 $283.8 $567.6 Revenue days deferred: 4th Quarter 2006 48 17 65 1st Quarter 2007 (est.) 90 90 180 Total (est.) 138 107 245 Revenues deferred: 4th Quarter 2006 $8.5 $3.1 $11.6 1st Quarter 2007 (est.) $16.0 $16.3 $32.3 Total (est.)
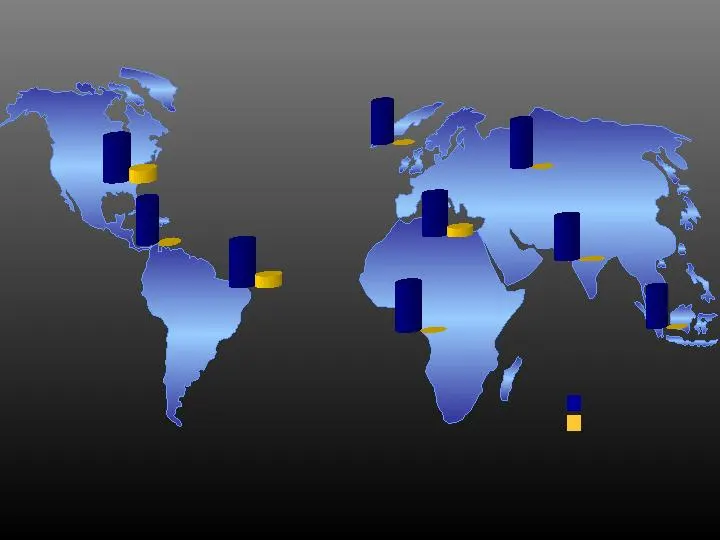
Slide 19: Current Worldwide Jack-up Supply / Demand
C & S America: 88% US GOM: 72% Mexico: 100% West Africa: 96% North Sea: 100% Middle East: 96% SE Asia: 100% Contracted Not Contracted 63 31 2 35 24 1 88 4 35 0 25 15 0 Worldwide Utilization: 91% Includes data supplied by ODS-Petrodata, Inc; Copyright 2007 0 Indian Ocean: 100% 32 0 Med / Black Sea :
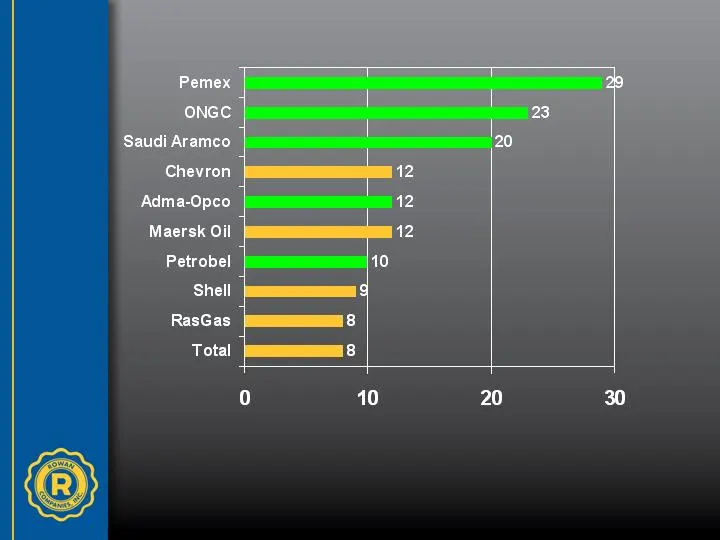
Slide 20: Largest Jack-up Operators Worldwide
• NOCs have assumed a more dominant role in global jack-up demand • NOCs not only are economically driven, but also politically driven – probably less cyclical Source: ODS-Petrodata / Morgan Stanley Largest Jack-up Operators Worldwide National Oil Companies International Oil Companies
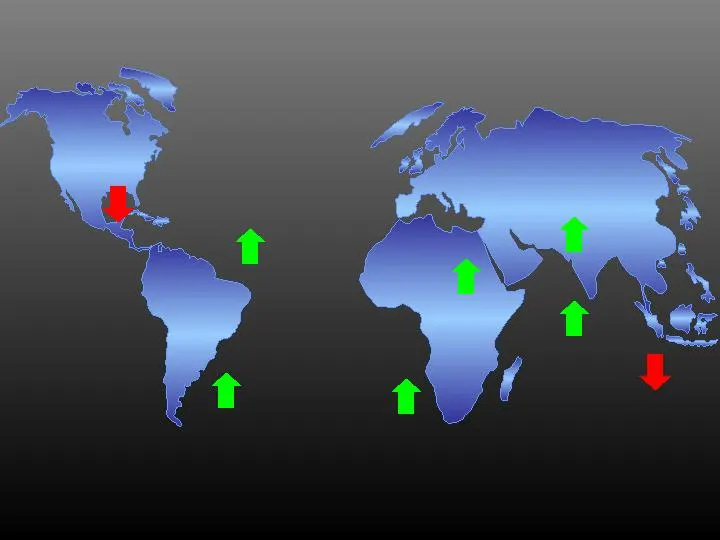
Slide 21: Tender Projections and Effect on Migration Forecast
Argentina: US GOM Mexico: West Africa: North Sea: 100% Middle East: SE Asia Indian Ocean: Med / Black Sea : Rig Rigs 2-3 Rigs Rigs Tender Projections and Effect on Migration Forecast - 1 st Half 2007 Rigs Rigs Outstanding Tenders Migration INTO the region Migration OUT of the region
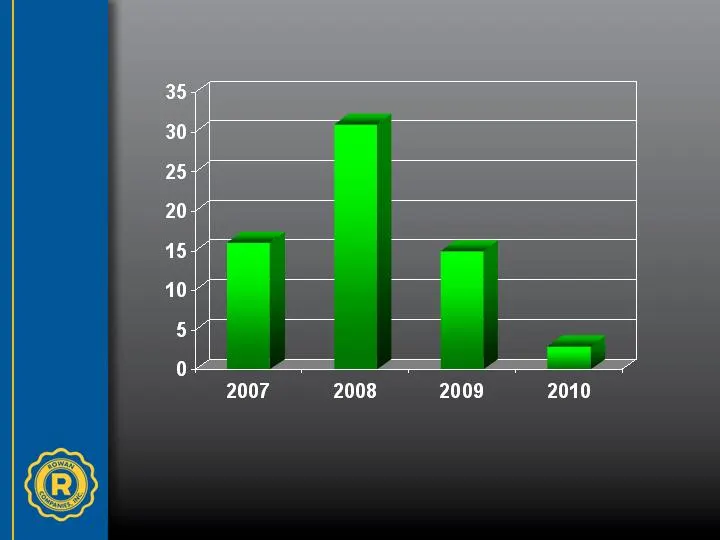
Slide 22: Worldwide Jack-up Newbuilds
16 31 15 3 • Approximately 90% of the fleet is 20 years & older – attrition will continue • Newbuilds jack-ups will not meet current supply deficits until mid-2008 at the earliest Worldwide Jack-up Newbuilds
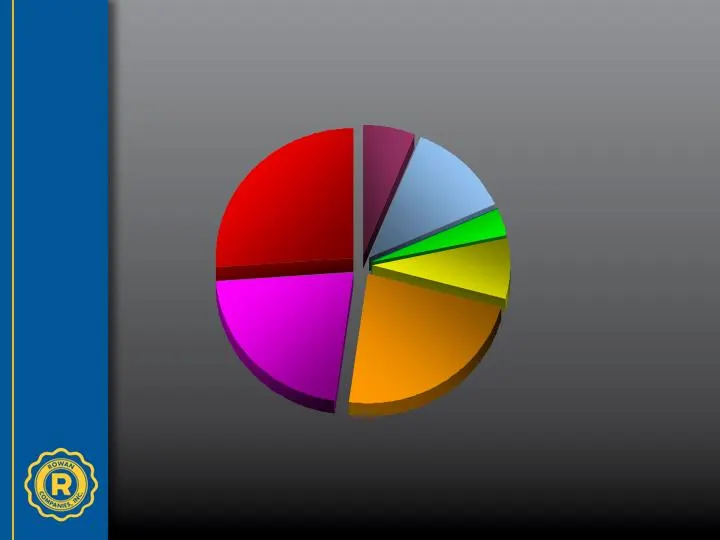
Slide 23: Gulf of Mexico Jack-ups Projected Rig Make-up
65 Total Jack-ups The 300 IC and 350 IC Class jack-ups would no longer be available in the U.S. GOM 250’ IC 8 Rigs <250’ IC 4 Rigs 200’-250’ MS 17 Rigs 200’-250’ MC 14 Rigs <200’ MC 15 Rigs IS 5 Rigs >350’ IC 2 Rigs (56 Total Active Jack-ups) Gulf of Mexico Jack-ups Projected Rig Make-up Mid Year 20
Slide 24: Howard Weil Energy Conference
Howard Weil Energy Conference Rowan Companies, Inc. D.F. McNease Chairman and CEO April 2007
Source: SEC EDGAR · 8-K filed Apr 4, 2007
More decks from Rowan Companies plc
 Merger or Acquisition (October 2018)27 slides · Oct 9, 2018
 Merger or Acquisition (November 2016)12 slides · Nov 21, 2016
 Investor Presentation (March 2016)36 slides · Mar 29, 2016
 Investor Presentation (March 2015)43 slides · Mar 23, 2015
 Barclays CEO Energy - Power Conference 201443 slides · Sep 2, 2014
 Investor Presentation (May 2014)39 slides · May 19, 2014