Noranda Aluminum — Debt Investor Presentation (July 2009)
23 slides from Noranda Aluminum's debt investor presentation, Jul 27, 2009
Slide 1: Presentation to Lenders July 2009
Presentation to Lenders July 2009
Slide 2: Forward Looking Statements & Disclosure
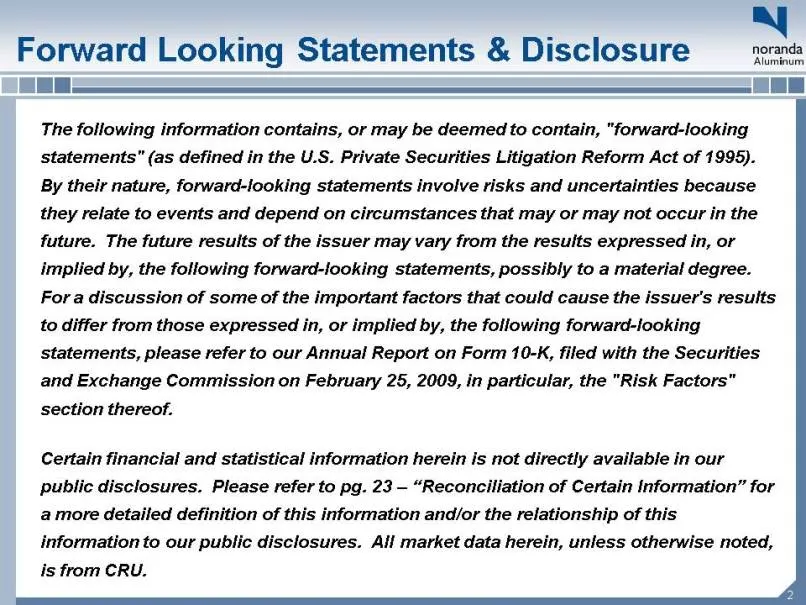
Forward Looking Statements & Disclosure The following information contains, or may be deemed to contain, "forward-looking statements" (as defined in the U.S. Private Securities Litigation Reform Act of 1995). By their nature, forward-looking statements involve risks and uncertainties because they re
Slide 3: Management Attendees
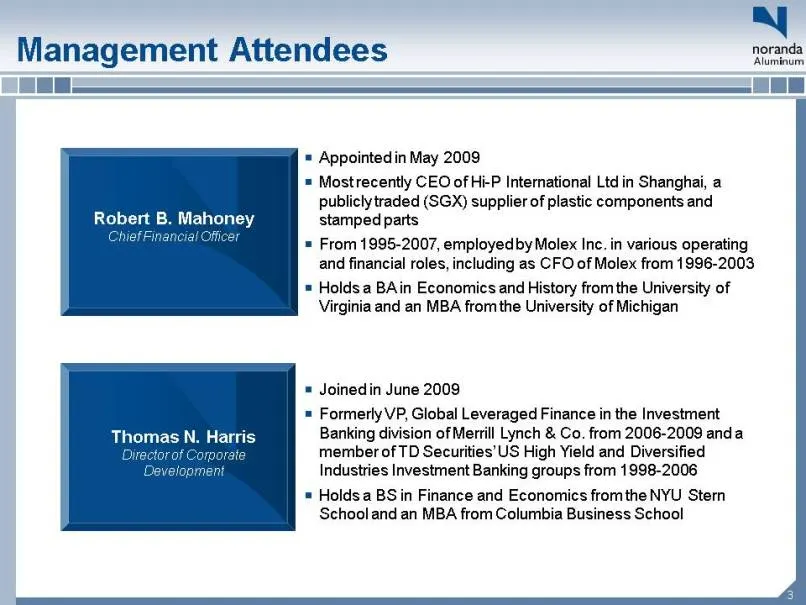
Management Attendees Robert B. Mahoney Chief Financial Officer Thomas N. Harris Director of Corporate Development Appointed in May 2009 Most recently CEO of Hi-P International Ltd in Shanghai, a publicly traded (SGX) supplier of plastic components and stamped parts From 1995-2007, employed by Molex
Slide 4: Company Overview
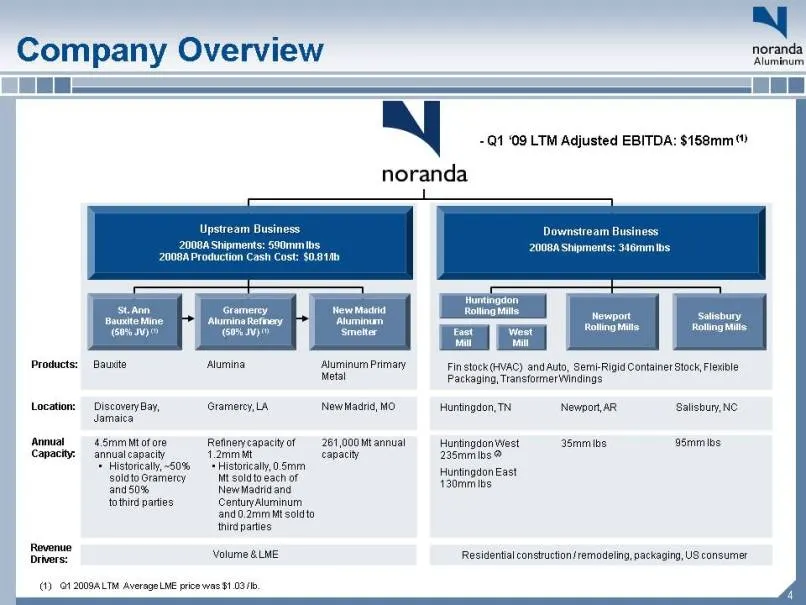
Company Overview Q1 2009A LTM Average LME price was $1.03 / lb. Downstream Business 2008A Shipments: 346mm lbs St. Ann Bauxite Mine (50% JV) (1) New Madrid Aluminum Smelter Newport Rolling Mills Salisbury Rolling Mills East Mill West Mill Huntingdon Rolling Mills Bauxite Discovery Bay, Jamaica 4.5mm
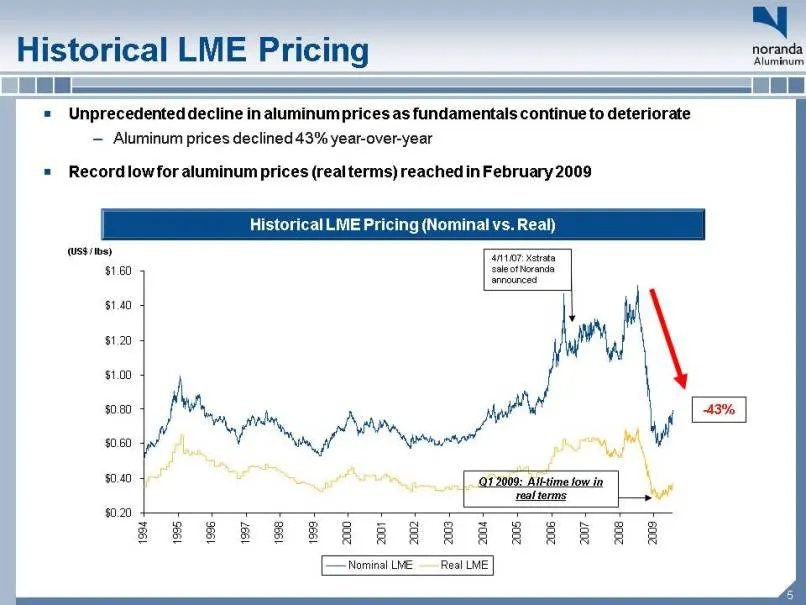
Slide 5: Historical LME Pricing
Historical LME Pricing Unprecedented decline in aluminum prices as fundamentals continue to deteriorateAluminum prices declined 43% year-over-yearRecord low for aluminum prices (real terms) reached in February 2009 Q1 2009: All-time low in real terms 4/11/07: Xstrata sale of Noranda announced (US$ /
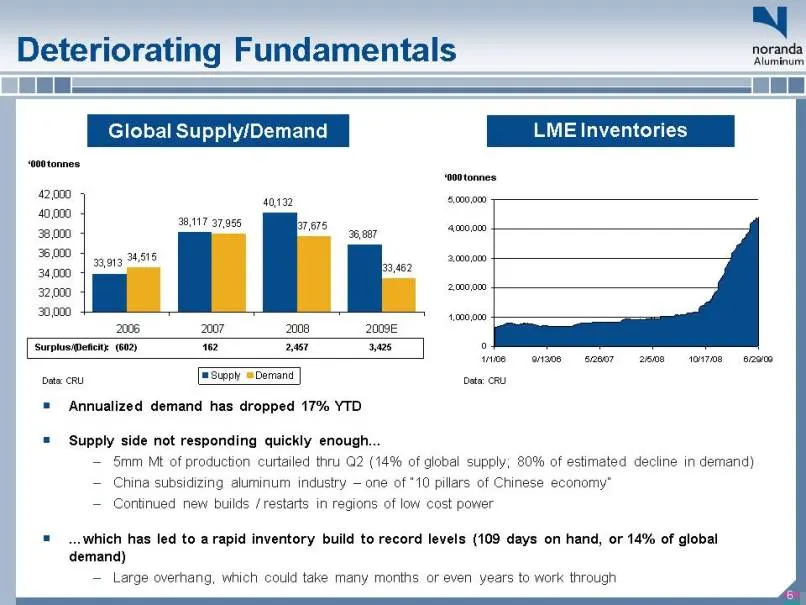
Slide 6: Deteriorating Fundamentals
Deteriorating Fundamentals Annualized demand has dropped 17% YTD Supply side not responding quickly enough… 5mm Mt of production curtailed thru Q2 (14% of global supply; 80% of estimated decline in demand) China subsidizing aluminum industry – one of “10 pillars of Chinese economy” Continued new bui
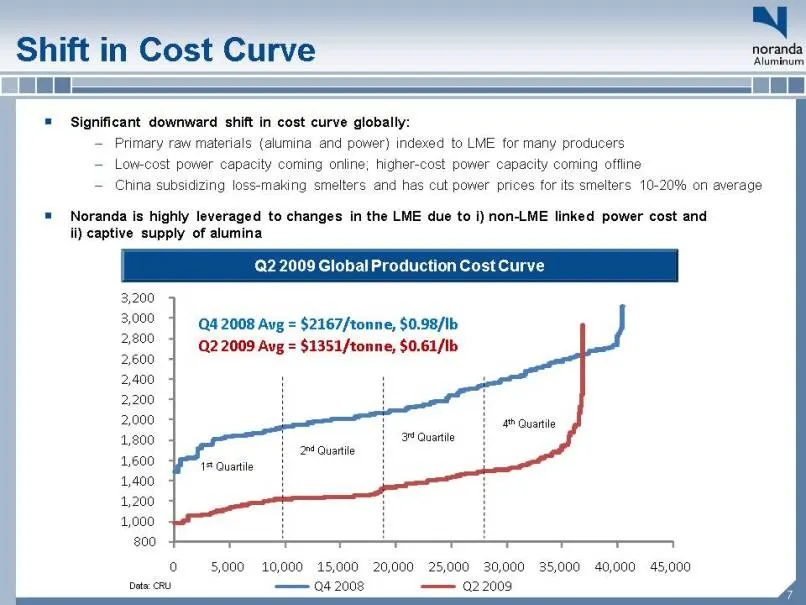
Slide 7: Shift in Cost Curve
Shift in Cost Curve Significant downward shift in cost curve globally:Primary raw materials (alumina and power) indexed to LME for many producersLow-cost power capacity coming online; higher-cost power capacity coming offlineChina subsidizing loss-making smelters and has cut power prices for its sme
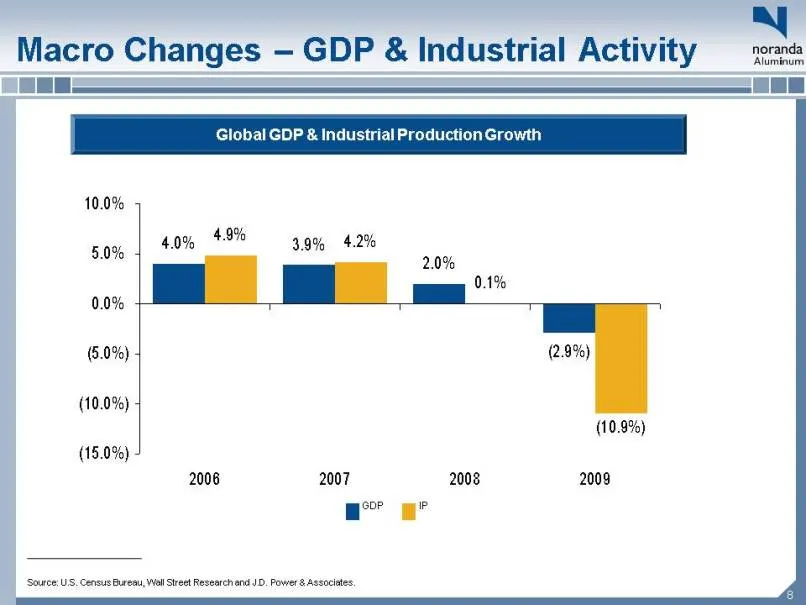
Slide 8: Macro Changes – GDP & Industrial Activity
Macro Changes – GDP & Industrial Activity Global GDP & Industrial Production Growth (Gp:) GDP (Gp:) IP Source: U.S. Census Bureau, Wall Street Research and J.D. Power & Associates.
Slide 9: Macro Changes – China & India GDP Growth
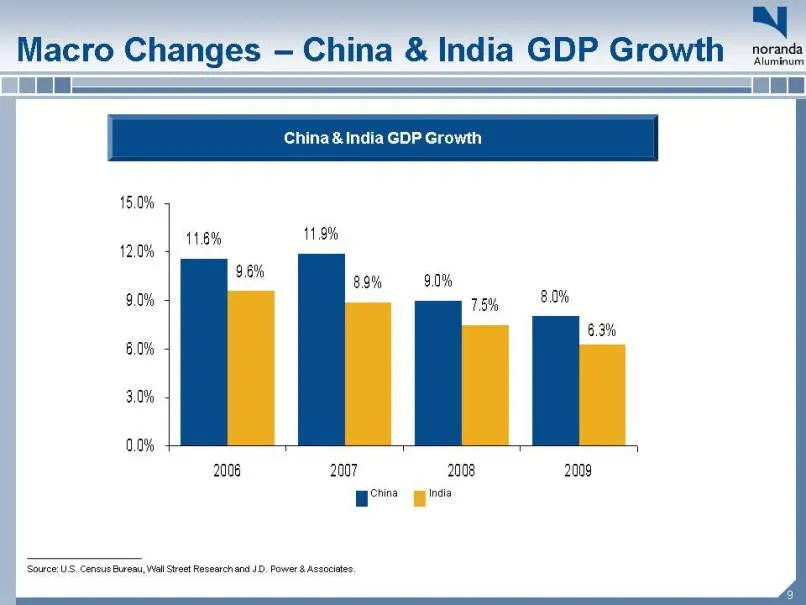
Macro Changes – China & India GDP Growth China & India GDP Growth (Gp:) China (Gp:) India Source: U.S. Census Bureau, Wall Street Research and J.D. Power & Associates.
Slide 10: Macro Changes – Auto Production
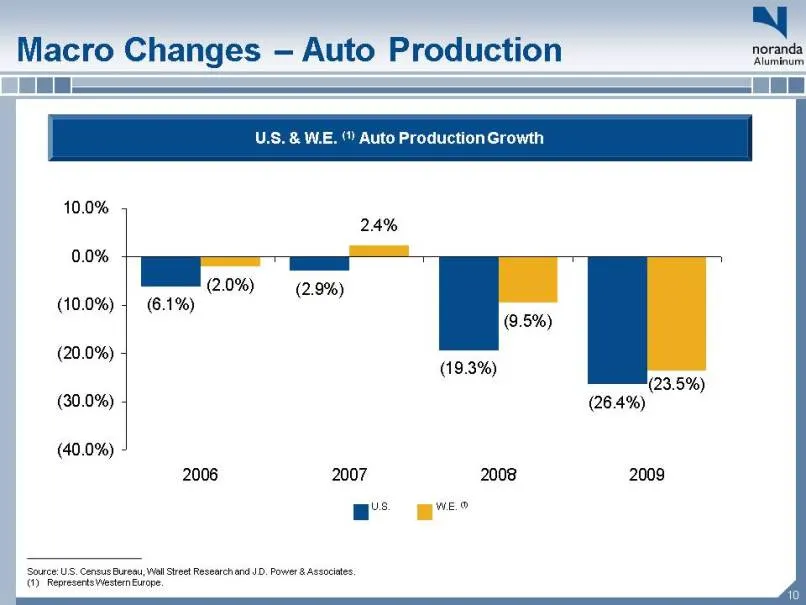
Macro Changes – Auto Production Source: U.S. Census Bureau, Wall Street Research and J.D. Power & Associates.(1) Represents Western Europe. U.S. & W.E. (1) Auto Production Growth (Gp:) U.S. (Gp:) W.E. (1)
Slide 11: Macro Changes – Housing
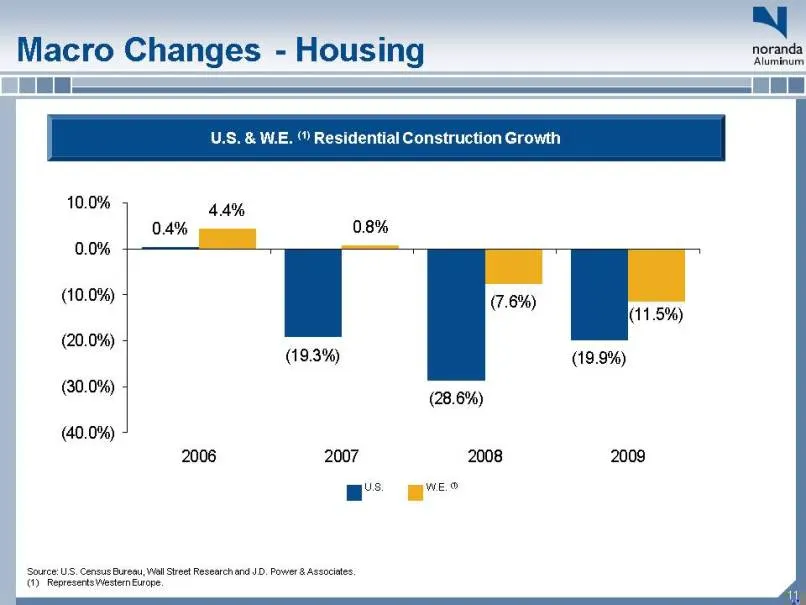
Macro Changes – Housing Source: U.S. Census Bureau, Wall Street Research and J.D. Power & Associates.(1) Represents Western Europe. U.S. & W.E. (1) Residential Construction Growth (Gp:) U.S. (Gp:) W.E. (1)
Slide 12: State of the Aluminum World
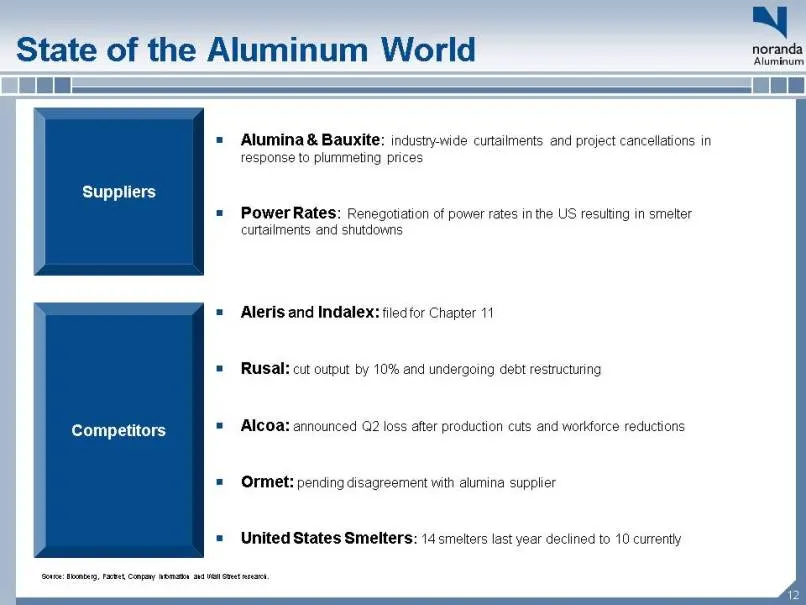
State of the Aluminum World Alumina & Bauxite: industry-wide curtailments and project cancellations in response to plummeting prices Power Rates: Renegotiation of power rates in the US resulting in smelter curtailments and shutdowns Suppliers Competitors Aleris and Indalex: filed for Chapter 11 Rusa
Slide 13: State of the Aluminum World – End Markets
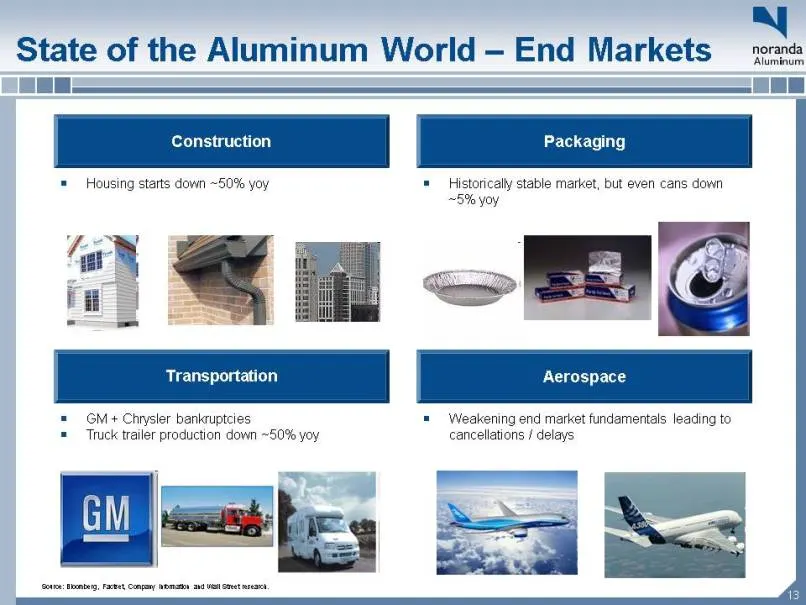
State of the Aluminum World – End Markets Source: Bloomberg, Factset, Company information and Wall Street research. Construction Packaging Transportation Aerospace Housing starts down ~50% yoy Historically stable market, but even cans down ~5% yoy GM + Chrysler bankruptciesTruck trailer production d
Slide 14: Recent Commentary – Strong Headwinds
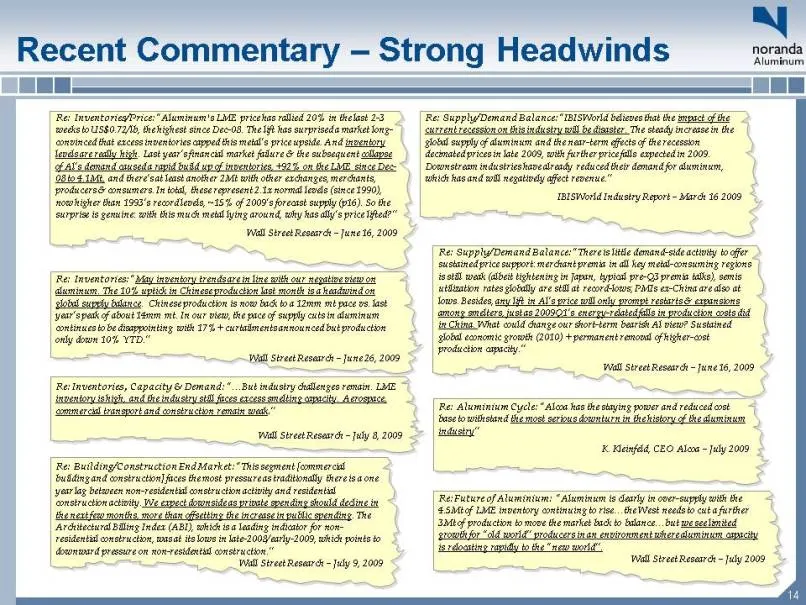
Recent Commentary – Strong Headwinds (Gp:) Re: Building/Construction End Market: “This segment [commercial building and construction] faces the most pressure as traditionally there is a one year lag between non-residential construction activity and residential construction activity. We expect downsi
Slide 15: Long-Term Aluminum Outlook
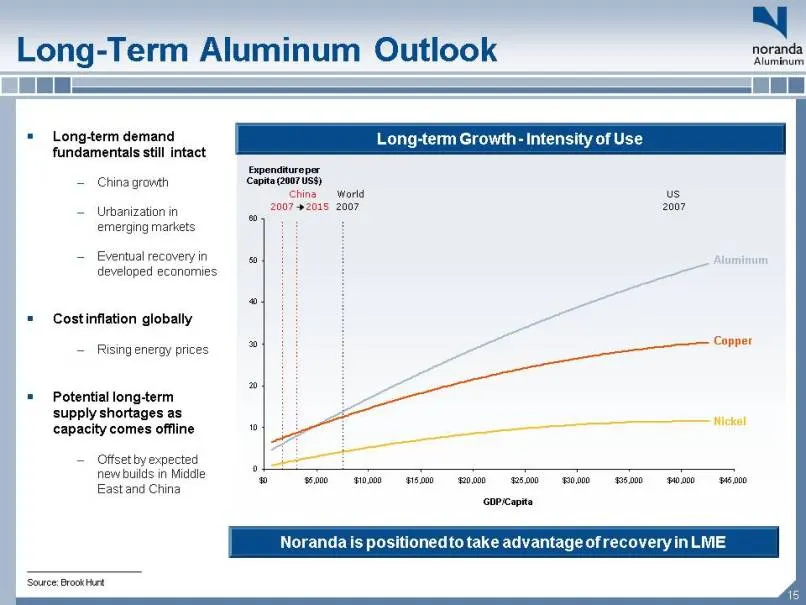
Long-Term Aluminum Outlook Long-term demand fundamentals still intactChina growthUrbanization in emerging marketsEventual recovery in developed economiesCost inflation globallyRising energy pricesPotential long-term supply shortages as capacity comes offlineOffset by expected new builds in Middle Ea
Slide 16: Recent Noranda Developments
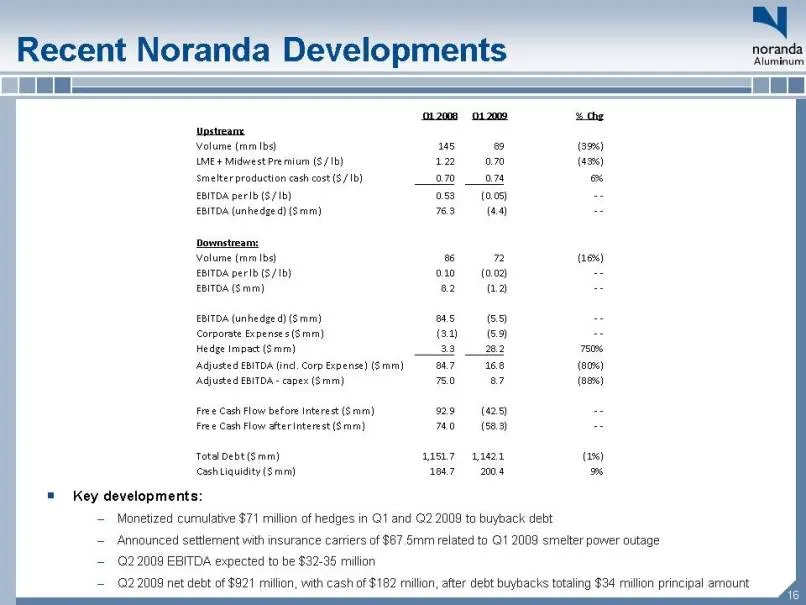
Recent Noranda Developments Key developments:Monetized cumulative $71 million of hedges in Q1 and Q2 2009 to buyback debtAnnounced settlement with insurance carriers of $67.5mm related to Q1 2009 smelter power outageQ2 2009 EBITDA expected to be $32-35 millionQ2 2009 net debt of $921 million, with c
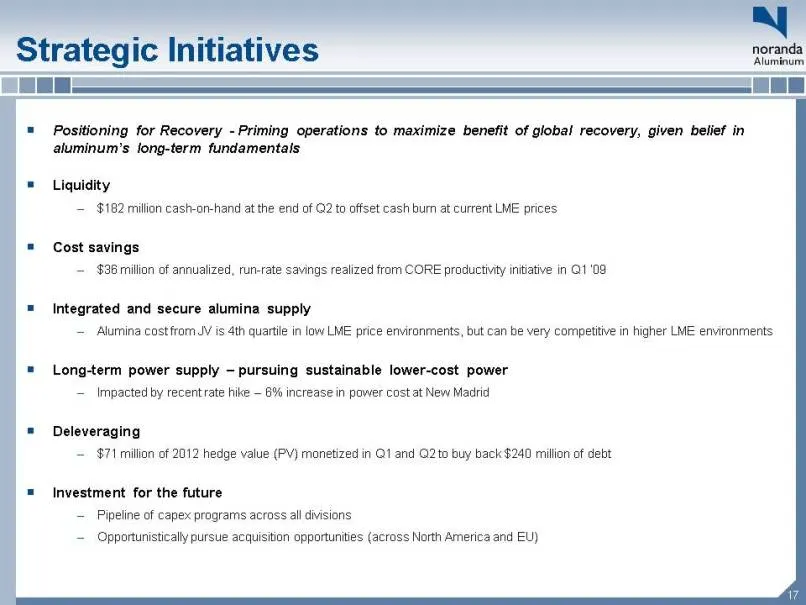
Slide 17: Strategic Initiatives
Strategic Initiatives Positioning for Recovery - Priming operations to maximize benefit of global recovery, given belief in aluminum’s long-term fundamentalsLiquidity $182 million cash-on-hand at the end of Q2 to offset cash burn at current LME pricesCost savings$36 million of annualized, run-rate s
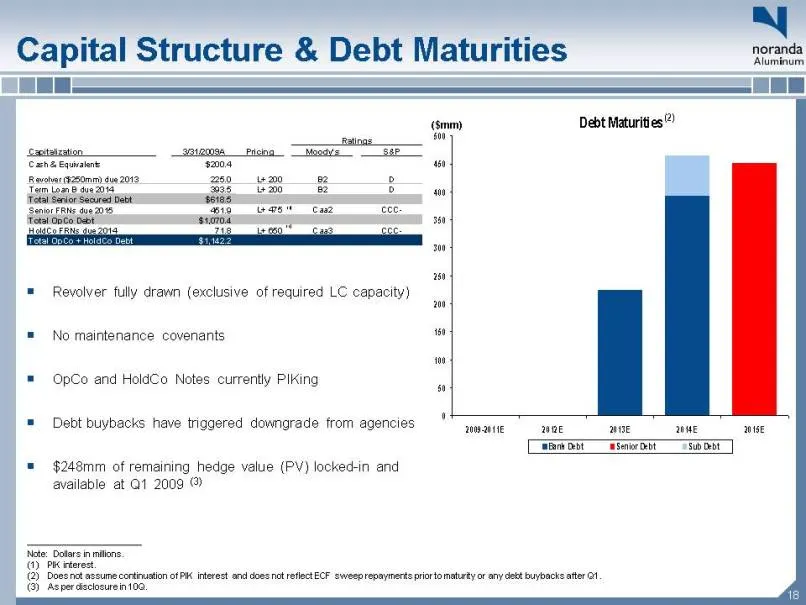
Slide 18: Capital Structure & Debt Maturities
Capital Structure & Debt Maturities ($mm) Revolver fully drawn (exclusive of required LC capacity)No maintenance covenantsOpCo and HoldCo Notes currently PIKingDebt buybacks have triggered downgrade from agencies$248mm of remaining hedge value (PV) locked-in and available at Q1 2009 (3) Note: Dollar
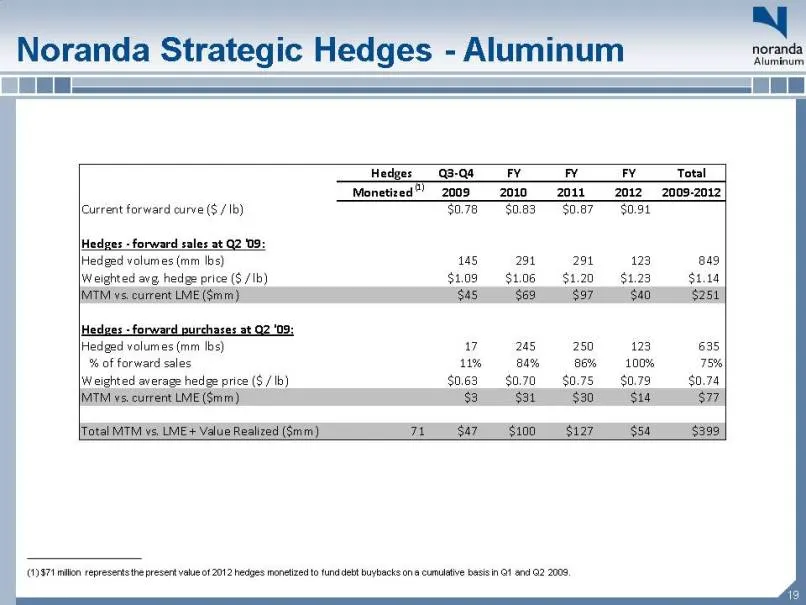
Slide 19: Noranda Strategic Hedges – Aluminum
Noranda Strategic Hedges – Aluminum (1) $71 million represents the present value of 2012 hedges monetized to fund debt buybacks on a cumulative basis in Q1 and Q2 2009.
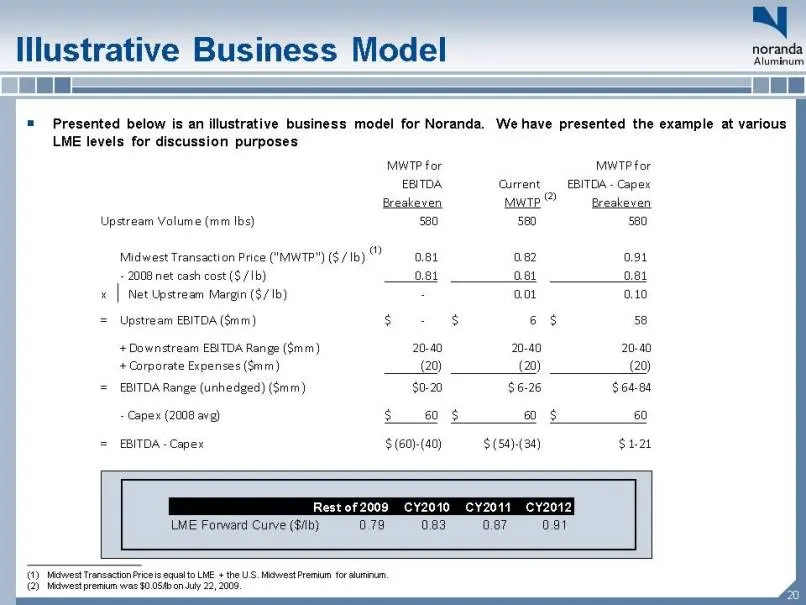
Slide 20: Illustrative Business Model
Illustrative Business Model Presented below is an illustrative business model for Noranda. We have presented the example at various LME levels for discussion purposes Midwest Transaction Price is equal to LME + the U.S. Midwest Premium for aluminum.Midwest premium was $0.05/lb on July 22, 2009.(2) (
Slide 21: Illustrative Liquidity & Cash Needs
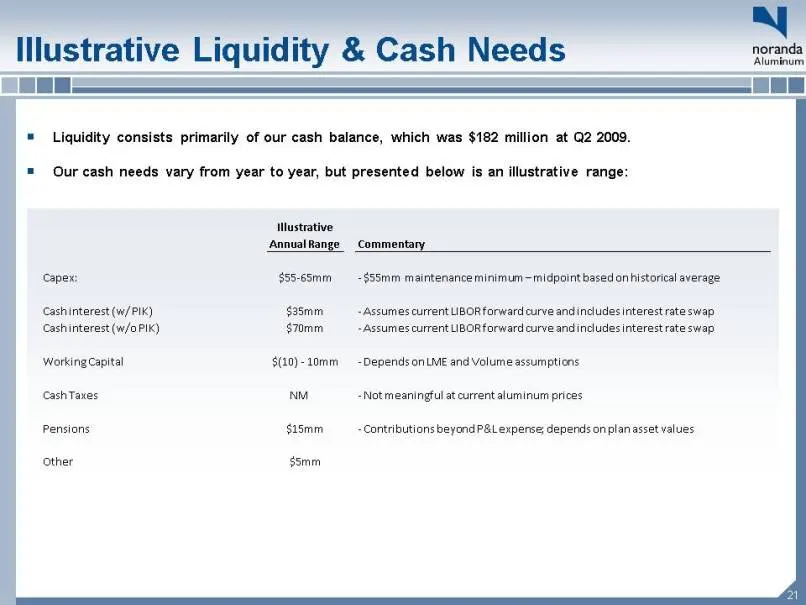
Illustrative Liquidity & Cash Needs Liquidity consists primarily of our cash balance, which was $182 million at Q2 2009.Our cash needs vary from year to year, but presented below is an illustrative range: (Gp:) Illustrative (Gp:) Annual Range (Gp:) Commentary (Gp:) Capex: (Gp:) $55-65mm (Gp:) - $55m
Slide 22: Appendix
Appendix
Slide 23: Reconciliation of Certain Information
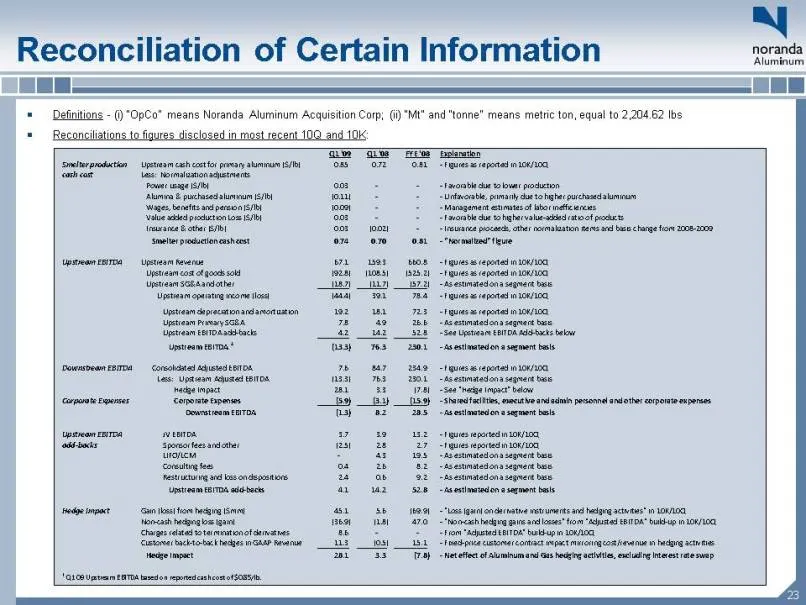
Reconciliation of Certain Information Definitions - (i) “OpCo” means Noranda Aluminum Acquisition Corp; (ii) “Mt” and “tonne” means metric ton, equal to 2,204.62 lbs Reconciliations to figures disclosed in most recent 10Q and 10K:
Source: SEC EDGAR · 8-K filed Jul 27, 2009
More decks from Noranda Aluminum Holding Corp
 Q3 2015 Earnings Presentation10 slides · Nov 9, 2015
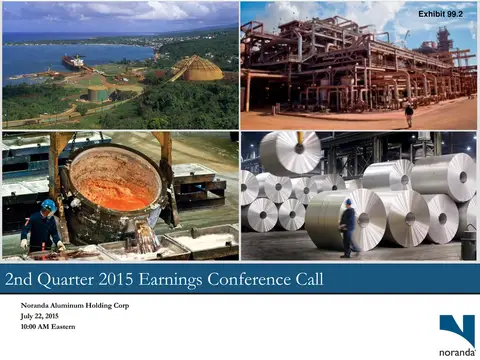 Q2 2015 Earnings Presentation11 slides · Jul 22, 2015
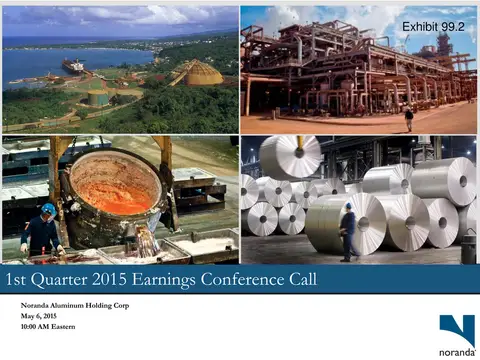 Q1 2015 Earnings Presentation15 slides · May 6, 2015
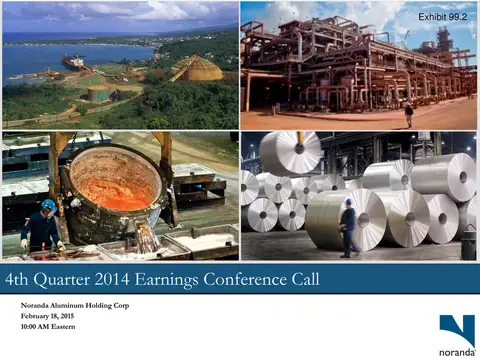 Q4 2014 Earnings Presentation15 slides · Feb 18, 2015
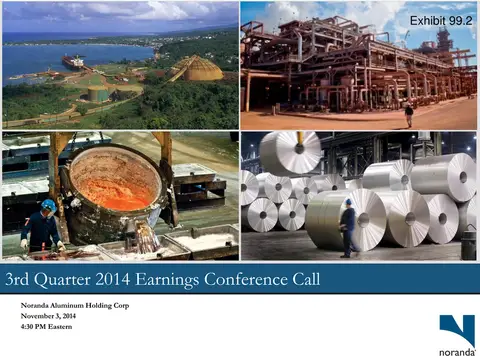 Q3 2014 Earnings Presentation15 slides · Nov 3, 2014
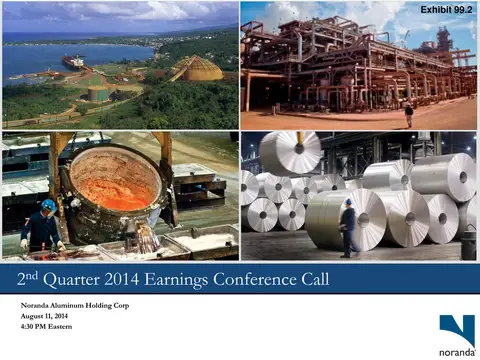 Q2 2014 Earnings Presentation16 slides · Aug 11, 2014