Synovus Financial — Goldman Sachs 2022 US Financial Services Conference
10 slides from Synovus Financial's conference presentation, Dec 6, 2022
Slide 1: Goldman Sachs 2022 US Financial Services Conference
©2022 Synovus. All Rights Reserved. 1 Goldman Sachs 2022 US Financial Services Conference Kevin Blair – President and CEO December 7, 2022 Exhibit 99.1
Slide 2: Forward-looking statements
©2022 Synovus. All Rights Reserved. 2 This slide presentation and certain of our other filings with the Securities and Exchange Commission contain statements that constitute "forward-looking statements" within the meaning of, and subject to the protections of, Section 27A of the Securities Act of 19
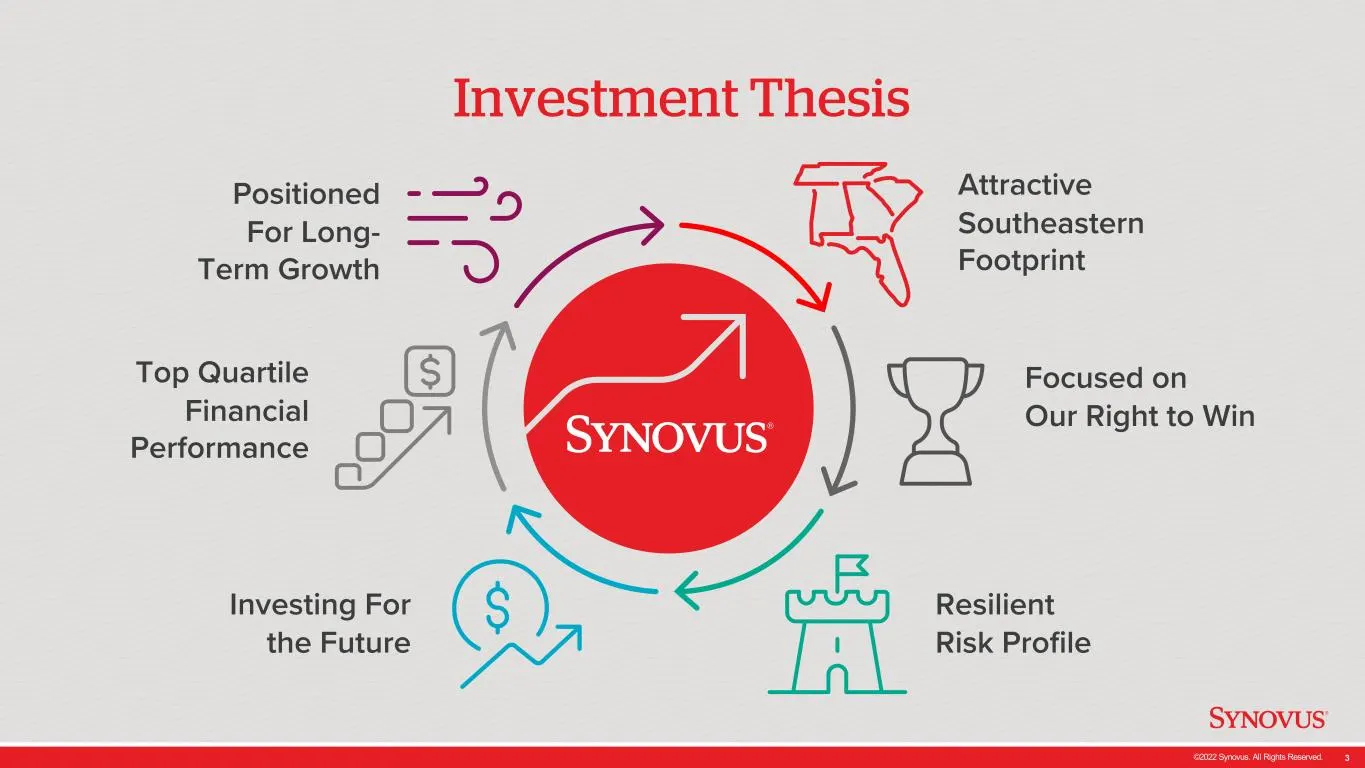
Slide 3: Investment Thesis
©2022 Synovus. All Rights Reserved. 3 Investment Thesis Focused on Our Right to Win Resilient Risk Profile Investing For the Future Top Quartile Financial Performance Attractive Southeastern Footprint Positioned For Long- Term Growth
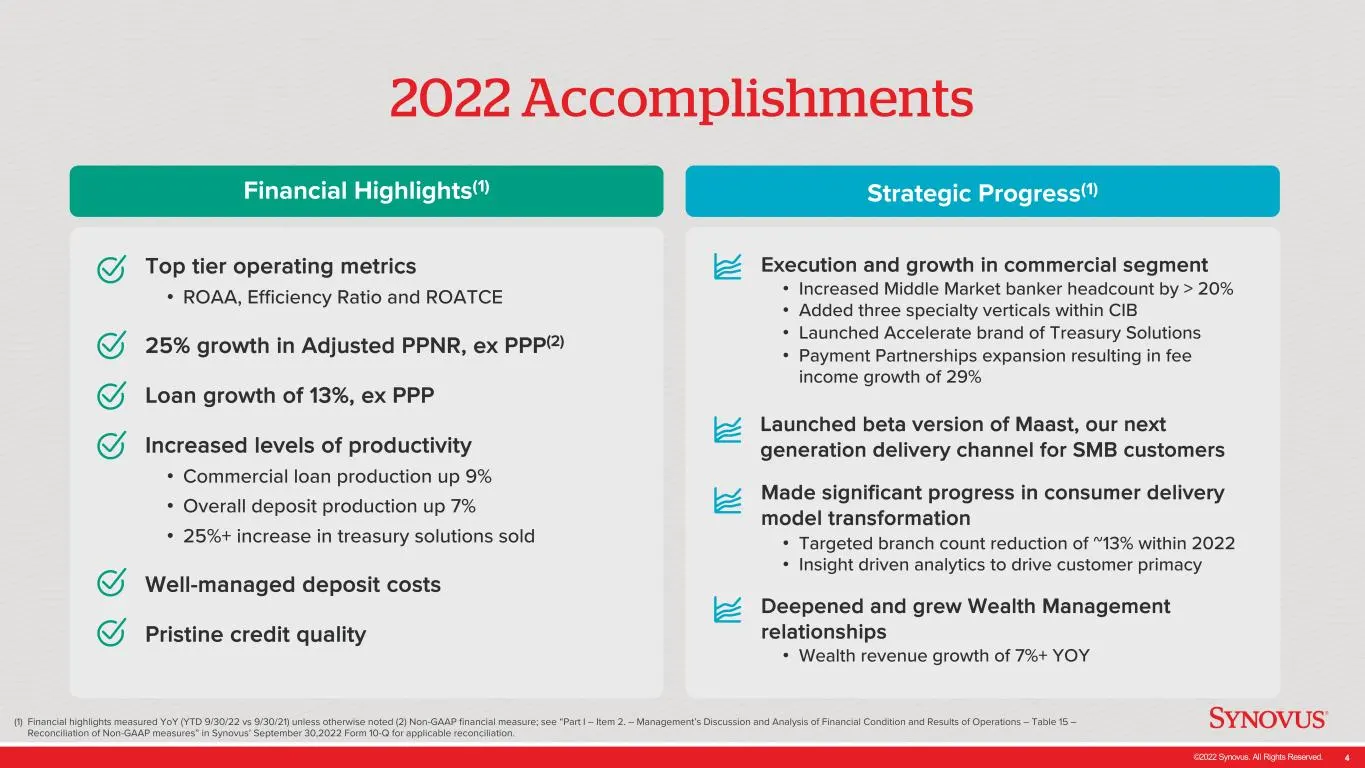
Slide 4: 2022 highlights and execution
©2022 Synovus. All Rights Reserved. 4 Top tier operating metrics • ROAA, Efficiency Ratio and ROATCE 25% growth in Adjusted PPNR, ex PPP(2) Loan growth of 13%, ex PPP Increased levels of productivity • Commercial loan production up 9% • Overall deposit production up 7% • 25%+ increase in treasury so
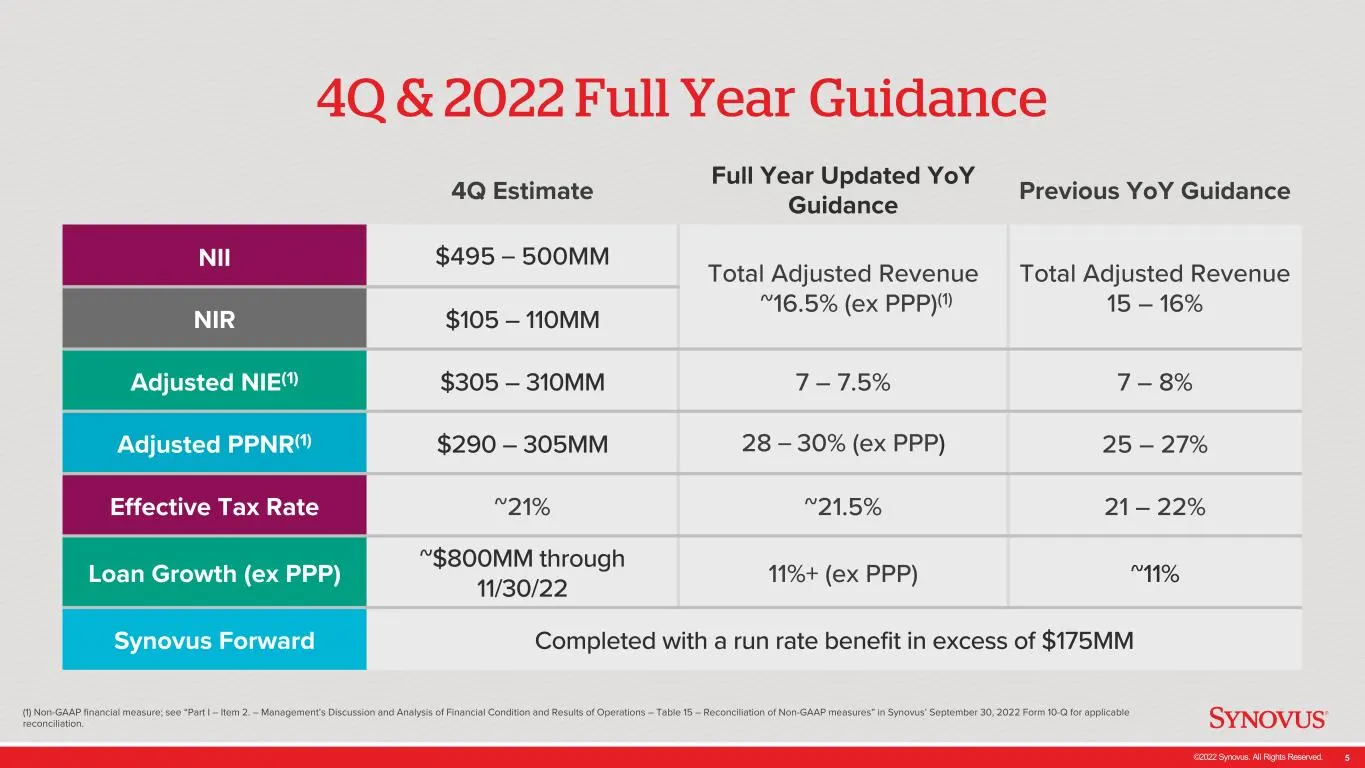
Slide 5: 4Q & 2022 Full Year Guidance
©2022 Synovus. All Rights Reserved. 5 4Q & 2022 Full Year Guidance 4Q Estimate Full Year Updated YoY Guidance Previous YoY Guidance NII $495 – 500MM Total Adjusted Revenue ~16.5% (ex PPP)(1) Total Adjusted Revenue 15 – 16%NIR $105 – 110MM Adjusted NIE(1) $305 – 310MM 7 – 7.5% 7 – 8% Adjusted PPNR(1)
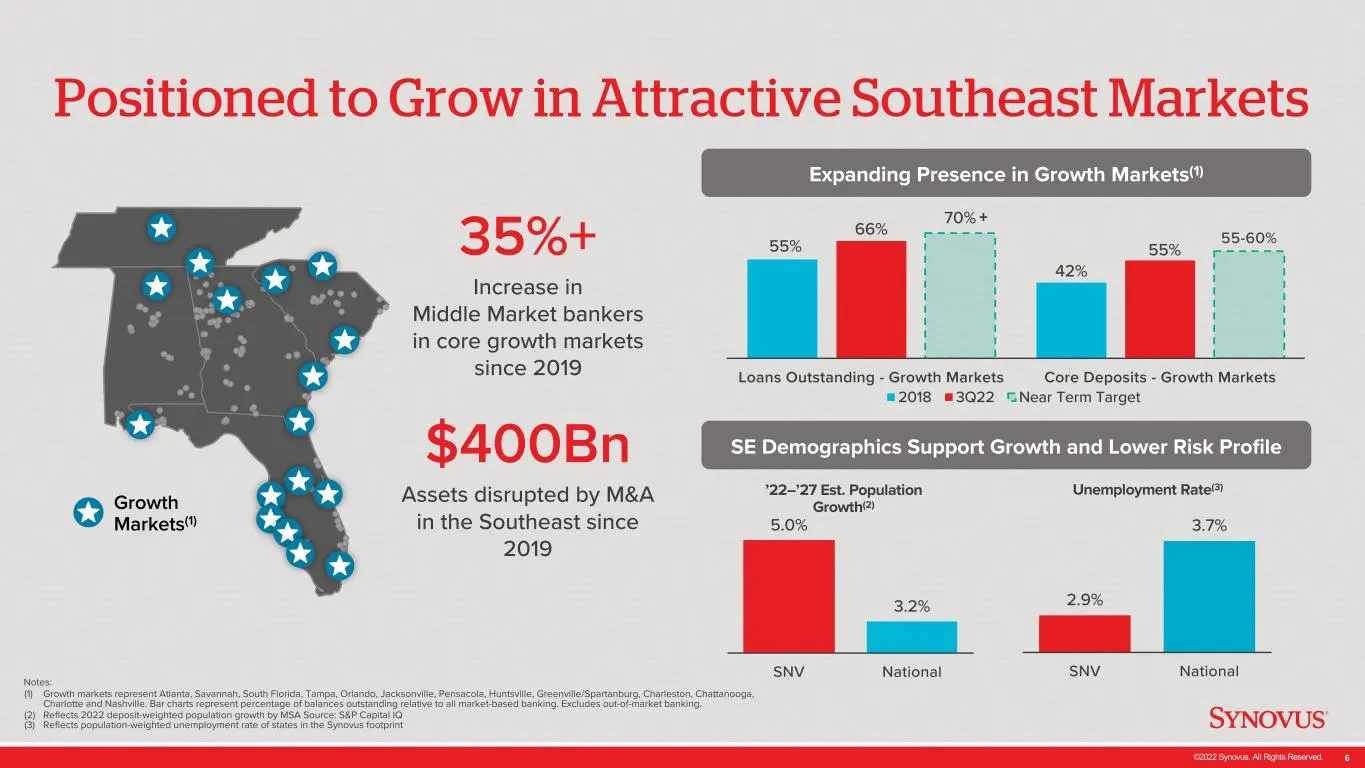
Slide 6: Positioned to Grow in Attractive Southeast Markets
©2022 Synovus. All Rights Reserved. 6 Positioned to Grow in Attractive Southeast Markets Expanding Presence in Growth Markets(1) 35%+ Increase in Middle Market bankers in core growth markets since 2019 SE Demographics Support Growth and Lower Risk Profile Assets disrupted by M&A in the Southeast sin
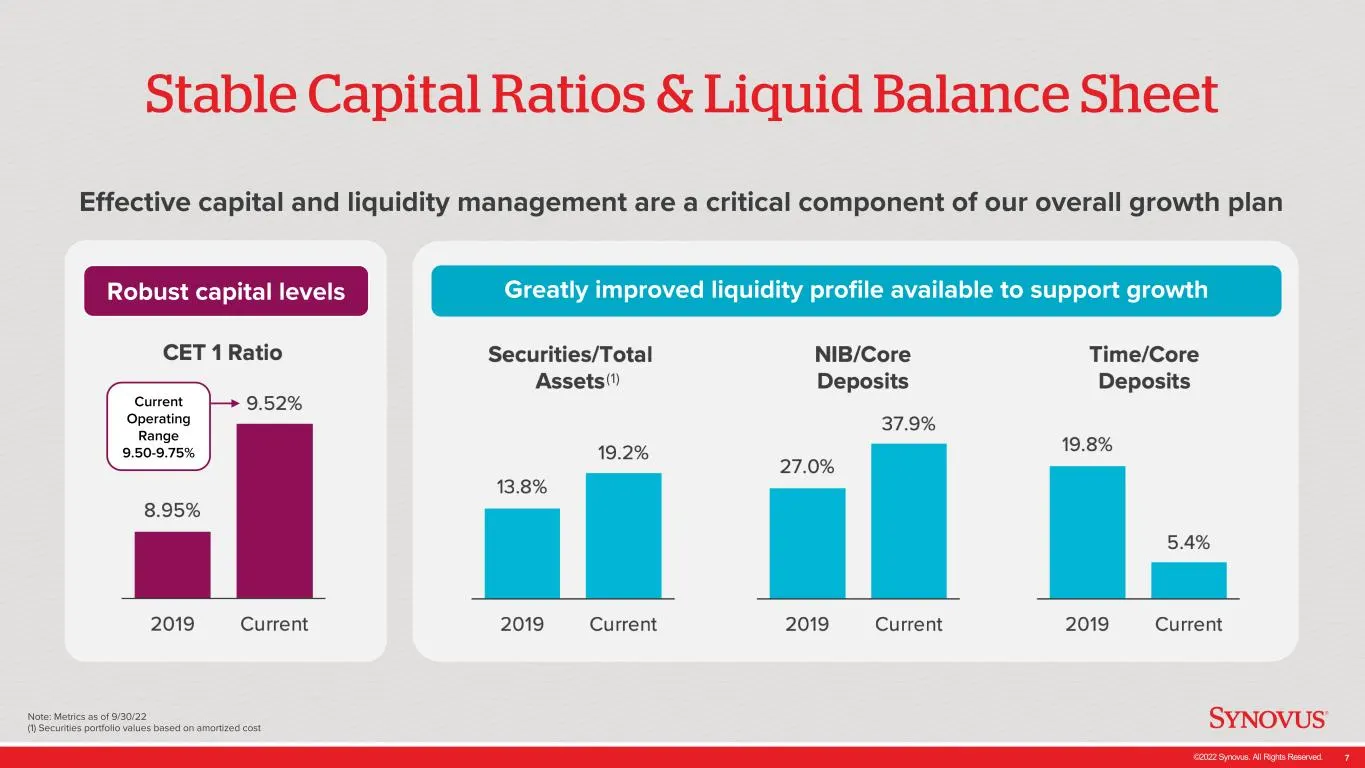
Slide 7: Stable Capital Ratios & Liquid Balance Sheet
©2022 Synovus. All Rights Reserved. 7 Note: Metrics as of 9/30/22 (1) Securities portfolio values based on amortized cost Stable Capital Ratios & Liquid Balance Sheet Current Operating Range 9.50-9.75% Effective capital and liquidity management are a critical component of our overall growth plan Rob
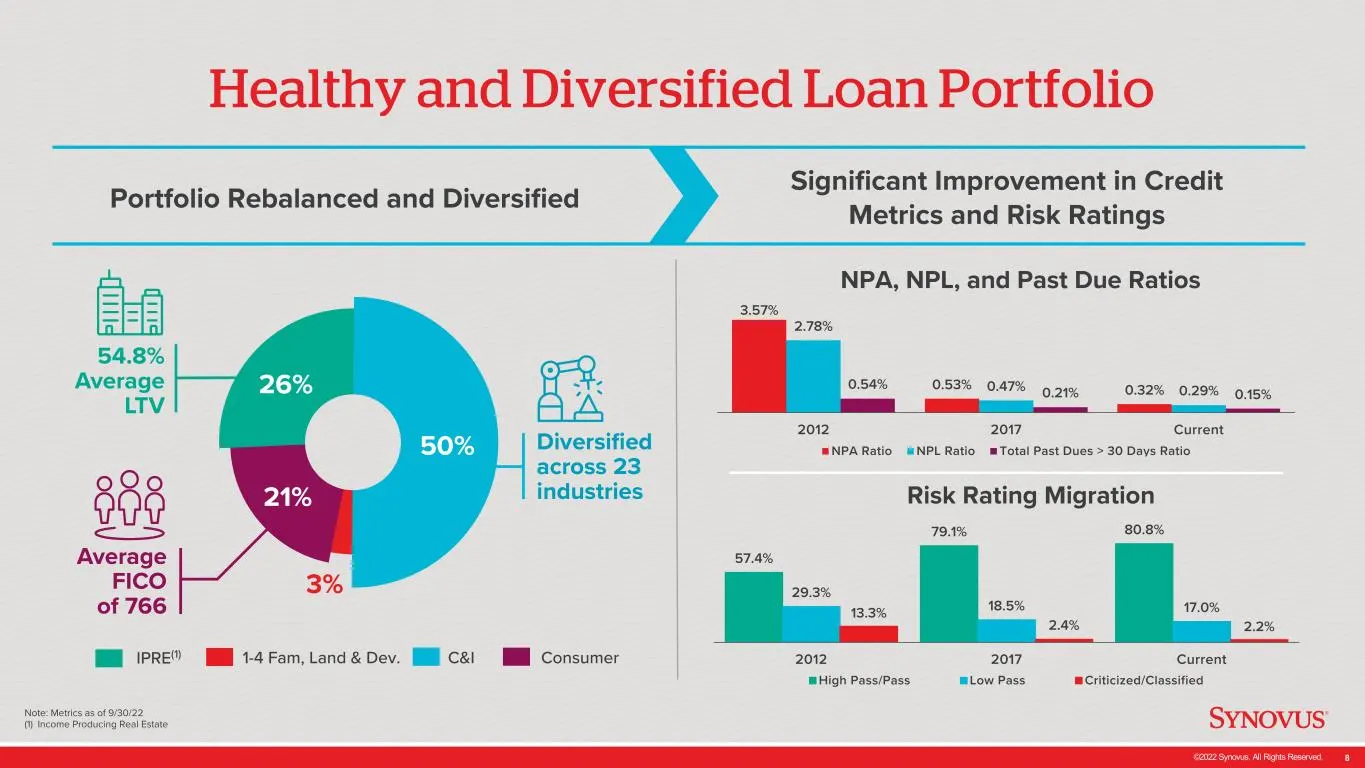
Slide 8: Healthy and Diversified Loan Portfolio
©2022 Synovus. All Rights Reserved. 8 Healthy and Diversified Loan Portfolio Note: Metrics as of 9/30/22 (1) Income Producing Real Estate 3.57% 0.53% 0.32% 2.78% 0.47% 0.29%0.54% 0.21% 0.15% 2012 2017 Current NPA Ratio NPL Ratio Total Past Dues > 30 Days Ratio 57.4% 79.1% 80.8% 29.3% 18.5% 17.0%13.3
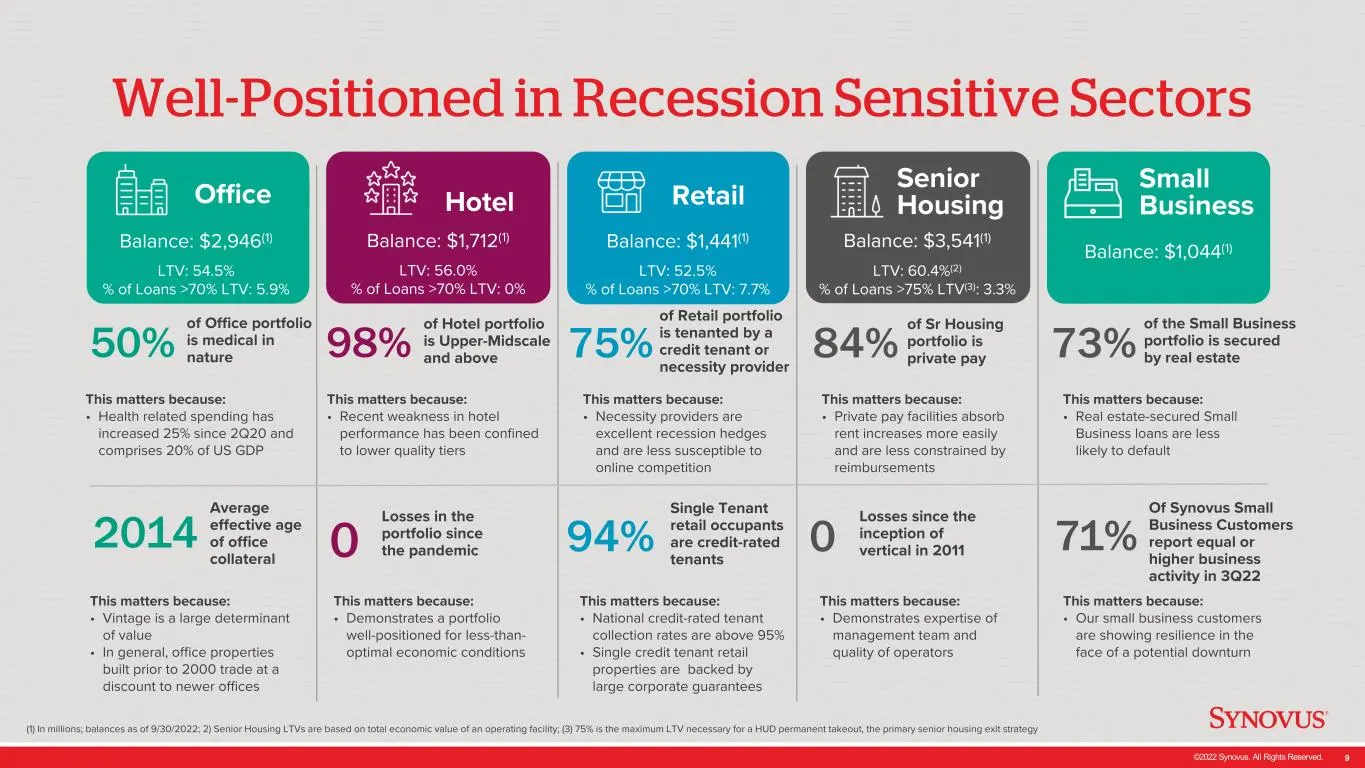
Slide 9: Income-producing real estate portfolio composition
©2022 Synovus. All Rights Reserved. 9 2014 Office 50% This matters because: • Health related spending has increased 25% since 2Q20 and comprises 20% of US GDP of Office portfolio is medical in nature Average effective age of office collateral This matters because: • Vintage is a large determinant of
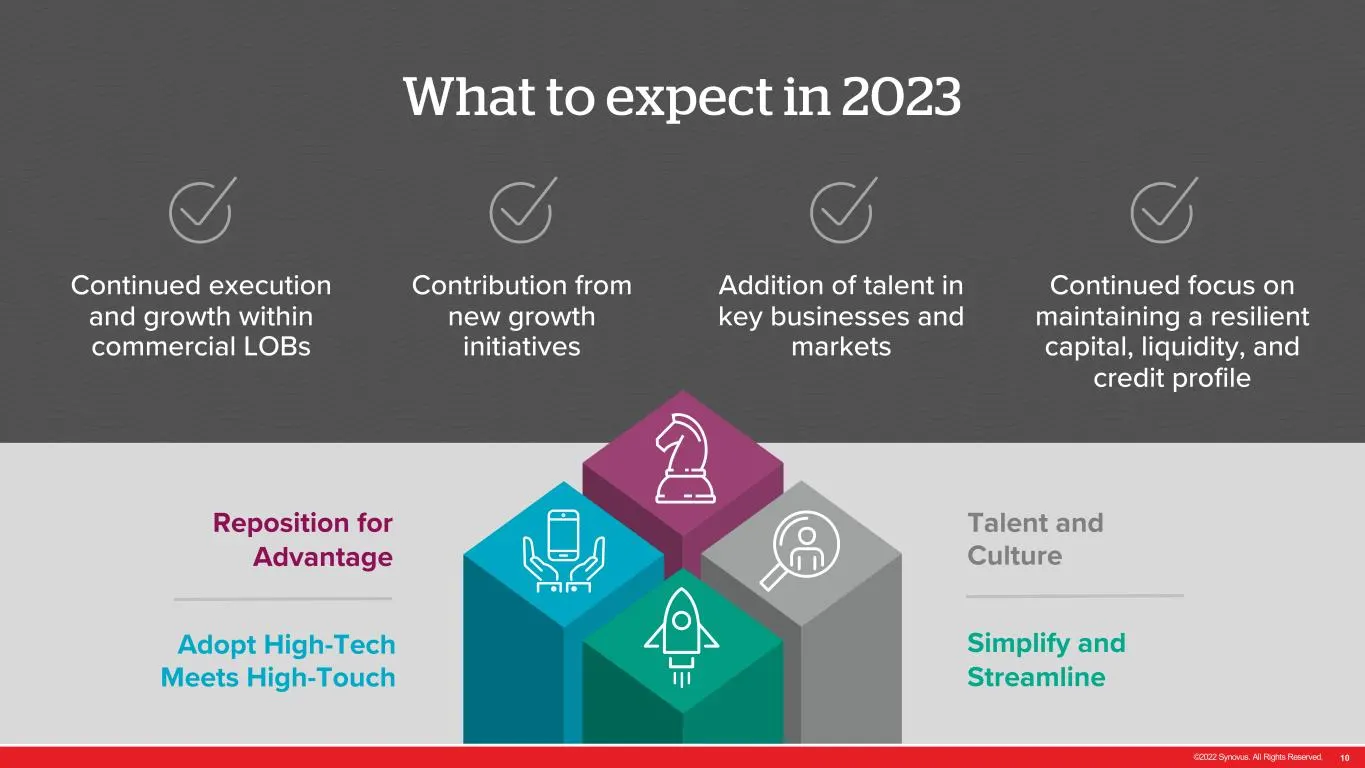
Slide 10: What to expect in 2023
©2022 Synovus. All Rights Reserved. 10 What to expect in 2023 Reposition for Advantage Simplify and Streamline Adopt High-Tech Meets High-Touch Talent and Culture Continued focus on maintaining a resilient capital, liquidity, and credit profile Contribution from new growth initiatives Addition of ta
Source: SEC EDGAR · 8-K filed Dec 6, 2022
More decks from Synovus Financial Corp
 Goldman Sachs 2025 Financial Services Conference15 slides · Dec 8, 2025
 Debt Investor Presentation (December 2025)9 slides · Dec 1, 2025
 Merger or Acquisition (November 2025)5 slides · Nov 26, 2025
 Merger or Acquisition (November 2025)6 slides · Nov 6, 2025
 Q3 2025 Earnings Presentation47 slides · Oct 16, 2025
 Merger or Acquisition (August 2025)27 slides · Aug 28, 2025