Talx — RBC Capital Markets North American Technology Conference 2005
19 slides from Talx's conference presentation, Aug 2, 2005
Slide 1: TALX Corporation: A Leader in Payroll/HR Outsourcing
RBC Capital Markets North American Technology Conference August 2005 TALX Corporation A Leader in Payroll/HR Outsourcing
Slide 2: Safe Harbor Statement
Safe Harbor Statement Statements expressing or indicating the beliefs and expectations of management regarding future performance are forward-looking statements including, without limitation, favorable operating trends, anticipated revenue and earnings for the fiscal year ending March 31, 2006, and
Slide 3: A Leader in Payroll/HR Outsourcing
A Leader in Payroll/HR Outsourcing TALX is a leading Business Process Outsourcer (BPO) bringing clients significant savings by replacing manual, paper-based Payroll/HR methods with electronic-based outsourced services. Business Model Standard services and processes Contractual and transaction-driven
Slide 4: Key Investment Highlights
Key Investment Highlights Market leadership in two payroll and human resources areas Employment and income verification Tax management services Diversified client base (no one client > 5% of revenue) Proven business model Revenue growth (recurring and predictable) EPS growth (continuing operations)
Slide 5: Revenue and Earnings Per Share Growth (Continuing Operations)
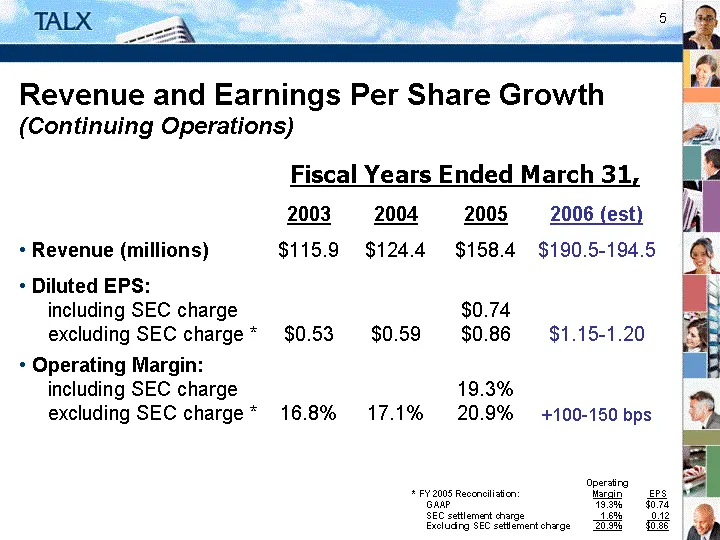
Revenue and Earnings Per Share Growth (Continuing Operations) 2003 2004 2005 2006 (est) Revenue (millions) $115.9 $124.4 $158.4 $190.5-194.5 Diluted EPS: including SEC charge excluding SEC charge * $0.53 $0.59 $0.74 $0.86 $1.15-1.20 Operating Margin: including SEC charge excluding SEC charge * 16.8%
Slide 6: The Work Number and Tax Management Services
Slide 7: In-house Versus Outsourced Payroll
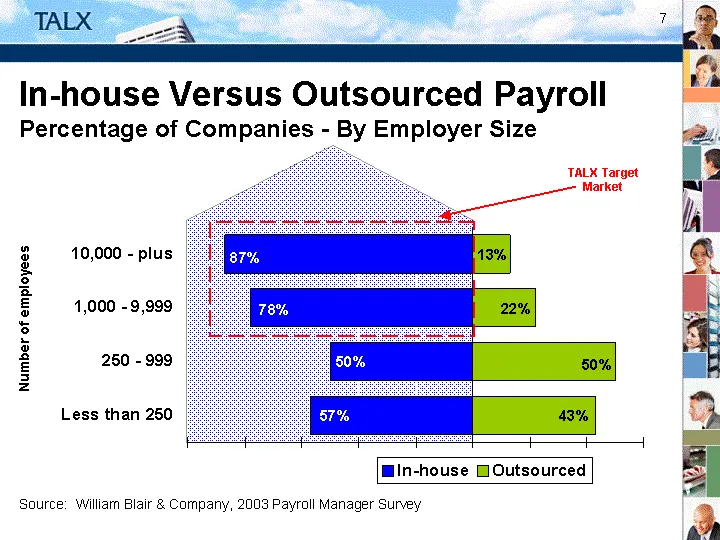
In-house Versus Outsourced Payroll Percentage of Companies - By Employer Size # of employees In-house Outsourced Less than 250 -0.57 0.43 250 - 999 -0.5 0.5 1,000 - 9,999 -0.78 0.22 10,000 - plus -0.87 0.13 Source: William Blair & Company, 2003 Payroll Manager Survey Number of employees TALX Target
Slide 8: Services Overview and Revenue Share
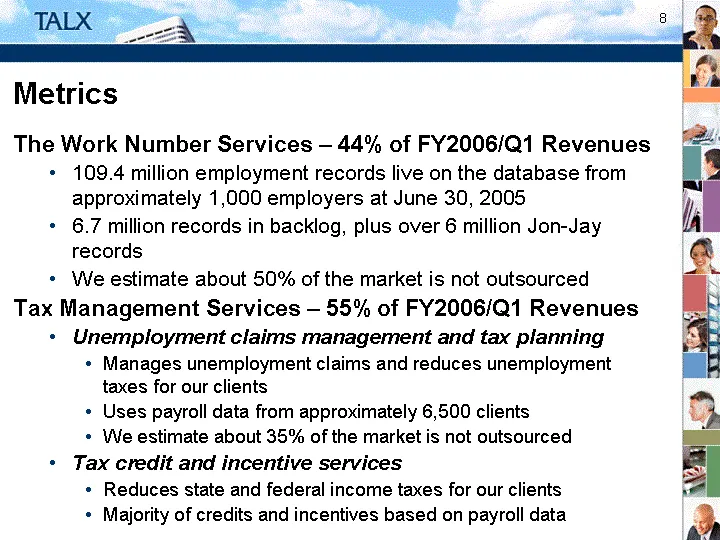
Metrics The Work Number Services - 44% of FY2006/Q1 Revenues 109.4 million employment records live on the database from approximately 1,000 employers at June 30, 2005 6.7 million records in backlog, plus over 6 million Jon-Jay records We estimate about 50% of the market is not outsourced Tax Managem
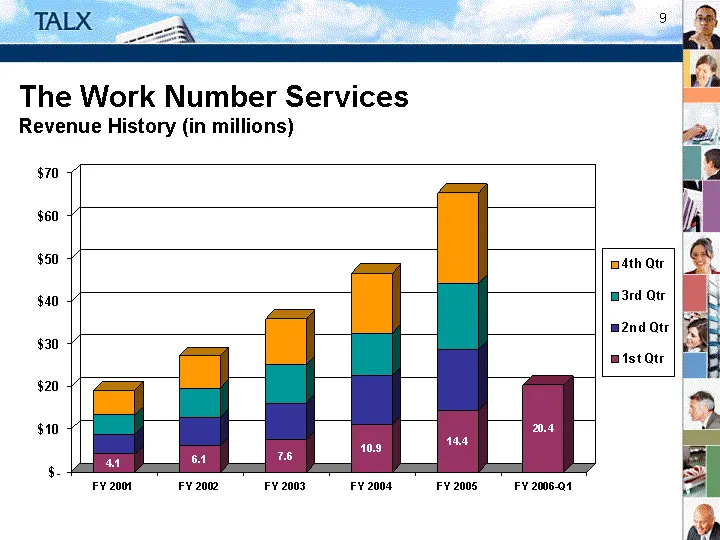
Slide 9: Services Revenue History
The Work Number Services Revenue History (in millions) FY 2001 Qtr 2 01 Qtr 3 01 Qtr 4 01 FY 2002 Qtr 2 02 Qtr 3 02 Qtr 4 02 FY 2003 Qtr 2 03 Qtr 3 03 Qtr 4 03 FY 2004 Qtr 2 04 Qtr 3 04 Qtr 4 04 FY 2005 Qtr 2 05 Qtr 3 05 Qtr 4 05 FY 2006-Q1 1st Qtr 4.132 19.094 6.103 27.184 7.617 35.934 10.943 46.60
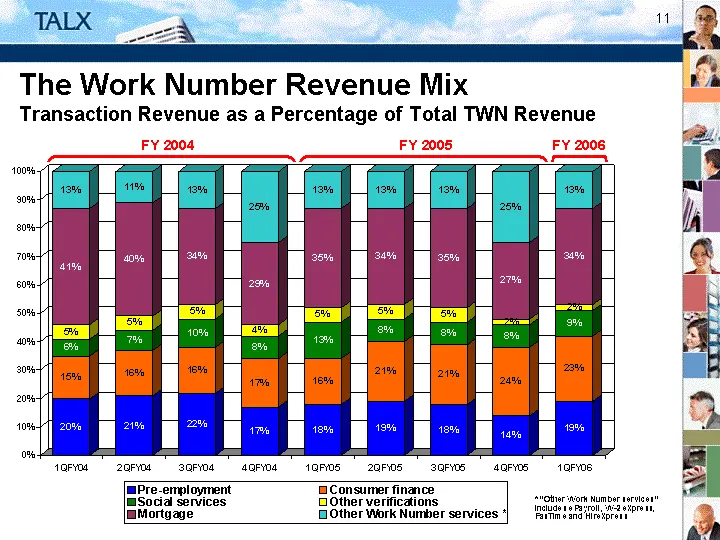
Slide 10: Revenue Mix
The Work Number Revenue Mix Transaction Revenue as a Percentage of Total TWN Revenue 1QFY03 2QFY03 3QFY03 4QFY03 1QFY04 2QFY04 3QFY04 4QFY04 1QFY05 2QFY05 3QFY05 4QFY05 1QFY06 Pre-employment 0.35 0.33 0.27 0.19 0.2 0.21 0.22 0.17 0.18 0.19 0.18 0.14 0.19 Consumer finance 0.12 0.14 0.16 0.16 0.15 0.1
Slide 11: Growth Drivers
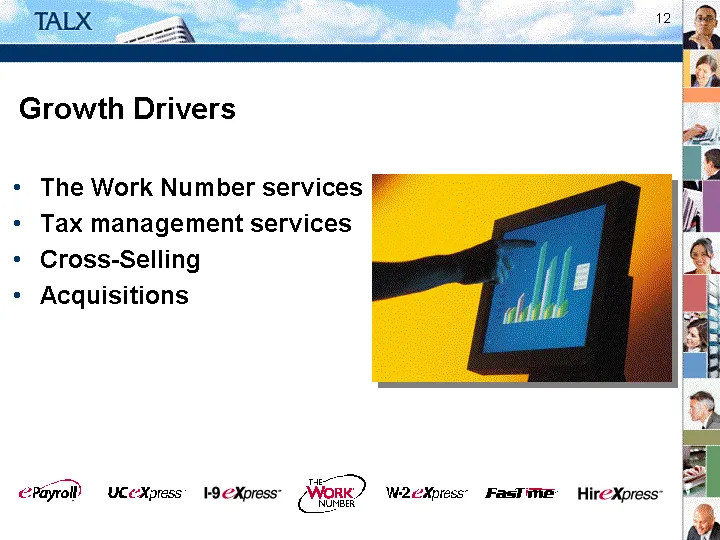
Growth Drivers The Work Number services Tax management services Cross-Selling Acquisitions Acquisitions Acquisitions Acquisitions Acquisitions
Slide 12: Growth Initiatives: The Work Number Services
Growth Initiatives The Work Number Services Add records to the database Direct sales Partner with HR outsourcers and payroll providers Add new verifiers Regular price increases Add new applications Expand REACH within existing verifier clients Expand usage in verifiers with multiple locations Integr
Slide 13: Growth Initiatives: Tax Management Services
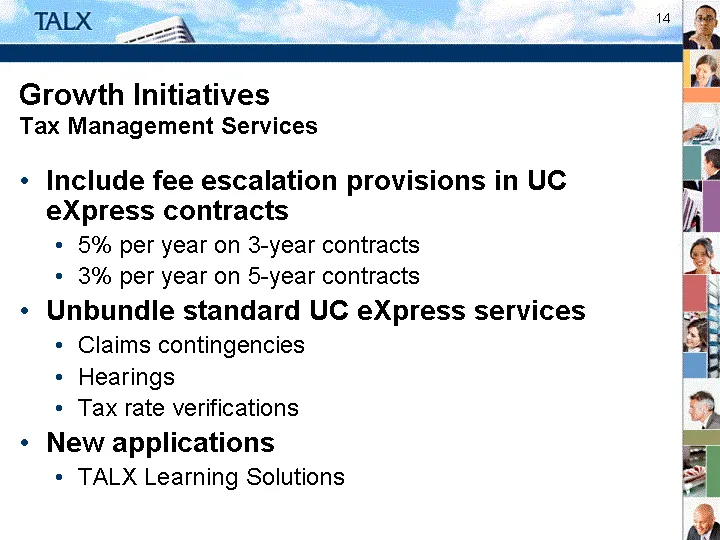
Growth Initiatives Tax Management Services Include fee escalation provisions in UC eXpress contracts 5% per year on 3-year contracts 3% per year on 5-year contracts Unbundle standard UC eXpress services Claims contingencies Hearings Tax rate verifications New applications TALX Learning Solutions
Slide 14: Growth Initiatives - Acquisitions
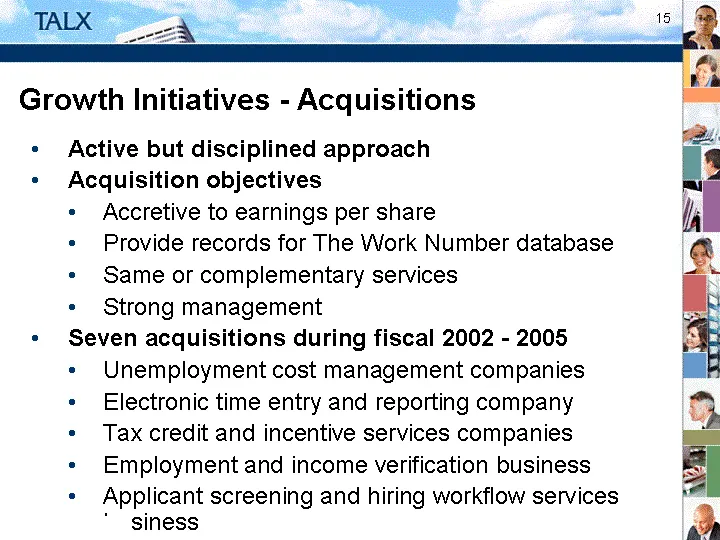
Growth Initiatives - Acquisitions Active but disciplined approach Acquisition objectives Accretive to earnings per share Provide records for The Work Number database Same or complementary services Strong management Seven acquisitions during fiscal 2002 - 2005 Unemployment cost management companies E
Slide 15: Growth Initiatives - Acquisitions Fiscal 2006 Year-to-Date
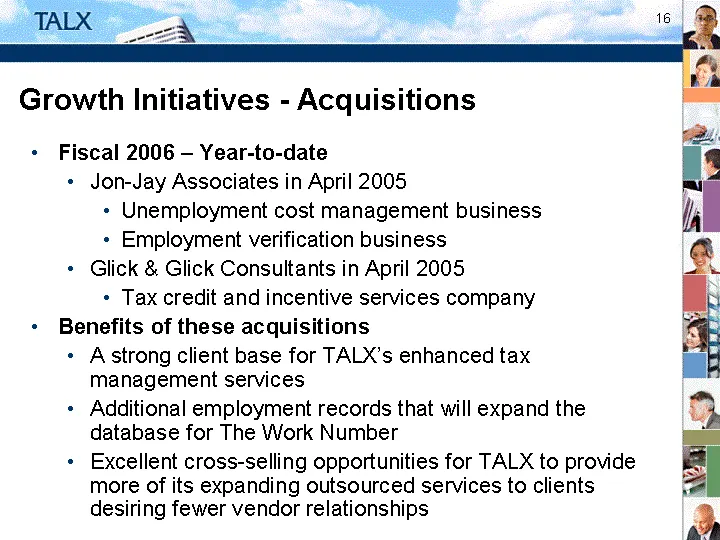
Growth Initiatives - Acquisitions Fiscal 2006 - Year-to-date Jon-Jay Associates in April 2005 Unemployment cost management business Employment verification business Glick & Glick Consultants in April 2005 Tax credit and incentive services company Benefits of these acquisitions A strong client base f
Slide 16: Revenues
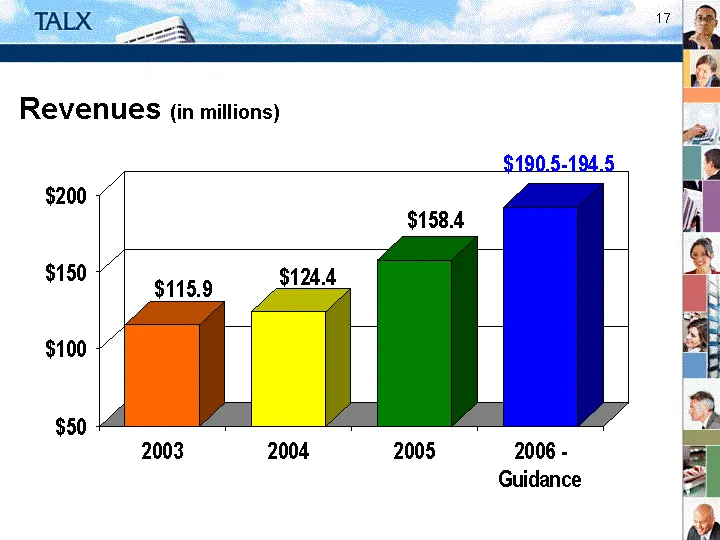
Revenues (in millions) 2002 2003 2004 2005 2006 - Guidance Revenue 35.4 115.9 124.4 158.4 192.5
Slide 17: Margins
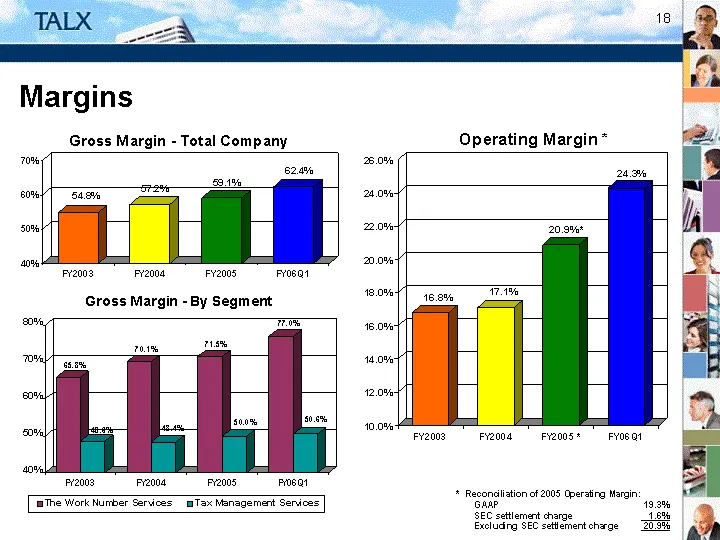
Margins FY2002 FY2003 FY2004 FY2005 FY06Q1 Gross margin 0.611 0.548 0.572 0.591 0.624 FY2002 FY2003 FY2004 FY2005 FY06Q1 The Work Number Services 0.657 0.658 0.701 0.715 0.77 Tax Management Services 0.486 0.484 0.5 0.506 FY2002 FY2003 FY2004 FY2005 * FY06Q1 Operating margin 0.148 0.168 0.171 0.209 0
Slide 18: Earnings From Continuing Operations
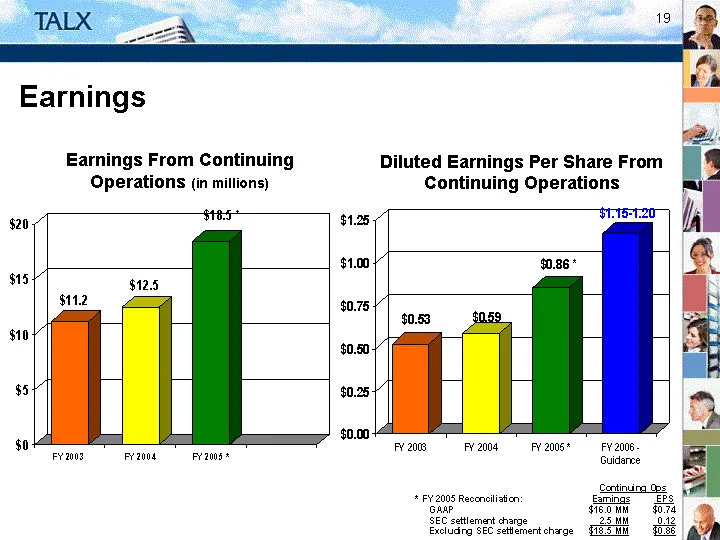
Earnings From Continuing Operations (in millions) FY 2002 FY 2003 FY 2004 FY 2005 * FY 2006 - Guidance 0.21 0.53 0.59 0.86 1.175 FY 2002 FY 2003 FY 2004 FY 2005 * 4.3 11.2 12.5 18.5 Diluted Earnings Per Share From Continuing Operations Earnings Continuing Ops * FY 2005 Reconciliation: Earnings EPS G
Slide 19: Increasing Shareholder Value
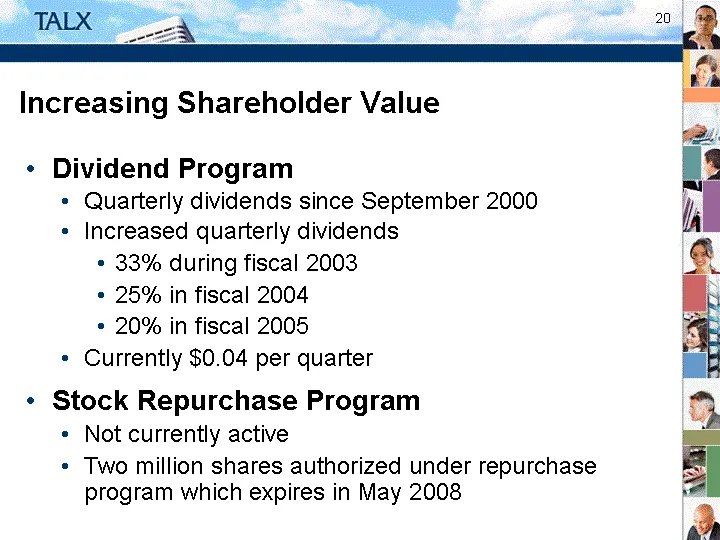
Increasing Shareholder Value Dividend Program Quarterly dividends since September 2000 Increased quarterly dividends 33% during fiscal 2003 25% in fiscal 2004 20% in fiscal 2005 Currently $0.04 per quarter Stock Repurchase Program Not currently active Two million shares authorized under repurchase p
Source: SEC EDGAR · 8-K filed Aug 2, 2005
More decks from Talx Corp
 Q4 FY2007 Earnings Presentation18 slides · May 9, 2007
 Talx — Merger or Acquisition (March 2007)31 slides · Mar 6, 2007
 TALX — Merger or Acquisition (February 2007)31 slides · Feb 28, 2007
 TALX — Merger or Acquisition (February 2007)17 slides · Feb 15, 2007
 Q3 FY2007 Earnings Presentation18 slides · Jan 24, 2007
 Q1 FY2007 Earnings Presentation13 slides · Jul 27, 2006