Enbridge Energy Partners L.P — TD Newcrest Oil Sands Forum 2007
17 slides from Enbridge Energy Partners L.P's conference presentation, Jul 12, 2007
Slide 1: Moving Oilsands Production from Field to Markets
Moving Oilsands Production from Field to Markets TD Newcrest Oil Sands Forum 2007 July 12, 2007 J. Richard Bird Executive Vice President Liquids Pipelines
Slide 2: Forward Looking Statements
Certain information provided in this presentation constitutes forward-looking statements. The words "anticipate", "expect", "project", "estimate", “forecast" and similar expressions are intended to identify such forward looking statements. Although Enbridge believes that these statements are based o
Slide 3: WCSB Production and Disposition
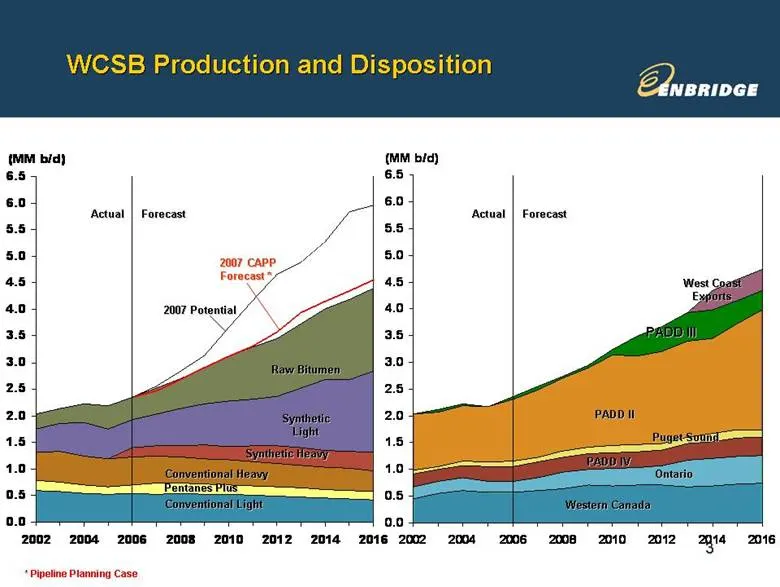
Western Canada Puget Sound PADD IV Ontario PADD II Actual Forecast West Coast Exports PADD III Conventional Light Synthetic Light Raw Bitumen Conventional Heavy Pentanes Plus Synthetic Heavy 2007 Potential 2007 CAPP Forecast * WCSB Production and Disposition Actual Forecast * Pipeline Planning Case
Slide 4: Additional Demand for Canadian Heavy by 2016
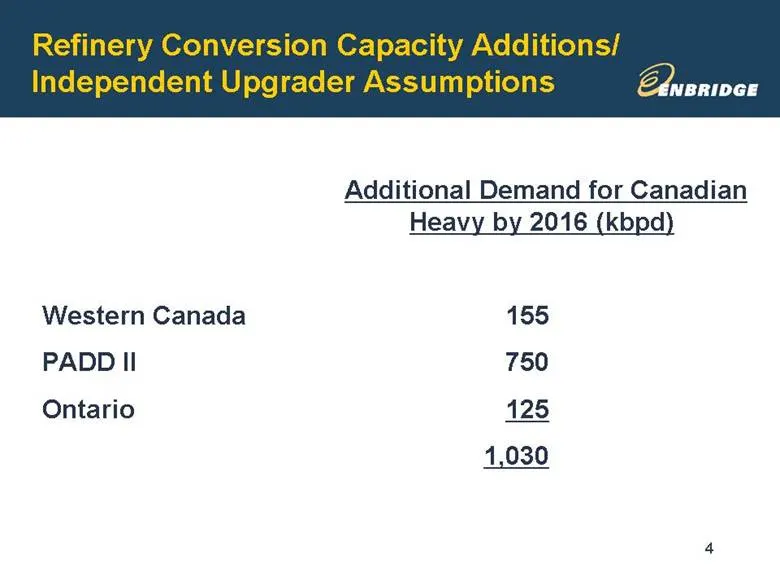
Refinery Conversion Capacity Additions/ Independent Upgrader Assumptions Additional Demand for Canadian Heavy by 2016 (kbpd) Western Canada 155 PADD II 750 Ontario 125 1,030
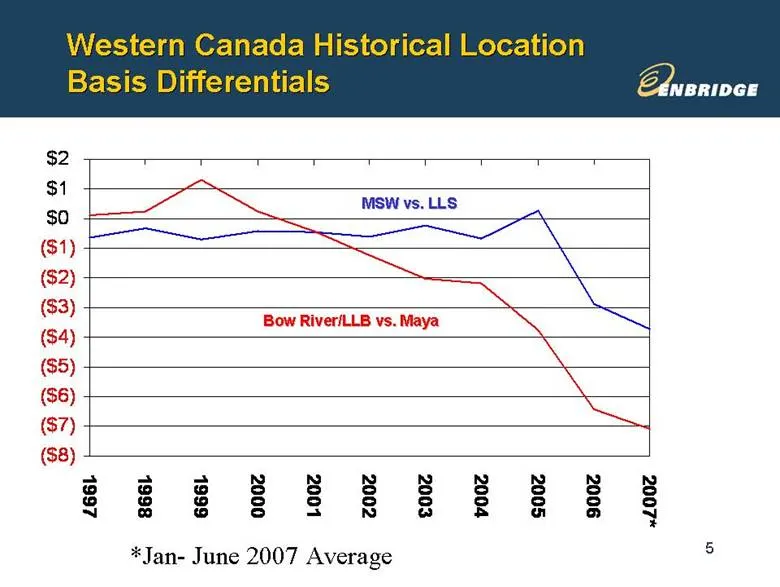
Slide 5: Western Canada Historical Location Basis Differentials
Western Canada Historical Location Basis Differentials Bow River/LLB vs. Maya MSW vs. LLS *Jan- June 2007 Average ($8) ($7) ($6) ($5) ($4) ($3) ($2) ($1) $0 $1 $2 1997 1998 1999 2000 2001 2002 2003 2004 2005 2006 2007*
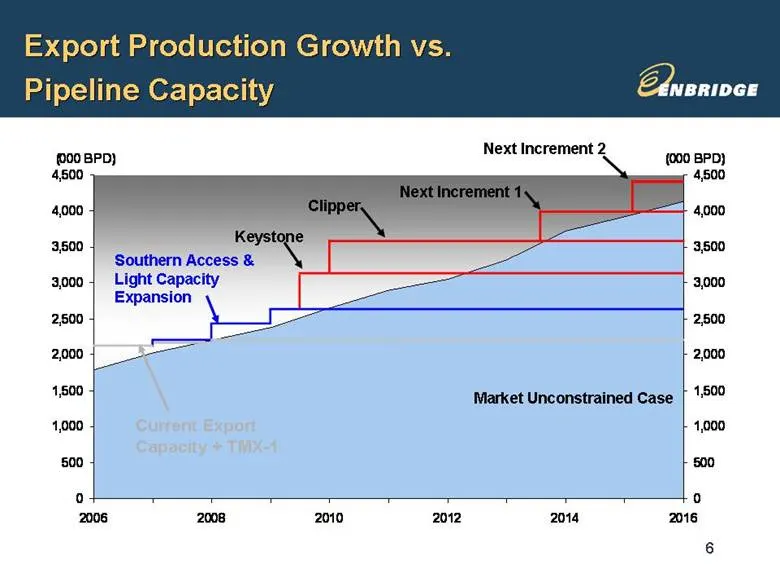
Slide 6: Export Production Growth vs. Pipeline Capacity
Export Production Growth vs. Pipeline Capacity Market Unconstrained Case Southern Access & Light Capacity Expansion Clipper Keystone Current Export Capacity + TMX-1 Next Increment 1 Next Increment 2 0 500 1,000 1,500 2,000 2,500 3,000 3,500 4,000 4,500 2006 2008 2010 2012 2014 2016 (000 BPD) 0 500 1
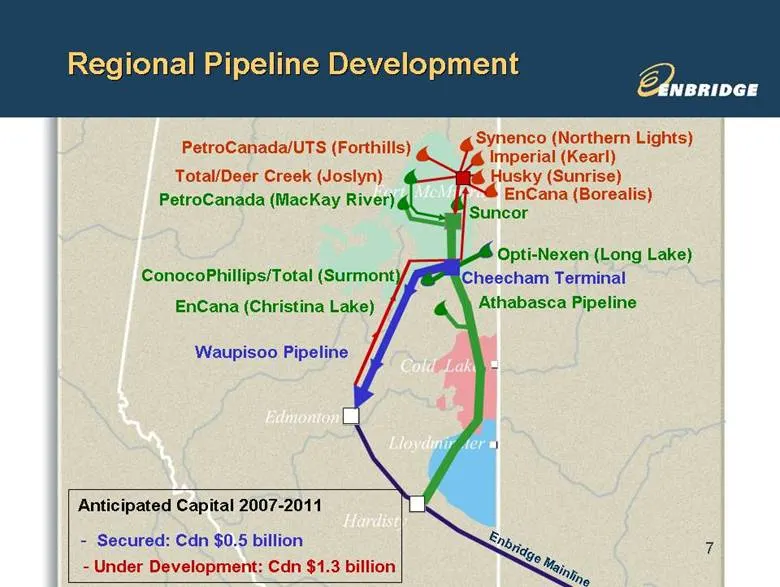
Slide 7: Regional Pipeline Development
EnCana (Christina Lake) PetroCanada (MacKay River) Athabasca Pipeline Suncor Enbridge Mainline Anticipated Capital 2007-2011 Under Development: Cdn $1.3 billion PetroCanada/UTS (Forthills) Synenco (Northern Lights) Husky (Sunrise) Total/Deer Creek (Joslyn) Imperial (Kearl) EnCana (Borealis) Regional
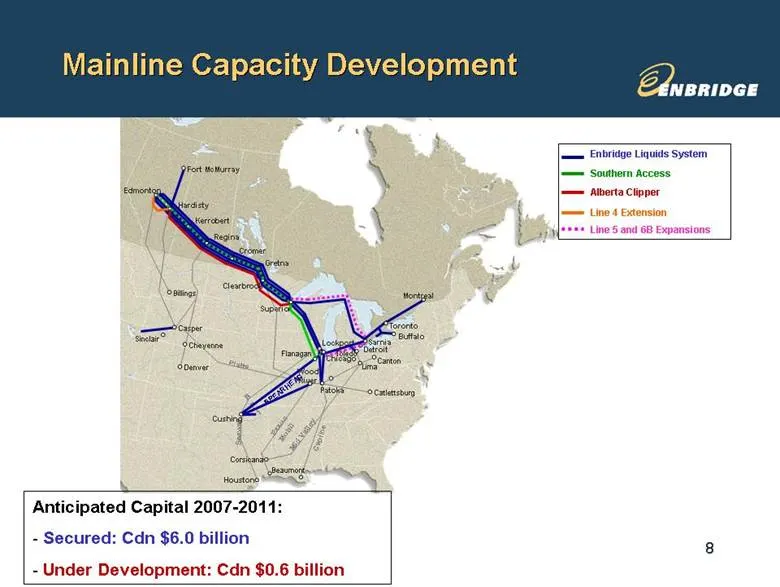
Slide 8: Mainline Capacity Development
Mainline Capacity Development Fort McMurray Montreal Toronto Gretna Regina Hardisty Kerrobert Cromer Superior Toledo Sarnia Buffalo Edmonton Lockport Flanagan Wood River Houston Exxon Mobil Capline Lima Canton Catlettsburg Mid Valley Detroit Billings Casper Sinclair Cheyenne Denver Seaway BP1 Platte
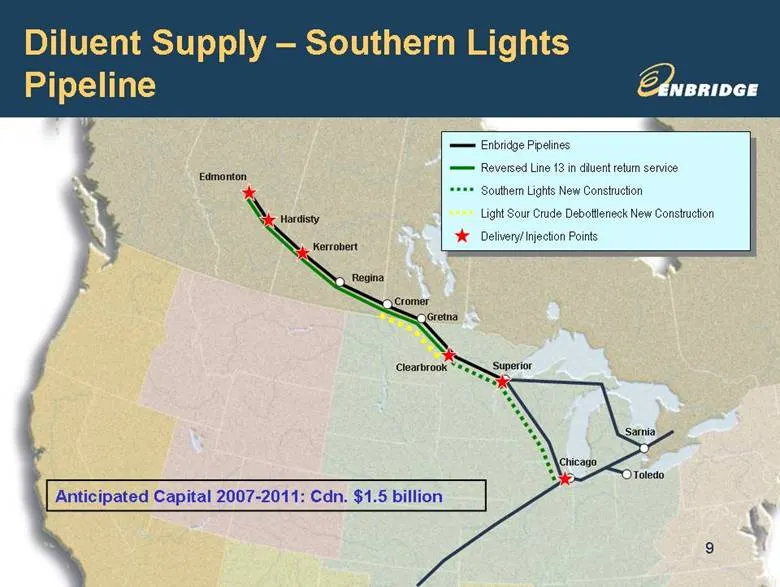
Slide 9: Diluent Supply – Southern Lights Pipeline
Gretna Regina Cromer Clearbrook Superior Toledo Sarnia Chicago Kerrobert Hardisty Edmonton Diluent Supply – Southern Lights Pipeline Enbridge Pipelines Reversed Line 13 in diluent return service Southern Lights New Construction Light Sour Crude Debottleneck New Construction Delivery/ Injection Point
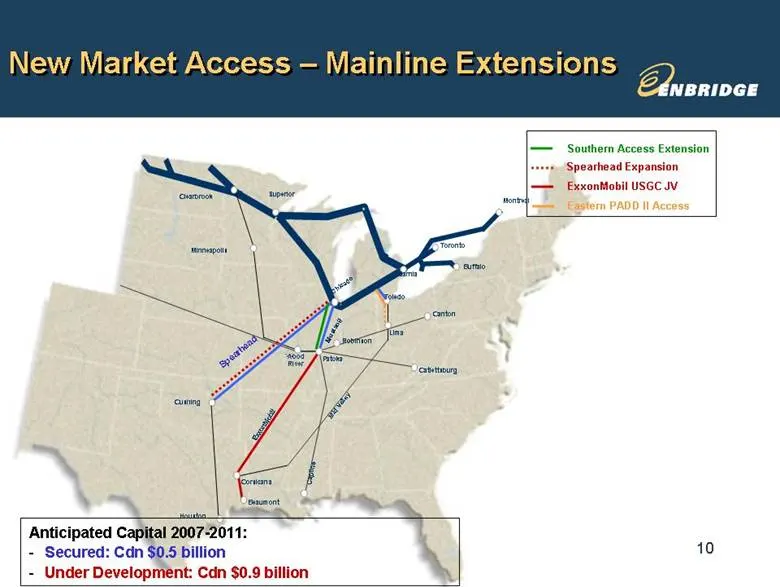
Slide 10: New Market Access – Mainline Extensions
Superior Buffalo Minneapolis Clearbrook Toronto Montreal Corsicana Beaumont Catlettsburg Canton Toledo Cushing Patoka Capline ExxonMobil Mid Valley Chicago Lima Houston Robinson Sarnia Wood River Spearhead New Market Access – Mainline Extensions Mustang Southern Access Extension Spearhead Expansion
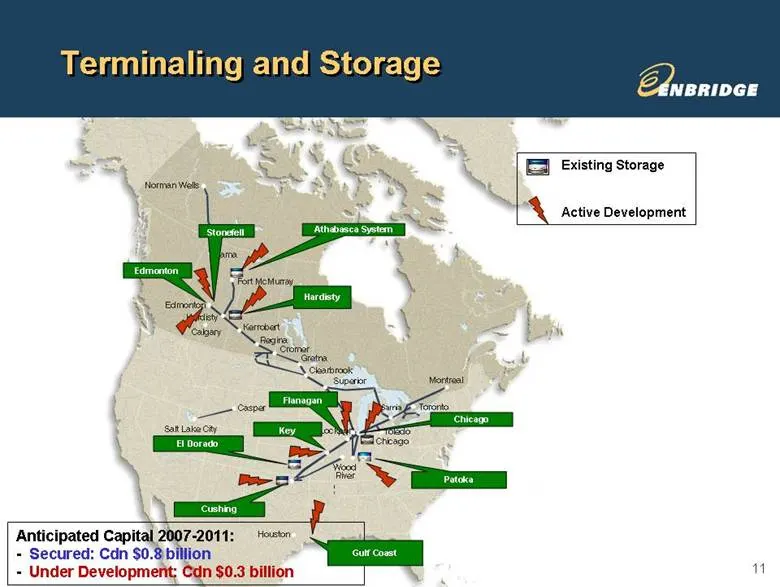
Slide 11: Terminaling and Storage
Anticipated Capital 2007-2011: - Secured: Cdn $0.8 billion - Under Development: Cdn $0.3 billion Terminaling and Storage Zama Fort McMurray Montreal Toronto Sarnia Gretna Regina Hardisty Calgary Kerrobert Cromer Casper Houston Clearbrook Superior Salt Lake City Toledo Edmonton Norman Wells Chicago L
Slide 12: Longer Term New Market Access Options
Longer Term New Market Access Options Gateway Pipeline Project U.S. Gulf Coast Direct U.S. East Coast/Philadelphia
Slide 13: Liquids Pipelines Project Risk/Return Features
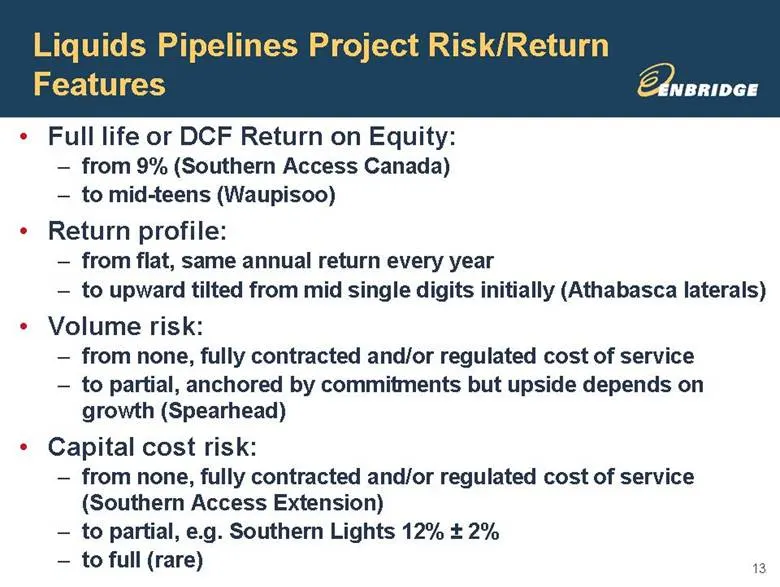
Full life or DCF Return on Equity: from 9% (Southern Access Canada) to mid-teens (Waupisoo) Return profile: from flat, same annual return every year to upward tilted from mid single digits initially (Athabasca laterals) Volume risk: from none, fully contracted and/or regulated cost of service to par
Slide 14: Liquids Pipelines Project Risk/Return Portfolio
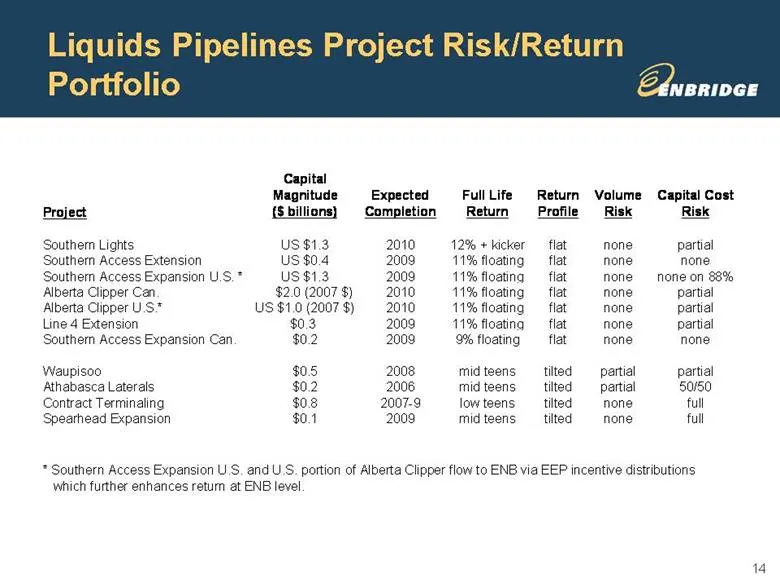
Liquids Pipelines Project Risk/Return Portfolio Project Capital Magnitude ($ billions) Expected Completion Full Life Return Return Profile Volume Risk Capital Cost Risk Southern Lights US $1.3 2010 12% + kicker flat none partial Southern Access Extension US $0.4 2009 11% floating flat none none Sout
Slide 15: Key Project Execution Variables
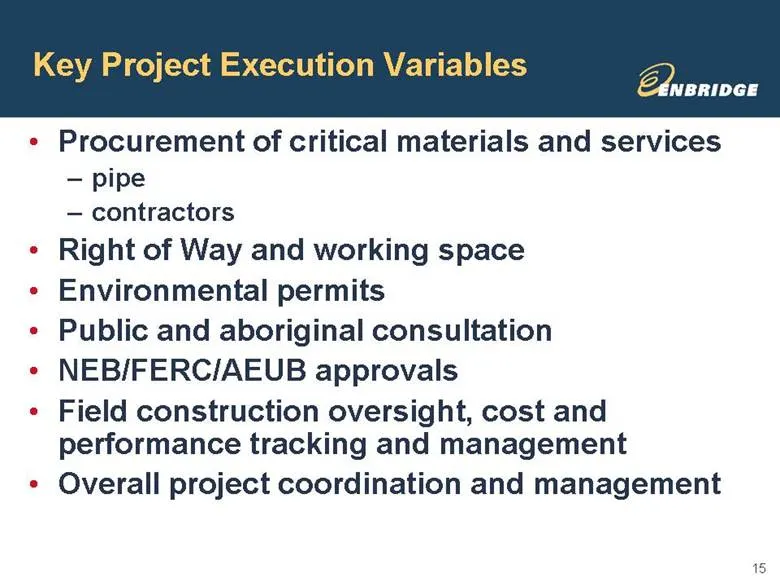
Procurement of critical materials and services pipe contractors Right of Way and working space Environmental permits Public and aboriginal consultation NEB/FERC/AEUB approvals Field construction oversight, cost and performance tracking and management Overall project coordination and management Key P
Slide 16: Project Execution Organization Structure
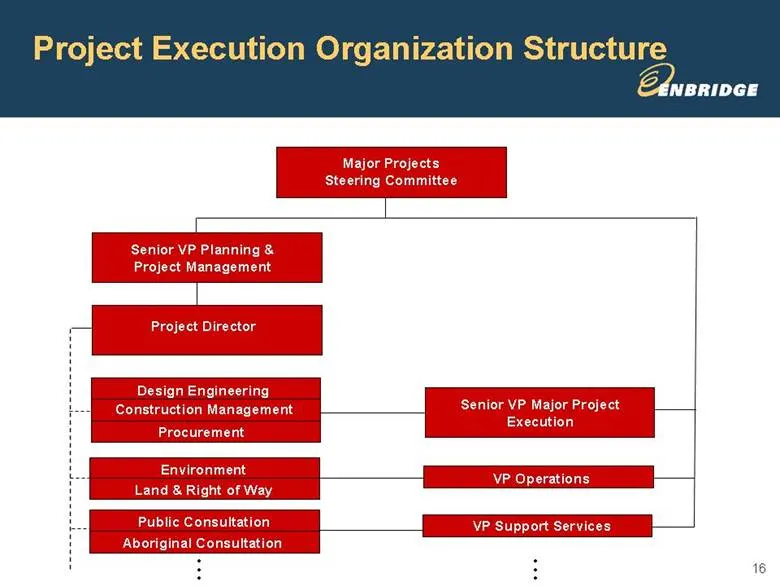
Project Execution Organization Structure Major Projects Steering Committee Senior VP Planning & Project Management Project Director Design Engineering Construction Management Procurement Environment Public Consultation Senior VP Major Project Execution VP Operations VP Support Services • • • • • • L
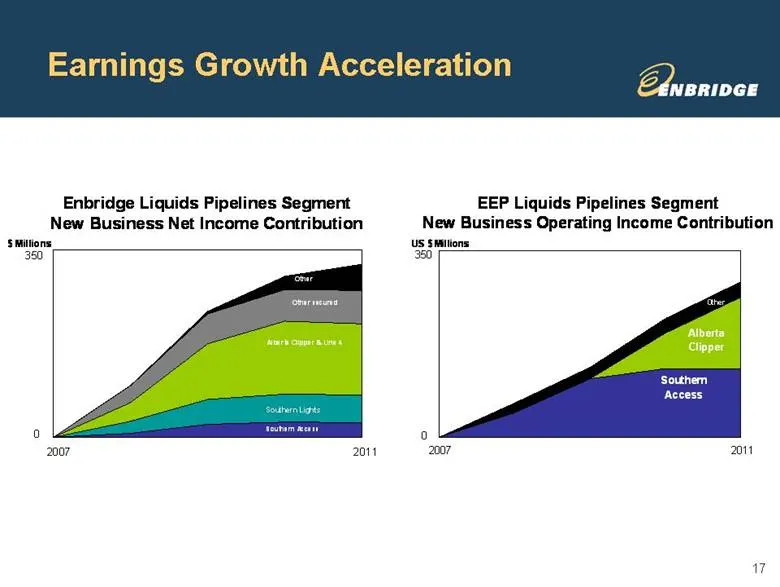
Slide 17: Earnings Growth Acceleration
Earnings Growth Acceleration EEP Liquids Pipelines Segment New Business Operating Income Contribution Southern Access Alberta Clipper Other US $ Millions 350 0 2011 2007 Enbridge Liquids Pipelines Segment New Business Net Income Contribution $ Millions 350 0 2007 2011
Source: SEC EDGAR · 8-K filed Jul 12, 2007
More decks from Enbridge Energy Partners L.P
 Q3 2018 Earnings Presentation22 slides · Nov 2, 2018
 Merger or Acquisition (September 2018)38 slides · Sep 25, 2018
 Merger or Acquisition (May 2018)8 slides · May 18, 2018
 Corporate Update (January 2017)6 slides · Jan 27, 2017
 Investor Presentation (March 2008)48 slides · Mar 11, 2008
 Q3 2007 Earnings Presentation29 slides · Oct 30, 2007