First Niagara Financial Group Inc
First Niagara Financial — Sterne Agee Financial Institutions Investor Conference 2012
29 slides from First Niagara Financial's conference presentation, Feb 13, 2012
Slide 1: The Differentiated Choice -- Performance and Position
The Differentiated Choice -- Performance and Position Gregory W. Norwood Chief Financial Officer Sterne Agee Financial Institutions Investor Conference February 13, 2012
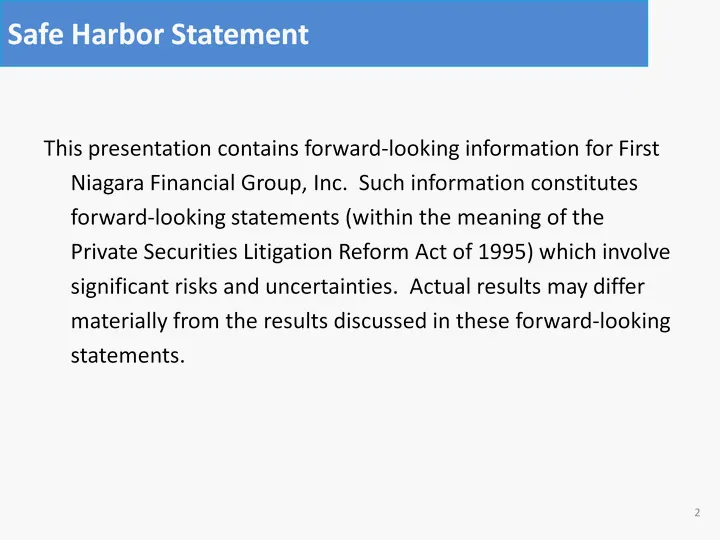
Slide 2: Safe Harbor Statement
This presentation contains forward-looking information for First Niagara Financial Group, Inc. Such information constitutes forward-looking statements (within the meaning of the Private Securities Litigation Reform Act of 1995) which involve significant risks and uncertainties. Actual results may di
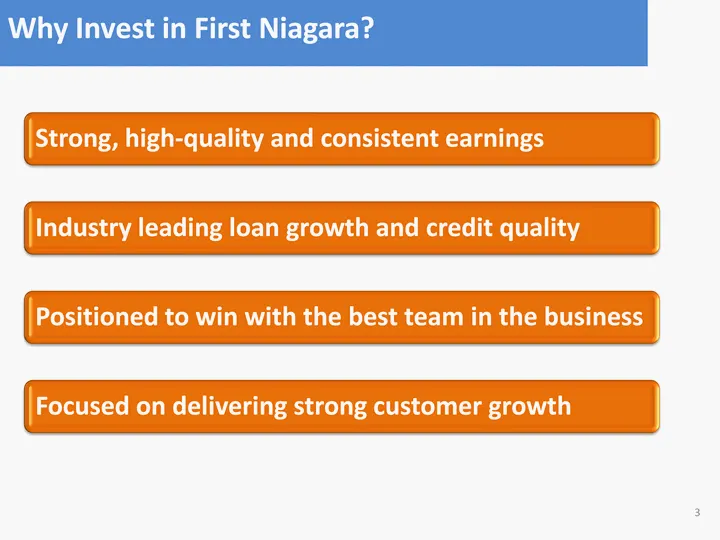
Slide 3: Why Invest in First Niagara?
Why Invest in First Niagara? Why Invest in First Niagara? 3
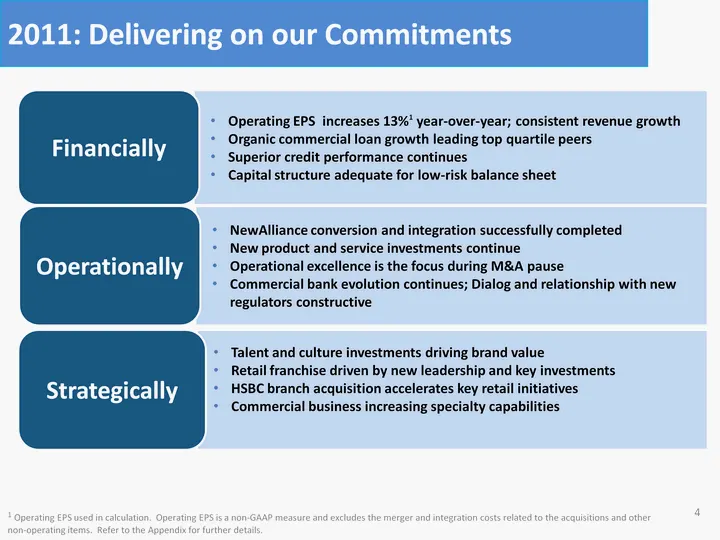
Slide 4: 2011: Delivering on our Commitments
Operating EPS increases 13%1 year-over-year; consistent revenue growth Organic commercial loan growth leading top quartile peers Superior credit performance continues Capital structure adequate for low-risk balance sheet Financially NewAlliance conversion and integration successfully completed New p
Slide 5: Performance
Performance |
Slide 6: Annual Operating Earnings
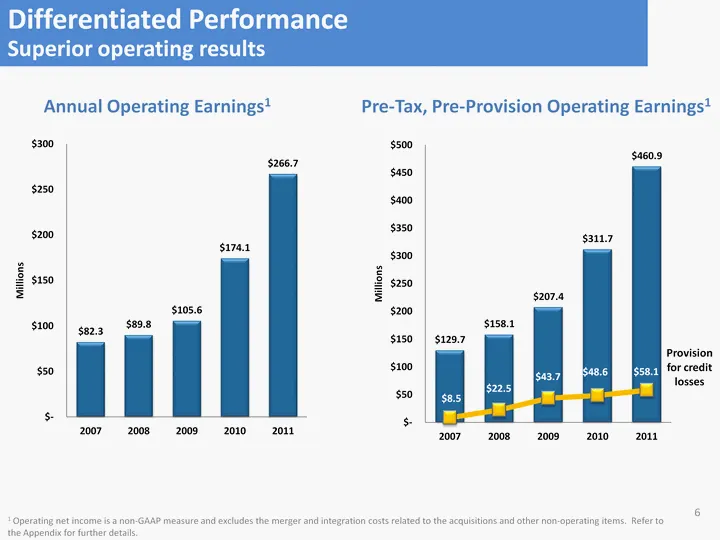
Annual Operating Earnings1 Annual Operating Earnings1 Pre-Tax, Pre-Provision Operating Earnings1 1 Operating net income is a non-GAAP measure and excludes the merger and integration costs related to the acquisitions and other non-operating items. Refer to the Appendix for further details. the Append
Slide 7: Superior earnings growth on a per share basis
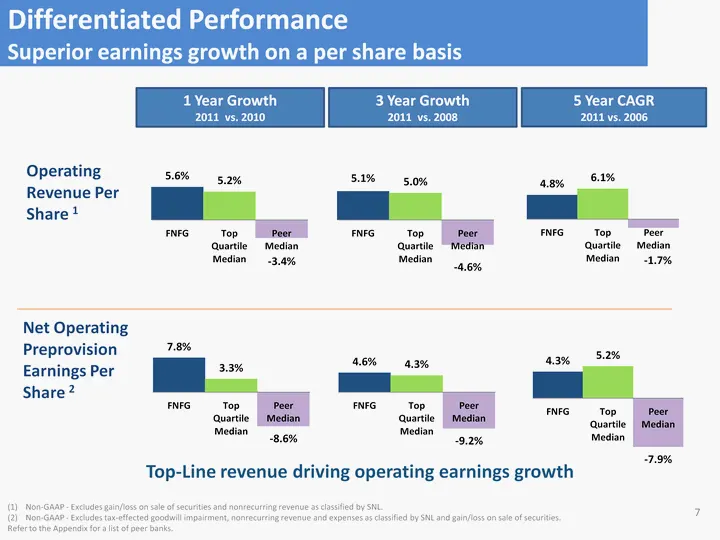
Operating Revenue Per Share 1 Net Operating Preprovision Earnings Per Share 2 1 Year Growth 2011 vs. 2010 5 Year CAGR 2011 vs. 2006 Non-GAAP - Excludes gain/loss on sale of securities and nonrecurring revenue as classified by SNL. Non-GAAP - Excludes tax-effected goodwill impairment, nonrecurring re
Slide 8: Superior Credit Quality is A Key Differentiator
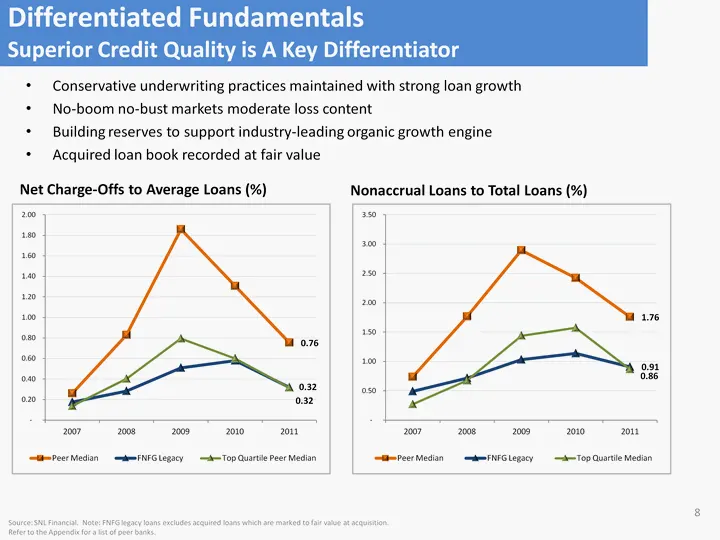
Conservative underwriting practices maintained with strong loan growth No-boom no-bust markets moderate loss content Building reserves to support industry-leading organic growth engine Acquired loan book recorded at fair value Net Charge-Offs to Average Loans (%) Nonaccrual Loans to Total Loans (%)

Slide 9: 9
9
Slide 10: Northeast Regional Banking Profile
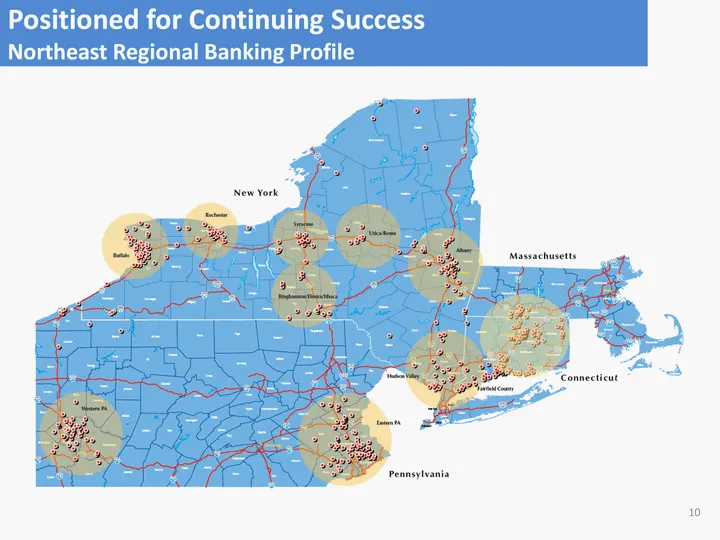
Positioned for Continuing Success Northeast Regional Banking Profile 10
Slide 11: Winning with Talent
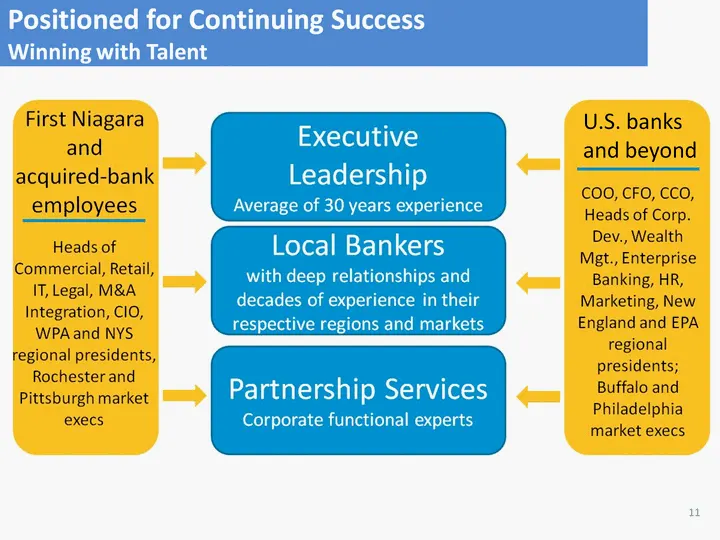
Positioned for Continuing Success Winning with Talent U.S. banks and beyond 11
Slide 12: Commercial Services Opportunity
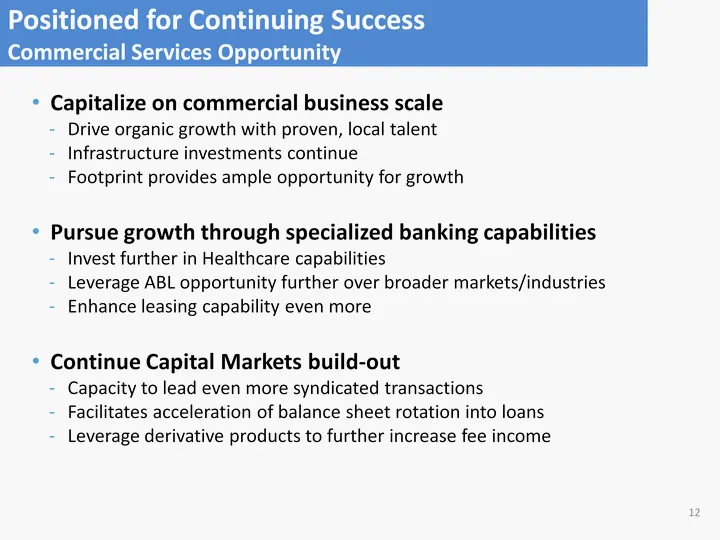
Capitalize on commercial business scale Drive organic growth with proven, local talent Infrastructure investments continue Footprint provides ample opportunity for growth Pursue growth through specialized banking capabilities Invest further in Healthcare capabilities Leverage ABL opportunity further
Slide 13: Recognized for Best-in-Class Service
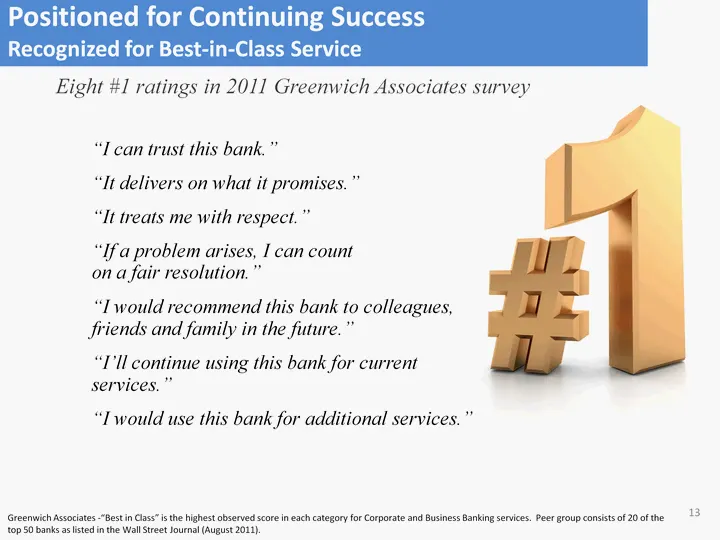
Positioned for Continuing Success Recognized for Best-in-Class Service Eight #1 ratings in 2011 Greenwich Associates survey "I can trust this bank." "It delivers on what it promises." "It treats me with respect." "If a problem arises, I can count on a fair resolution." "I would recommend this bank t
Slide 14: Best-in-Class organic loan growth
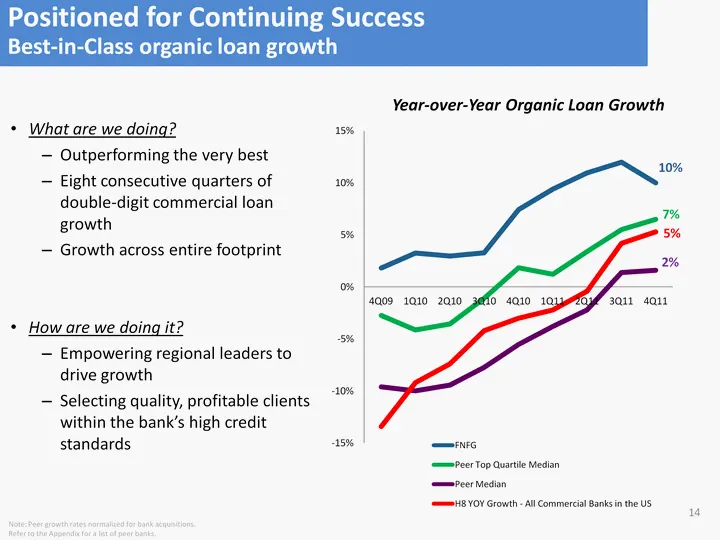
What are we doing? Outperforming the very best Eight consecutive quarters of double-digit commercial loan growth Growth across entire footprint How are we doing it? Empowering regional leaders to drive growth Selecting quality, profitable clients within the bank's high credit standards Year-over-Yea
Slide 15: Retail Deposit Services Opportunity
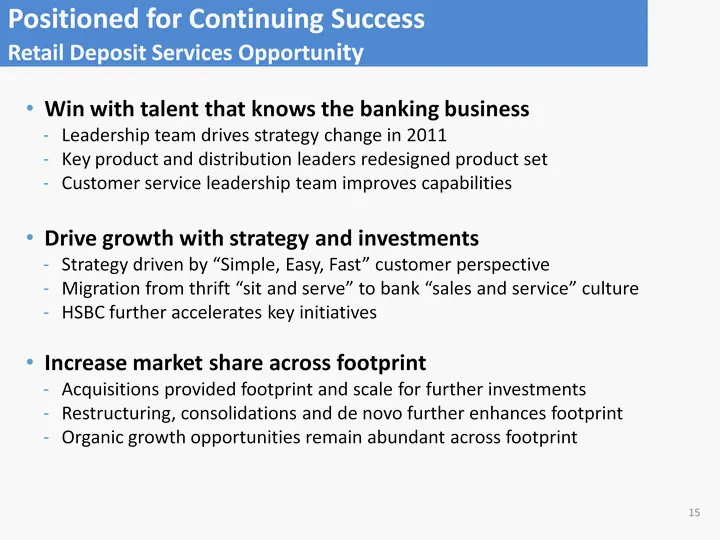
Win with talent that knows the banking business Leadership team drives strategy change in 2011 Key product and distribution leaders redesigned product set Customer service leadership team improves capabilities Drive growth with strategy and investments Strategy driven by "Simple, Easy, Fast" custome
Slide 16: Access to Growth Markets
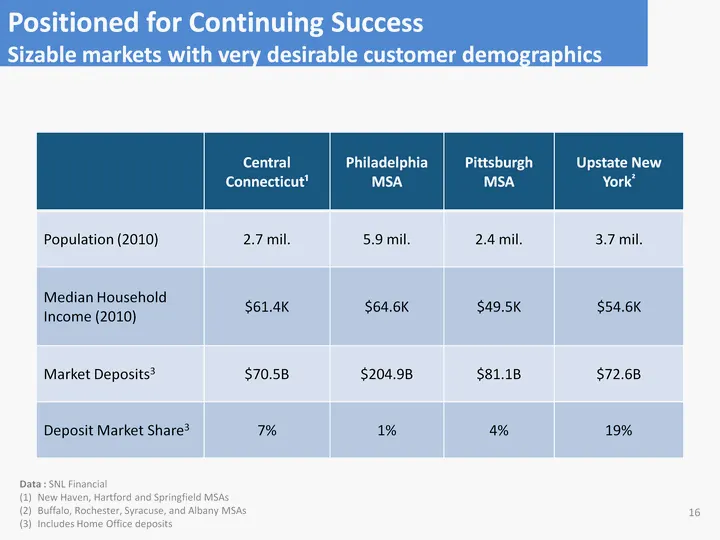
Access to Growth Markets Well Positioned to Take Market Share Well Positioned to Take Market Share Well Positioned to Take Market Share Well Positioned to Take Market Share Well Positioned to Take Market Share Well Positioned to Take Market Share Well Positioned to Take Market Share Well Positioned
Slide 17: Strong deposit fundamentals
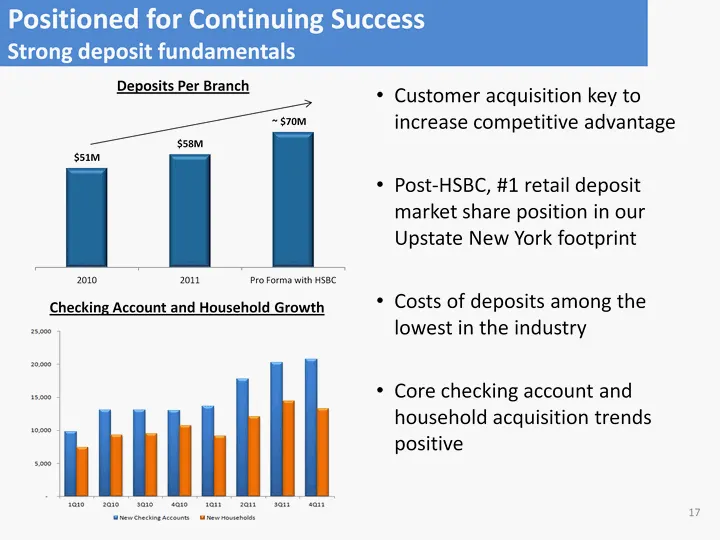
Positioned for Continuing Success Strong deposit fundamentals Deposits Per Branch (CHART) Customer acquisition key to increase competitive advantage Post-HSBC, #1 retail deposit market share position in our Upstate New York footprint Costs of deposits among the lowest in the industry Core checking a
Slide 18: Consumer Finance Opportunity
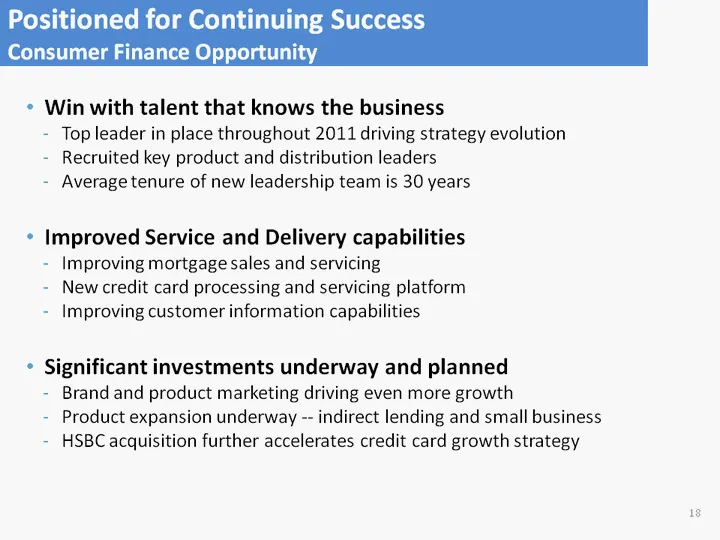
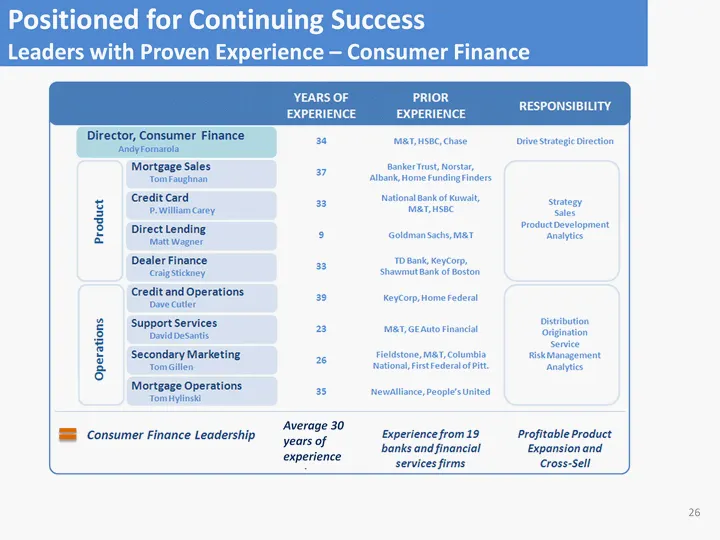
Win with talent that knows the business Top leader in place throughout 2011 driving strategy evolution Recruited key product and distribution leaders Average tenure of new leadership team is 30 years Improved Service and Delivery capabilities Improving mortgage sales and servicing New credit card pr
Slide 19: Recognized for Excellence in Small Business Service
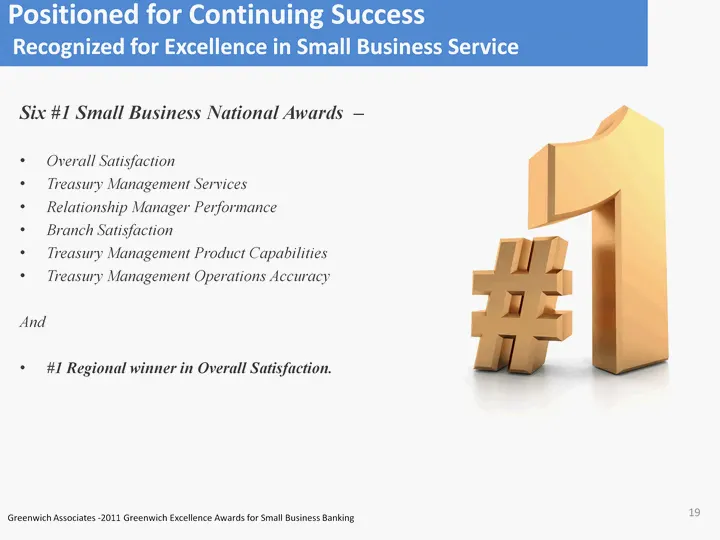
Positioned for Continuing Success Recognized for Excellence in Small Business Service Six #1 Small Business National Awards - Overall Satisfaction Treasury Management Services Relationship Manager Performance Branch Satisfaction Treasury Management Product Capabilities Treasury Management Operations
Slide 20: Consumer Finance Opportunity
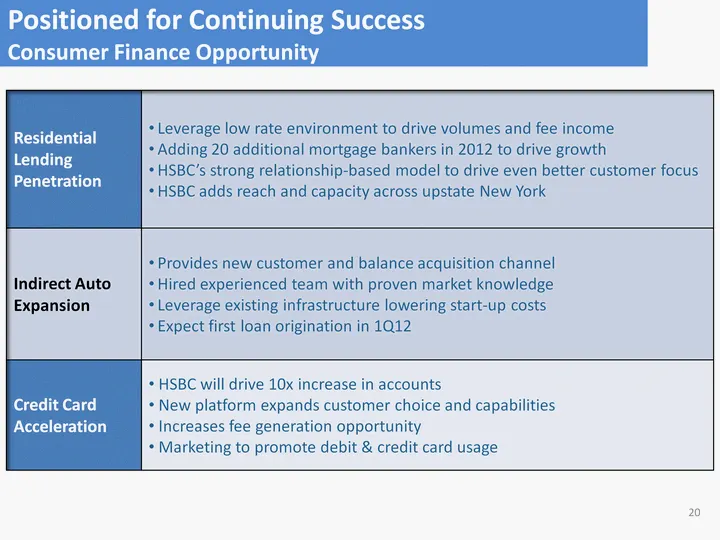
Positioned for Continuing Success Consumer Finance Opportunity Residential Lending Penetration Leverage low rate environment to drive volumes and fee income Adding 20 additional mortgage bankers in 2012 to drive growth HSBC's strong relationship-based model to drive even better customer focus HSBC a
Slide 21: Consumer Loan Originations
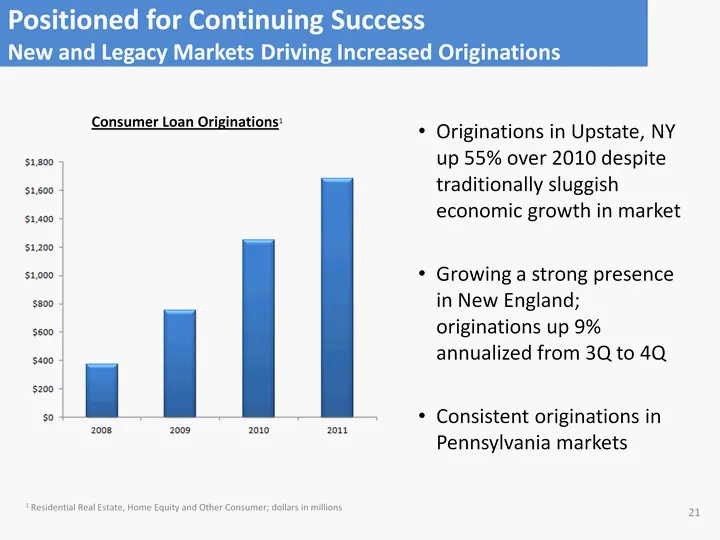
Consumer Loan Originations1 1 Residential Real Estate, Home Equity and Other Consumer; dollars in millions Positioned for Continuing Success New and Legacy Markets Driving Increased Originations Originations in Upstate, NY up 55% over 2010 despite traditionally sluggish economic growth in market Gro
Slide 22: Why Invest in First Niagara?
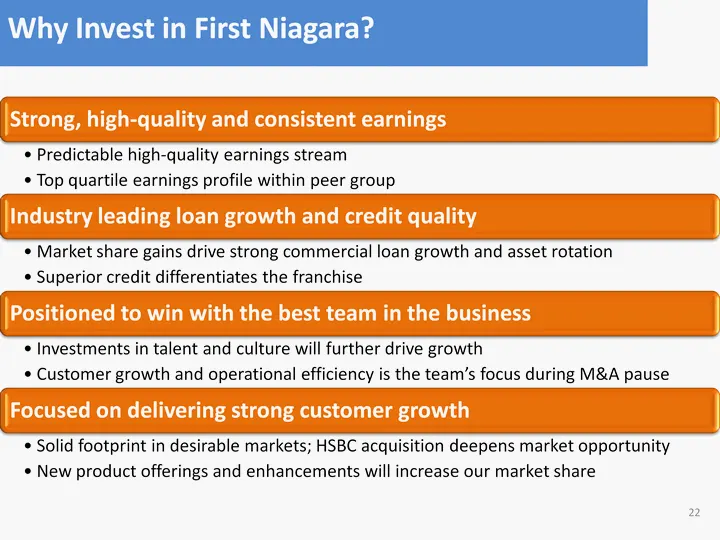
Why Invest in First Niagara? Why Invest in First Niagara? 22
Slide 23: 23
23
Slide 24: Commercial Leadership Team
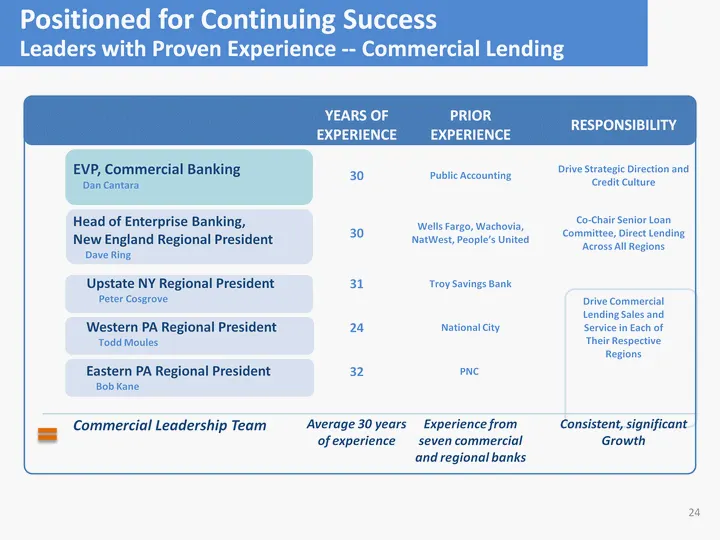
24 Years of Experience Prior Experience Responsibility EVP, Commercial Banking Dan Cantara 30 Public Accounting Drive Strategic Direction and Credit Culture Head of Enterprise Banking, New England Regional President Dave Ring 30 Wells Fargo, Wachovia, NatWest, People's United Co-Chair Senior Loan Co
Slide 25: Leaders with Proven Experience - Retail Deposit Services
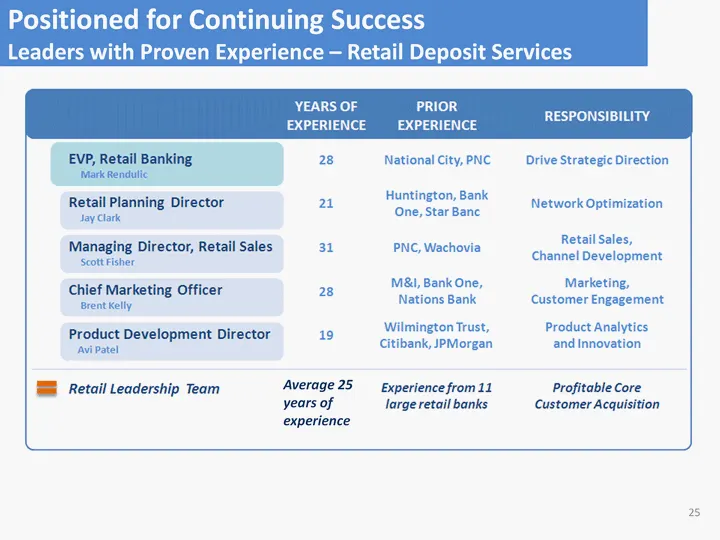
Positioned for Continuing Success Leaders with Proven Experience - Retail Deposit Services 25 Average 25 years of experience
Slide 26: Leaders with Proven Experience - Consumer Finance
Positioned for Continuing Success Leaders with Proven Experience - Consumer Finance 26 Average 30 years of experience
Slide 27: Benchmarking Peer Group
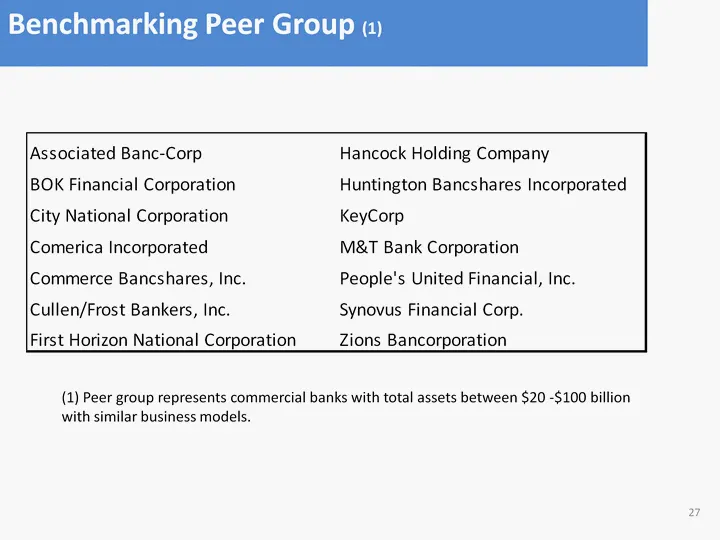
27 Benchmarking Peer Group (1) (1) Peer group represents commercial banks with total assets between $20 -$100 billion with similar business models.
Slide 28: Non-GAAP Measures
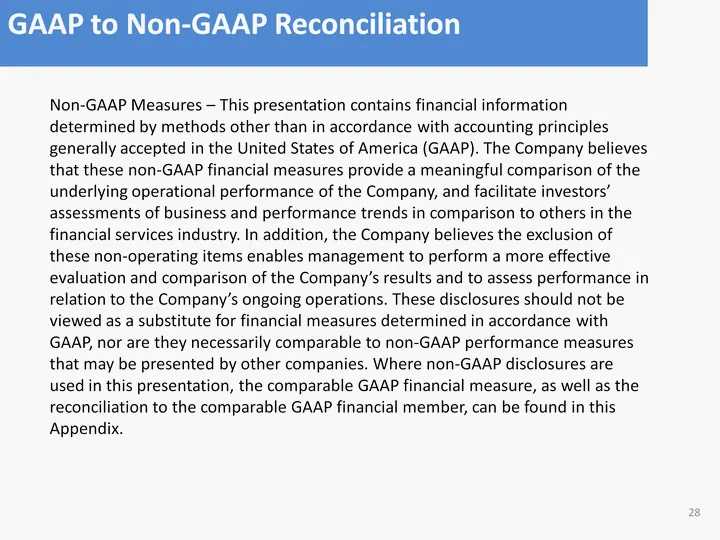
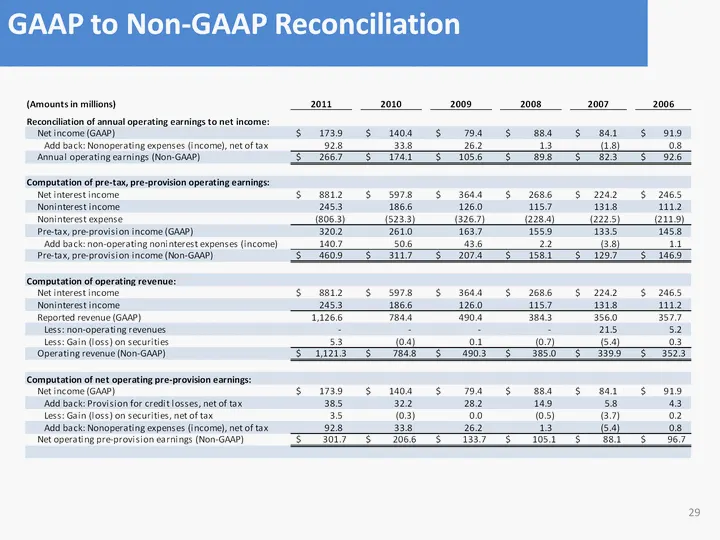
Non-GAAP Measures - This presentation contains financial information determined by methods other than in accordance with accounting principles generally accepted in the United States of America (GAAP). The Company believes that these non-GAAP financial measures provide a meaningful comparison of the
Slide 29: GAAP to Non-GAAP Reconciliation
29 GAAP to Non-GAAP Reconciliation
Source: SEC EDGAR · 8-K filed Feb 13, 2012
More decks from First Niagara Financial Group Inc
 Q4 2015 Earnings Presentation27 slides · Jan 21, 2016
 Merger or Acquisition (October 2015)18 slides · Oct 30, 2015
 Q3 2015 Earnings Presentation20 slides · Oct 23, 2015
 Q2 2015 Earnings Presentation20 slides · Jul 24, 2015
 Presentation (June 2015)11 slides · Jun 16, 2015
 Q1 2015 Earnings Presentation20 slides · Apr 24, 2015