Andeavor Logistics LP — 2019 MLP & Energy Infrastructure Conference
44 slides from Andeavor Logistics LP's conference presentation, May 15, 2019
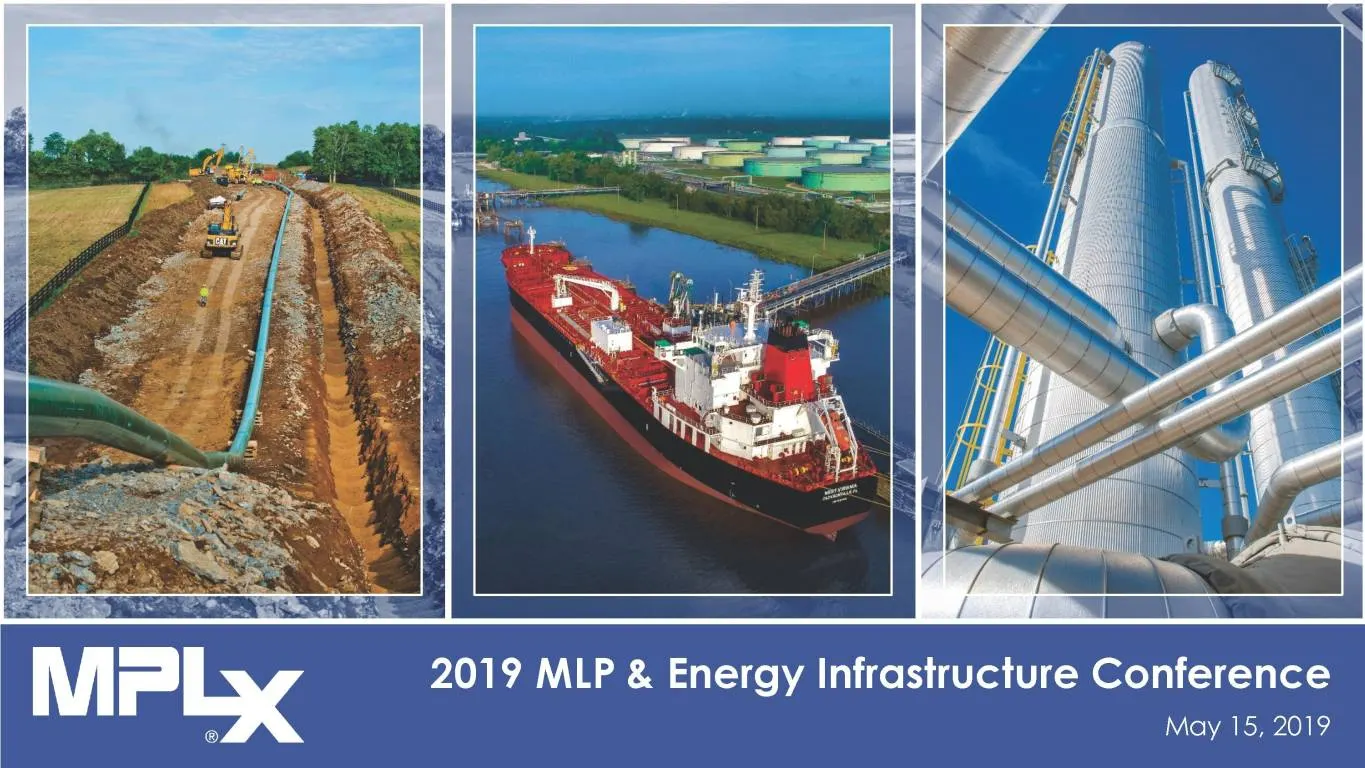
Slide 1: 2019 MLP & Energy Infrastructure Conference
MrPlLy 2019 MLP & Energy Infrastructure Conference May 15, 2019
Slide 2: Forward-Looking Statements
Forward-Looking Statements This presentation contains forward-looking statements within the meaning of federal securities laws regarding MPLX LP (MPLX). These forward-looking statements relate to, among other things, the proposed acquisition of Andeavor Logistics LP (ANDX) by MPLX and include expect
Slide 3: Additional Information
Additional Information Additional Information and Where to Find It In connection with the proposed transaction, a registration statement on Form S-4 will be filed with the SEC. INVESTORS AND SECURITY HOLDERS ARE ENCOURAGED TO READ THE REGISTRATION STATEMENT AND ANY OTHER RELEVANT DOCUMENTS FILED WIT
Slide 4: MPLX Agreement to Acquire ANDX - Transaction Highlights
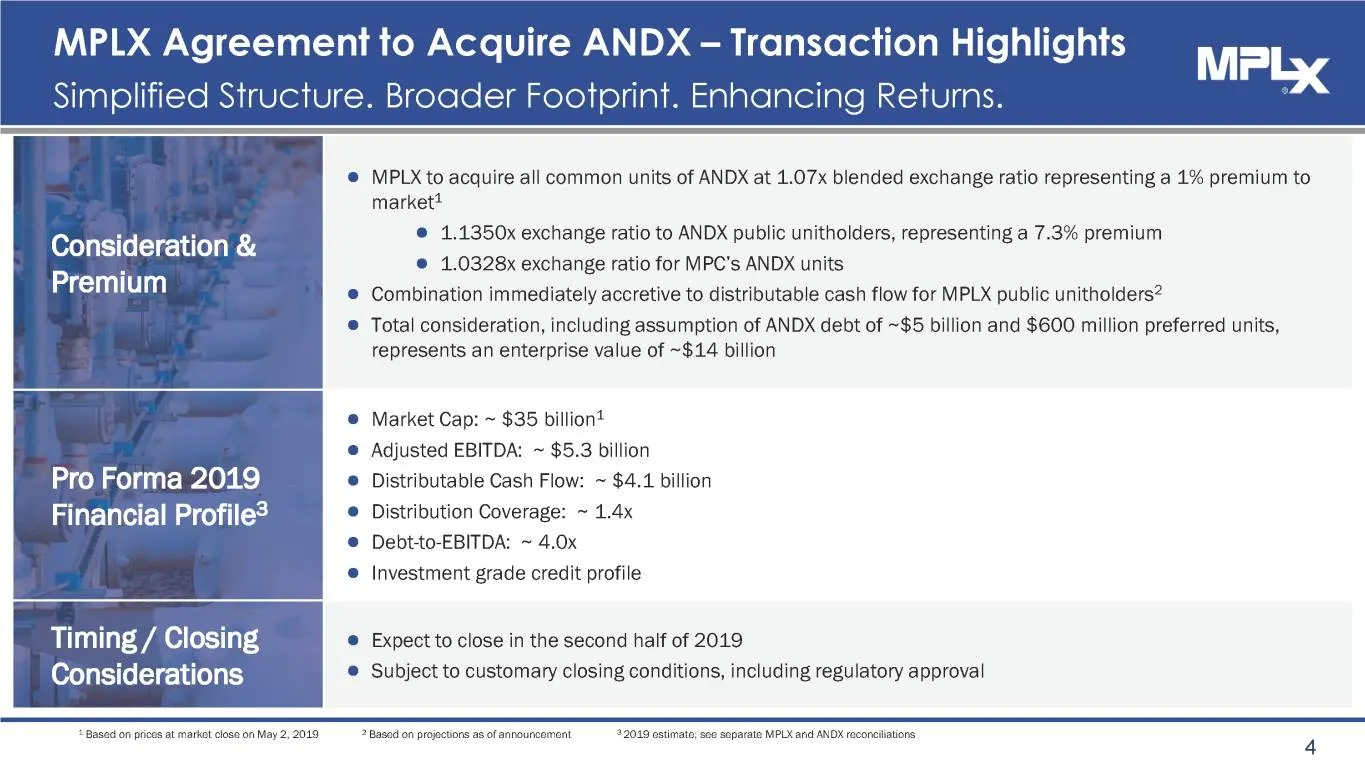
MPLX Agreement to Acquire ANDX - Transaction Highligh Simplified Structure. Broader Footprint. Enhancing Returns MPLX to acquire all common units of ANDX at 1.07x blended exchange ratio representing a 1% premium to. market? @ 1,1350x exchange ratio to ANDX public unitholders, representing a 7.3% pre
Slide 5: Simplified Organizational Structure
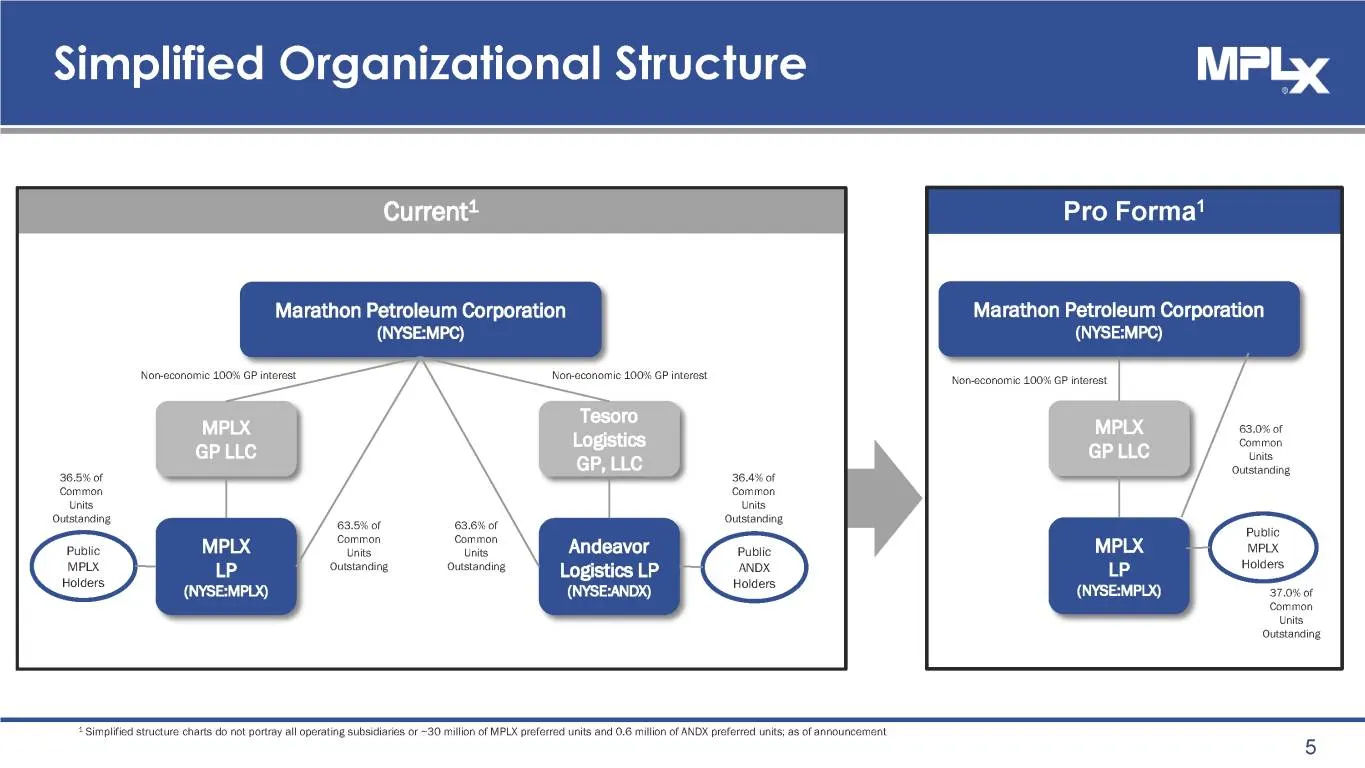
Simplified Organizational Structure Pro Forma’ Marathon Petroleum Corporation Marathon Petroleum Corporation (NYSE:MPC) (NYSE:MPC) Non-ccanomic 100% GP interest ___Non-econamic 100% GP interast Nowaconomic 400% GP intaraat / / \ 63.0% oF / | common / . Units standing 265% oF / 5.4% of oepenrone of 6
Slide 6: Positioning MPLX For Long-Term Success
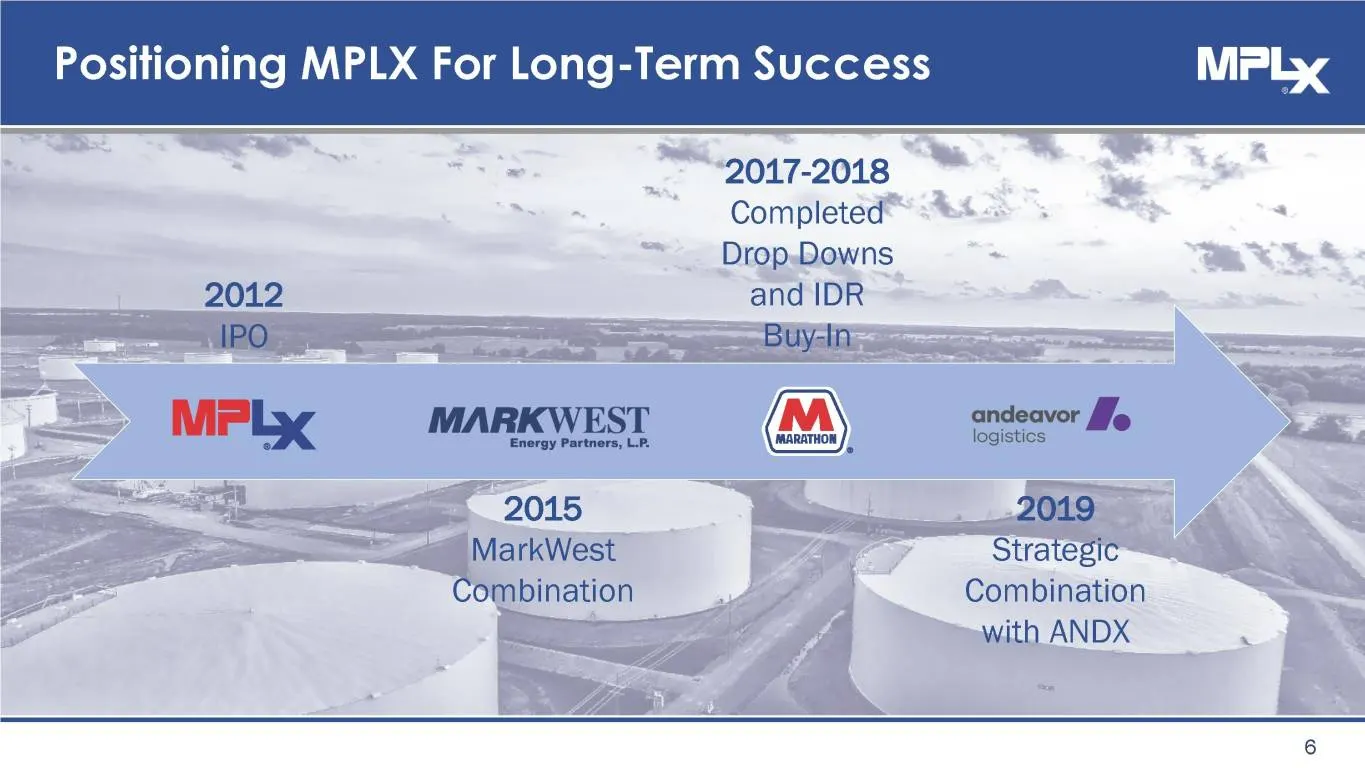
Positioning MPLX For Long-Term Success 2017-2018 Completed Drop.Downs and IDR Sa ae DUVALL sits Se ie = wip tlie ; ARKW/' andeavor MrPLy ™M. Energy VES T (BAY logistics fe © cit as eee 2015 — 2019 2 =< MarkWest r Strategic ‘Combination : Combination _ oo aE with ANDX
Slide 7: Key Investment Highlights
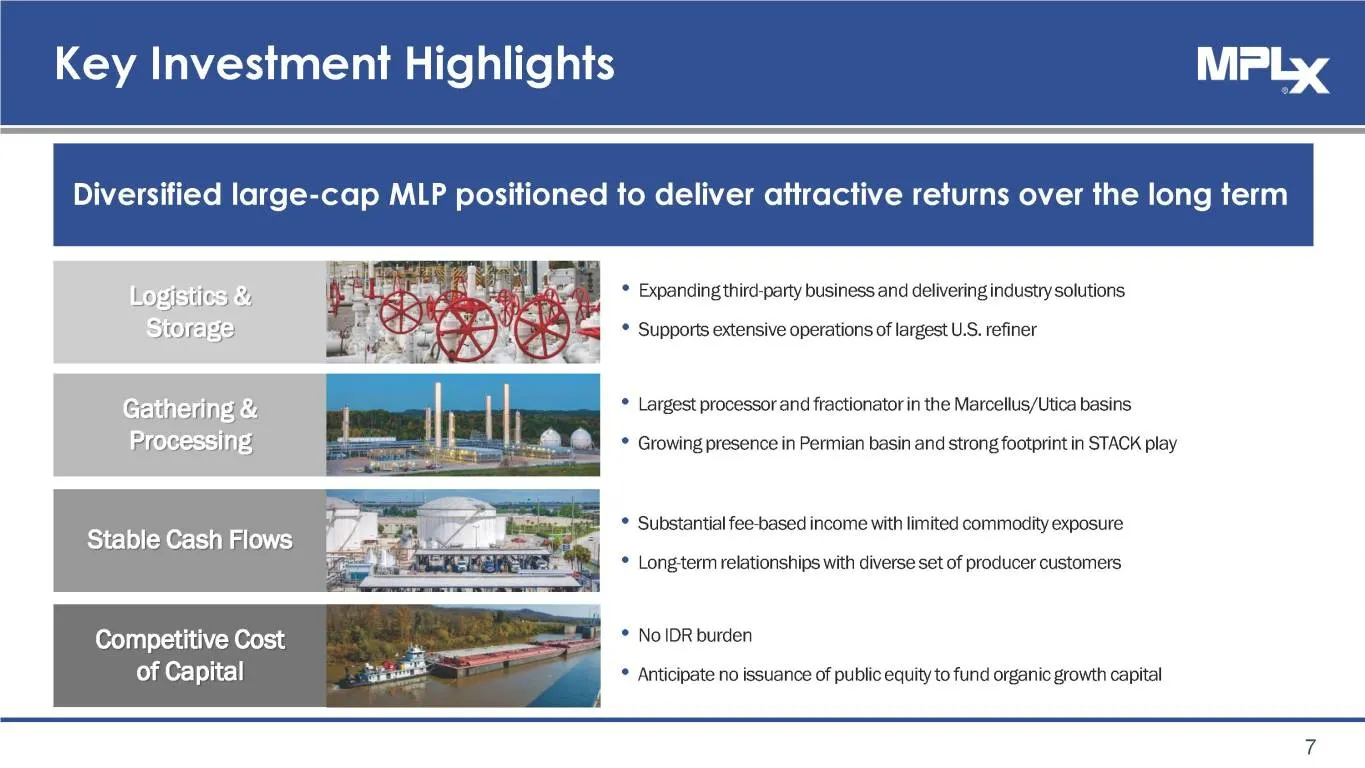
Key Investment Highlights Diversified large-cap MLP positioned to deliver attractive returns over the long term * Expanding third-party business and delivering industry solutions * Supports extensive operations of largest U.S. refiner * Largest processor and fractionator in the Marcellus/Utica basin
Slide 8: Compelling Investment Opportunity
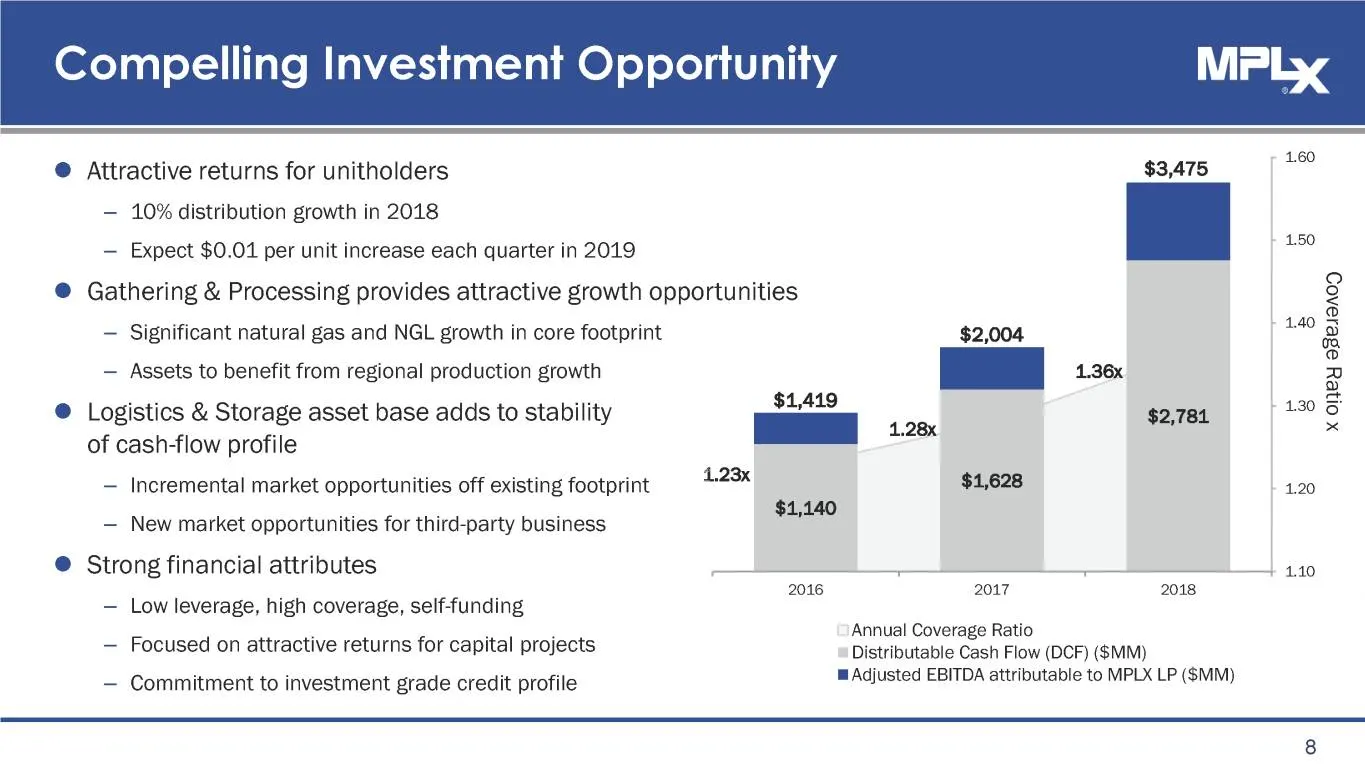
Compelling Investment Opportunity ® Attractive returns for unitholders — 10% distribution growth in 2018 — Expect $0.01 per unit increase each quarter in 2019 @ Gathering & Processing provides attractive growth opportunities — Significant natural gas and NGL growth in core footprint $2,004 — Assets
Slide 9: Aligned Strategic Priorities
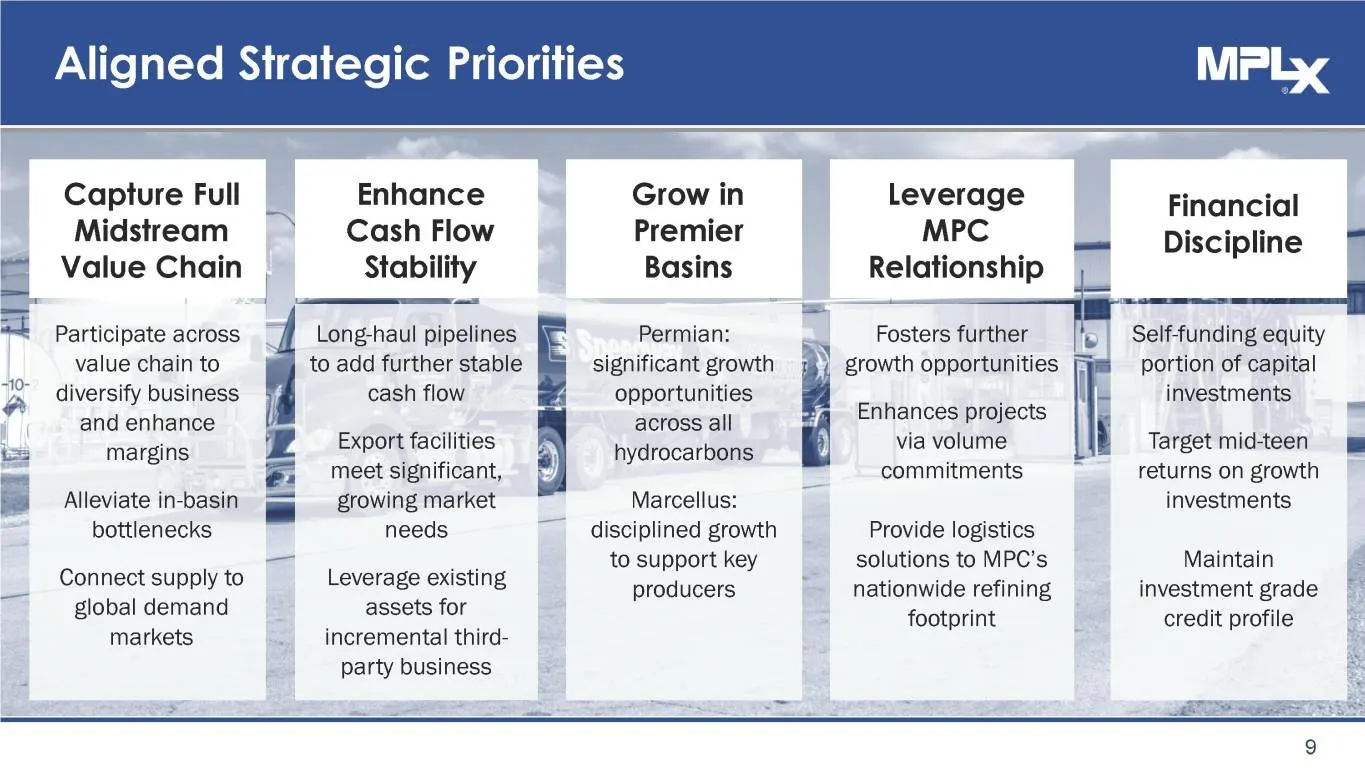
Aligned Strategic Priorities Capture Full Enhance Grow in Leverage Financial Midstream > Cash Flow Premier MPC ‘i — Discipline © | Value Chain Stability Basins Relationship i ae! — a ee eel at Participate across © Long-haul pipelines }E Permian: Fosters further (>) | Self-funding equity value chain
Slide 10: Diversification enhances opportunities for revenue capture
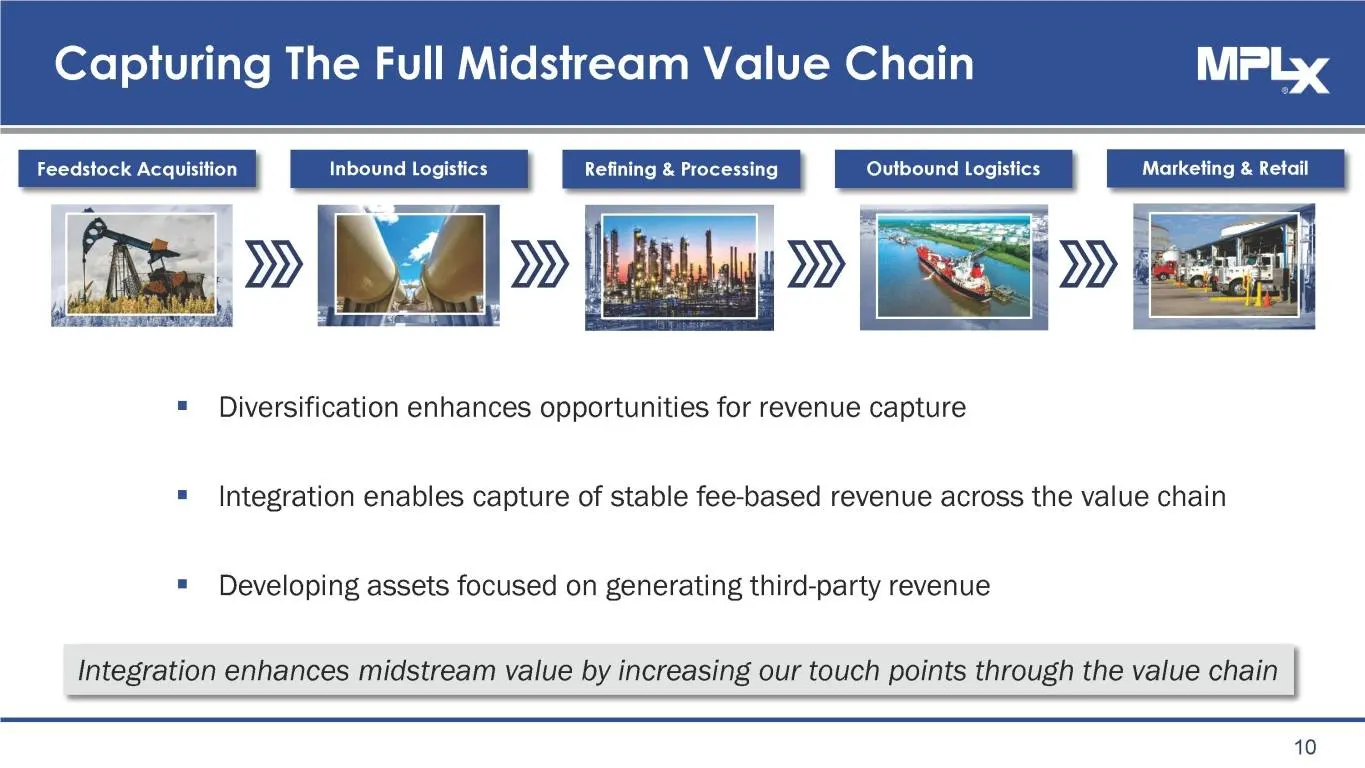
= Diversification enhances opportunities for revenue capture = Integration enables capture of stable fee-based revenue across the value chain = Developing assets focused on generating third-party revenue Integration enhances midstream value by increasing our touch points through the value chain 10
Slide 11: U.S. Production Growth Creates Midstream Opportunities
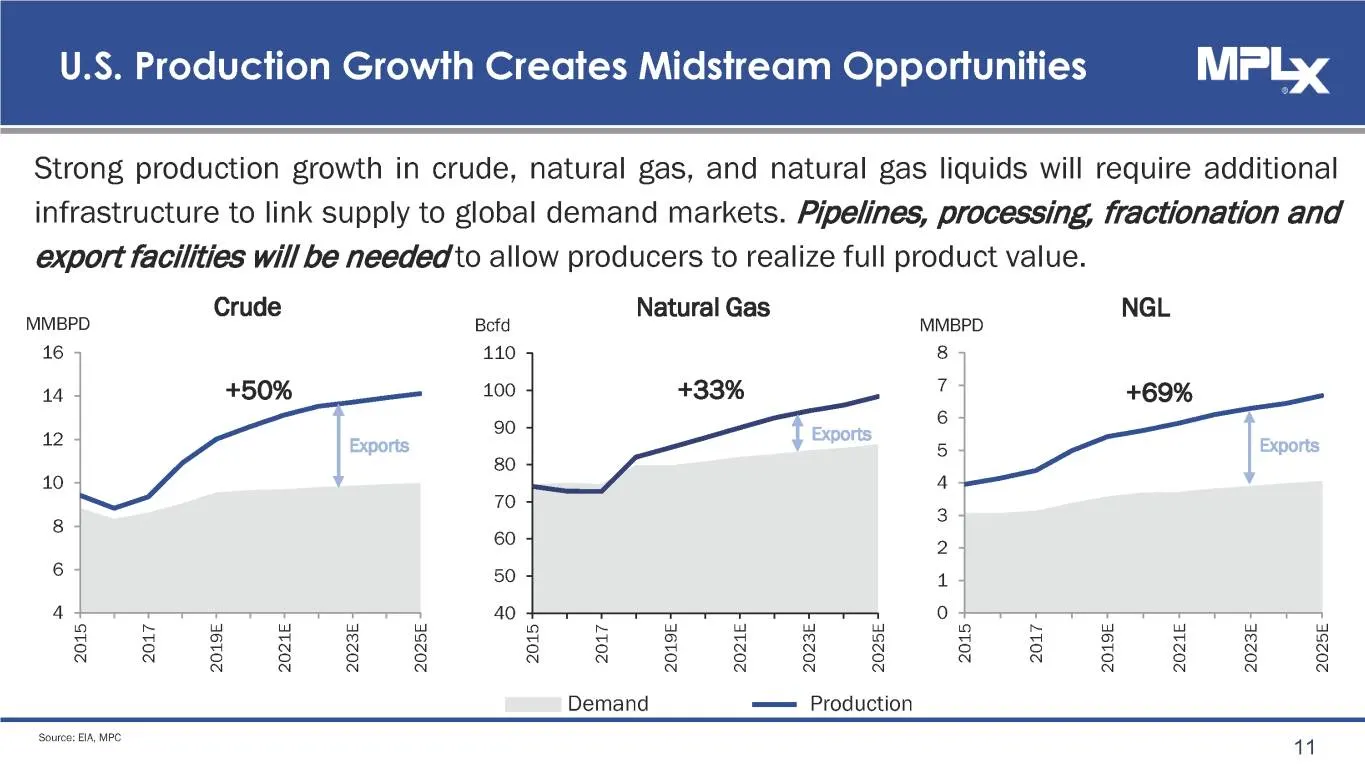
U.S. Production Growth Creates Midstream Opportunities MPLy Strong production growth in crude, natural gas, and natural gas liquids will require additional infrastructure to link supply to global demand markets. Pipelines, processing, fractionation and export facilities will be neededo allow produce
Slide 12: Capturing Permian Opportunities
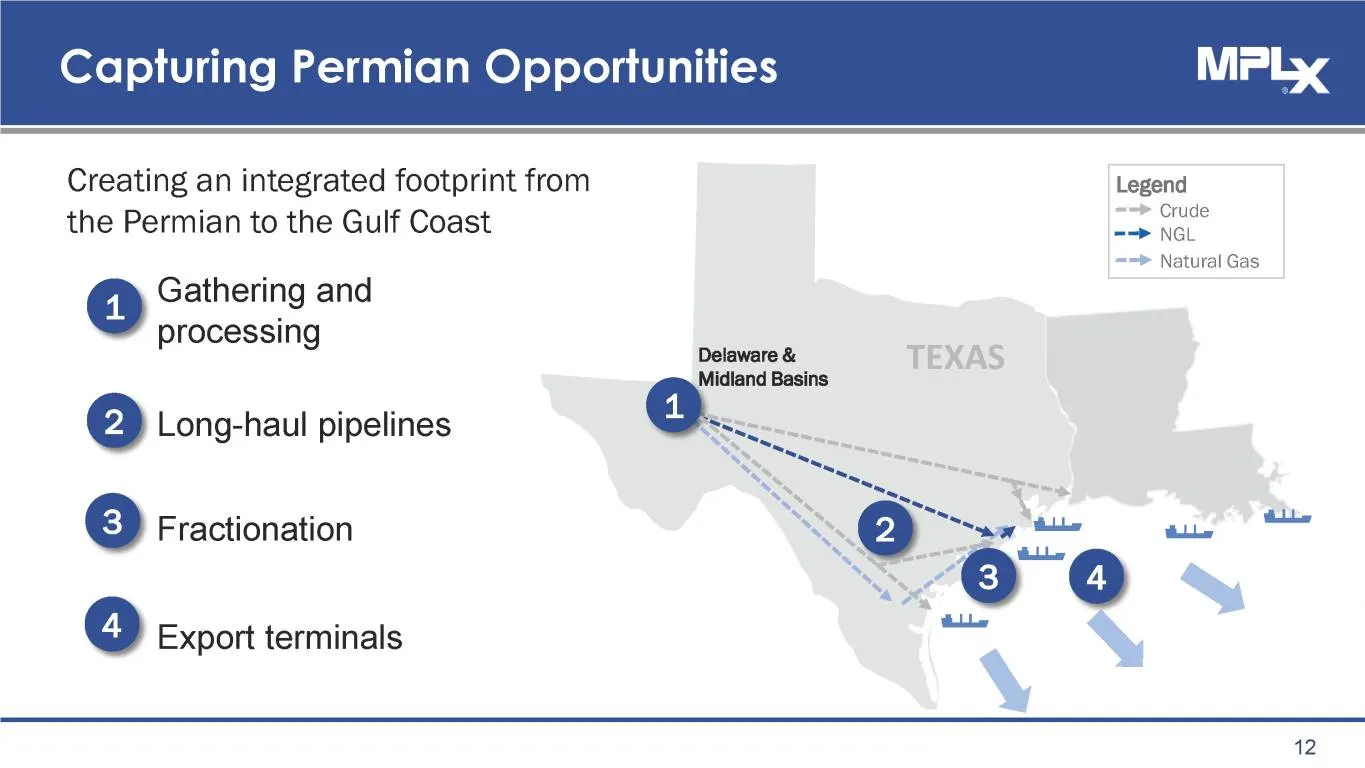
Capturing Permian Opportunities Creating an integrated footprint from Legend the Permian to the Gulf Coast eee > Natural Gas Gathering and processing a TEXAS Midland Basins @ Long-haul pipelines e.. © Export terminals 12
Slide 13: Permian G&P Feeds Downstream Opportunities
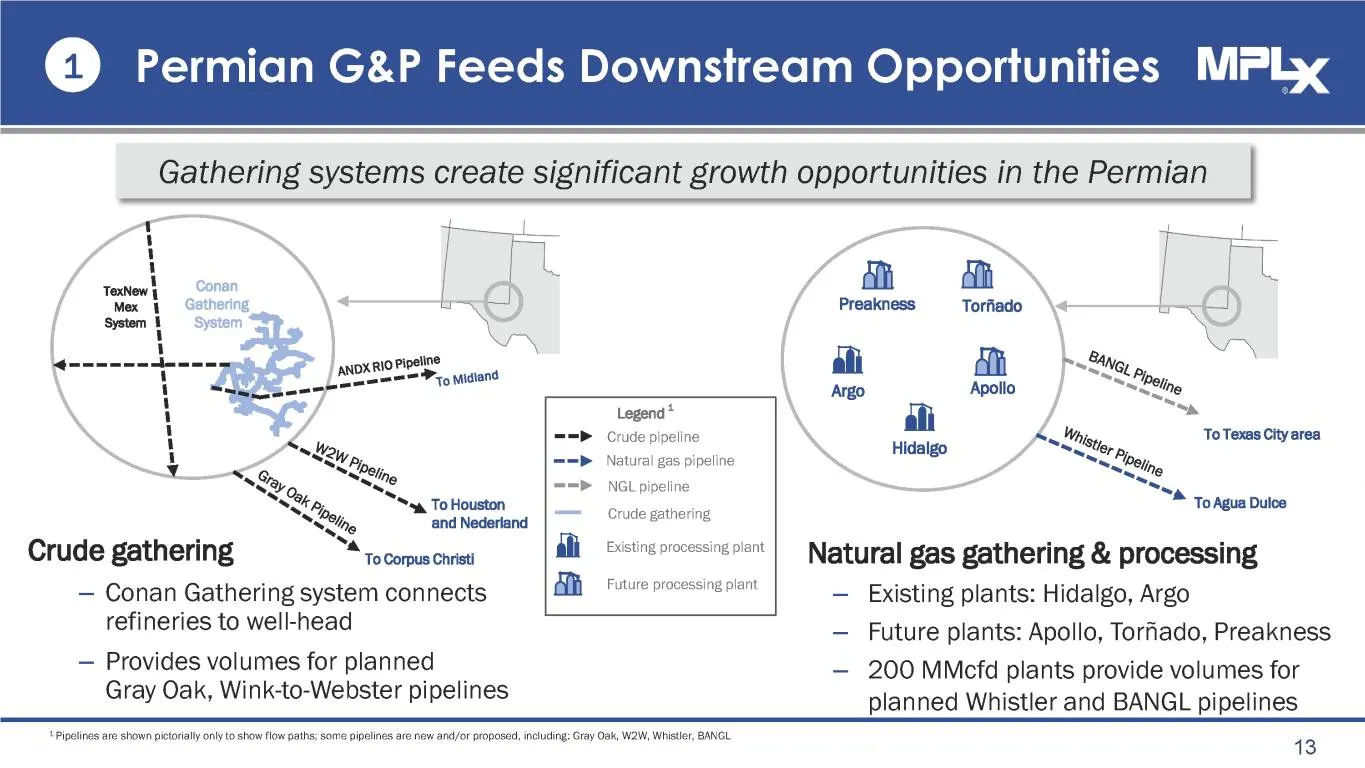
4) Permian G&P Feeds Downstream Opportunities MPL Gathering systems create significant growth opportunities in the Permian Crude gathering — Conan Gathering system connects refineries to well-head — Provides volumes for planned Gray Oak, Wink-to-Webster pipelines ‘~ To Corpus Christi -—> -—> -—> ali
Slide 14: Permian Crude Pipelines
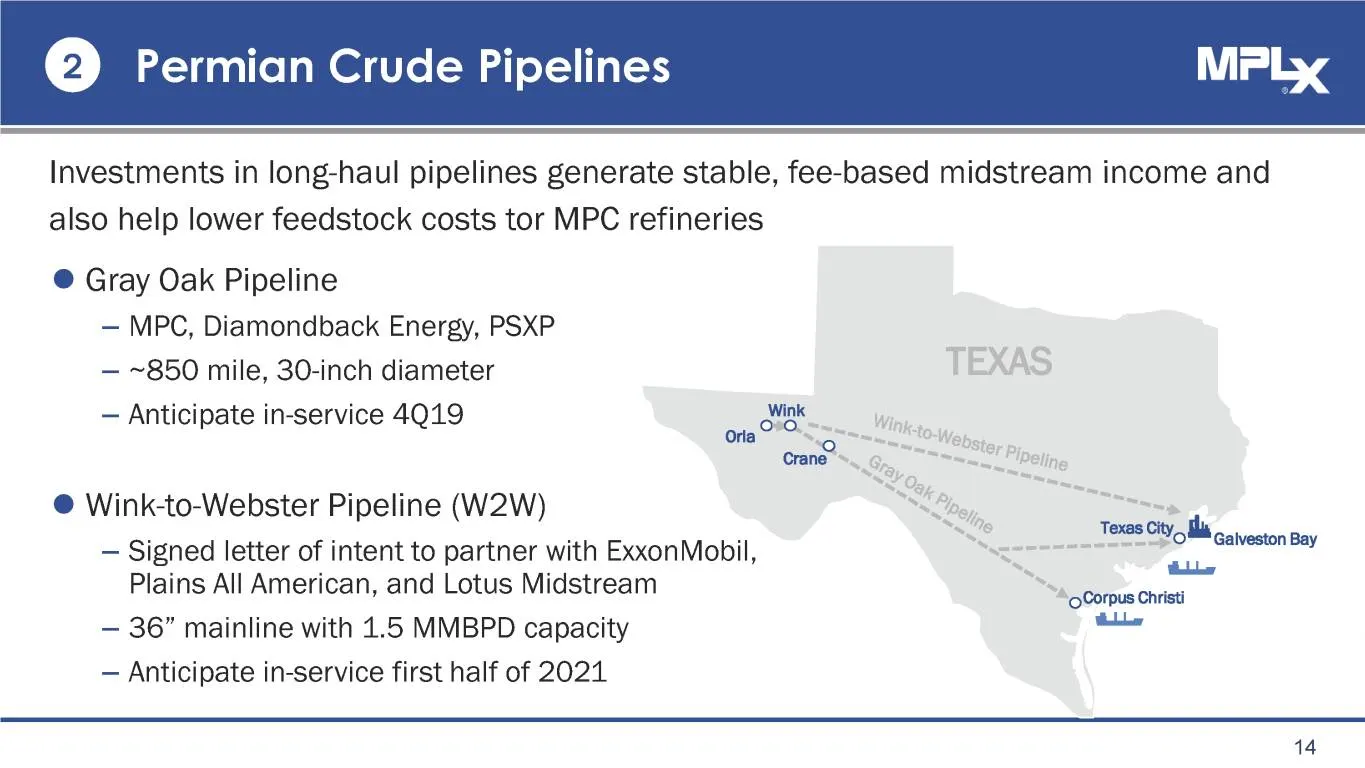
@ Permian Crude Pipelines Investments in long-haul pipelines generate stable, fee-based midstream income and also help lower feedstock costs tor MPC refineries @ Gray Oak Pipeline — MPC, Diamondback Energy, PSXP — ~850 mile, 30-inch diameter TEXAS — Anticipate in-service 4Q19 ek Wy P ° one - ~ wn We
Slide 15: Permian Natural Gas and NGL Pipelines and Fractionation
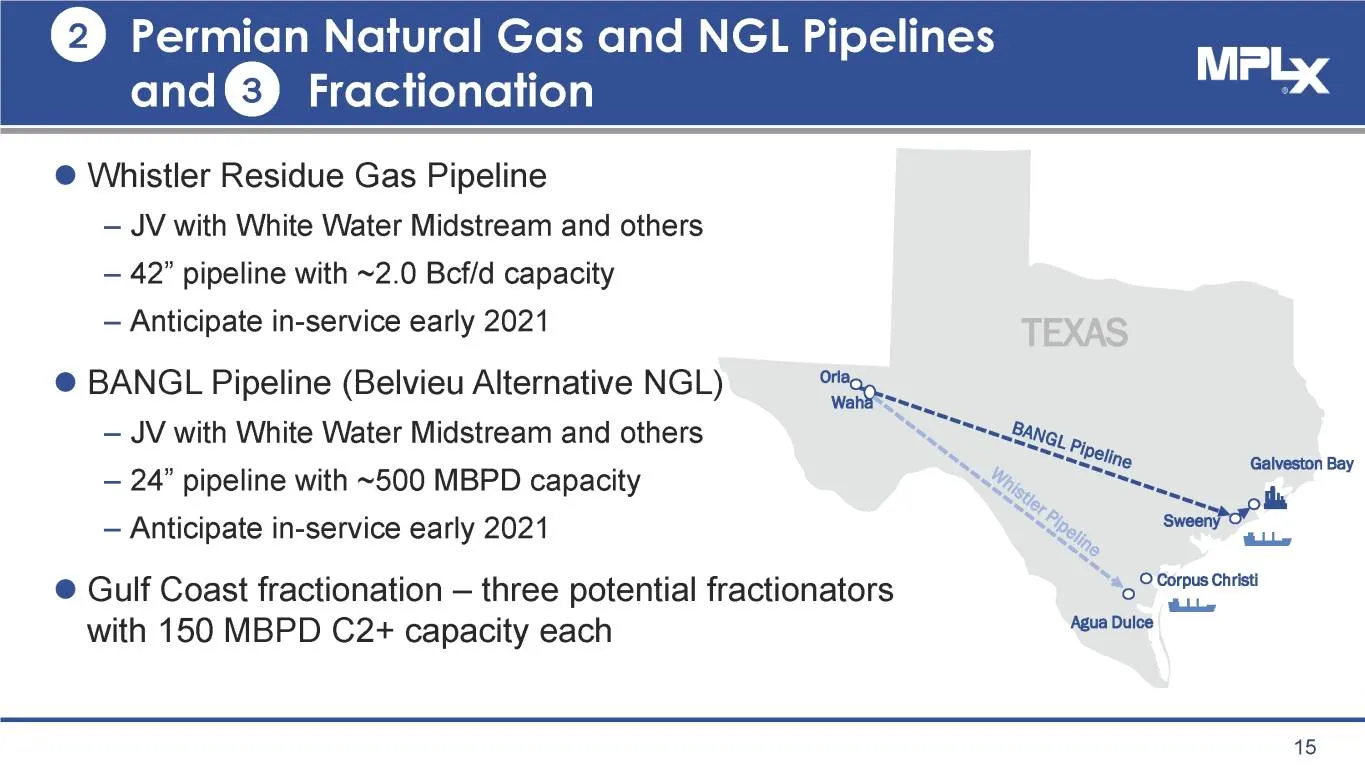
@ Permian Natural Gas and NGL Pipelines and ®@ Fractionation @ Whistler Residue Gas Pipeline — JV with White Water Midstream and others — 42” pipeline with ~2.0 Bcf/d capacity — Anticipate in-service early 2021 TEXAS @ BANGL Pipeline (Belvieu Alternative NGL) TR - JV with White Water Midstream and o
Slide 16: Expanding Export Capabilities
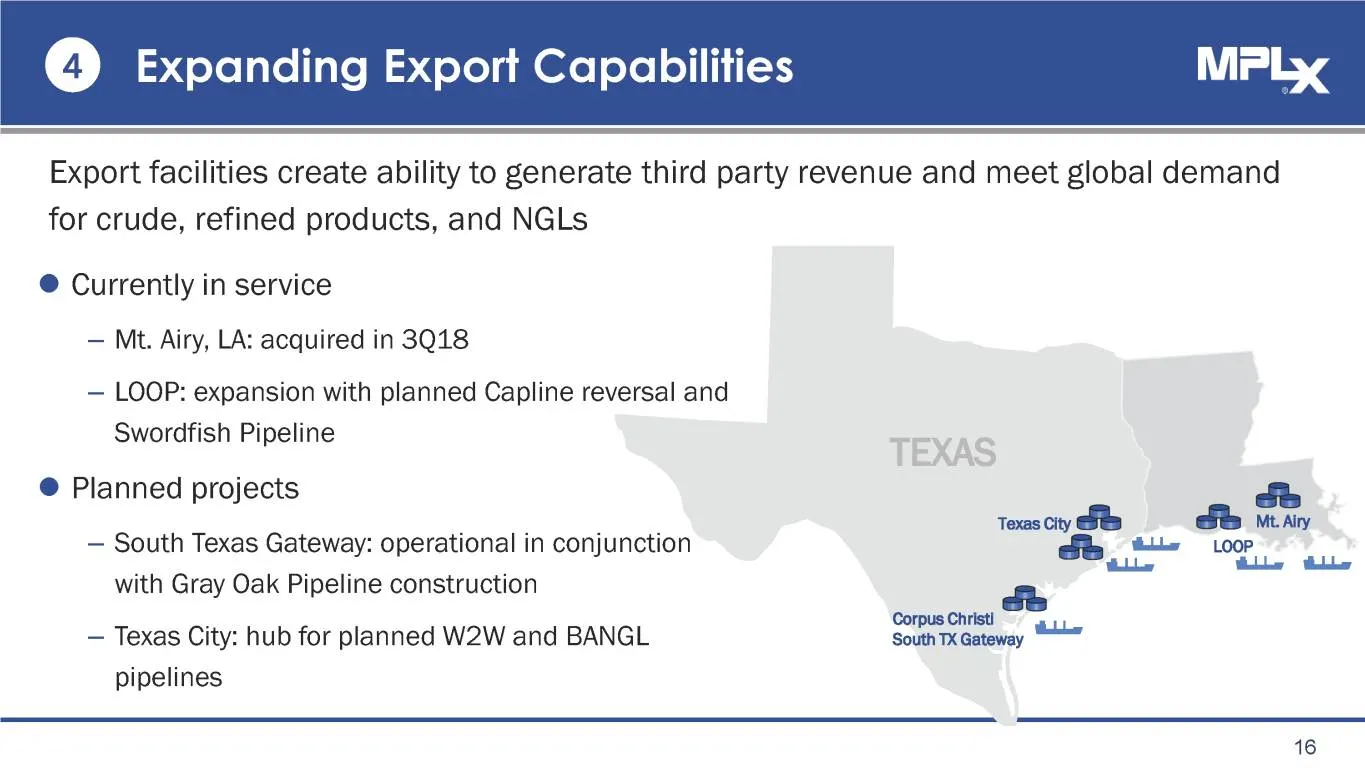
4 ] Expanding Export Capabilities Export facilities create ability to generate third party revenue and meet global demand for crude, refined products, and NGLs ® Currently in service — Mt. Airy, LA: acquired in 3Q18 — LOOP: expansion with planned Capline reversal and Swordfish Pipeline TEXAS ®@ Plan
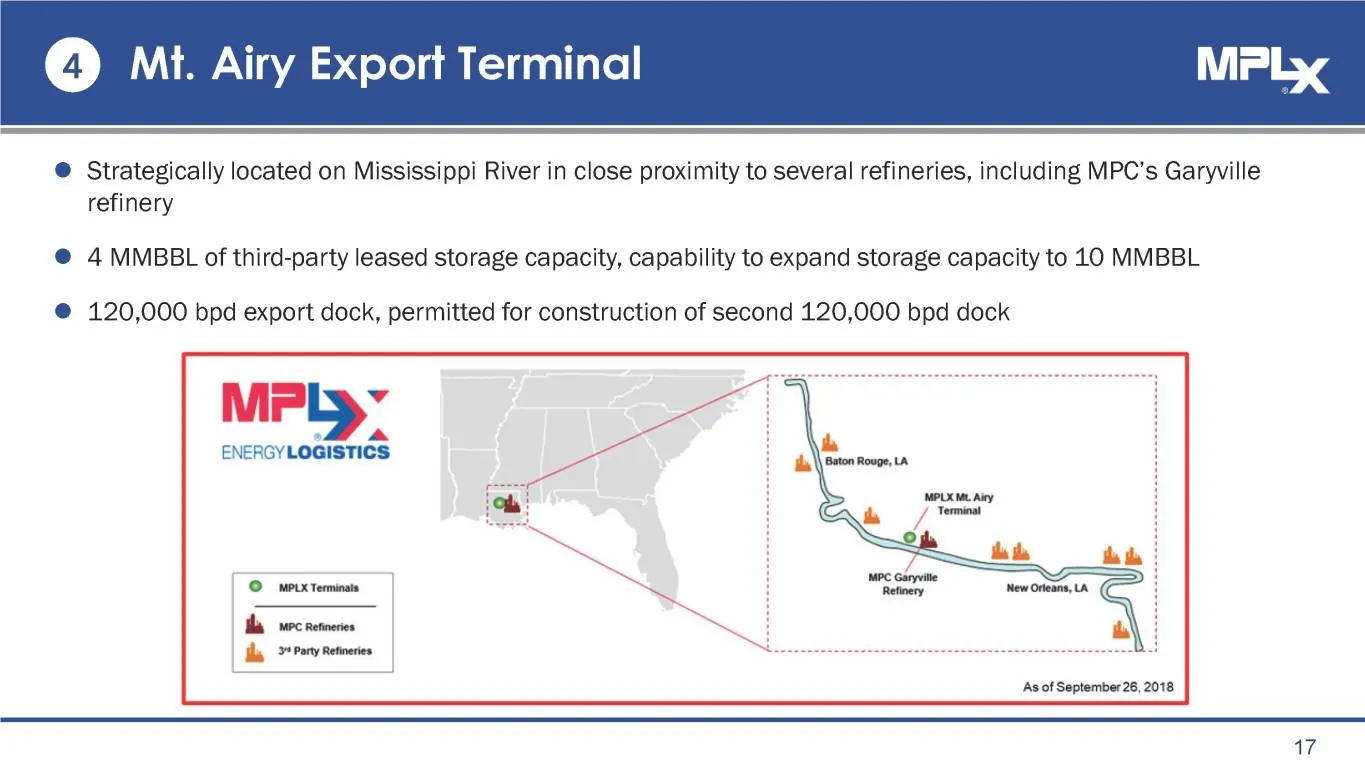
Slide 17: Mt. Airy Export Terminal
© Mt. Airy Export Terminal ®@ Strategically located on Mississippi River in close proximity to several refineries, including MPC’s Garyville refinery @ 4 MMBBL of third-party leased storage capacity, capability to expand storage capacity to 10 MMBBL @ 120,000 bpd export dock, permitted for construct
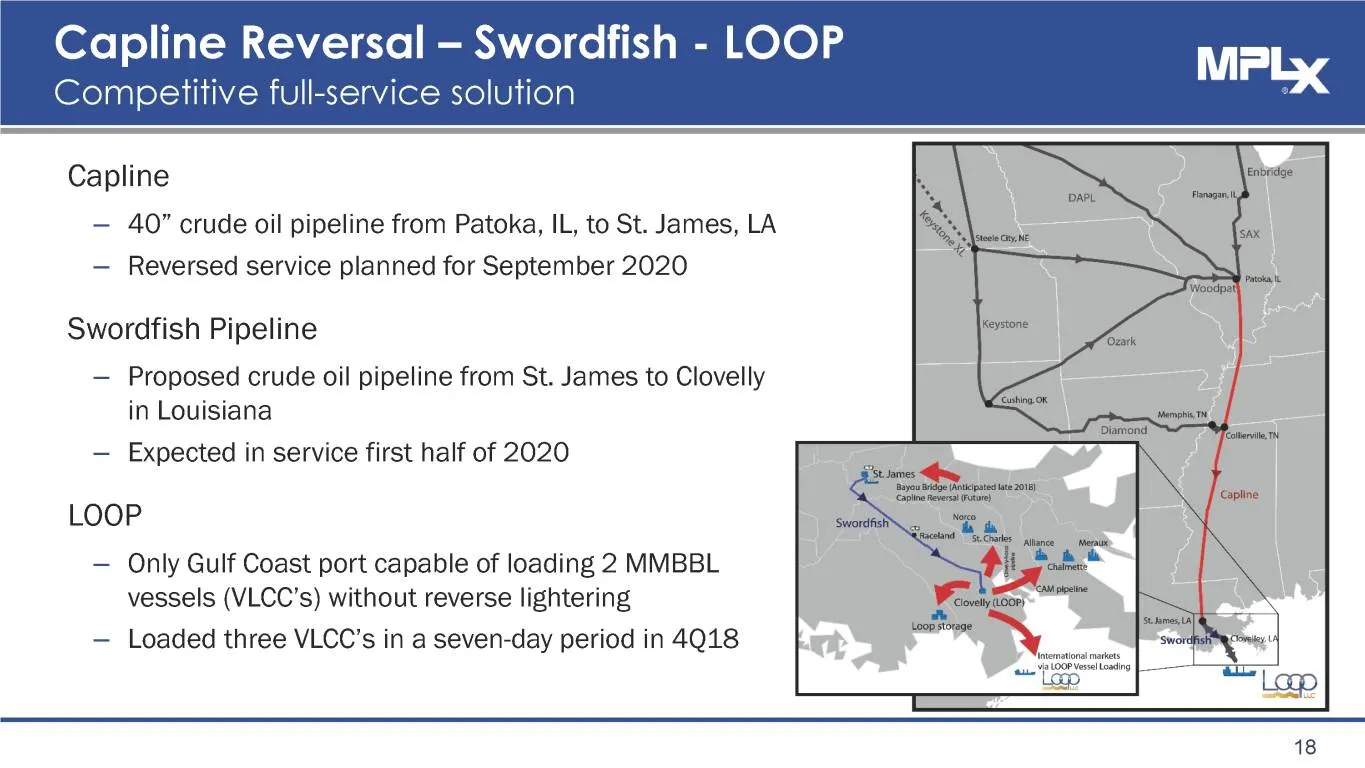
Slide 18: Capline Reversal — Swordfish - LOOP
Capline Reversal — Swordfish - LOOP Competitive full-service solution Capline — 40” crude oil pipeline from Patoka, IL, to St. James, LA — Reversed service planned for September 2020 Swordfish Pipeline — Proposed crude oil pipeline from St. James to Clovelly in Louisiana — Expected in service first
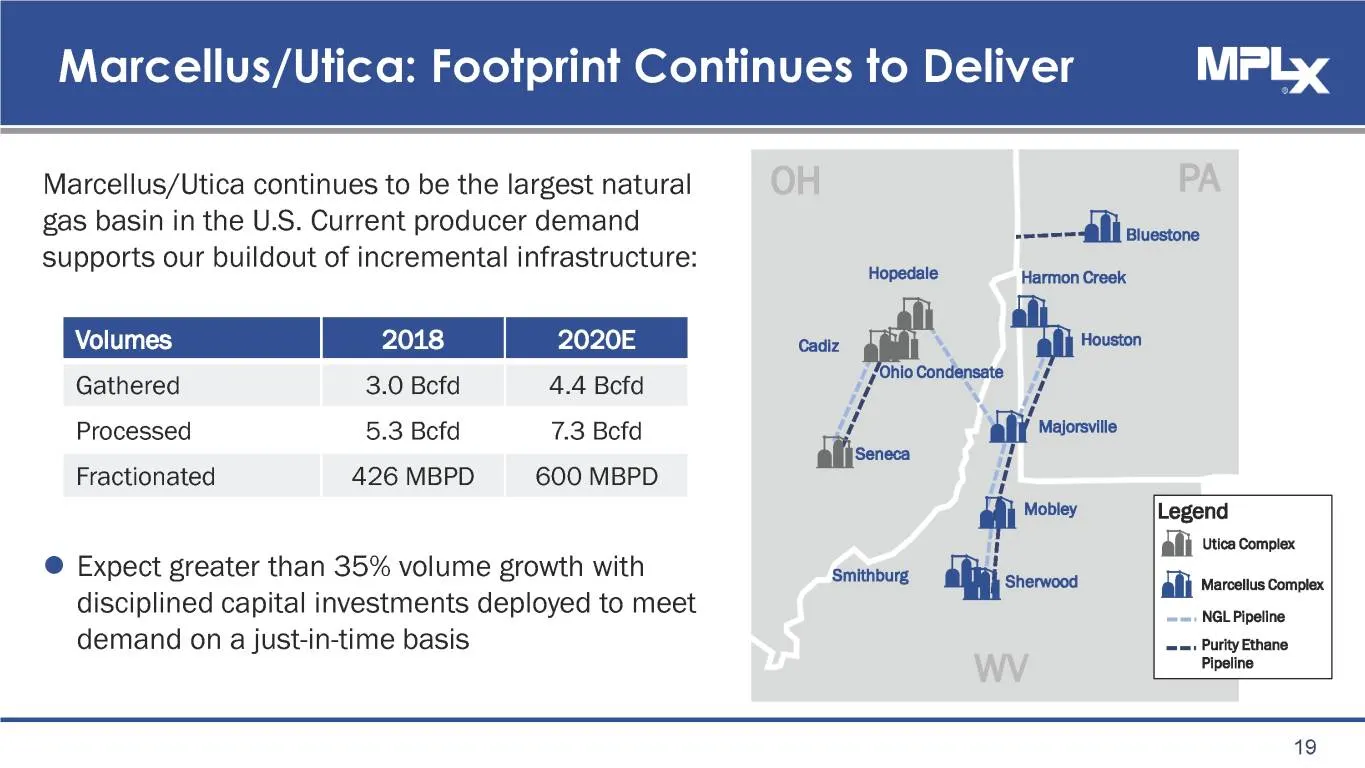
Slide 19: Marcellus/Utica continues to be the largest natural gas basin
Marcellus/Utica continues to be the largest natural gas basin in the U.S. Current producer demand supports our buildout of incremental infrastructure: 2018 2020E Gathered 3.0 Befd 4.4 Bcfd Processed 5.3 Befd 7.3 Befd Fractionated 426 MBPD 600 MBPD @ Expect greater than 35% volume growth with discipl
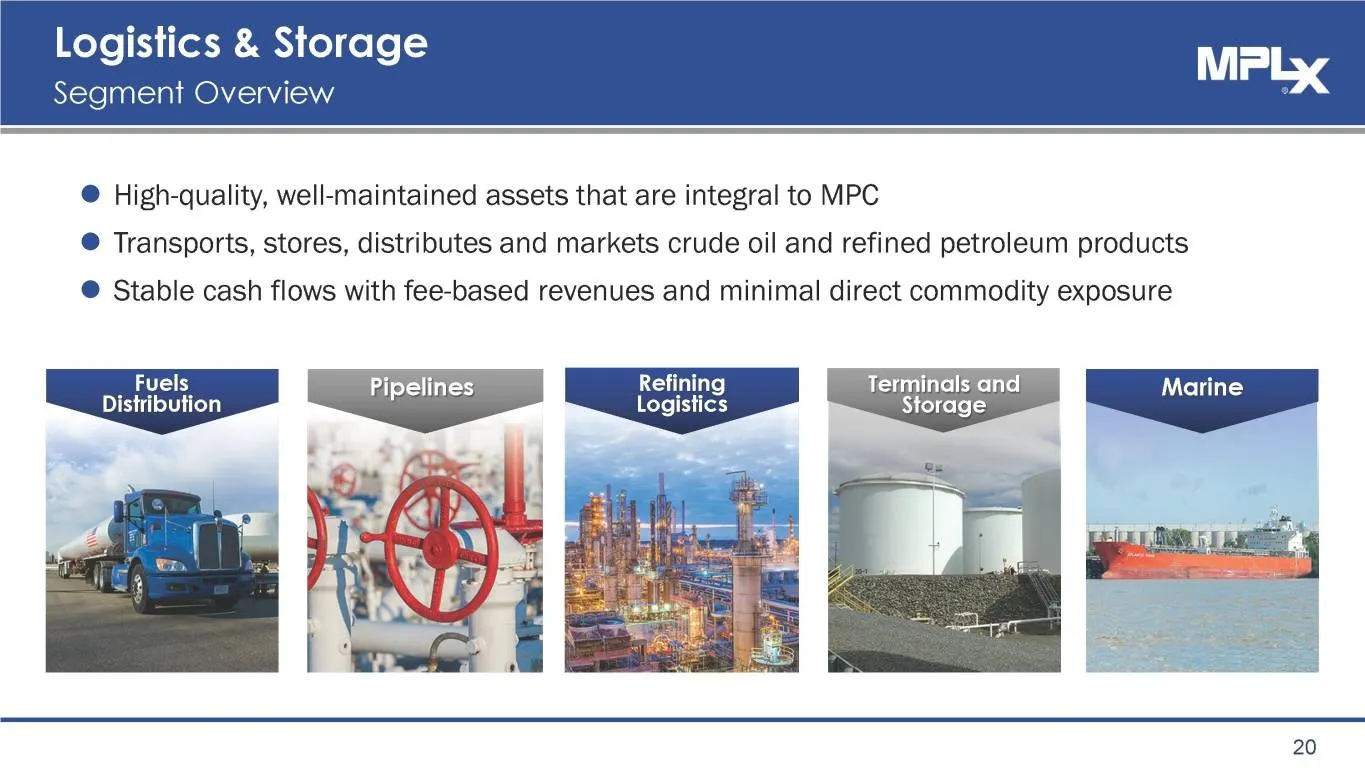
Slide 20: Logistics & Storage
Logistics & Storage Segment Overview ® High-quality, well-maintained assets that are integral to MPC @ Transports, stores, distributes and markets crude oil and refined petroleum products ® Stable cash flows with fee-based revenues and minimal direct commodity exposure Terminals and Storage 20
Slide 21: Logistics & Storage Segment
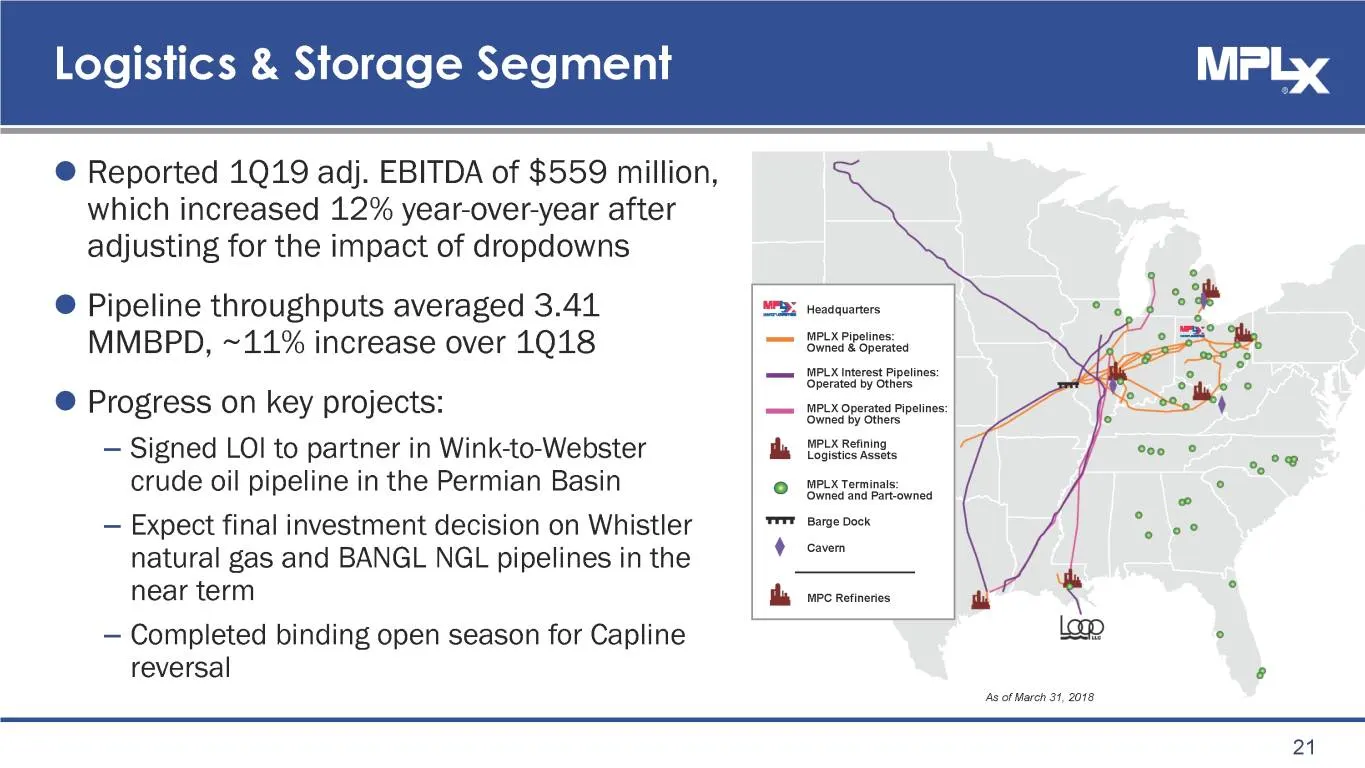
Logistics & Storage Segment @ Reported 1Q19 adj. EBITDA of $559 million, which increased 12% year-over-year after adjusting for the impact of dropdowns @ Pipeline throughputs averaged 3.41 MPS Headquarters MMBPD, ~11% increase over 1Q18 an Oa @ Progress on key projects: = =e — Signed LOI to partner
Slide 22: Fuels Distribution Overview
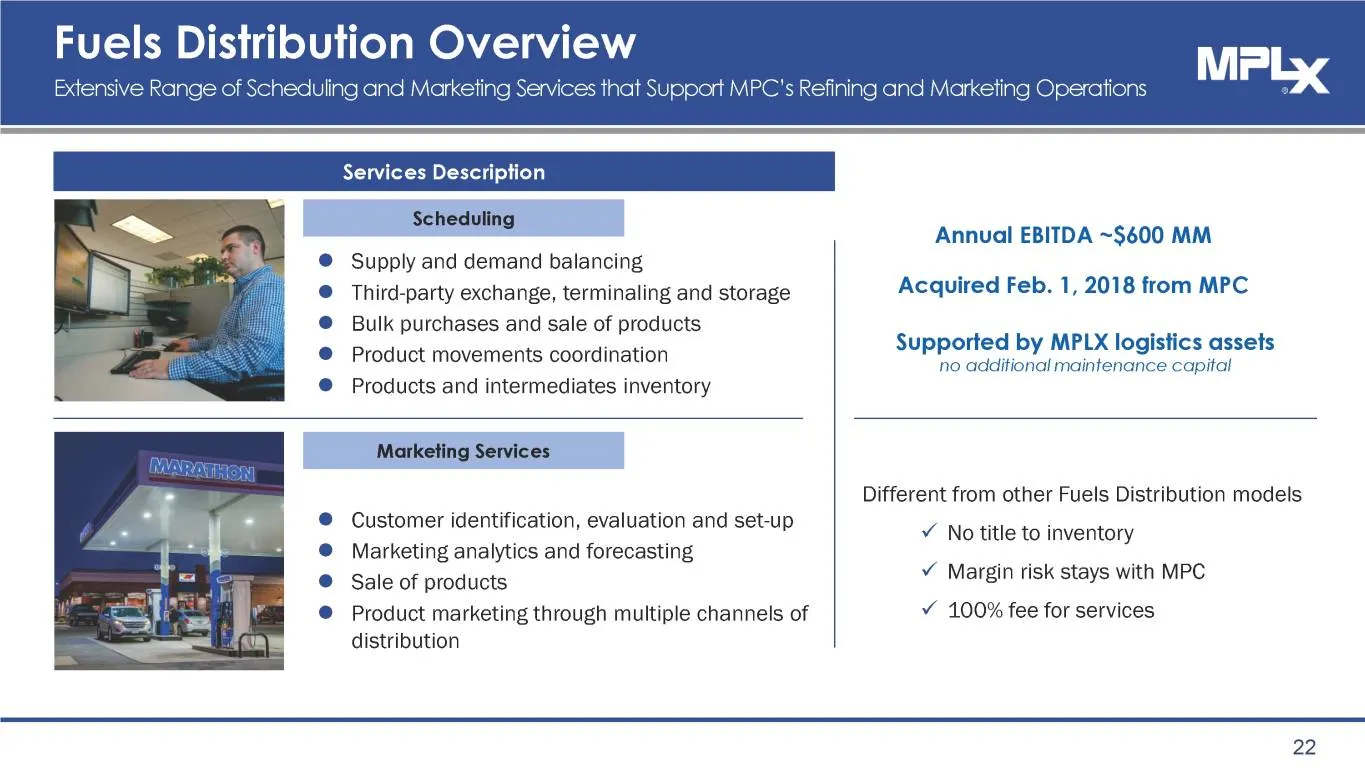
Fuels Distribution Overview Extensive e of Scheduling and Marketing Services that ‘ upport MPC's Refining and Marketing Operations MPLy Services Description Scheduling Supply and demand balancing Third-party exchange, terminaling and storage Bulk purchases and sale of products Product movements coor
Slide 23: Crude Oil Pipelines
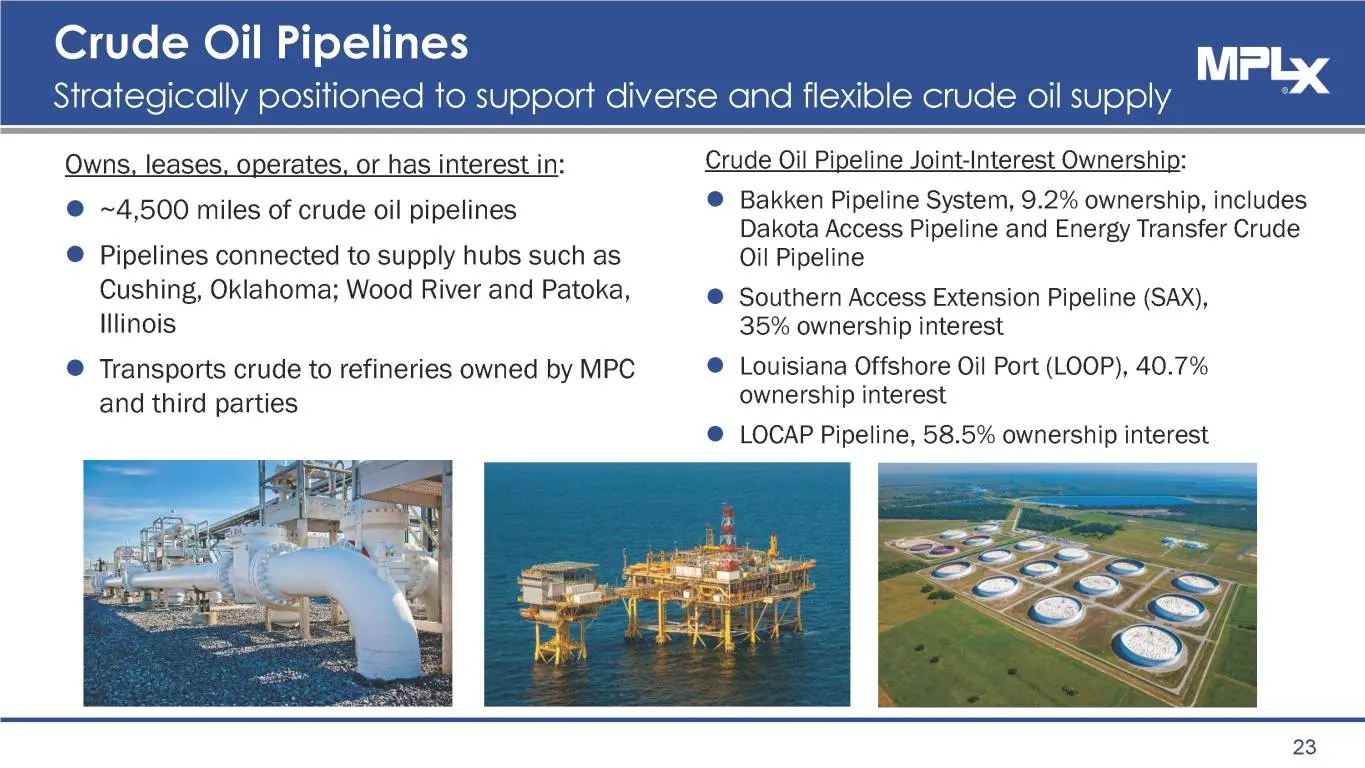
Crude Oil Pipelines MPL Strategically positioned to support diverse and flexible crude oil supply Crude Oil Pipeline Joint-Interest Ownership: @ Bakken Pipeline System, 9.2% ownership, includes Dakota Access Pipeline and Energy Transfer Crude Owns, leases, operates, or has interest in: @ ~4,500 mile
Slide 24: Product Pipelines
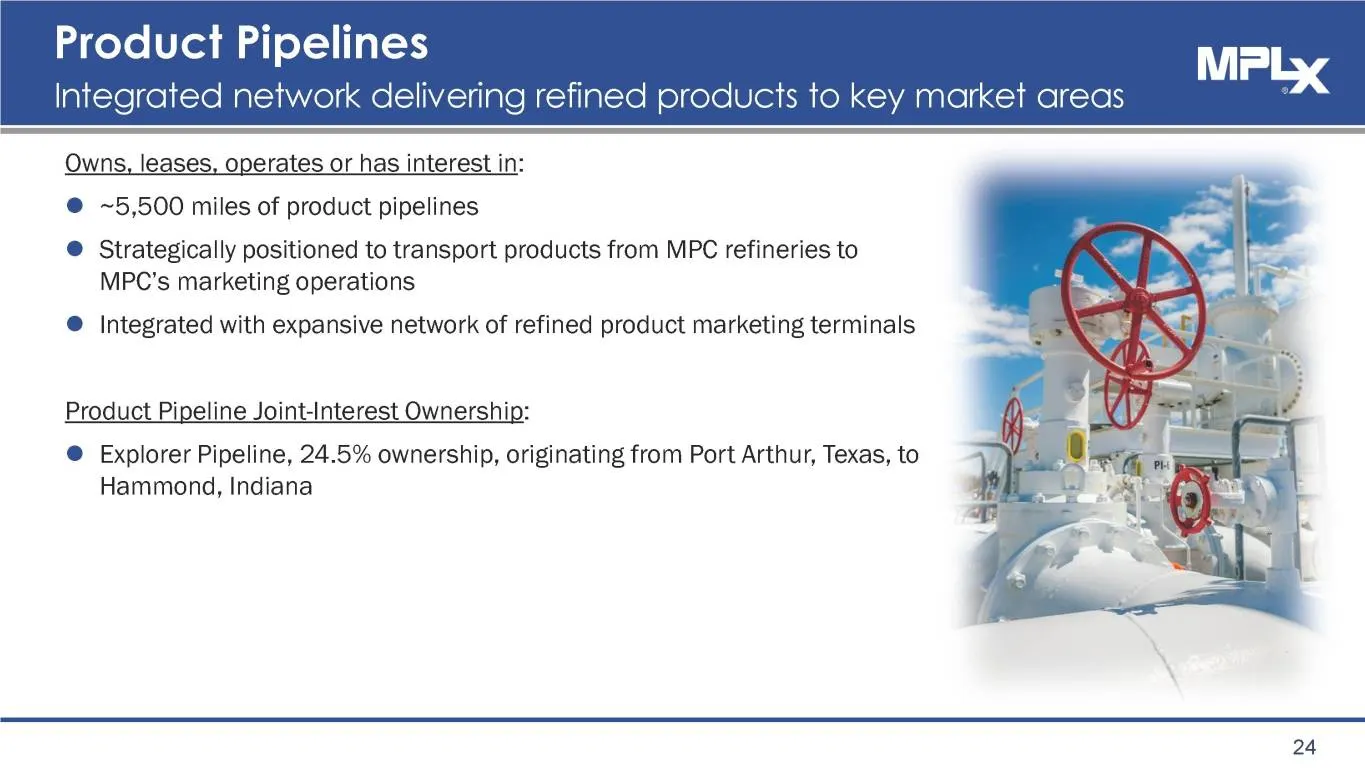
Product Pipelines Integrated network delivering refined products to key market areas Owns, leases, operates or has interest in: @ ~5,500 miles of product pipelines @ Strategically positioned to transport products from MPC refineries to MPC’s marketing operations @ Integrated with expansive network o
Slide 25: Refining Logistics Overview
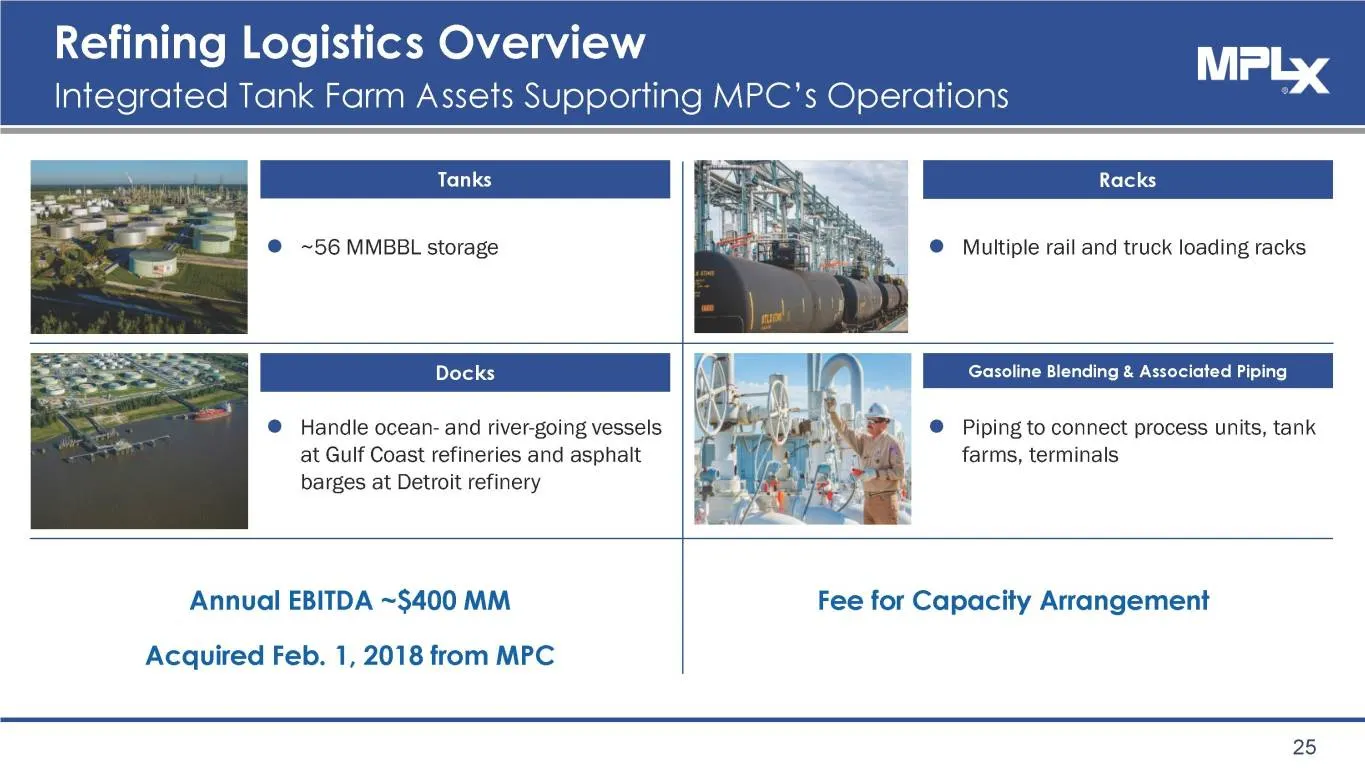
Refining Logistics Overview Integrated Tank Farm Assets Supporting MPC’s Operations @ ~56 MMBBL storage @ Multiple rail and truck loading racks Gasoline Blending & Associated Piping @ Piping to connect process units, tank farms, terminals @ Handle ocean- and river-going vessels at Gulf Coast refiner
Slide 26: Terminal and Storage Assets
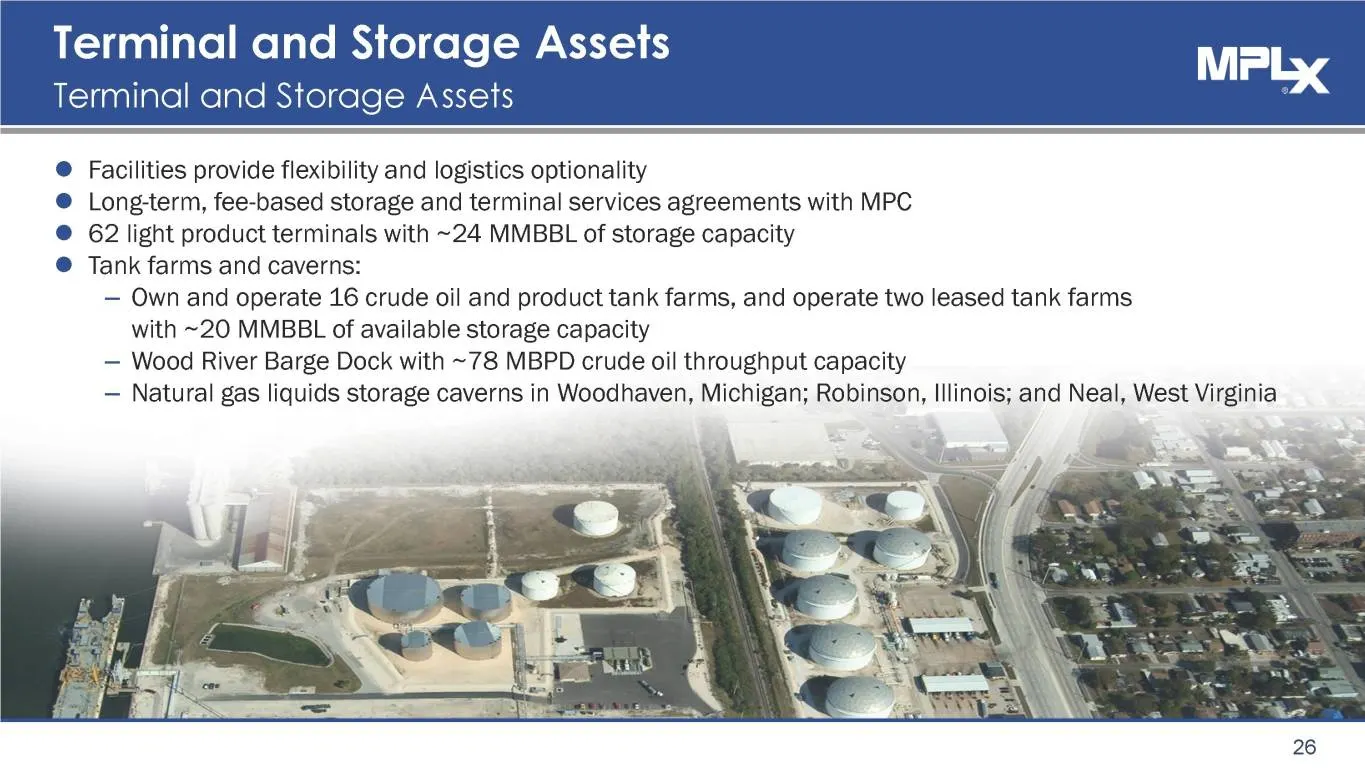
Terminal and Storage Assets Terminal and Storage Assets ® Facilities provide flexibility and logistics optionality @ Long-term, fee-based storage and terminal services agreements with MPC. @ 62 light product terminals with ~24 MMBBL of storage capacity @ Tank farms and caverns: — Own and operate 16
Slide 27: Marine Transportation Operations
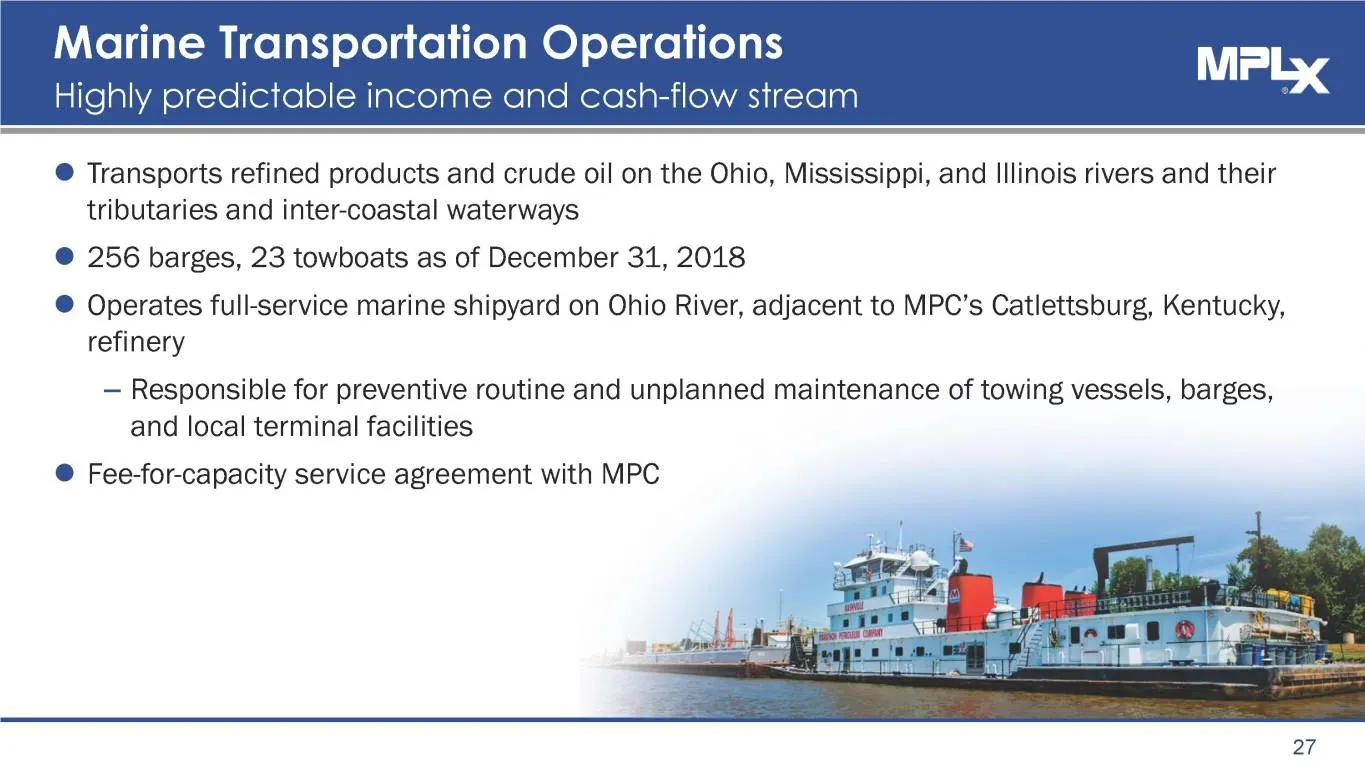
Marine Transportation Operations Highly predictable income and cash-flow stream ® Transports refined products and crude oil on the Ohio, Mississippi, and Illinois rivers and their tributaries and inter-coastal waterways @ 256 barges, 23 towboats as of December 31, 2018 ® Operates full-service marine
Slide 28: Organic Growth Capital Projects
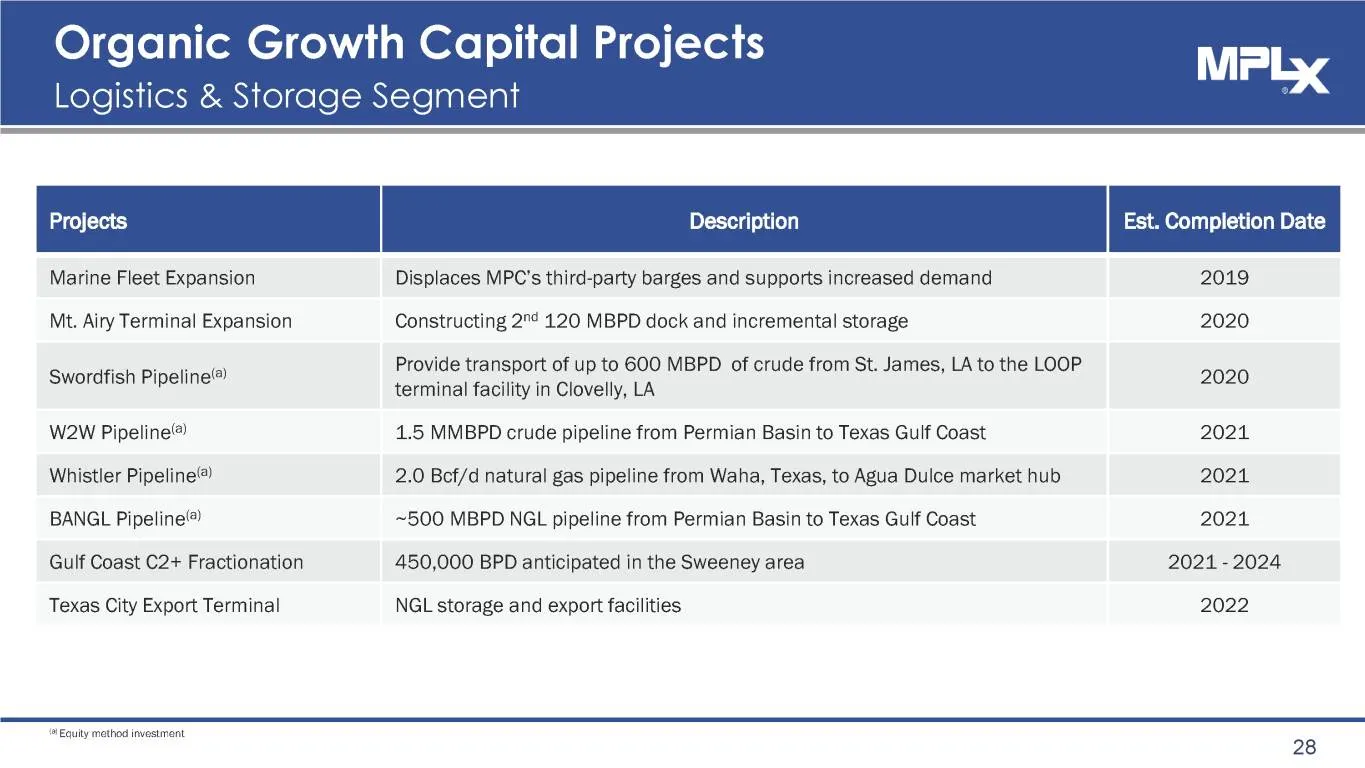
Organic Growth Capital Projects Logistics & Storage Segment a Sg heen Marine Fleet Expansion Displaces MPC's third-party barges and supports increased demand 2019 Mt. Airy Terminal Expansion Constructing 2"° 120 MBPD dock and incremental storage 2020 Provide transport of up to GOO MBPD of crude from
Slide 29: Gathering & Processing
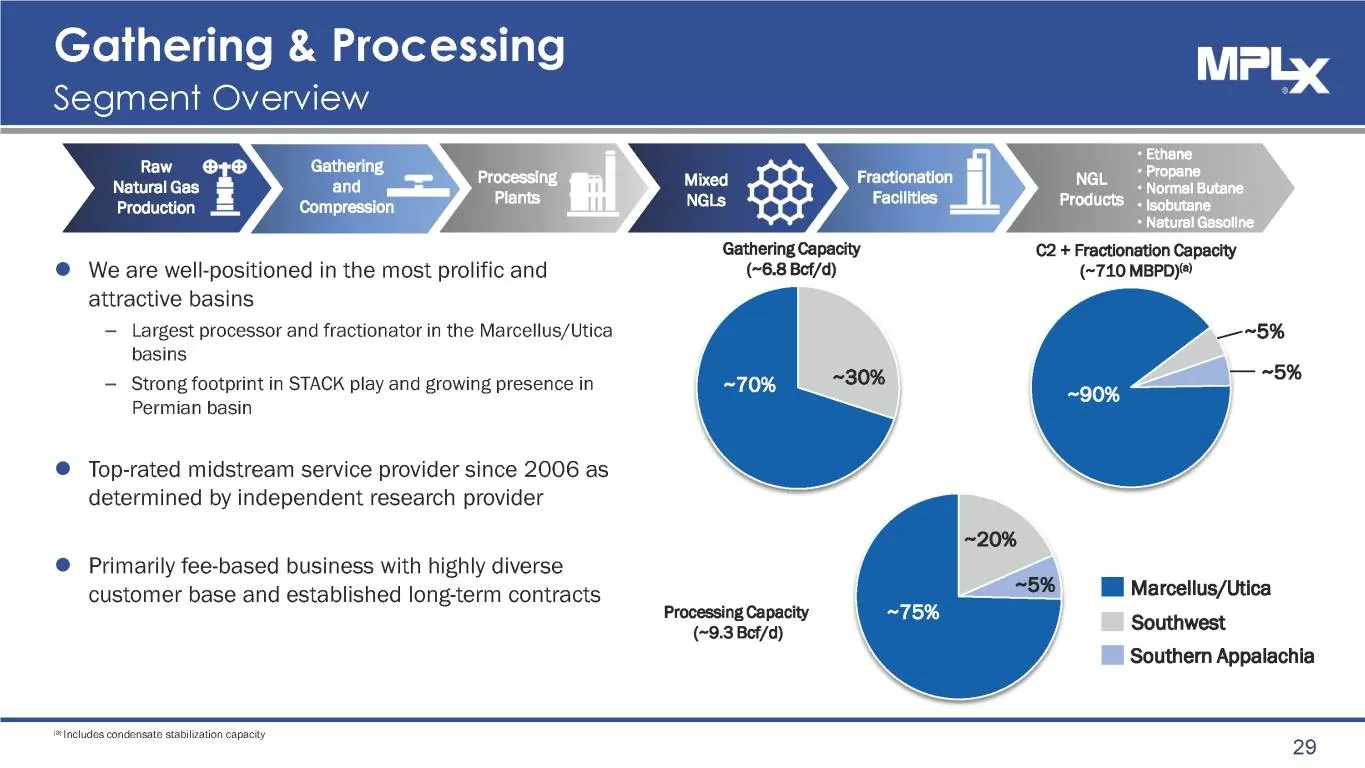
Gathering & Processing Segment Overview Raw eyo f Natural Gas Mixed a NGLs Production == Gathering Capacity C2 + Fractionation Capacity @ We are well-positioned in the most prolific and (~6.8 Bef/d) (~710 MBPD)® attractive basins — Largest processor and fractionator in the Marcellus/Utica basins — S
Slide 30: Gathering & Processing Segment
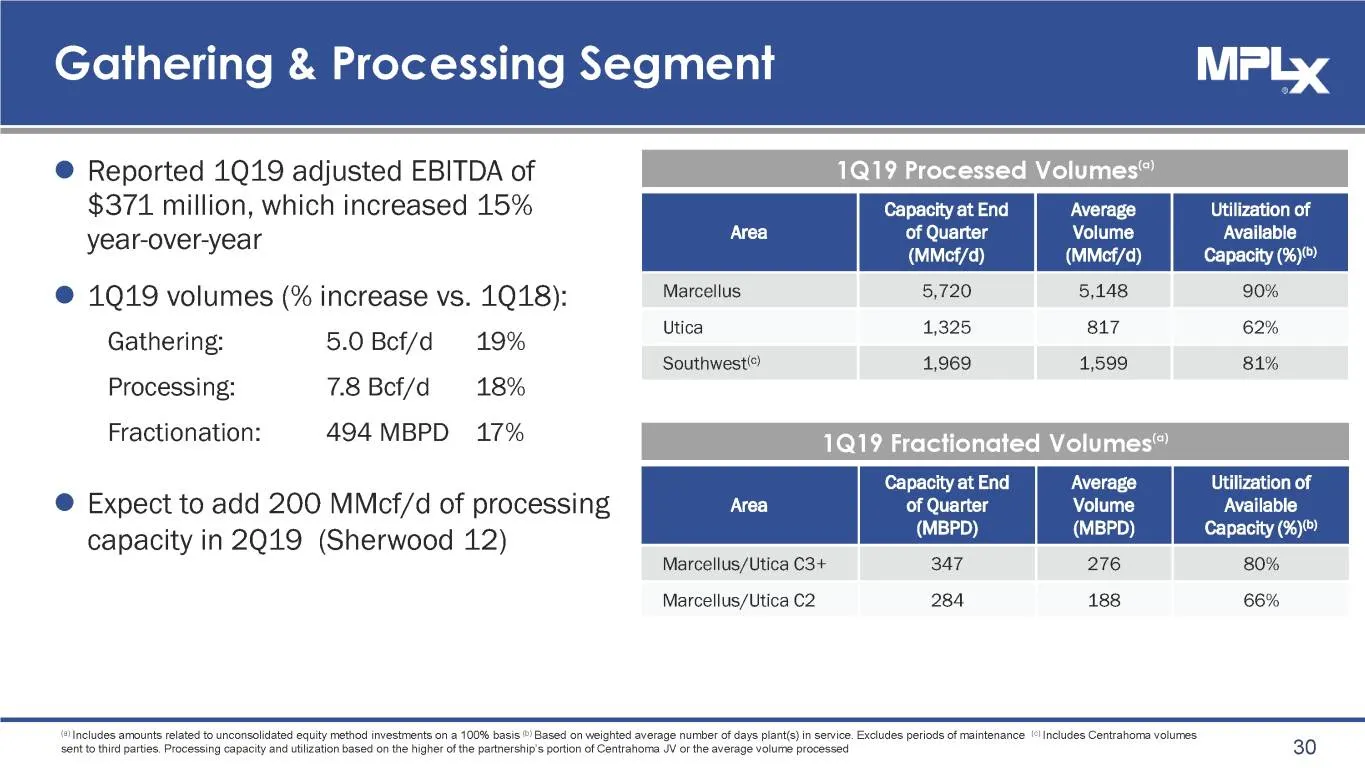
Gathering & Processing Segment ® Reported 1Q19 adjusted EBITDA of $371 million, which increased 15% Capacity at End Average n of v 7 of Quarter Volume Available year-over-year (MMcf/d) (MMcf/d) Capacity (%)®) @ 1Q19 volumes (% increase vs. 1Q18): MereiNe oe oe aan Gathering: 5.0 Bef/d 19% ica ase Si
Slide 31: Gathering & Processing Segment
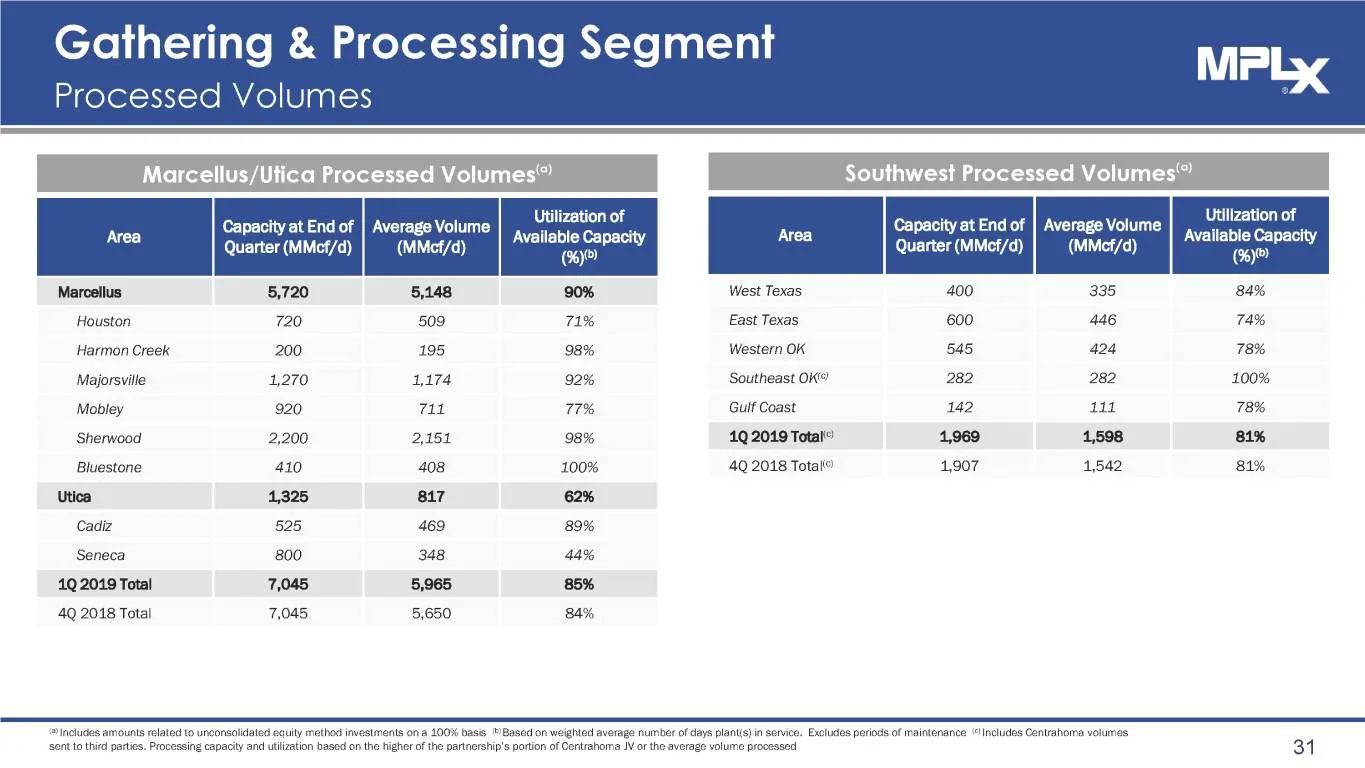
Gathering & Processing Segment Processed Volumes ee Capacity at End of | Average Volume pe hee Capacity at End of | Average Volume Wansbie Gay Quarter(MMcf/d) | (MMct/d) (my Quarter(MMct/a) | (MMct/d) ma Marcellus 5,720 5,148 90% West Texas 400 335 84% Houston 720 509 71% East Texas 600 446 74% Harm
Slide 32: Southwest: Considerable Scale
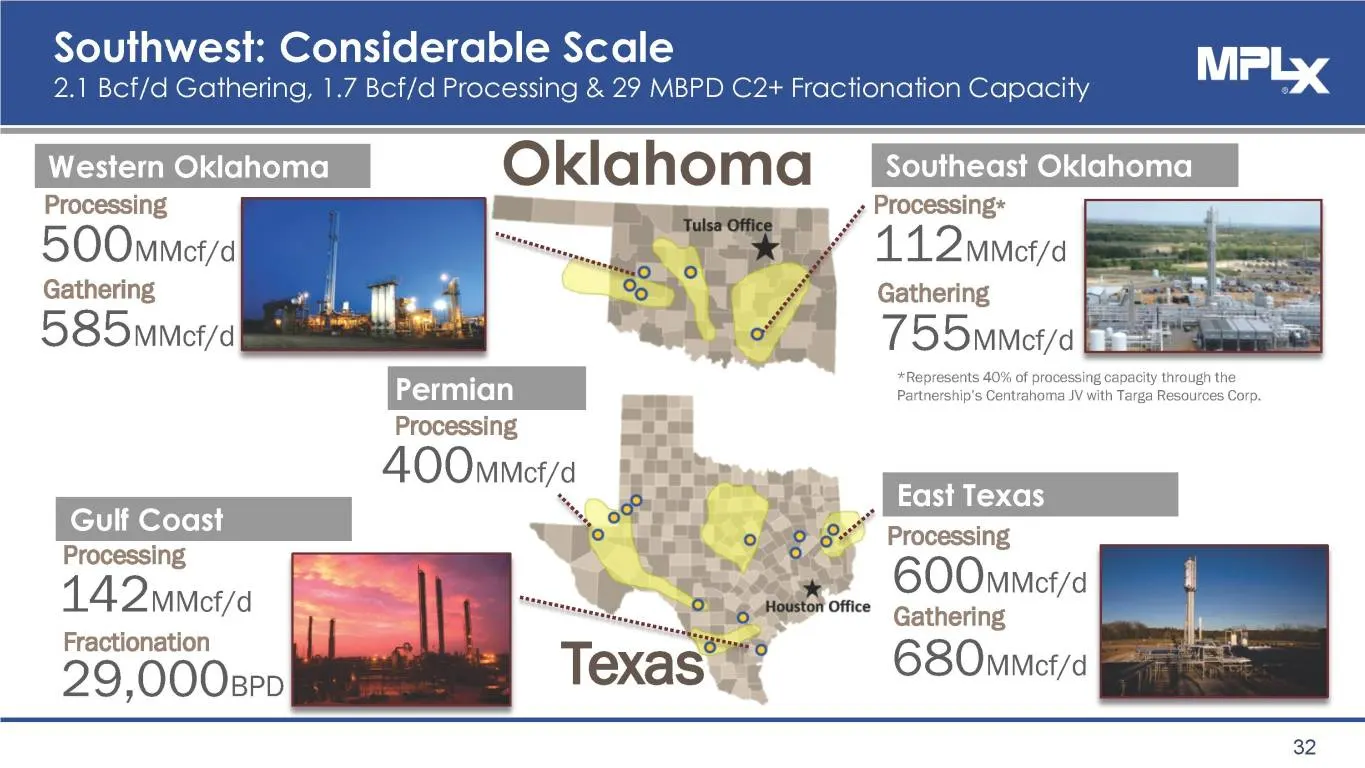
Southwest: Considerable Scale 2.1 Bcf/d Gathering, 1.7 Bcf/d Processing & 2? MBPD C2+ Fractionation Capacity uaiema Processing « Processing* 500mmcr/c iin * 112 mmetya Gathering 4 Gathering 585mmef/d Processing A00mmetya a eer Processing Processing 142 umer/d 600mmctya once Gathering Fractionation 2
Slide 33: Expanding Position to Support Growing Production
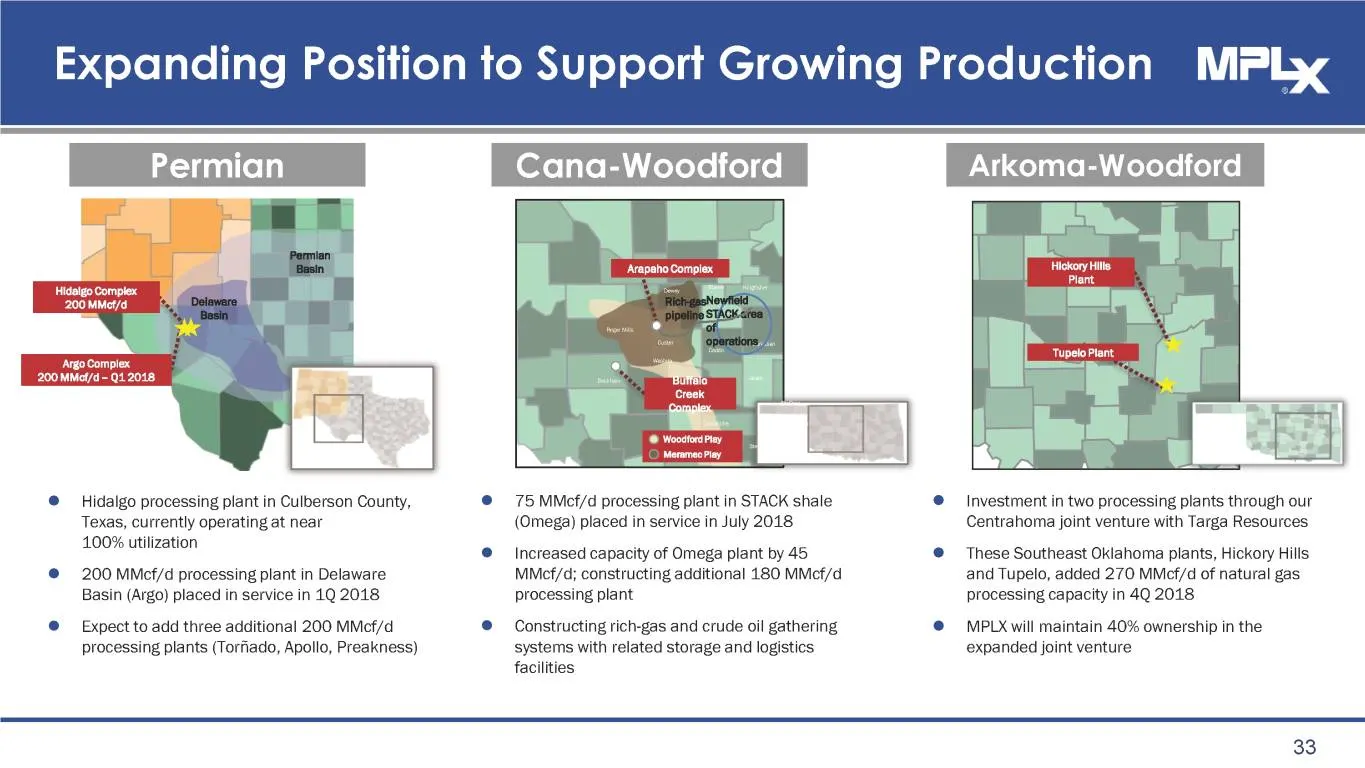
Expanding Position to Support Growing Production MPLy ‘Arapaho Complex | ee Hidalgo Complex 200 MMct/a | oo =. a | i F ie J LS a ‘Argo Complex 200 MMal/d- 91.2018 © Wooetont Py Meramec Play © Hidalgo processing plant in Culberson County, © 75MMef/d processing plant in STACK shale © Investment in two
Slide 34: Recap: Gathering & Processing Contract Structure
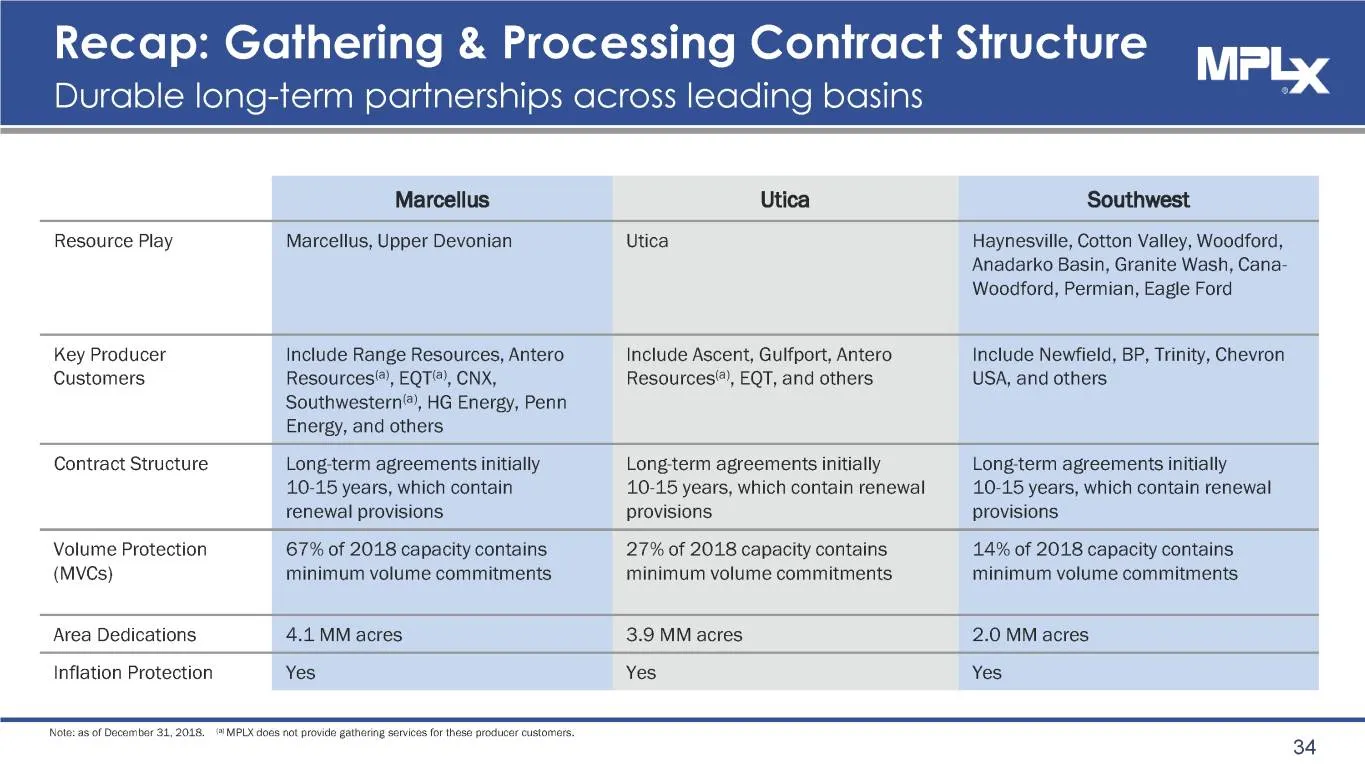
Recap: Gathering & Processing Contract Structure MP Durable long-term partnerships across leading basins Marcellus Utica x Southwest Resource Play Marcellus, Upper Devonian Utica Haynesville, Cotton Valley, Woodford, Anadarko Basin, Granite Wash, Cana- Woodford, Permian, Eagle Ford Key Producer Cust
Slide 35: Organic Growth Capital Projects
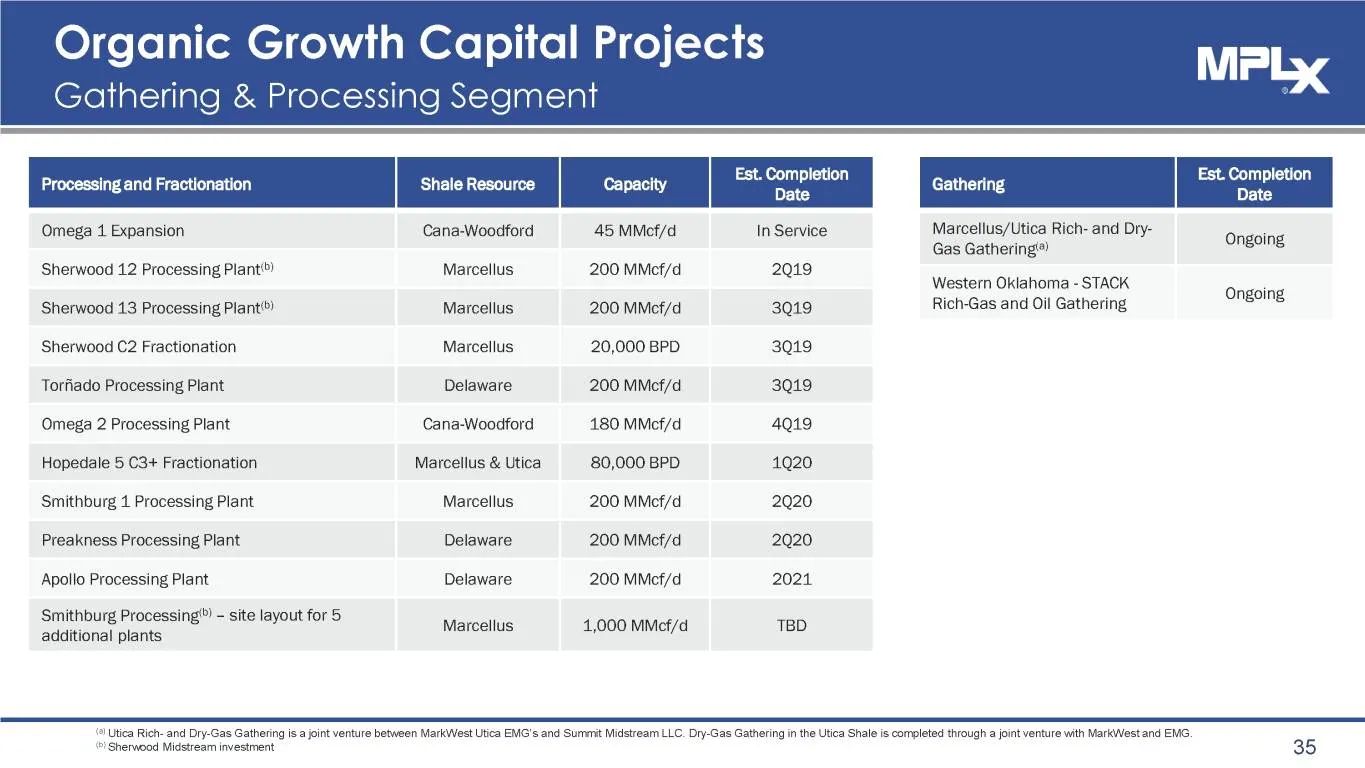
Organic Growth Capital Projects Gathering & Processing Segment Processing and Fractionation Shale Resource i ee gael Gathering ale compienen Omega 4 Expansion Cana-Woodford 45 MMef/d In Service Marcellus/Utica Rich- and Dry- Ongoing Gas Gathering®) Sherwood 12 Processing Plant”) Marcellus 200 MMef/d
Slide 36: 36
36
Slide 37: Appendix
Appendix 37
Slide 38: MPLX 2019 Outlook — Reconciliation
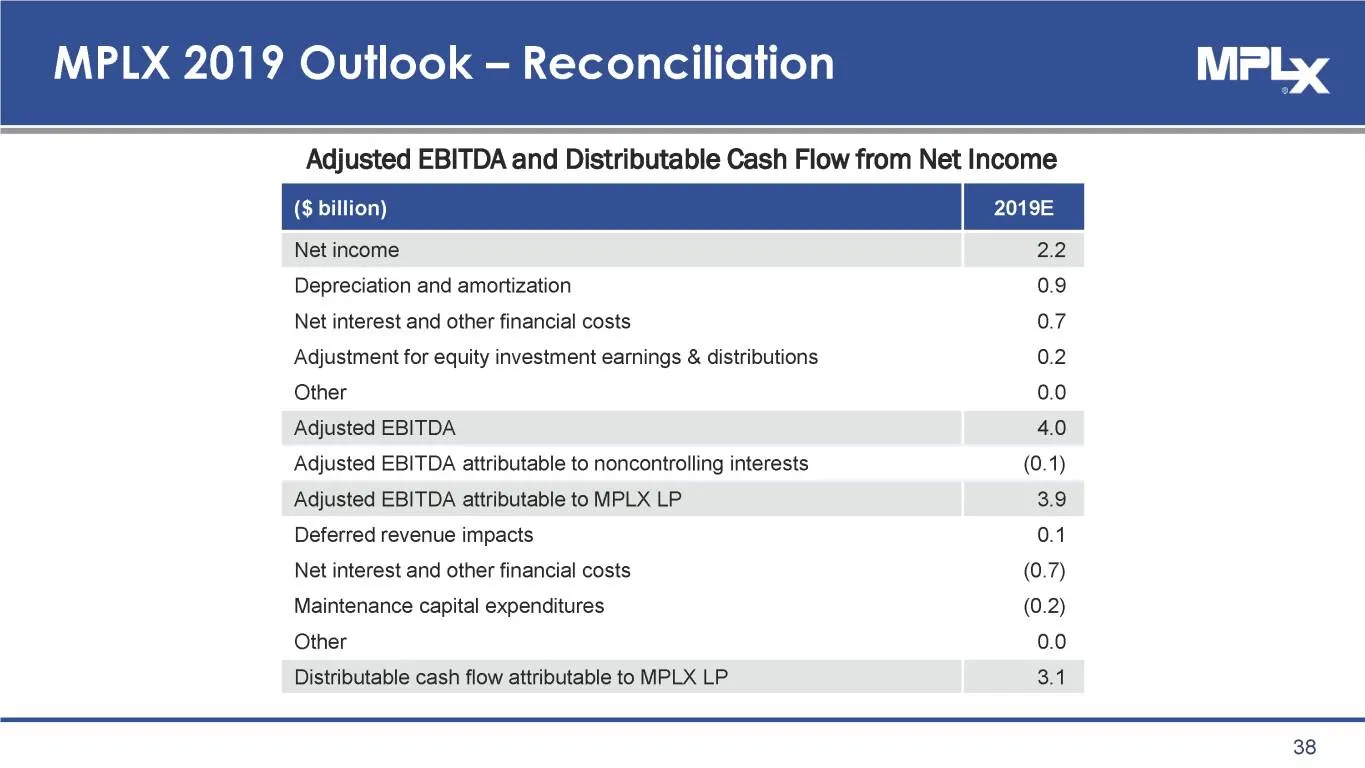
MPLX 2019 Outlook — Reconciliation Adjusted EBITDA and Distributable Cash Flow from Net Income feet | i | Net income 22 Depreciation and amortization 0.9 Net interest and other financial costs 0.7 Adjustment for equity investment earnings & distributions 0.2 Other 0.0 Adjusted EBITDA 4.0 Adjusted EB
Slide 39: ANDX 2019 Outlook — Reconciliation
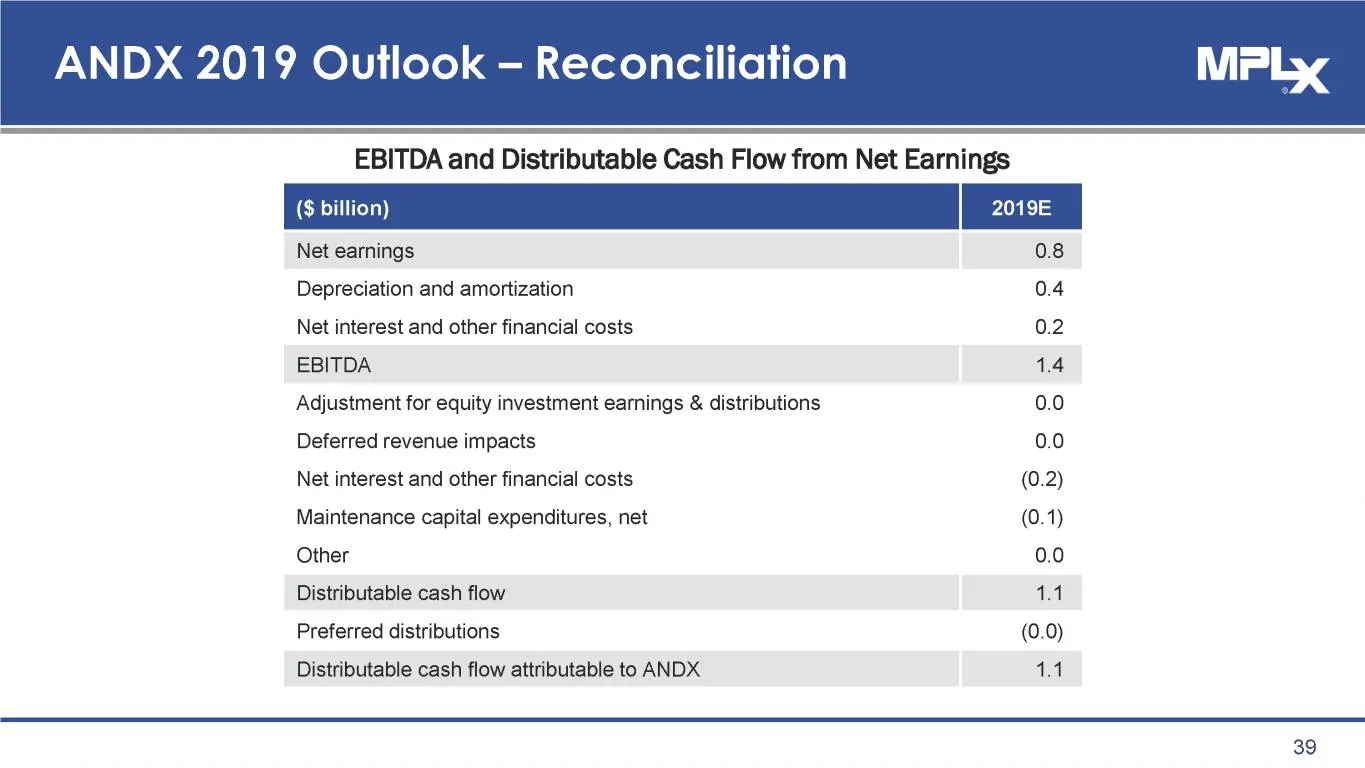
ANDX 2019 Outlook — Reconciliation EBITDA and Distributable Cash Flow from Net Earnings a Net earnings 0.8 Depreciation and amortization 0.4 Net interest and other financial costs 0.2 EBITDA 1.4 Adjustment for equity investment earnings & distributions 0.0 Deferred revenue impacts 0.0 Net interest a
Slide 40: Reconciliation of Adjusted EBITDA and Distributable Cash Flow from Net Income
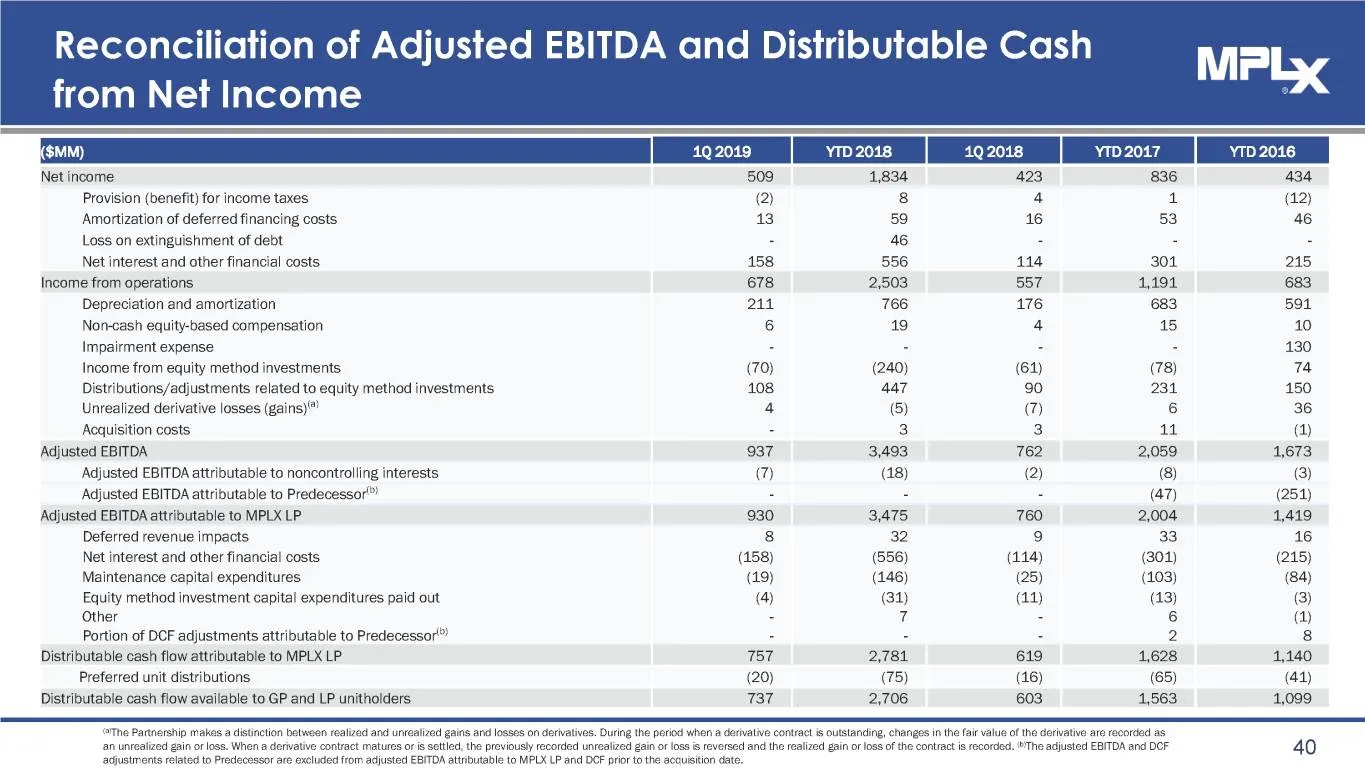
Reconciliation of Adjusted EBITDA and Distributable Cash MPL from Net Income Net income 1,834 Provision (benefit) for income taxes @ 8 a a = Amortization of deferred financing costs 13 59 16 53 46 Loss on extinguishment of debt : 46 - : : Net interest and other financial costs 158 556 114 304 215 In
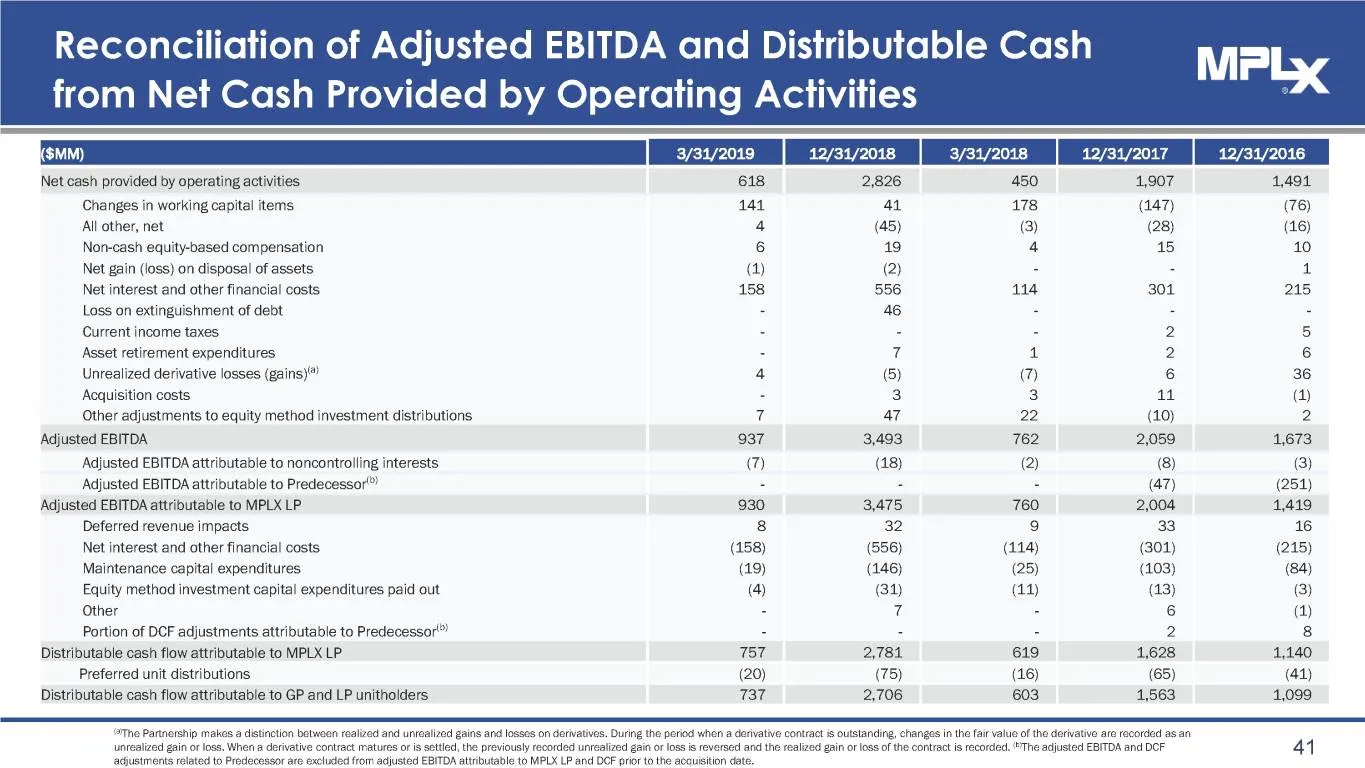
Slide 41: Reconciliation of Adjusted EBITDA and Distributable Cash Flow from Net Cash Provided by Operating Activities
Reconciliation of Adjusted EBITDA and Distributable Cash MPL from Net Cash Provided by Operating Activities Net cash provided by operating activities 2,826 1,907 1491 Changes in working capital items 144 41 178 (147) (76) All other, net 4 (45) (3) (28) (16) Non-cash equity-based compensation 6 19 4
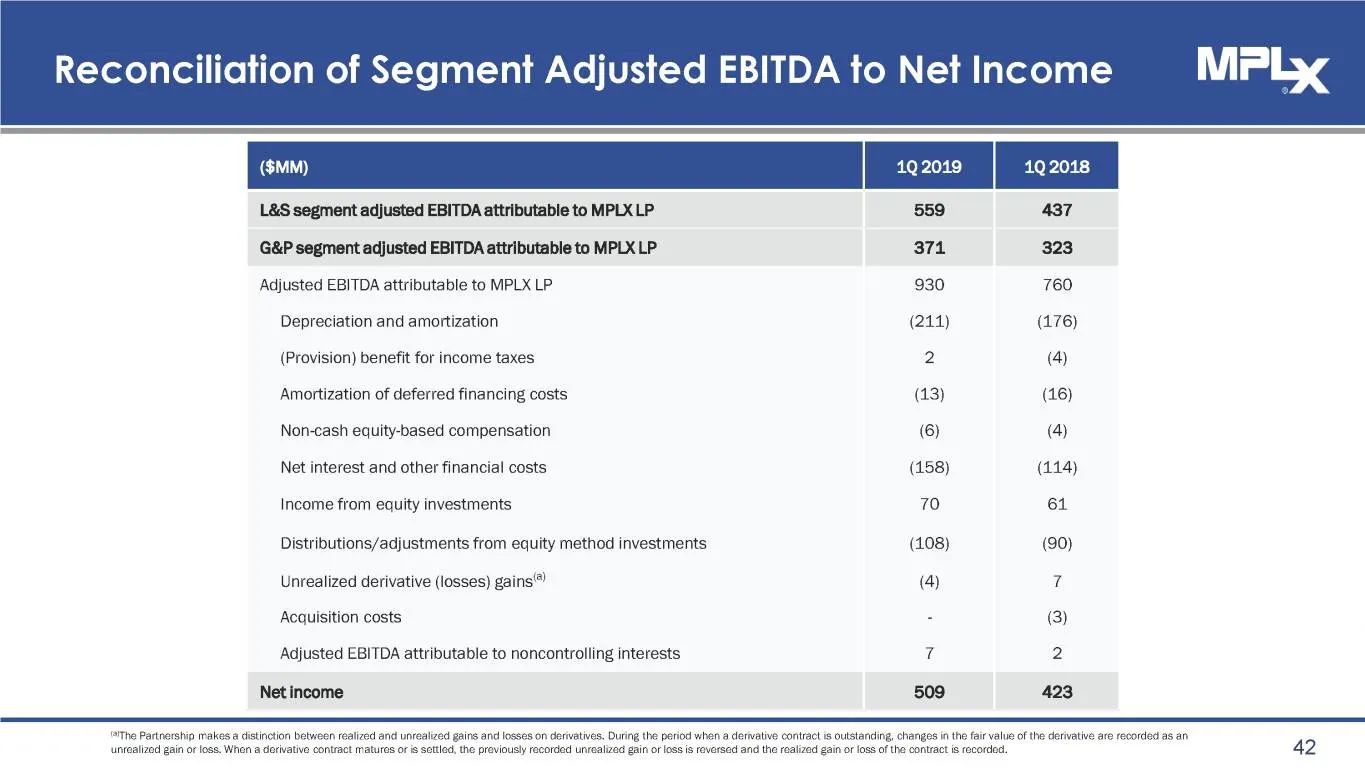
Slide 42: Reconciliation of Segment Adjusted EBITDA to Net Income
Reconciliation of Segment Adjusted EBITDAto NetIncome MPL L&S segment adjusted EBITDA attributable to MPLX LP 559 437 G&P segment adjusted EBITDA attributable to MPLX LP 371 323 Adjusted EBITDA attributable to MPLX LP 930 760 Depreciation and amortization (211) (176) (Provision) benefit for income t
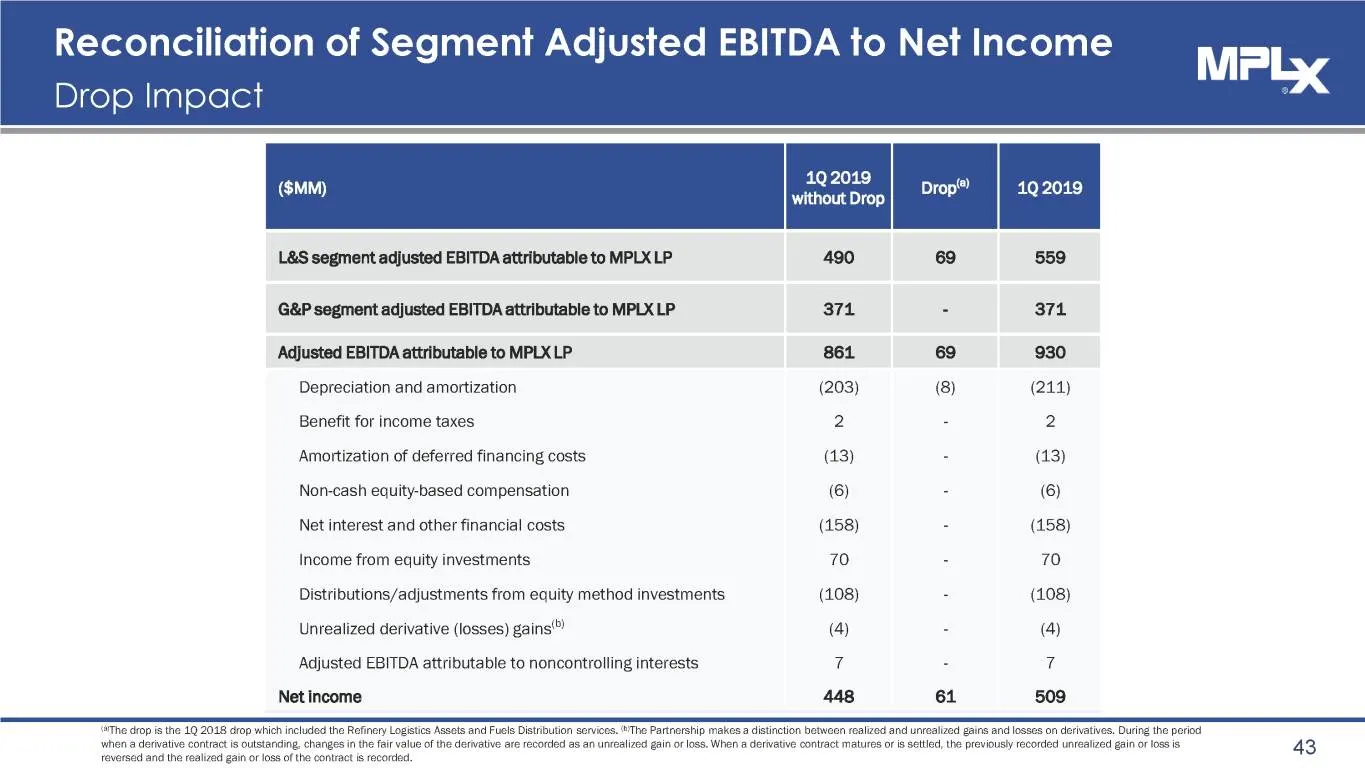
Slide 43: Reconciliation of Segment Adjusted EBITDA to Net Income
Reconciliation of Segment Adjusted EBITDA to Net Income MPL Drop Impact 192019 without Drop L&S segment adjusted EBITDA attributable to MPLX LP 490 69 559 G&P segment adjusted EBITDA attributable to MPLX LP 371 - 371 Adjusted EBITDA attributable to MPLX LP 861 69 930 Depreciation and amortization (2
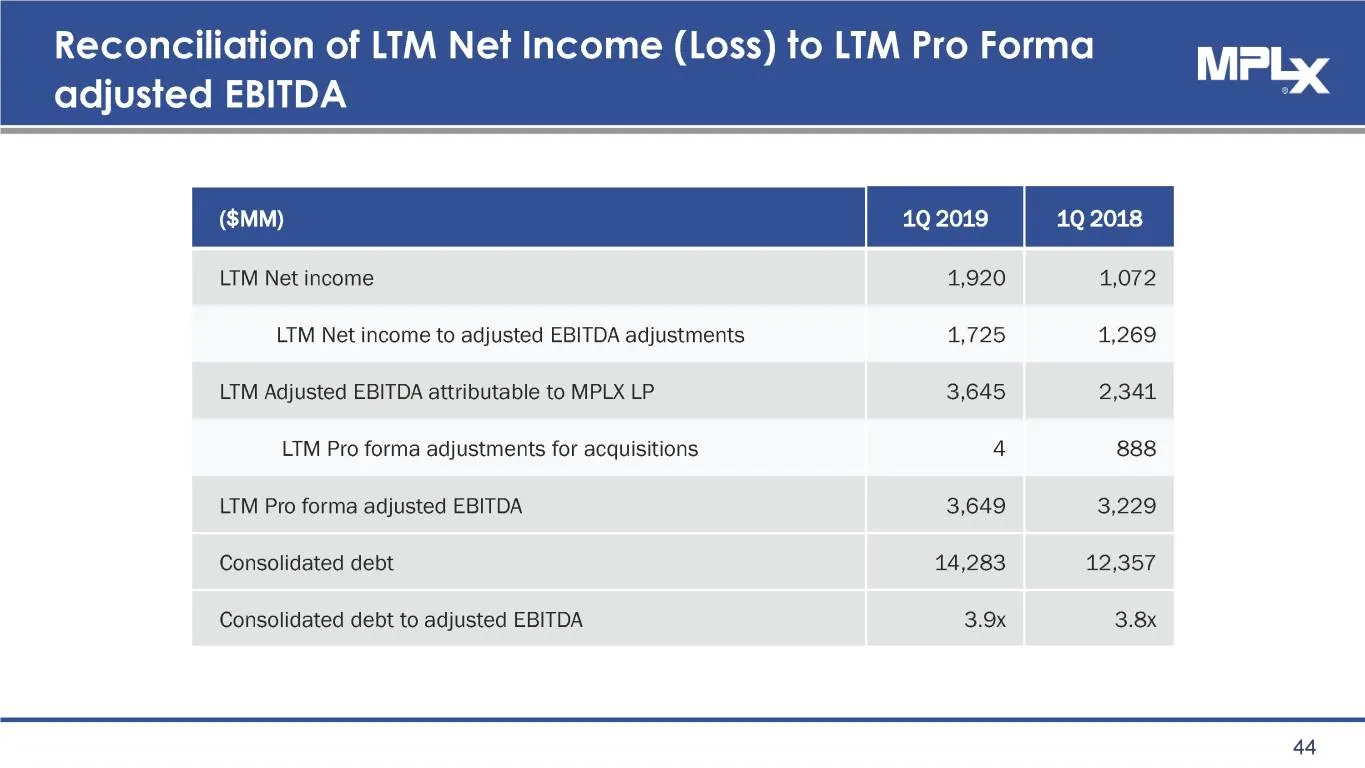
Slide 44: Reconciliation of LTM Net Income to LTM Pro Forma Adjusted EBITDA
Reconciliation of LIM Net Income (Loss) to LTM Pro Forma MPL adjusted EBITDA LTM Net income 1,920 1,072 LTM Net income to adjusted EBITDA adjustments 4,725 1,269 LTM Adjusted EBITDA attributable to MPLX LP 3,645 2,341 LTM Pro forma adjustments for acquisitions 4 888 LTM Pro forma adjusted EBITDA 3,6
Source: SEC EDGAR · 425 filed May 15, 2019
More decks from Andeavor Logistics LP
 Merger or Acquisition (June 2019)40 slides · Jun 26, 2019
 Merger or Acquisition (June 2019)60 slides · Jun 3, 2019
 RBN Energy Export Conference 201917 slides · May 21, 2019
 Merger or Acquisition (May 2019)59 slides · May 9, 2019
 Merger or Acquisition (May 2019)28 slides · May 8, 2019
 UBS Midstream and MLP Conference 201824 slides · Jan 9, 2018