Plains Exploration & Production Company
Plains Exploration & Production — Corporate Update (February 2009)
41 slides from Plains Exploration & Production's corporate update, Feb 26, 2009

Slide 1: February 2009 Update
February 2009 Update February 2009 Update Exhibit 99.2

Slide 2: Innovative, Balanced, Experienced
Innovative Balanced Experienced PXP is an independent oil and gas company primarily engaged in the activities of acquiring, developing, exploring and producing oil and gas in its core areas of operation: California, Texas, Louisiana and Gulf of Mexico. PXP is headquartered in Houston, Texas. www.pxp

Slide 3: Corporate Information and Forward Looking Statements
2 Plains Exploration & Production Company 700 Milam, Suite 3100 Houston, Texas 77002 This presentation is not for reproduction or distribution to others without PXP’s consent. James C. Flores – Chairman, President & CEO Winston M. Talbert – Exec. Vice President & CFO Hance V. Myers – Vice President
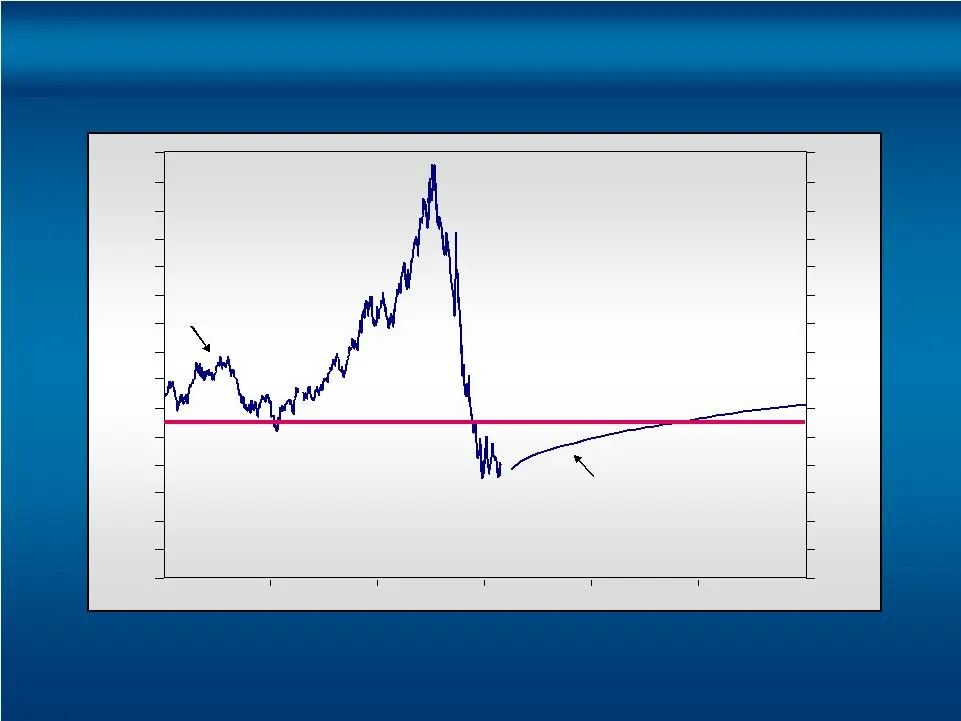
Slide 4: Historical Prices: WTI NYMEX and Forward Curve
3 Source: Goldman Sachs, NYMEX Historical Prices WTI NYMEX and Forward Curve February 23, 2009 NYMEX Oil Price $150 2006 2007 2008 2009 2010 2011 $ 0 $150 $ 0 2012

Slide 5: 2008 Asset Rotation
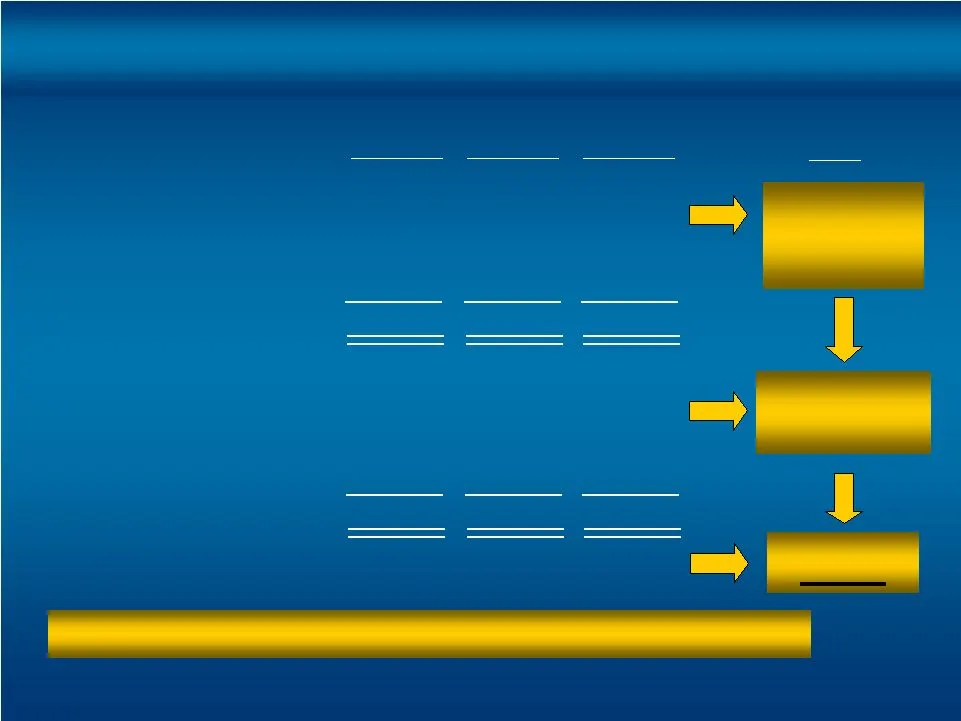
4 Piceance, Permian #1 SJ Basin, Barnett Piceance, Permian #2 $1.53 B $199 MM $1.25 B South Texas Haynesville $282 MM $1.65 B Reduced net debt by $800 MM Repurchased over 5% of PXP shares for $304 MM (1) Excludes fees associated with divestment. (2) Excludes Piceance Basin expansion and certain fees
Slide 6: Strengthening Balance Sheet
5 2009 09/30/08 $ 2 373 9,190 1,071 $10,636 $ 30 3,534 3,135 3,937 $10,636 47% 12/31/08 $ 312 1,476 4,513 811 $ 7,112 $ 0 2,805 1,930 2,377 $ 7,112 54% 12/31/07 $ 25 2 8,377 1,289 $ 9,693 $ 114 3,305 2,936 3,338 $ 9,693 50% (Millions) Cash Commodity Derivatives PP&E, net Other Assets Total Assets Co

Slide 7: Business Transformation Accomplished Through Strategic Execution
6 Positioned for challenging commodity price environment Sustainable reserve and production growth enabled by superior asset rotation Low cost hedge strategy to ensure operating viability Maintain exploration component to provide additional upside catalyst Business Transformation Accomplished Throug

Slide 8: PXP 2009 Operational Strategy
7 High grading reduced capital expenditures toward higher rate of return development projects Drill high impact exploration Lower LOE expenses Reduce G&A expense PXP 2009 Operational Strategy Maximize returns on existing portfolio with growing production and reserves

Slide 9: PXP 2009 Financial Strategy
8 Monetize +$100 oil puts for 2009 and 2010 Retain downside protection with $55 oil puts for 2009 and 2010 Retain current 2009 gas hedges ($10 x $20 collars) and add new gas hedges for 2010 Use approximately $1,100 MM from (+$100 oil puts) monetization to repay outstanding balance under revolver Sin
Slide 10: 2009 Hedge Positions
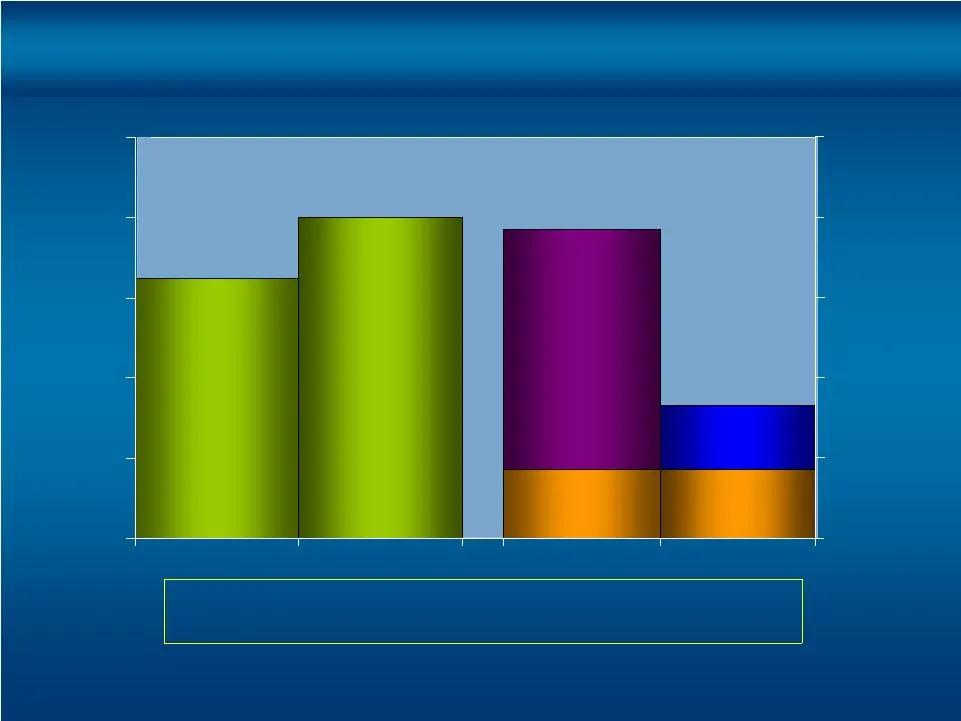
9 0 10 20 30 40 50 2009 2010 0 50 100 150 200 250 2009 2010 MMbbl/d 71% Protected (1) $55 Puts $10 - $20 Collars Physical Purchase (3) MMcf/d $55 Puts 3 Way Collars (2) Physical Purchase (3) Oil Gas (1) 2009e production represents guidance mid-point. (2) PXP receives difference between floor of $6.2
Slide 11
Slide 12
Slide 13
Slide 14: Financial Strength: Liquidity and Debt Maturity Profile
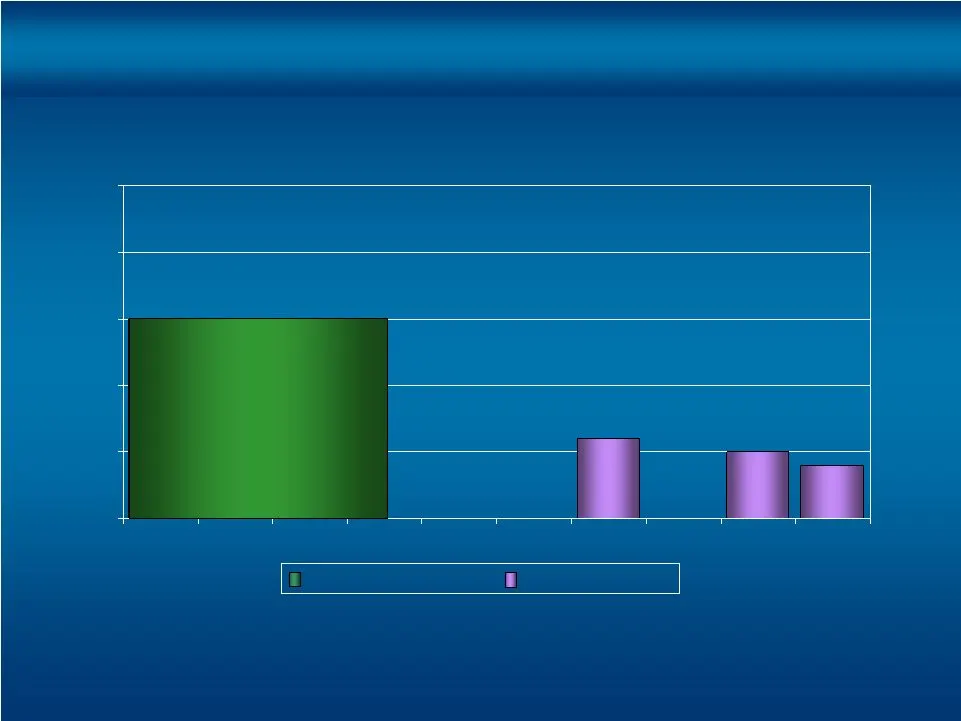
10 0 500 1,000 1,500 2,000 2,500 2009 2010 2011 2012 2013 2014 2015 2016 2017 2018 (1) Pro forma 12/31/08 for estimated borrowing base. Credit Capacity Senior Notes Liquidity and Debt Maturity Profile Millions $600 $400 $500 Financial Strength Strong Liquidity With No Near Term Debt Maturities $1,50
Slide 15
Slide 16: AoOgW
AoOgW

Slide 17

Slide 18

Slide 19: Year End Proved Reserves Target at $44.60 & $5.71
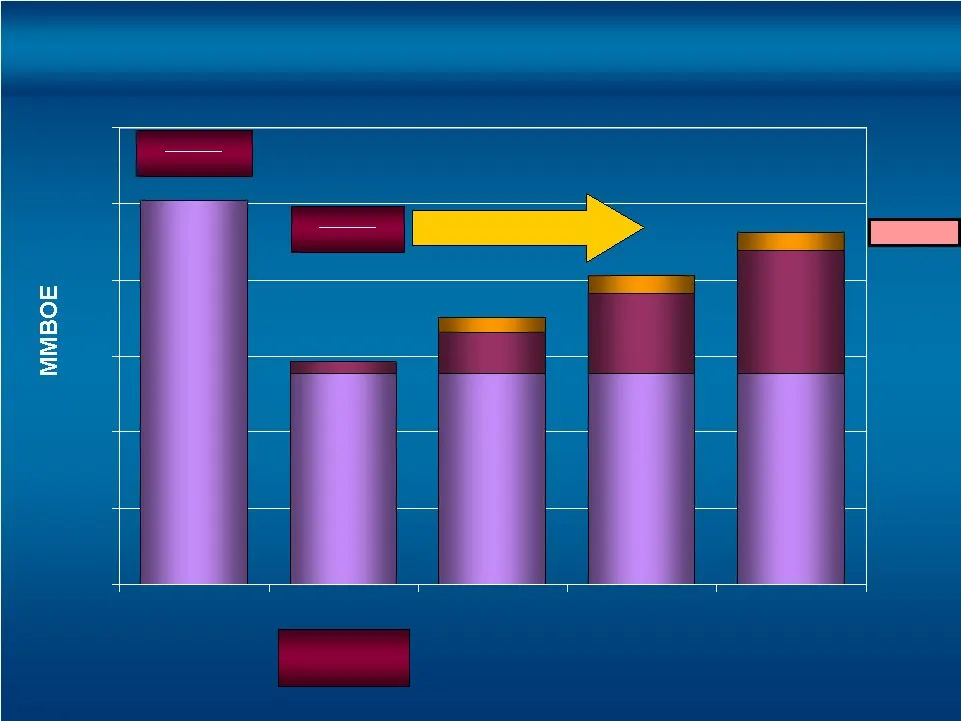
12 0 100 200 300 400 500 600 2007 2008 2009 2010 2011 NYMEX $95.98/$7.48 292 351 (1) 406 (1) 463 (1) 277 15 H - Ville 20 Friesian 54 H-Ville 277 24 Friesian 105 H-Ville 277 24 Friesian 162 H-Ville 277 507 -204 MMBOE revision due to price NYMEX $44.60/$5.71 Total Adds 84 Total Adds 90 Total Adds 89 (
Slide 20: Year End Proved Reserves Target at Strip Pricing
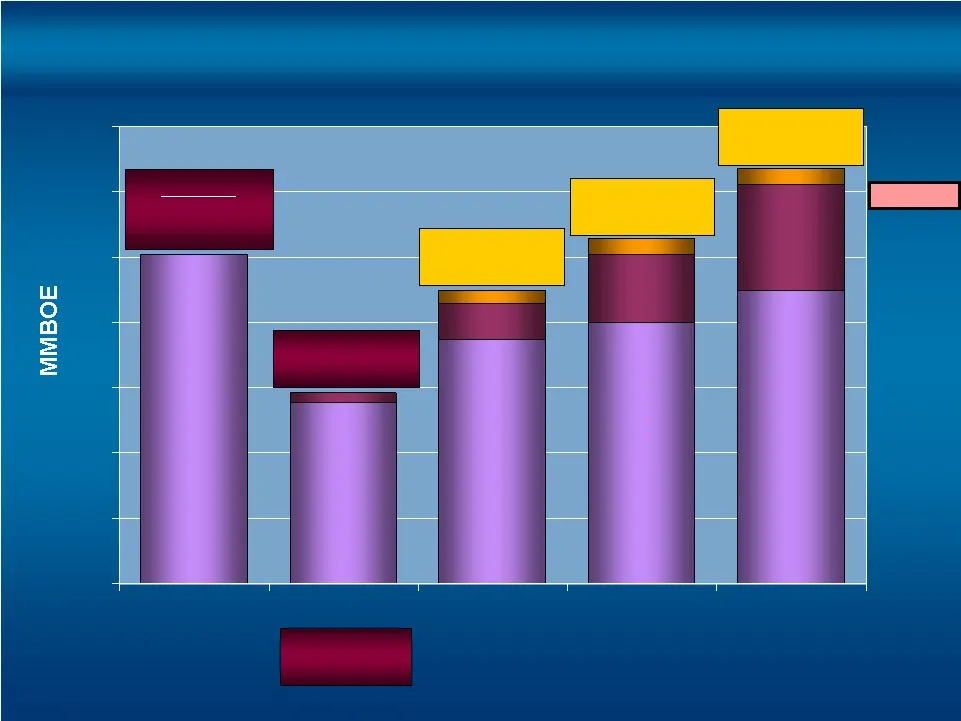
13 0 100 200 300 400 500 600 700 2007 2008 2009 2010 2011 $44.60/$5.71 292 -204 MMBOE revision due to price 277 72% PD 28% PUD 15 H - Ville 20 Friesian 54 H-Ville 375 24 Friesian 105 H-Ville 400 24 Friesian 162 H-Ville 450 NYMEX oil and gas Strip Prices used are illustrated above the respective year

Slide 21: +2.2 Billion BOE Resource Potential
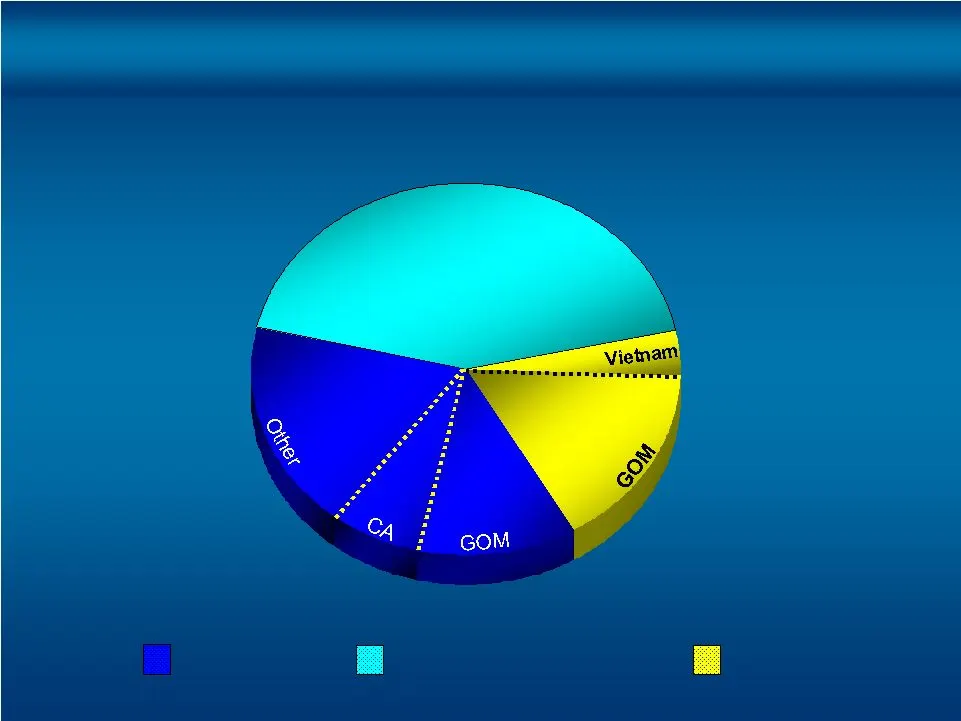
14 950 MMBOE 335 MMBOE 115 MMBOE 53 MMBOE 32 MMBOE Haynesville California Panhandle/S. TX Gulf of Mexico Rockies 650 MMBOE 100 MMBOE Gulf of Mexico Vietnam +2.2 Billion BOE Resource Potential Potential Reserves ~1.5 Billion BOE Development Resource Potential Region ~750 Million BOE Exploration Resou
Slide 22: 2009 Capital Program
15 $1,050 MM Development Development-Haynesville Development capital includes exploitation, real estate, capitalized interest and G&A costs. Exploration 12% 7% 4% 16% 18% 37% 2009 Capital Program Rigs Avg. 20% 43% 37%
Slide 23
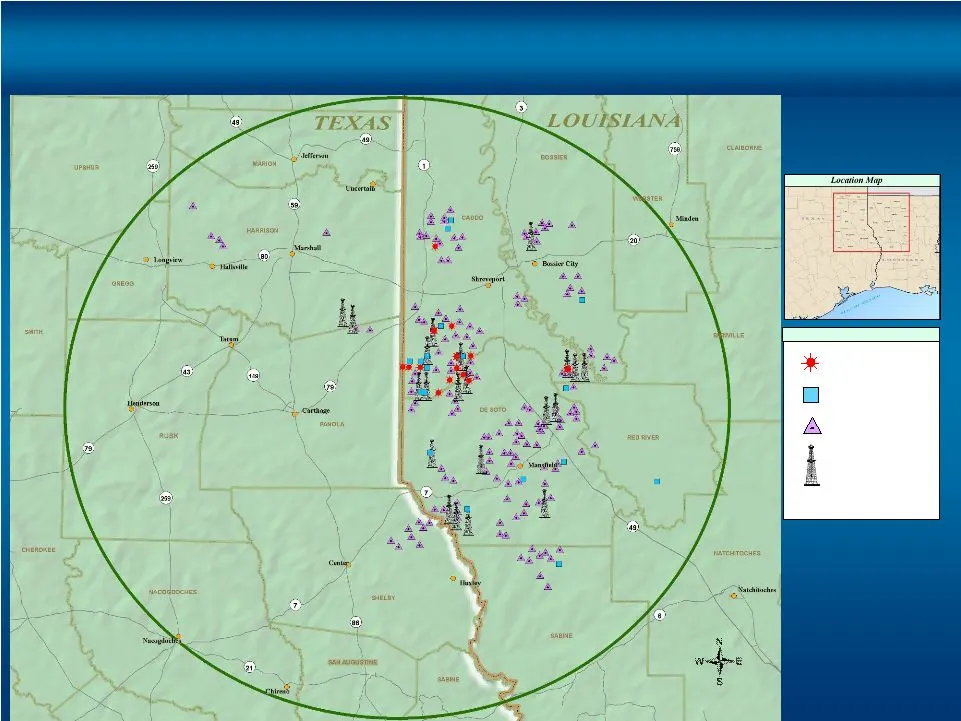
Slide 24: Haynesville Shale 2009 Activity
17 Legend PRODUCING WAITING ON COMPLETION 2009 DRILLS ACTIVE DRILLING Projection: NAD 1927 LA North Haynesville Shale 2009 Activity
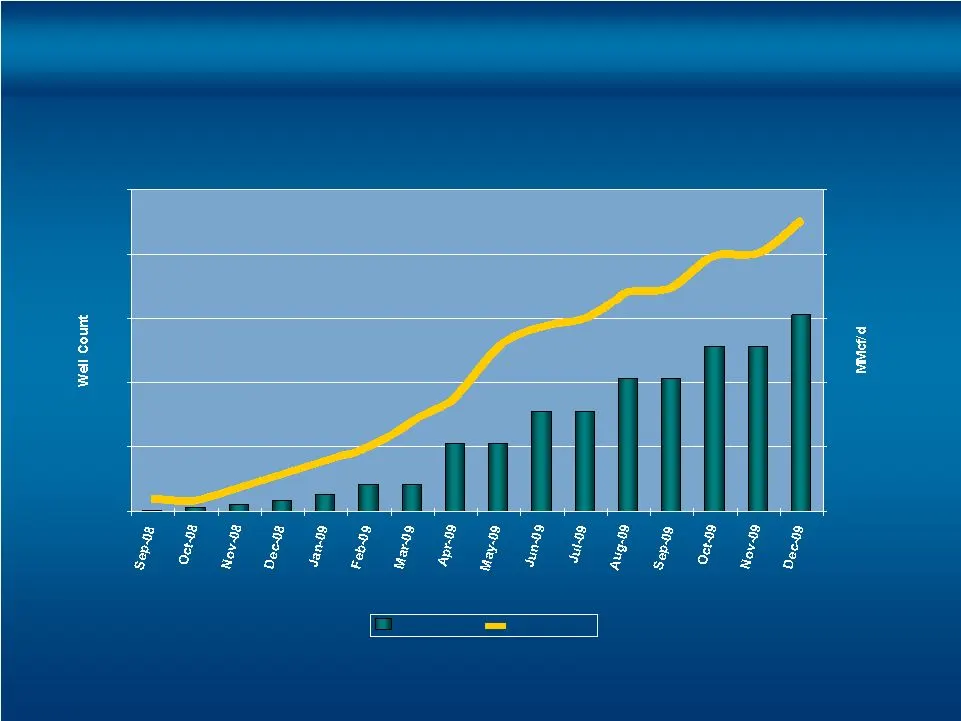
Slide 25: Haynesville Shale: Planned Ramping of Production
18 0 50 100 150 200 250 Month 0 15 30 45 60 75 Well count Net MMcf/d PXP Net Gas Production & Gross Well Count Haynesville Shale Planned Ramping of Production
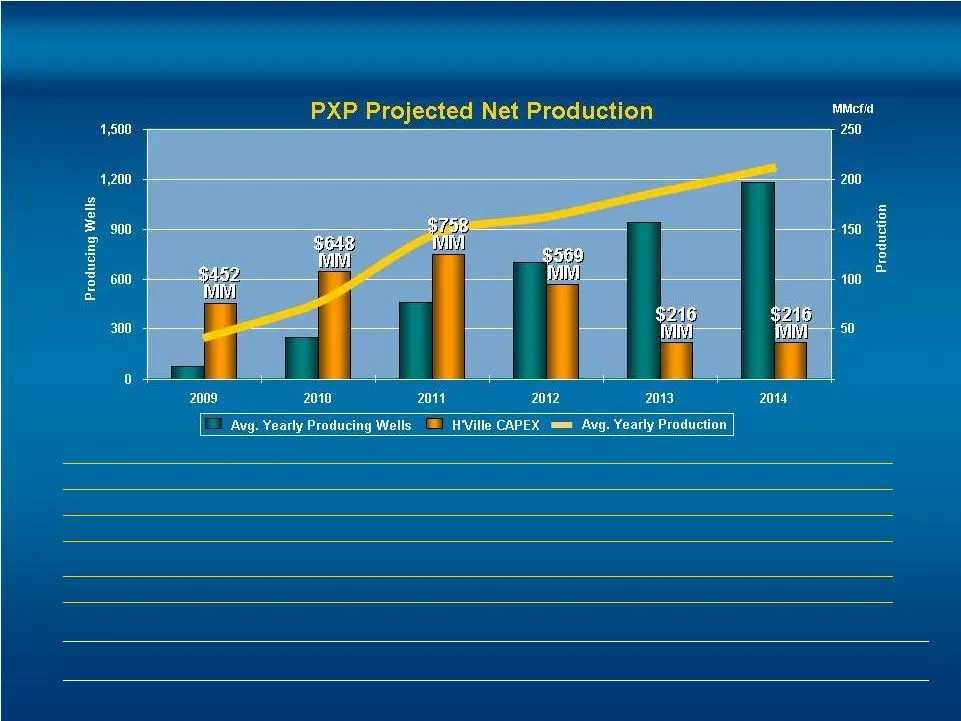
Slide 26: Haynesville Economics
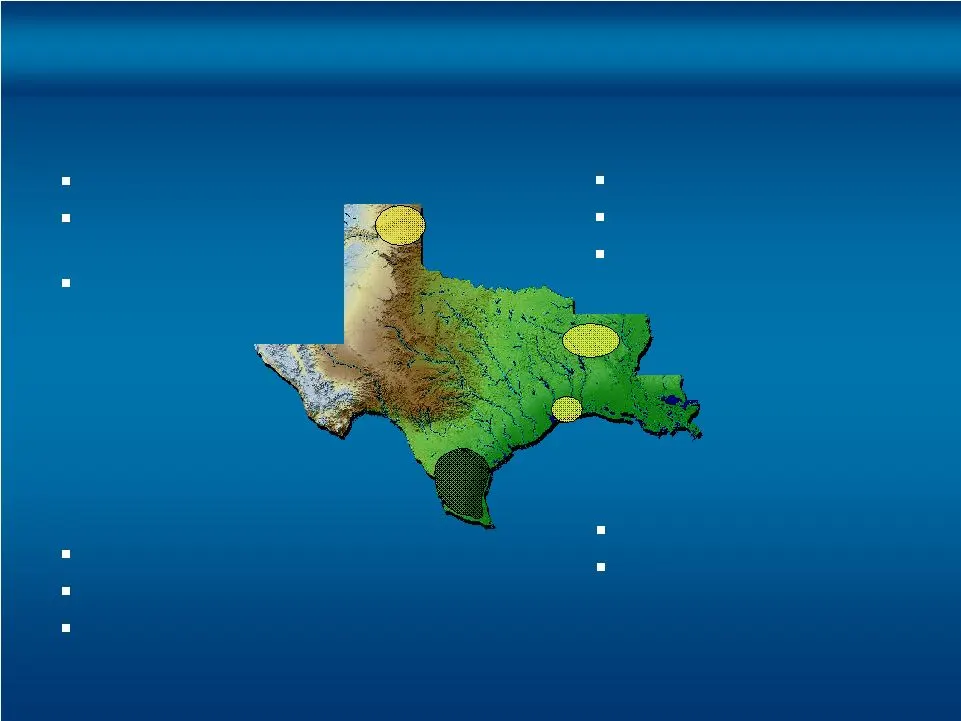
19 (1) Assumed D&C costs for first 3 years = $7 MM per well, after 3 years = $6 MM per well. 6.5 Bcfe Est. Median Gross EUR per Well: $7 MM (1) Est. Median Gross Well Cost: 6.7 Tcfe Est. Net Resource Potential: 1,375 Potential Net Locations: 111,000 Net Acreage: 20% WI/15% NRI PXP Interest: Haynesvi
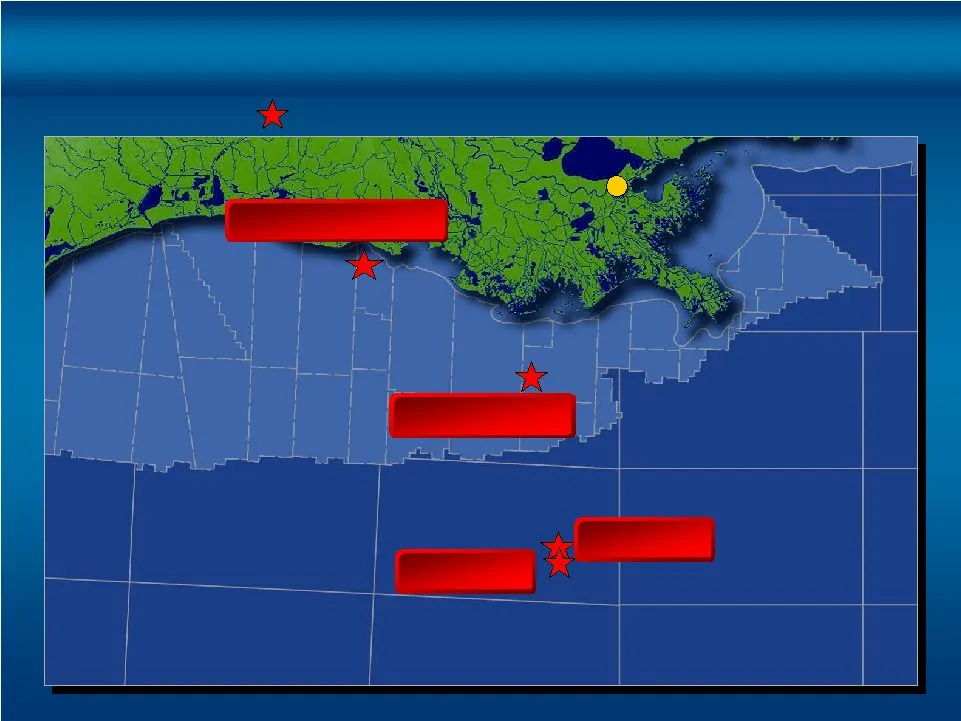
Slide 27: Gulf of Mexico: Success Continues
20 New Orleans Discoveries S. Timbalier 168 Friesian Flatrock #1,2,3,4,5,6 Friesian # 2 Gulf of Mexico Success Continues Development Discoveries
Slide 28: Flatrock Discovery
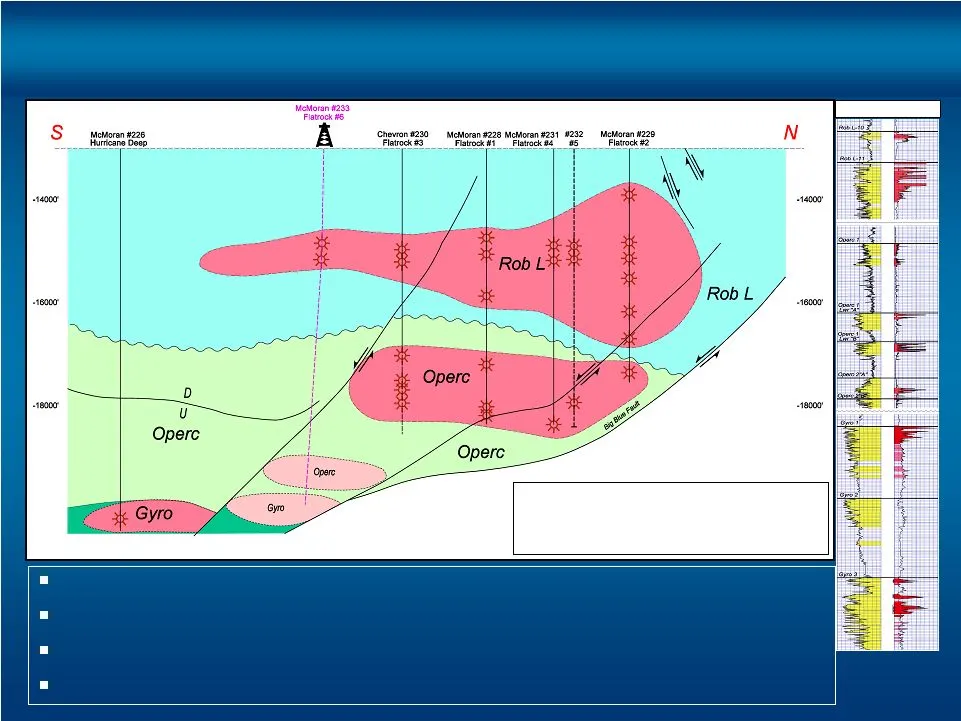
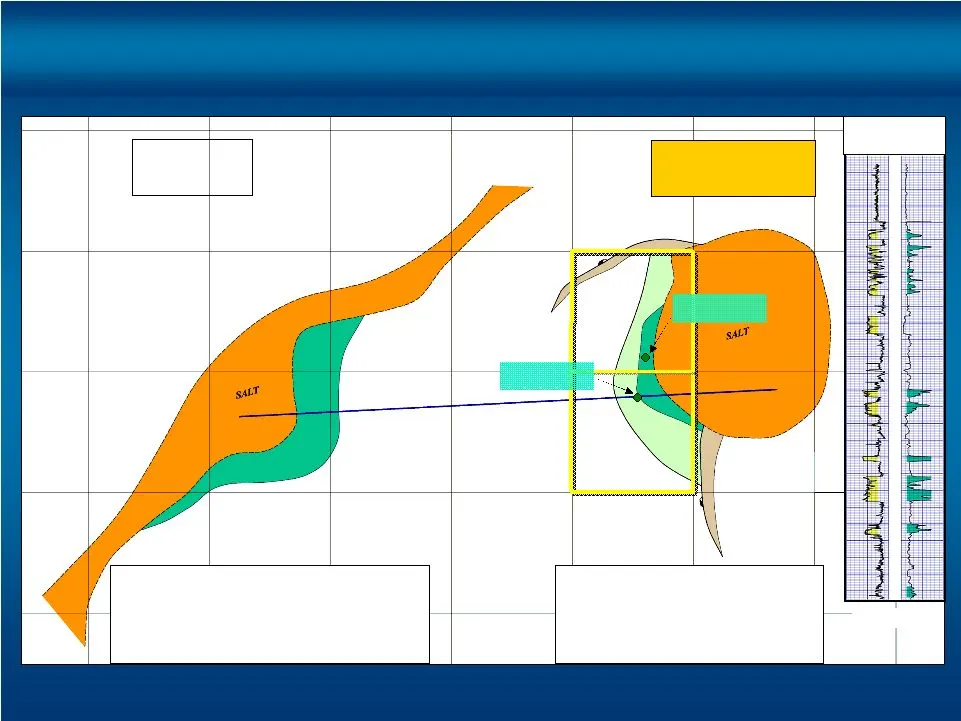
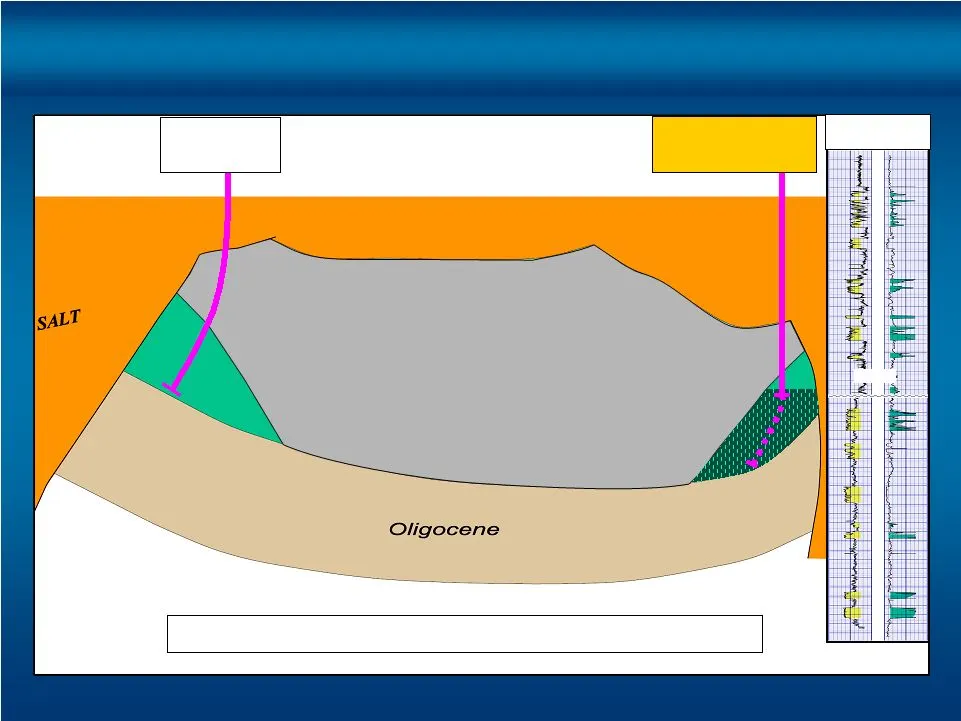
21 Located on OCS 310 at SMI 212 in 10 feet of water 6 successful wells drilled to date Currently producing +200 MMcfd\+45MMcfd net Year-end 2008 proved reserves +350 Bcfe gross\74 Bcfe net Flatrock Discovery South Marsh Island Block 212, GOM Type Log Multiple Productive Horizons
Slide 29
Slide 30: Friesian Project
23 Friesian Project Green Canyon Area, GOM 32,500’ 29,000’ Net Reserve Potential 40-150 MMBOE Miocene Type Log Miocene Tahiti Friesian
Slide 31: Blackbeard Area
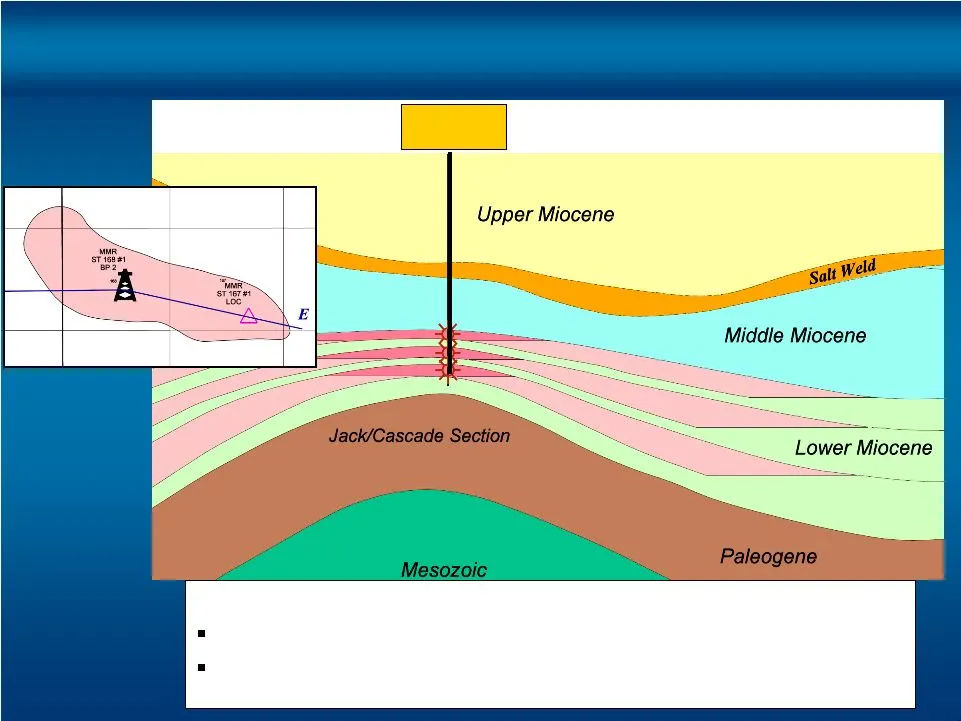
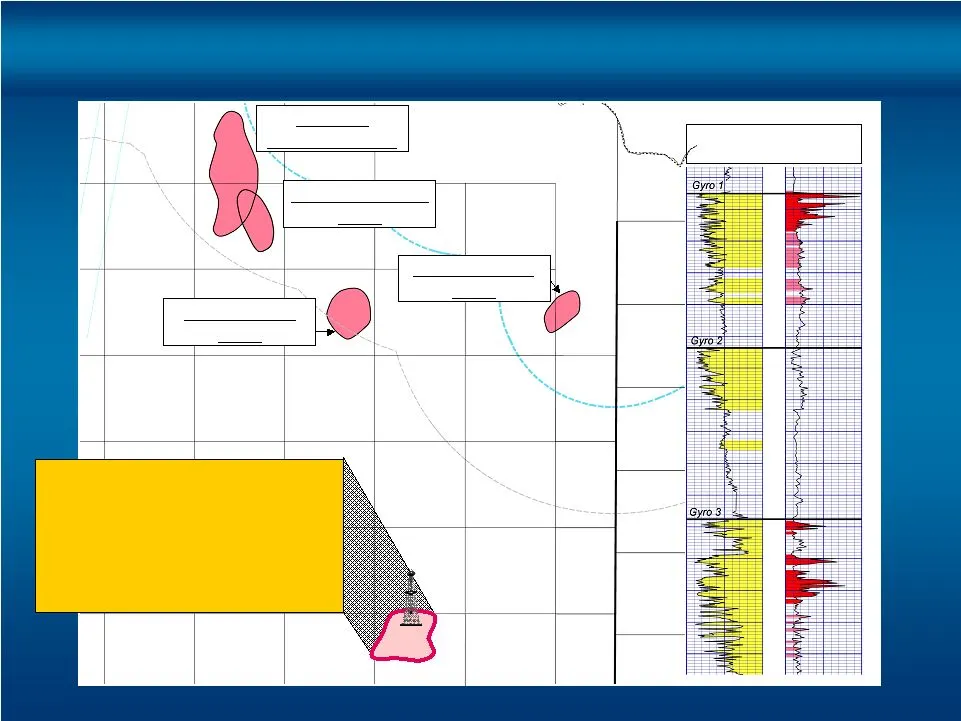
24 Blackbeard Area W E Blackbeard 168 #1 Discovery Well Logs indicate four potential hydrocarbon bearing sands Awaiting design and procurement of long lead time completion equipment for high pressure test MMR ST 168 #1 BP2 TD 32,997'
Slide 32: Gulf of Mexico Development & Exploration: Success Continues
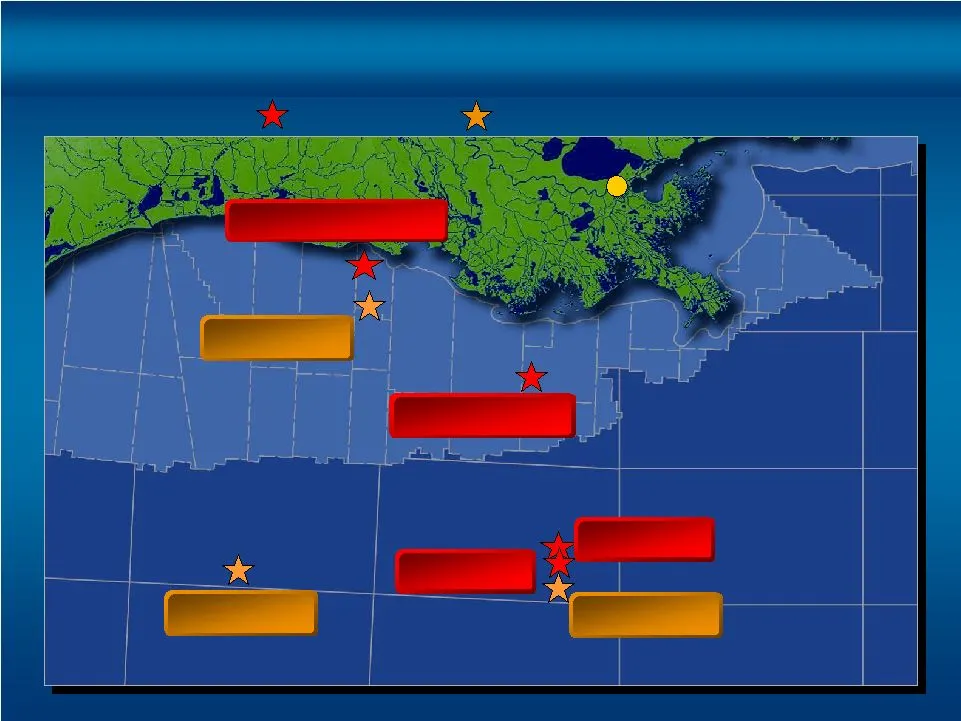
25 New Orleans Discoveries S. Timbalier 168 Friesian Flatrock #1,2,3,4,5,6 Friesian # 2 2008-2009 Drilling Ammazzo #1 Friesian Deep Salida Gulf of Mexico Development & Exploration Success Continues Discoveries 2008-2009 Drilling
Slide 33
Slide 34: Salida Prospect - 3Q 2009 Drill
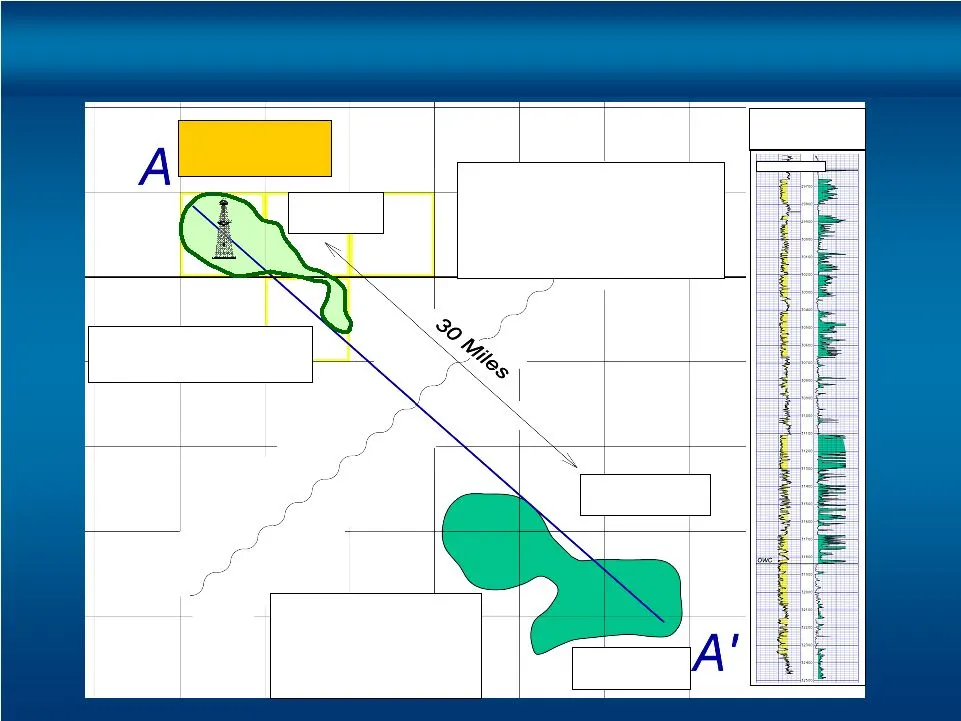
27 Salida Prospect - 3Q 2009 Drill Garden Banks/Keathley Canyon, GOM EOCENE / WILCOX Kaskida Type Log BP 73.3% Devon 26.7% Estimated Gross Reserves 1.5 Billion BOE Shell 75% PXP 25% Kaskida Reserve Potential +1 Billion BOE Salida PXP - 25% W.I. Net Reserve Potential +250 MMBOE 3Q 2009 Drill
Slide 35: White Shark Prospect - 2Q 2009 Drill
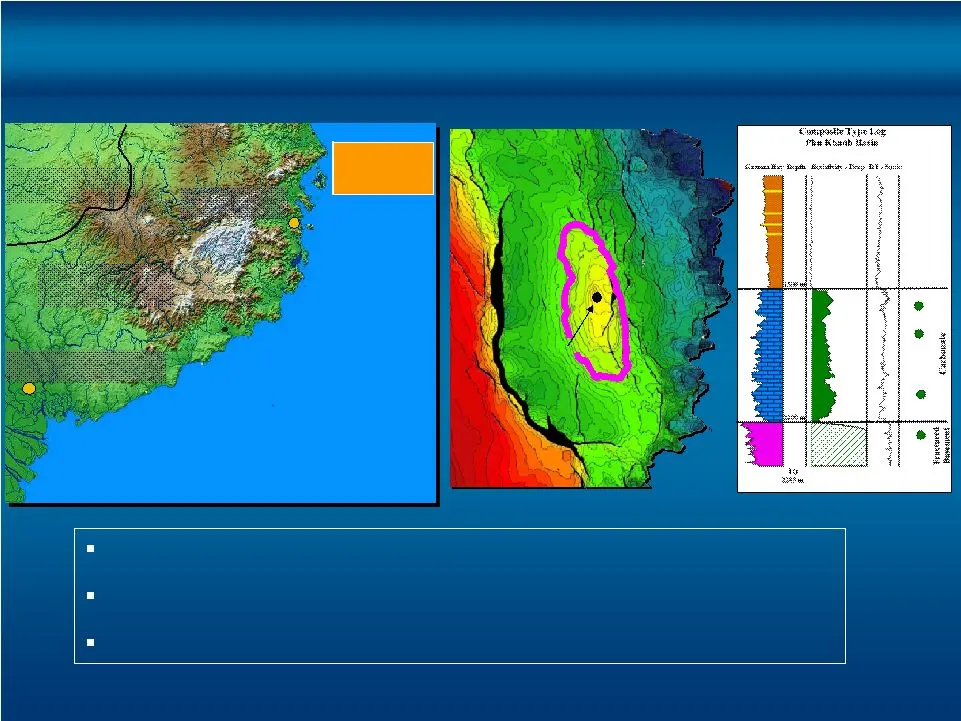
28 Block 124 covers approximately 1.48 million acres PXP 100% W.I. Exploration resource potential approximately +100 MMBOE Top Miocene Carbonates Structure Map C.I. = 50m Block 124 Vietnam Vietnam Ho Chi Minh City Ho Chi Minh City Nha Trang Nha Trang Cambodia Cambodia White Shark Prospect - 2Q 2009

Slide 36: 2009 Corporate Strategy
29 Maintain Strong Liquidity Position and Continue to Deploy Hedge Strategy Reduce debt by over $1billion while maintaining our approximately $1billion capital expenditure program Continue Execution of Significant Development Projects...Haynesville, Flatrock, Friesian and Blackbeard Drill High Impac

Slide 37: Addendum
30 Addendum

Slide 38: Continued Commodity Price Protection
31 Henry Hub $0.346 $10.00 Floor by $20.00 Ceiling 150,000 MMBtu Collars Jan – Dec 2009 WTI $3.38 $55.00 Strike Price 32,500 Bbls Put Options Jan – Dec 2009 No premium $5.00 Crude Derivatives Natural Gas Derivatives Henry Hub $6.25 - $4.80 Floor by $8.00 Ceiling 40,000 MMBtu Put/Call (2) Jan – Dec 2

Slide 39: Income Statement Summary
32 3,629.7 3,629.7 Impairment of Oil & Gas Properties $ (6.52) $ (14.56) EPS (diluted) $ (709.1) $ (1,568.7) Net Income (1) (1,153.6) (2,528.5) Income Before Income Tax (2,627.4) (3,690.1) Income From Operations 621.5 200.0 DD&A & Accretion Expense 153.3 38.8 General & Administrative Expense 626.4 1

Slide 40: Balance Sheet Summary
33 104.4 586.8 Other $9,693.3 $7,111.9 3,338.2 2,377.3 Stockholders’ Equity 1,959.4 744.5 Deferred Income Tax 272.6 191.5 Other Long-term Liabilities 3,305.0 2,805.0 Long-term Debt $ 818.1 $ 993.6 Current Liabilities $9,693.3 $7,111.9 536.8 535.3 Goodwill 8,377.2 4,513.4 PP&E Net $ 674.9 $ 1,476.4 C

Slide 41: February 2009 Update
February 2009 Update February 2009 Update
Source: SEC EDGAR · 8-K filed Feb 26, 2009
More decks from Plains Exploration & Production Company
 Global Metals, Mining & Steel Conference 201333 slides · May 14, 2013
 Q1 2013 Earnings Presentation46 slides · Apr 19, 2013
 Merger or Acquisition (February 2013)35 slides · Feb 25, 2013
 2013 Credit Suisse Energy Summit10 slides · Feb 5, 2013
 Merger or Acquisition (January 2013)30 slides · Jan 17, 2013
 Credit Suisse 2012 Energy Summit32 slides · Feb 7, 2012