Sun Bancorp — KBW Bank Investor Conference 2016
21 slides from Sun Bancorp's conference presentation, Aug 2, 2016
Slide 1: KBW Bank Investor Conference
KBW Bank Investor Conference 8/3/2016 Financials as of June 30, 2016Thomas M. O’BrienPresident & CEOThomas R. BruggerCFO
Slide 2: Caution Regarding Forward-Looking Information
Caution Regarding Forward-Looking Information This presentation may contain forward-looking statements, as defined in the Private Securities Litigation Reform Act of 1995, which may be identified by the use of such words as “allow,” “anticipate,” “believe,” “continues,” “could,” “estimate,” “expect,
Slide 3: Caution Regarding Forward-Looking Information
Caution Regarding Forward-Looking Information No undue reliance should be placed on any forward-looking statements. The Company does not undertake, and specifically disclaims, any obligation to publicly release the results of any revisions that may be made to any such forward-looking statements to r
Slide 4: Executive Summary
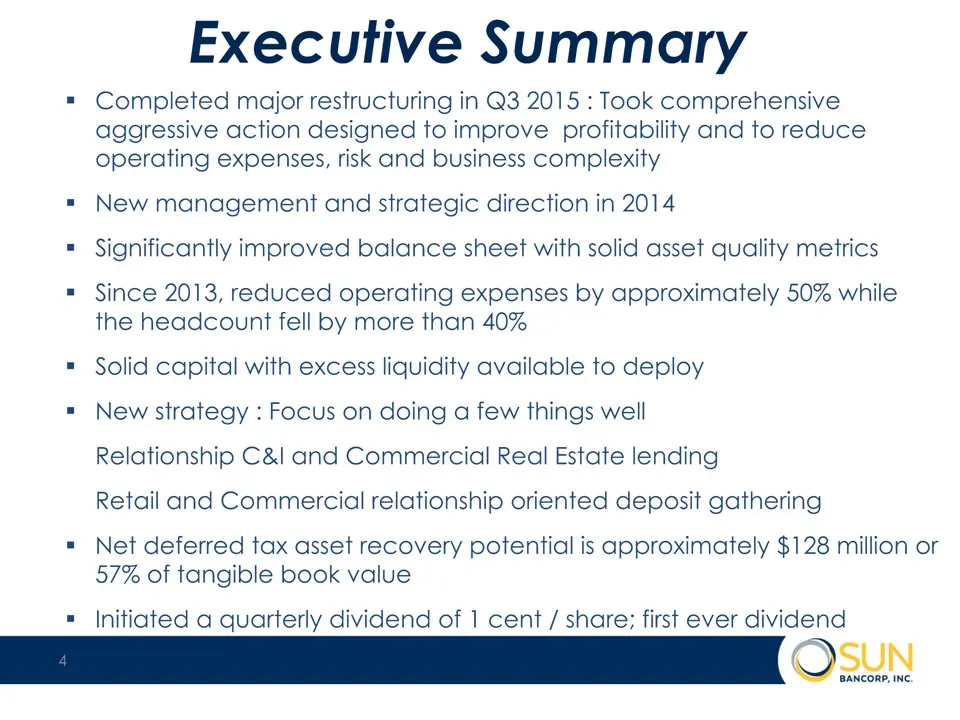
Executive Summary Completed major restructuring in Q3 2015 : Took comprehensive aggressive action designed to improve profitability and to reduce operating expenses, risk and business complexityNew management and strategic direction in 2014Significantly improved balance sheet with solid asset qualit
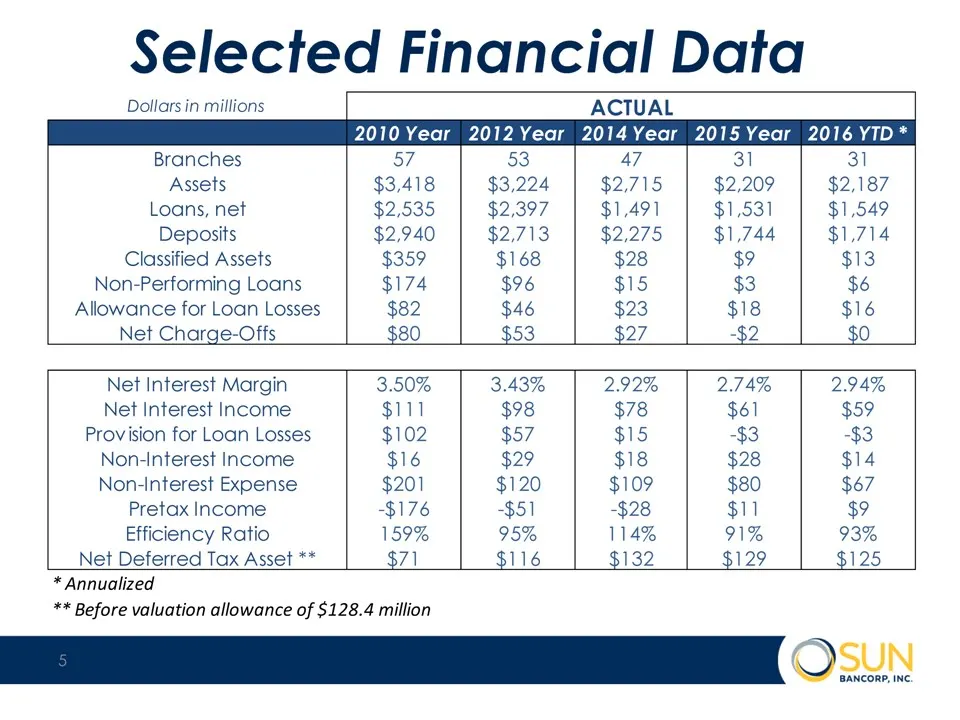
Slide 5: Selected Financial Data
Selected Financial Data Dollars in millions ACTUAL Branches 57 53 47 31 31 Assets $3,418 $3,224 $2,715 $2,209 $2,187 Loans, net $2,535 $2,397 $1,491 $1,531 $1,549 Deposits $2,940 $2,713 $2,275 $1,744 $1,714 Classified Assets $359 $168 $28 $9 $13 Non-Performing Loans $174 $96 $15 $3 $6 Allowance for
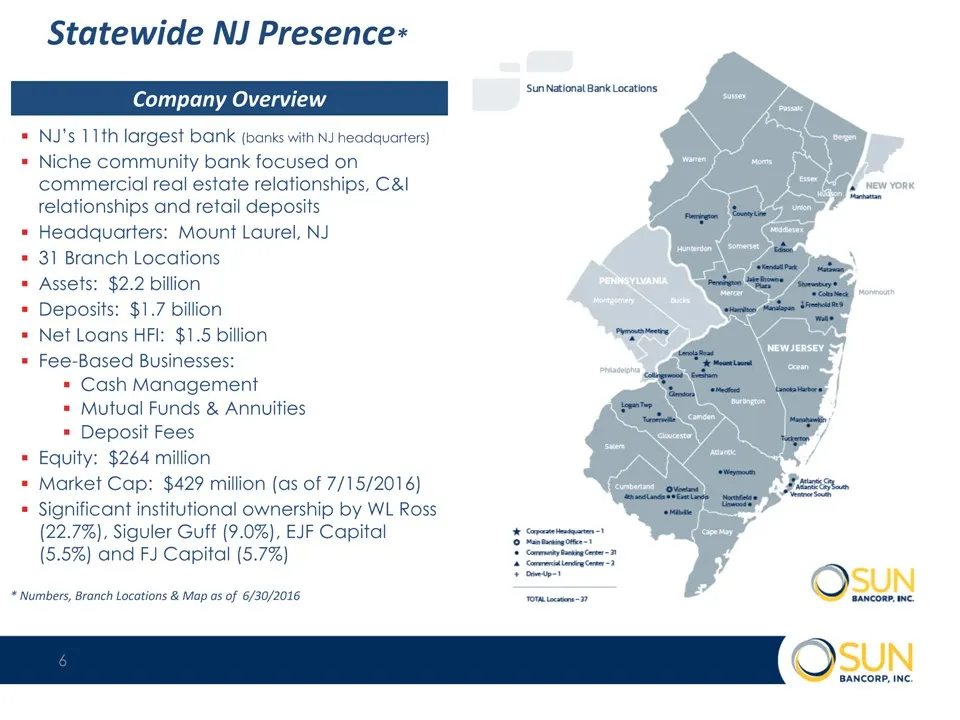
Slide 6: Statewide NJ Presence: Company Overview
Statewide NJ Presence* Company Overview NJ’s 11th largest bank (banks with NJ headquarters)Niche community bank focused on commercial real estate relationships, C&I relationships and retail depositsHeadquarters: Mount Laurel, NJ31 Branch LocationsAssets: $2.2 billionDeposits: $1.7 billionNet Loans H
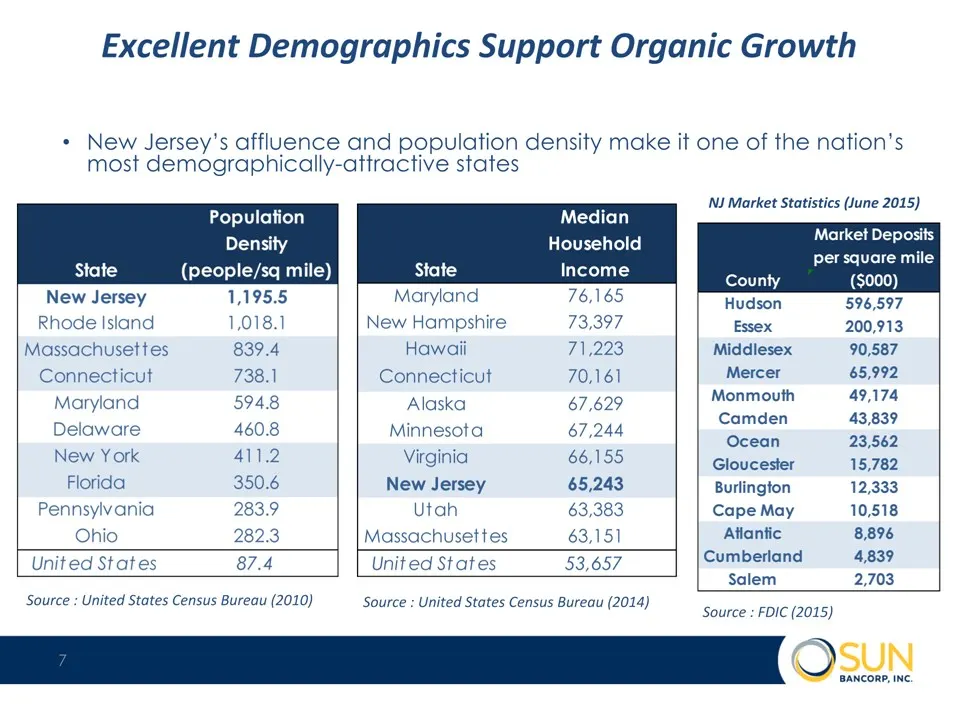
Slide 7: Excellent Demographics Support Organic Growth
New Jersey’s affluence and population density make it one of the nation’s most demographically-attractive states Excellent Demographics Support Organic Growth NJ Market Statistics (June 2015) Source : United States Census Bureau (2010) Source : FDIC (2015) Source : United States Census Bureau (2014)
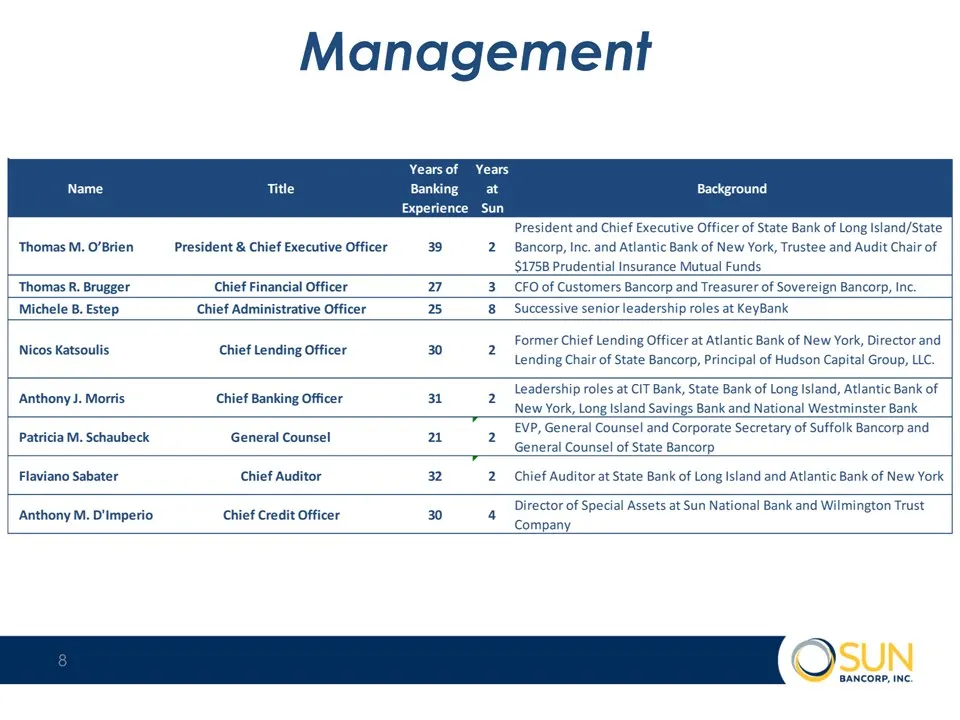
Slide 8: Management
Management Yearsof Years Banking at. Background Experience _Sun President and Chief Executive Officer of State Bank of Long Island/State ThomasM. O’Brien _—President & Chief Executive Officer 39 2 Bancorp, Inc. and Atlantic Bank of New York, Trustee and Audit Chair of $1758 Prudential Insurance Mutu
Slide 9: 2016 Priorities
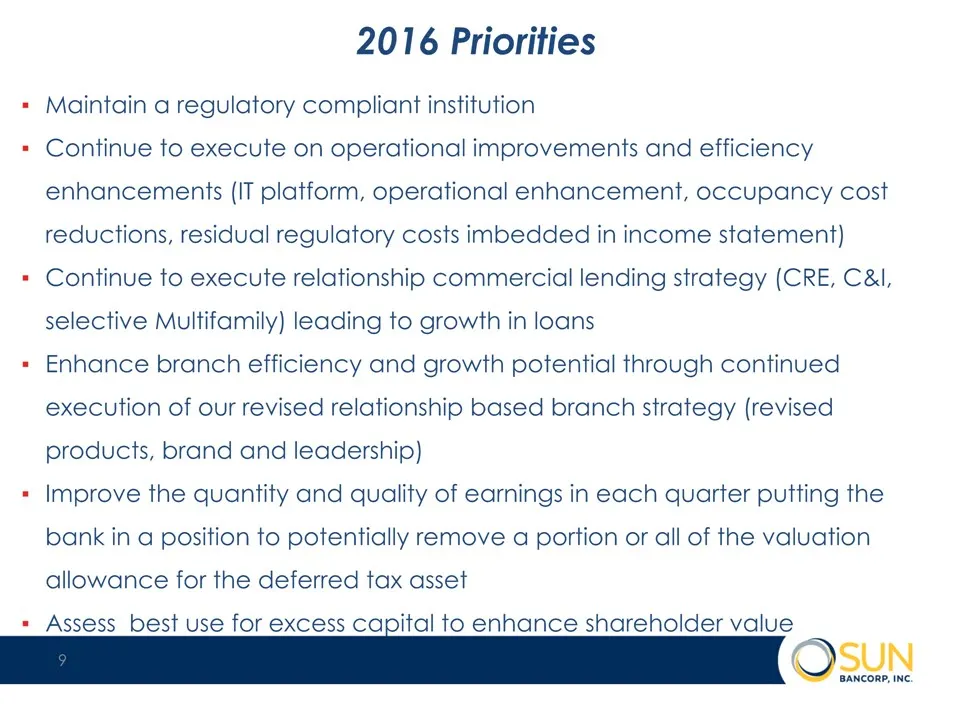
2016 Priorities Maintain a regulatory compliant institutionContinue to execute on operational improvements and efficiency enhancements (IT platform, operational enhancement, occupancy cost reductions, residual regulatory costs imbedded in income statement)Continue to execute relationship commercial
Slide 10: Deferred Tax Asset
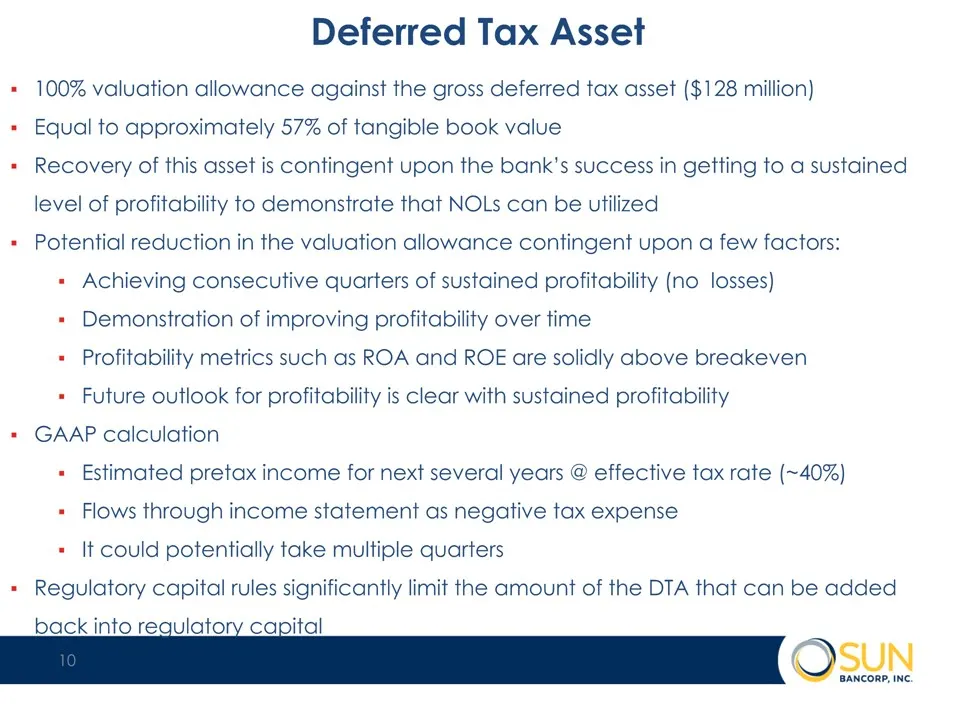
Deferred Tax Asset 100% valuation allowance against the gross deferred tax asset ($128 million)Equal to approximately 57% of tangible book valueRecovery of this asset is contingent upon the bank’s success in getting to a sustained level of profitability to demonstrate that NOLs can be utilizedPotent
Slide 11: Valuation
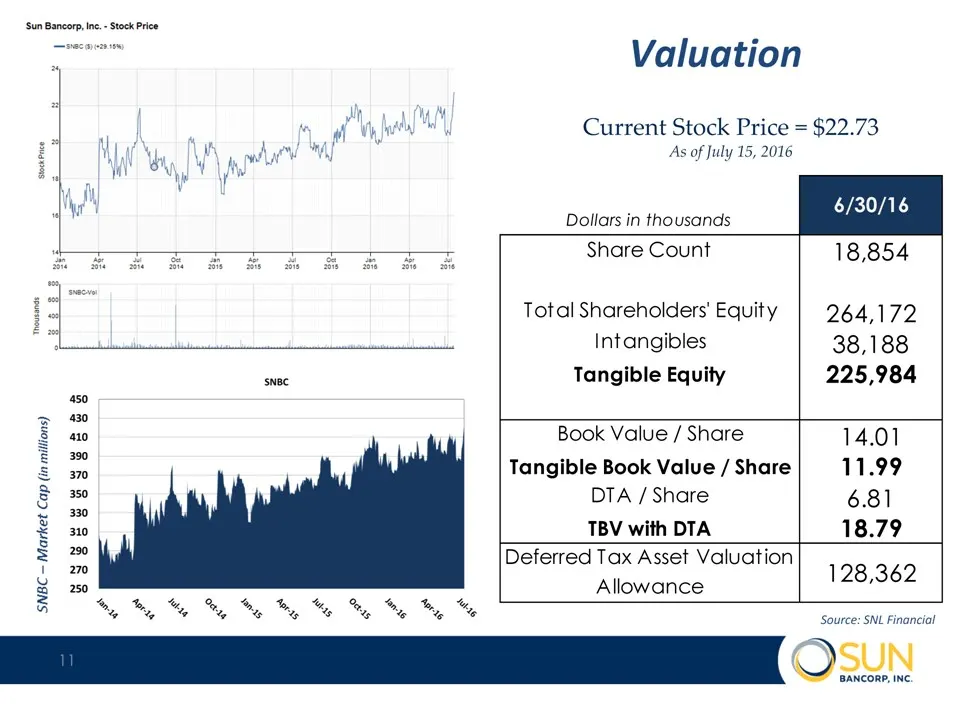
Valuation Source: SNL Financial Current Stock Price = $22.73As of July 15, 2016 *
Slide 12: Financial Trends
Balance SheetLoan Portfolio Trends & MixDeposit Trends & MixIncome StatementNon-Interest Income & Non-Interest ExpenseAsset Quality & Capital Financial Trends *
Slide 13: Balance Sheet
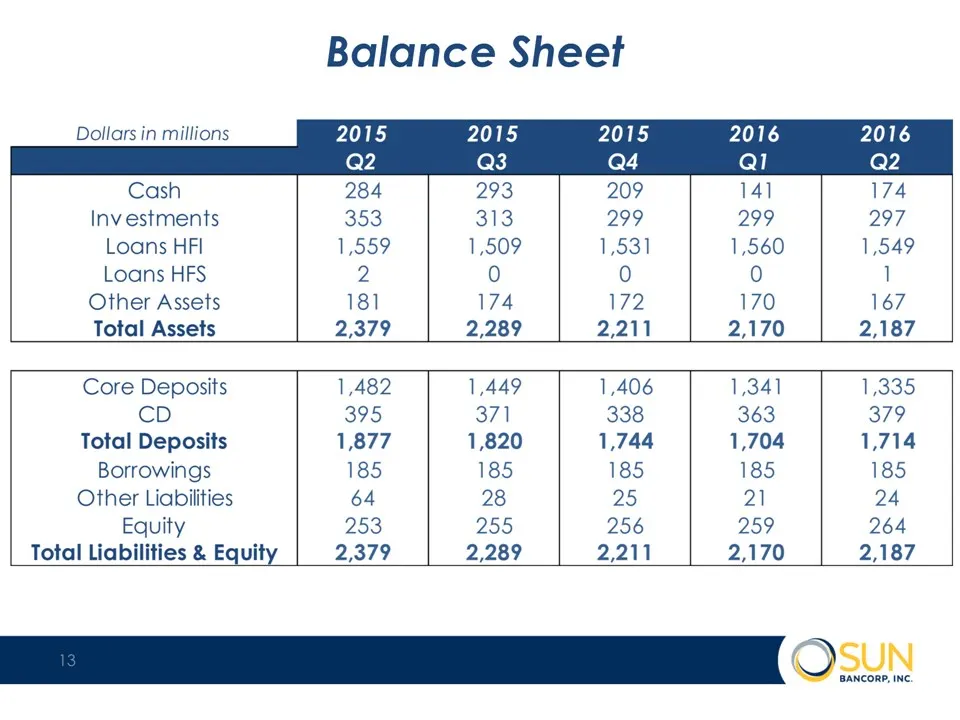
Balance Sheet Dollars in millions 2015 2015 2015 2016 Q2 (ek} Q4 Ql Cash 284 293 209 141 Investments 353 313 299 299 Loans HFI 1,559 1,509 1,531 1,560 1,549 Loans HFS 2 0) 0) 0) 1 Other Assets 181 174 172 170 167 Total Assets 2,379 2,289 2,211 2,170 2,187 Core Deposits 1,482 1,449 1,406 1,341 1,335
Slide 14: Lending Mix
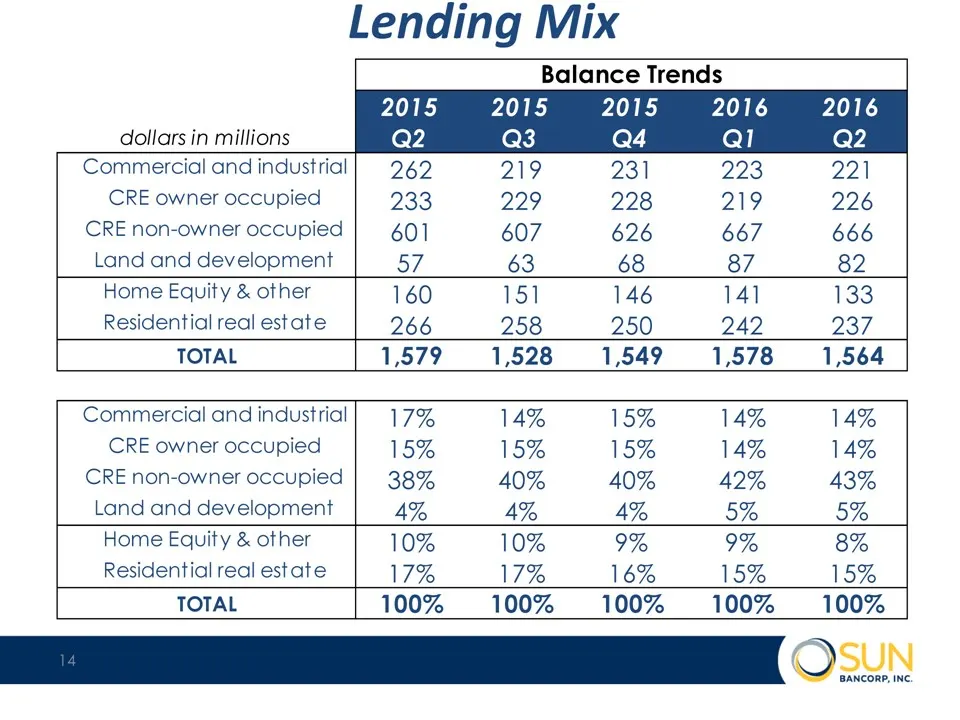
Lending Mix Balance Trends 2015 2015 2015 2016 2016 dollars in millions Q2 Q3 Q4 Ql (ey Commercial and industrial 262 219 231 223 221 CRE owner occupied 233 229 228 219: 226 CRE non-owner occupied 601 607 626 667 666 Land and development 57 63 68 87 82 Home Equity & other 160 151 146 141 133 Residen
Slide 15: Lending Mix
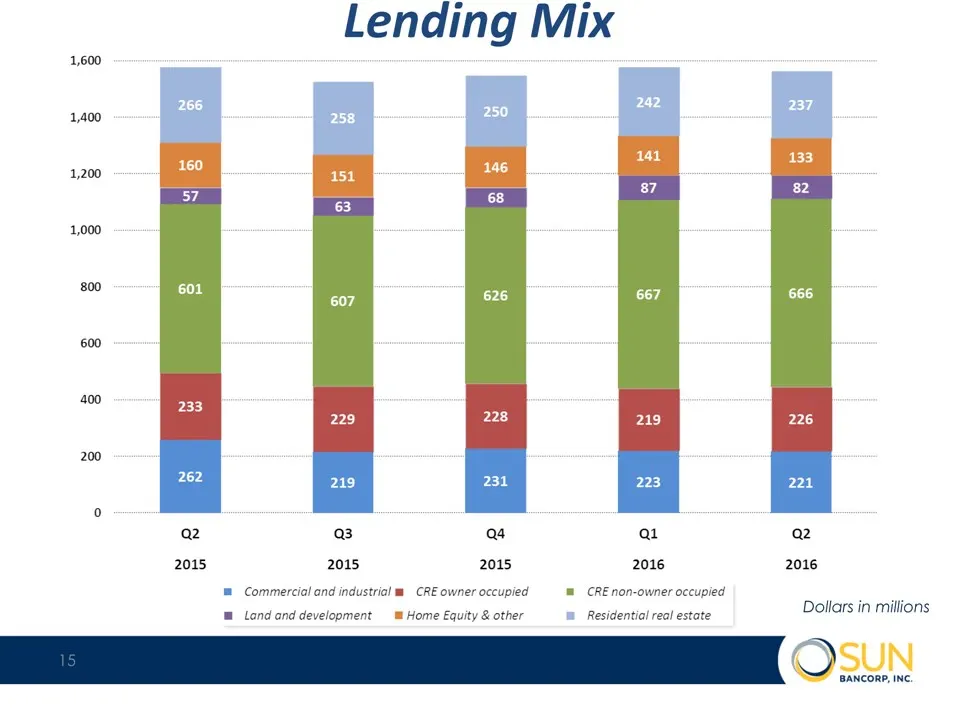
Lending Mix Dollars in millions *
Slide 16: Deposit Mix
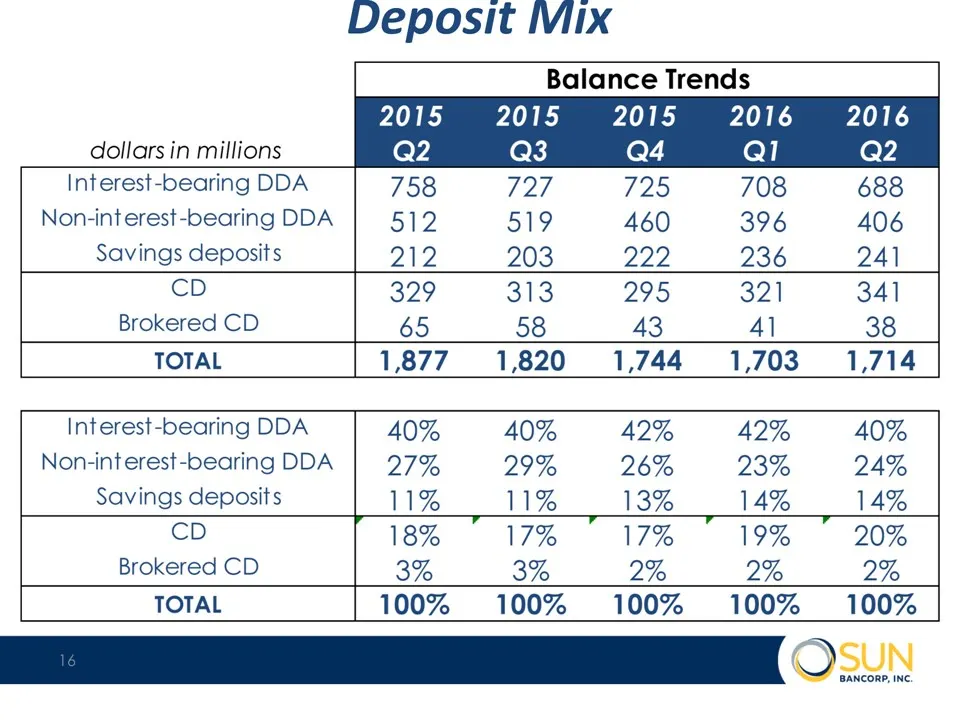
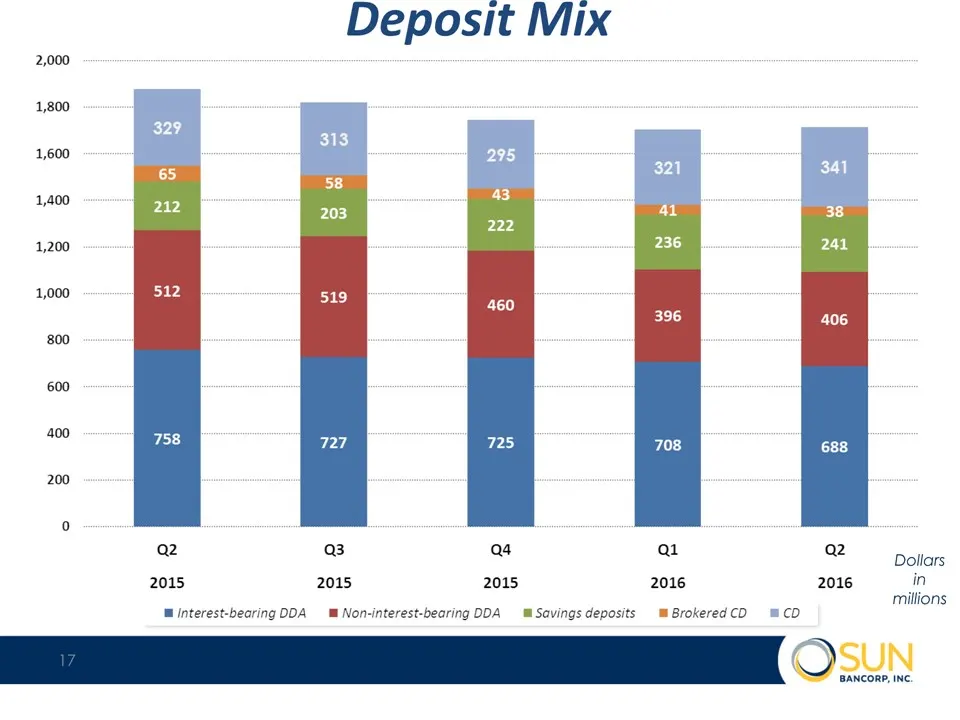
Deposit Mix Balance Trends 2015 2015 2015 2016 2016 dollars in millions Q2 (ek} Q4 Ql Q2 Interest-bearing DDA 758 727 725 708 688 Non-int erest-bearing DDA 512 519 460 396 406 Savings deposits 212 203 222 236 241 CD 329 313 295 321 341 Brokered CD 65 58 43 Al 38 TOTAL 1877 1,820 1,744 1,703 1,714 In
Slide 17: Deposit Mix
Deposit Mix Dollars in millions *
Slide 18: Income Statement
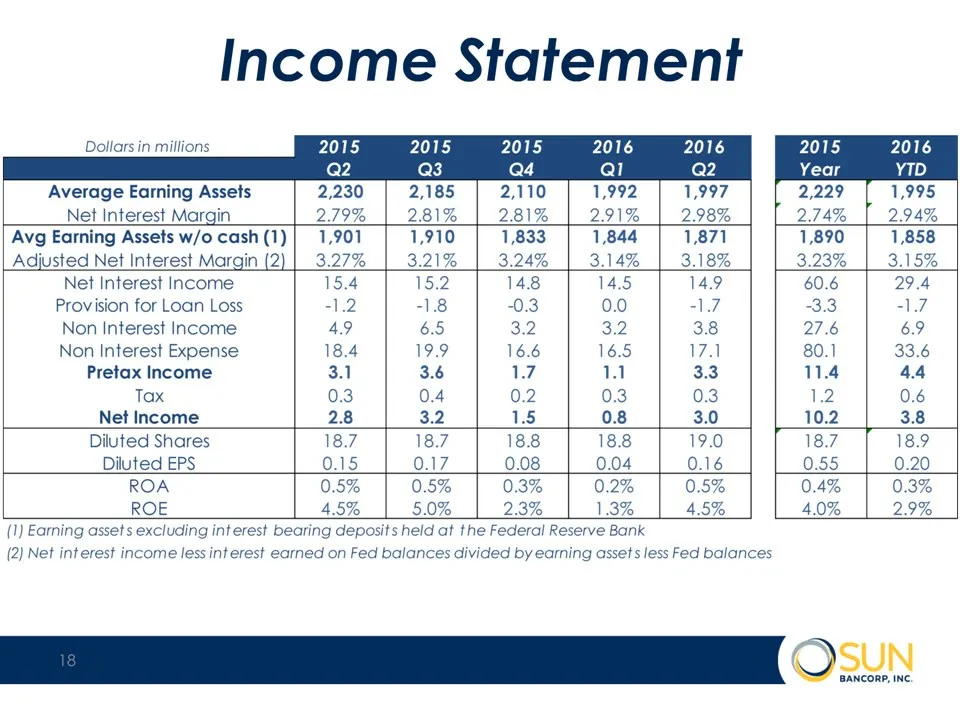
Income Statement Dollars in millions 2015 2015 2016 2016 0 016 Q2 Q3 Q4 Qi Q2 eq D Average Earning Assets 2,230 2,185 2,110 1,992 1,997 2,229 1,995 Net Interest Margin 2.79% 2.81% 2.81% 2.91% 2.98% 2.74% 2.94% Avg Earning Assets w/o cash(1)} 1,901 1,910 1,833 1,844 1,871 1,890 1,858 Adjusted Net Int
Slide 19: Non Interest Income & Expenses
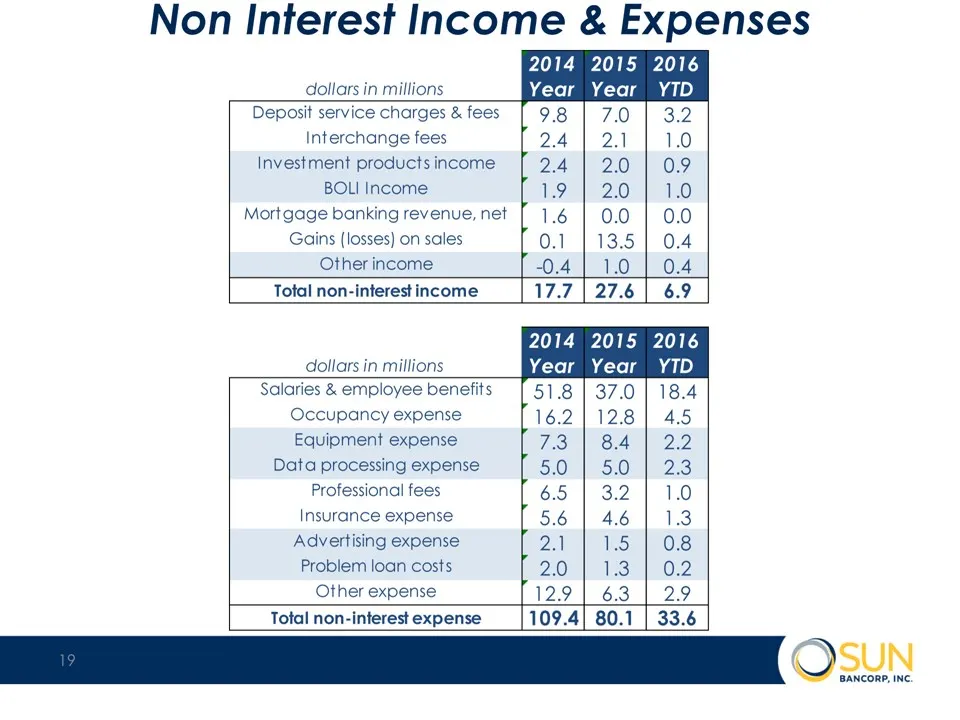
Non Interest Income & Expenses *
Slide 20: Asset Quality & Capital
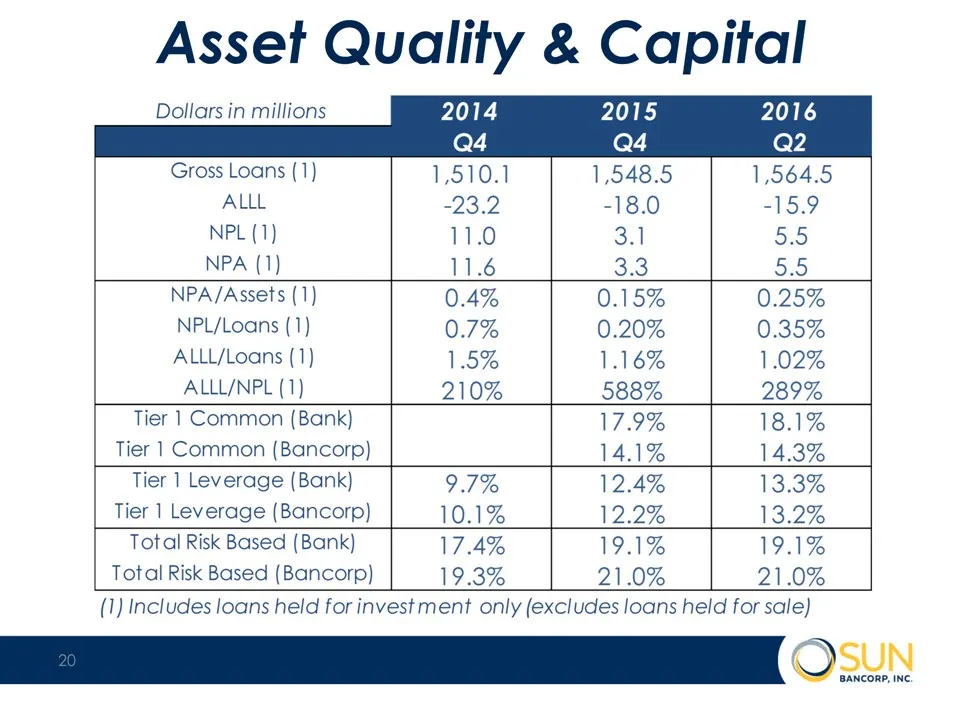
Asset Quality & Capital Dollars in millions 2014 2015 2016 Q4 Q4 Q2 Gross Loans (1) 1,510.1 1,548.5 1,564.5 ALLL -23.2 -18.0 -15.9 NPL (1) 11.0 3.1 5.9 NPA (1) 11.6 3.3 5.5 NPA/Assets (1) 0.4% 0.15% 0.25% NPL/Loans (1) 0.7% 0.20% 0.35% ALLL/Loans (1) 1.5% 1.16% 1.02% ALLL/NPL (1) 210% 588% 289% Tier
Slide 21: Non-GAAP Reconciliation
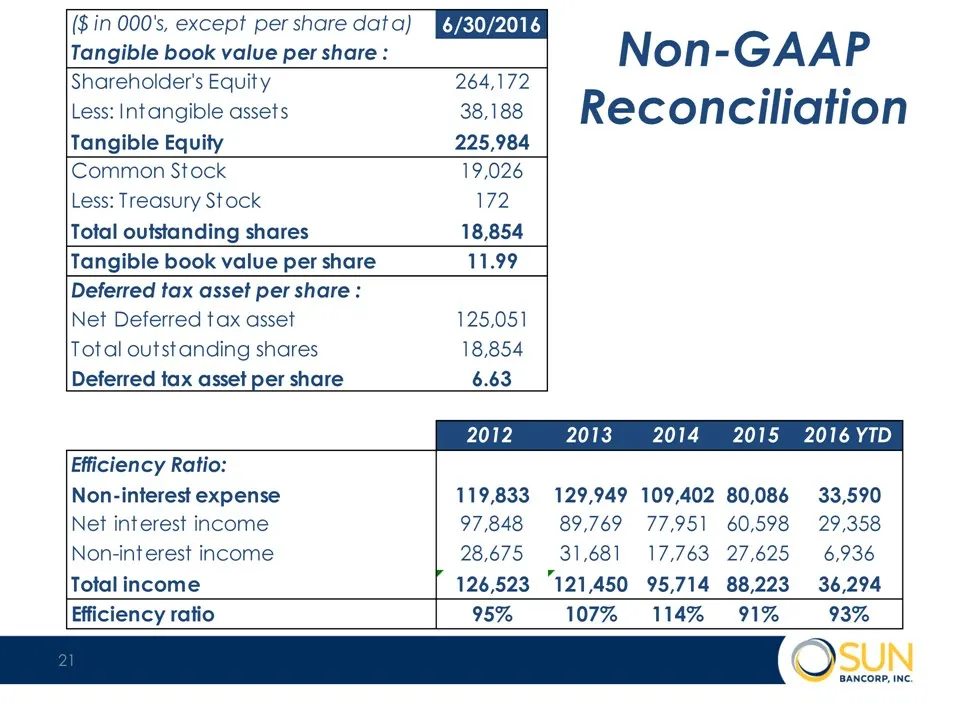
($in 000's, except per share data) [ARWPOTS Tangible book value per share : Non - GAA P Shareholder's Equity 264,172 ‘6 Fe Less: Intangible assets 38,188 Reconciliation Tangible Equity 225,984 Common Stock 19,026 Less: Treasury Stock 172. Total outstanding shares 18,854 Tangible book value per share
Source: SEC EDGAR · 8-K filed Aug 2, 2016
More decks from Sun Bancorp Inc
 Merger or Acquisition (June 2017)23 slides · Jun 30, 2017
 Investor Presentation (July 2015)22 slides · Jul 29, 2015
 FY2014 Earnings Presentation15 slides · Feb 12, 2015
 Investor Presentation (November 2014)17 slides · Nov 12, 2014
 Investor Presentation (July 2014)25 slides · Jul 29, 2014
 Investor Presentation (July 2013)31 slides · Jul 30, 2013