BrasilAgro Cia Brasileira de Propriedades Agricolas · BMFBOVESPA:AGRO3
BrasilAgro Cia Brasileira de Propriedades Agricolas — BrasilAgro — 4Q09 Earnings Presentation
22 slides from BrasilAgro Cia Brasileira de Propriedades Agricolas's earnings presentation, Sep 4, 2009
Slide 1: Conference Call – 4Q09
Conference Call – 4Q09 September 04, 2009 1
Slide 2: Agenda
Agenda Conference call - 4Q09 Sector context 3 Company update Highlights 12 Property portfolio 13 Operation evolution 14 Operational consolidation 15 2008/2009 harvest results 17 Available cash 18 Hedge position 19 Income statement 20 Balance sheet 21 2
Slide 3: Farmland as an Asset class and an excellent hedge against inflation
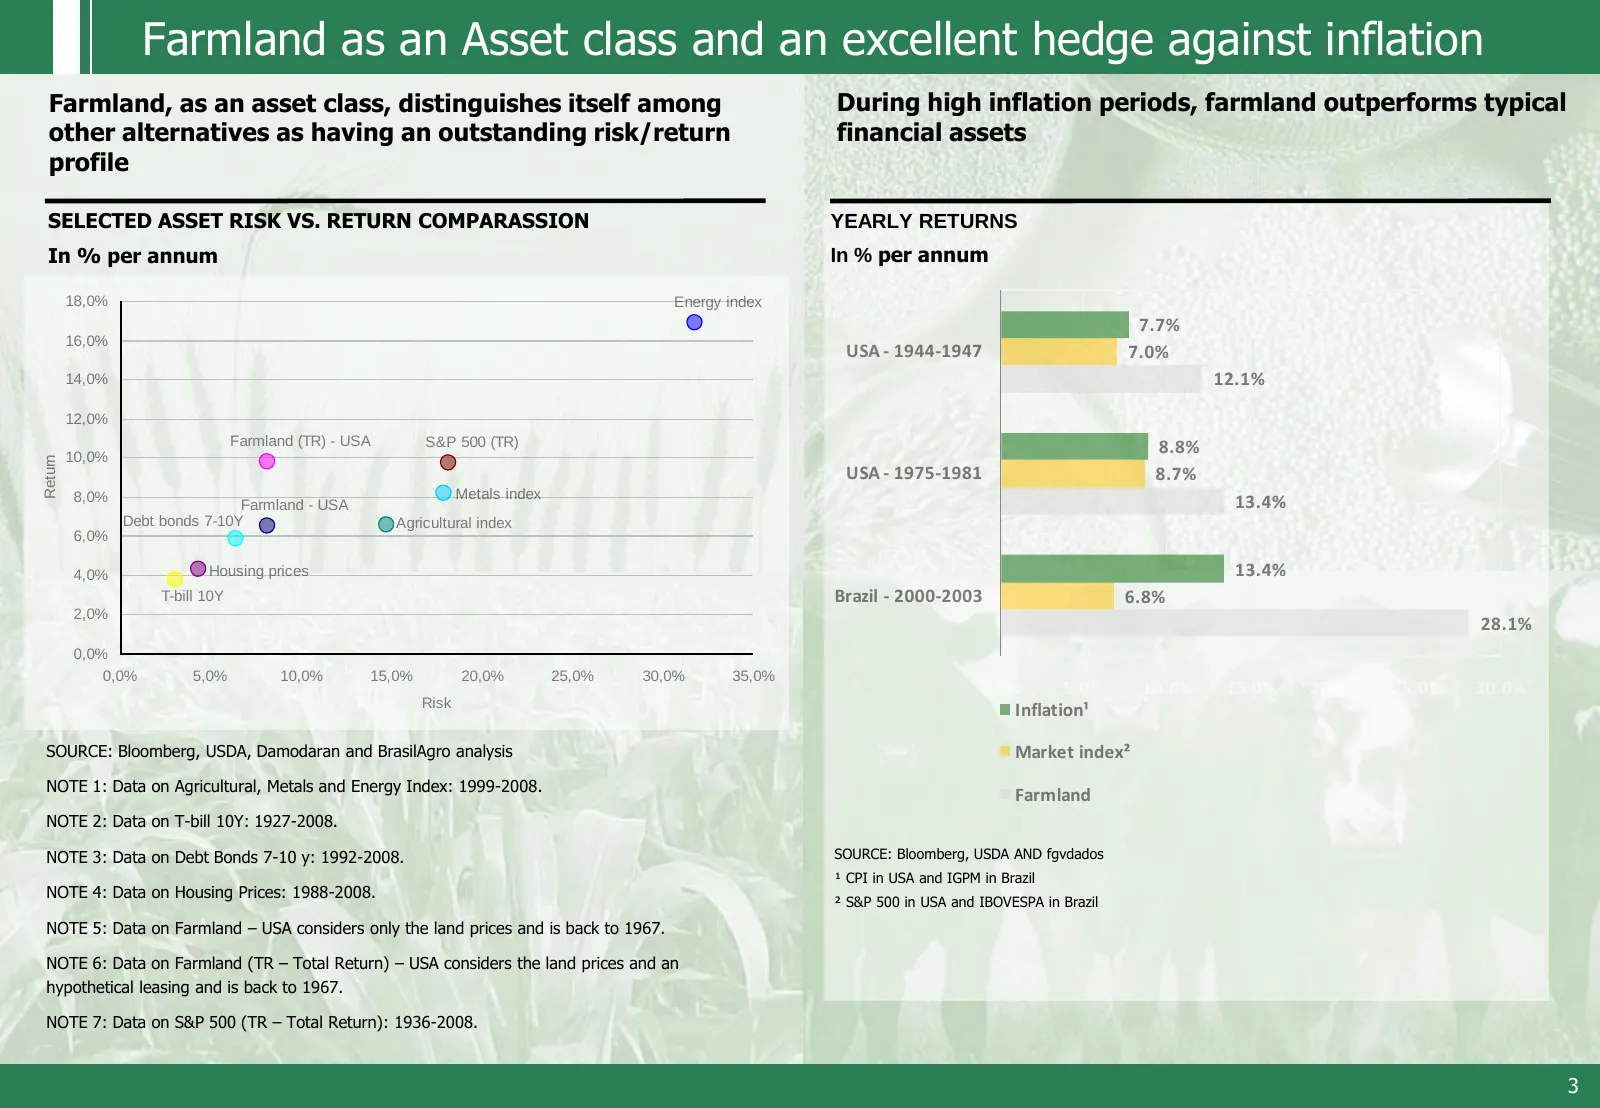
Farmland as an Asset class and an excellent hedge against inflation Farmland, as an asset class, distinguishes itself among During high inflation periods, farmland outperforms typical other alternatives as having an outstanding risk/return financial assets profile SELECTED ASSET RISK VS. RETURN COMP
Slide 4: Portfolio diversification
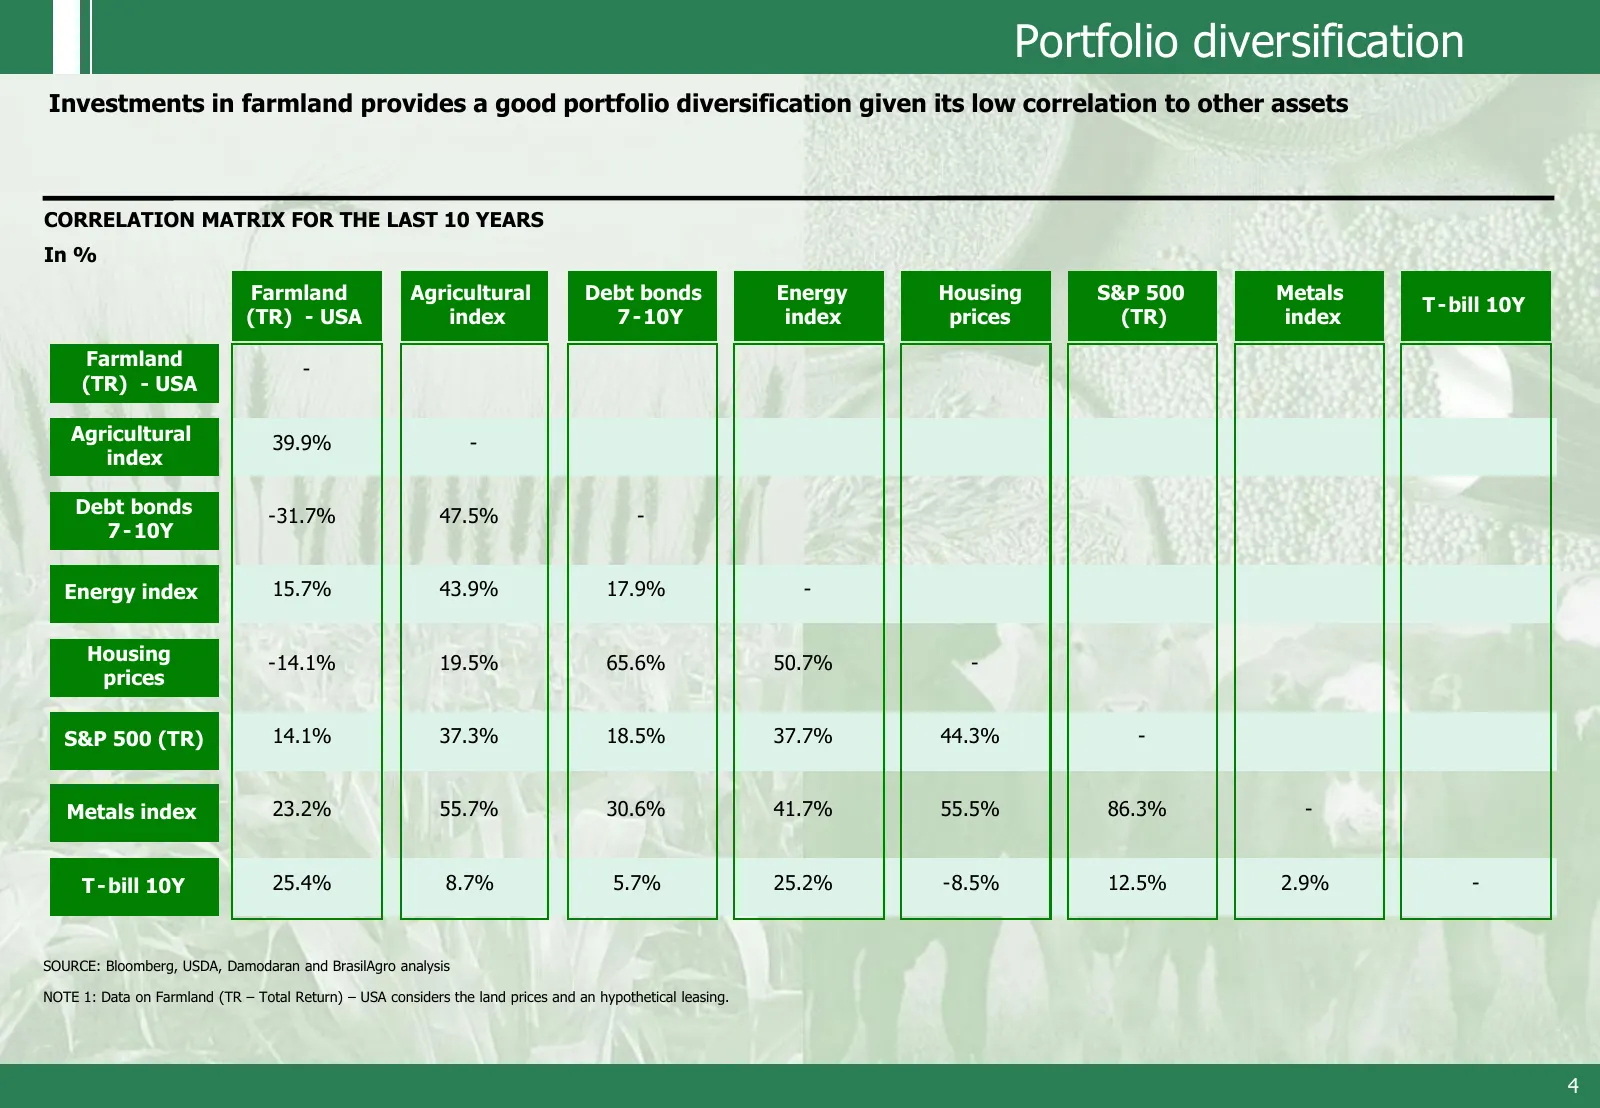
Portfolio diversification Investments in farmland provides a good portfolio diversification given its low correlation to other assets CORRELATION MATRIX FOR THE LAST 10 YEARS In % Farmland Agricultural Debt bonds Energy Housing S&P 500 Metals T -bill 10Y (TR) - USA index 7 -10Y index prices (TR) ind
Slide 5: Control map for farmland prices
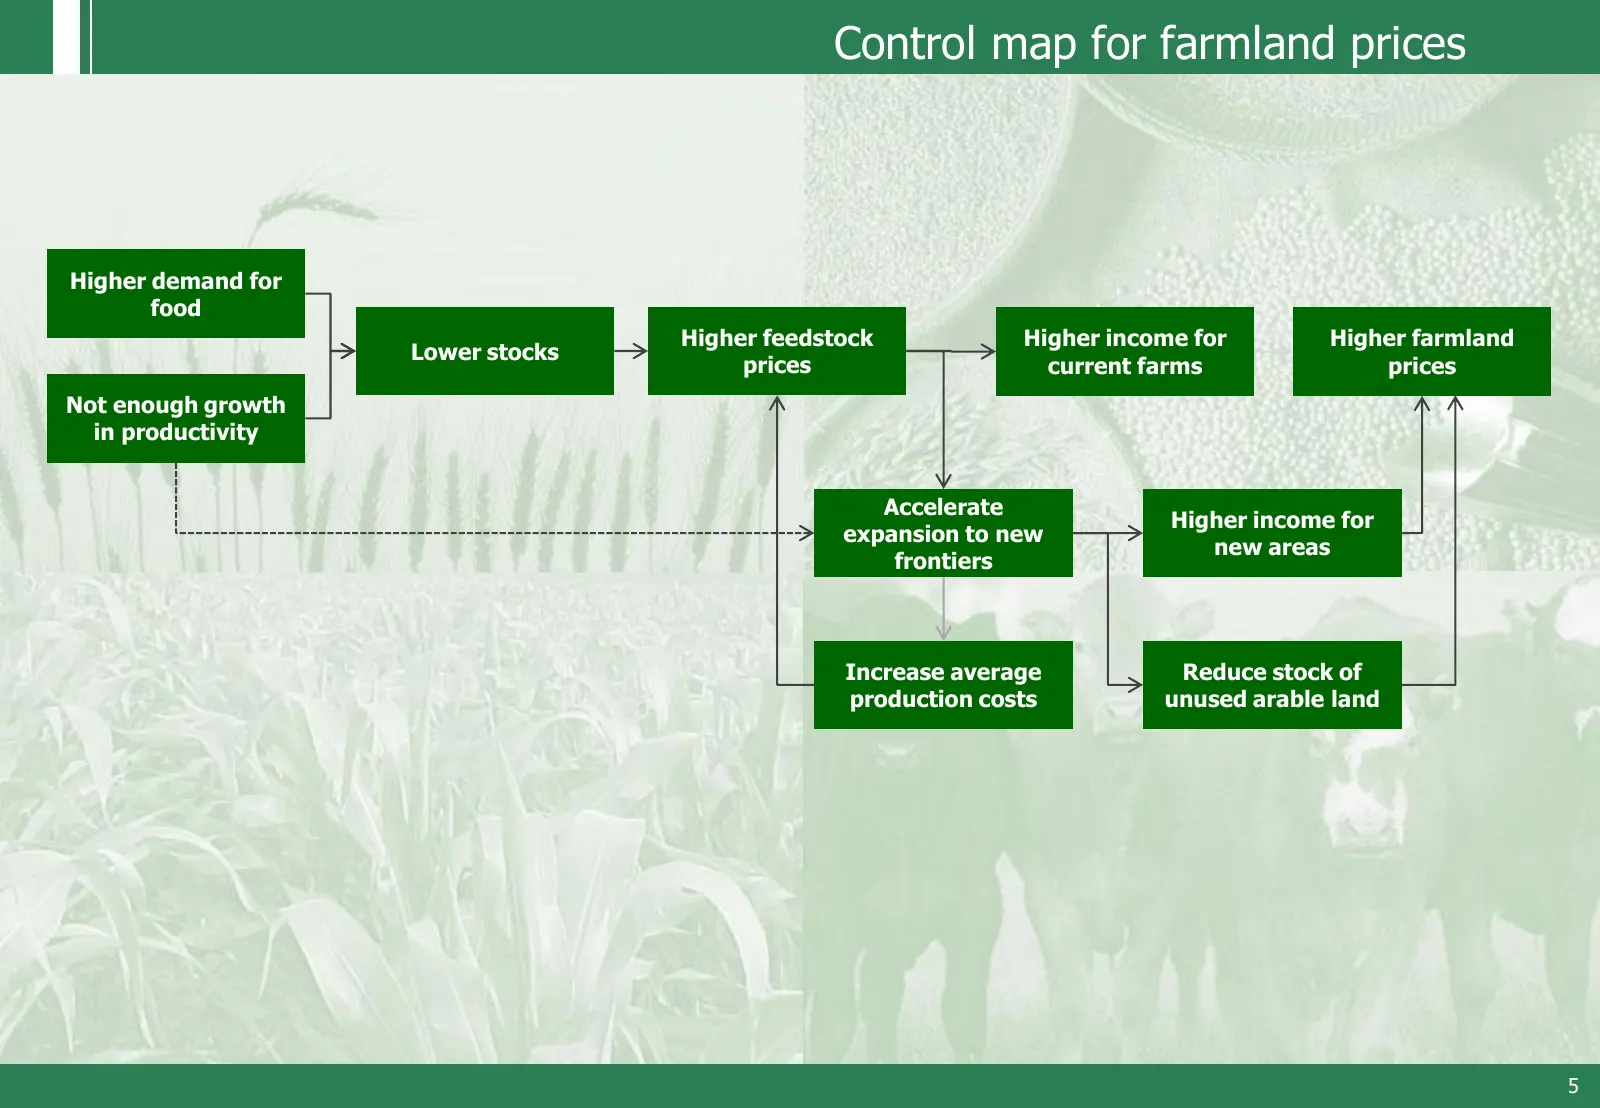
Control map for farmland prices Higher demand for food Higher feedstock Higher income for Higher farmland Lower stocks prices current farms prices Not enough growth in productivity Accelerate Higher income for expansion to new new areas frontiers Increase average Reduce stock of production costs unu
Slide 6: Scarcity value
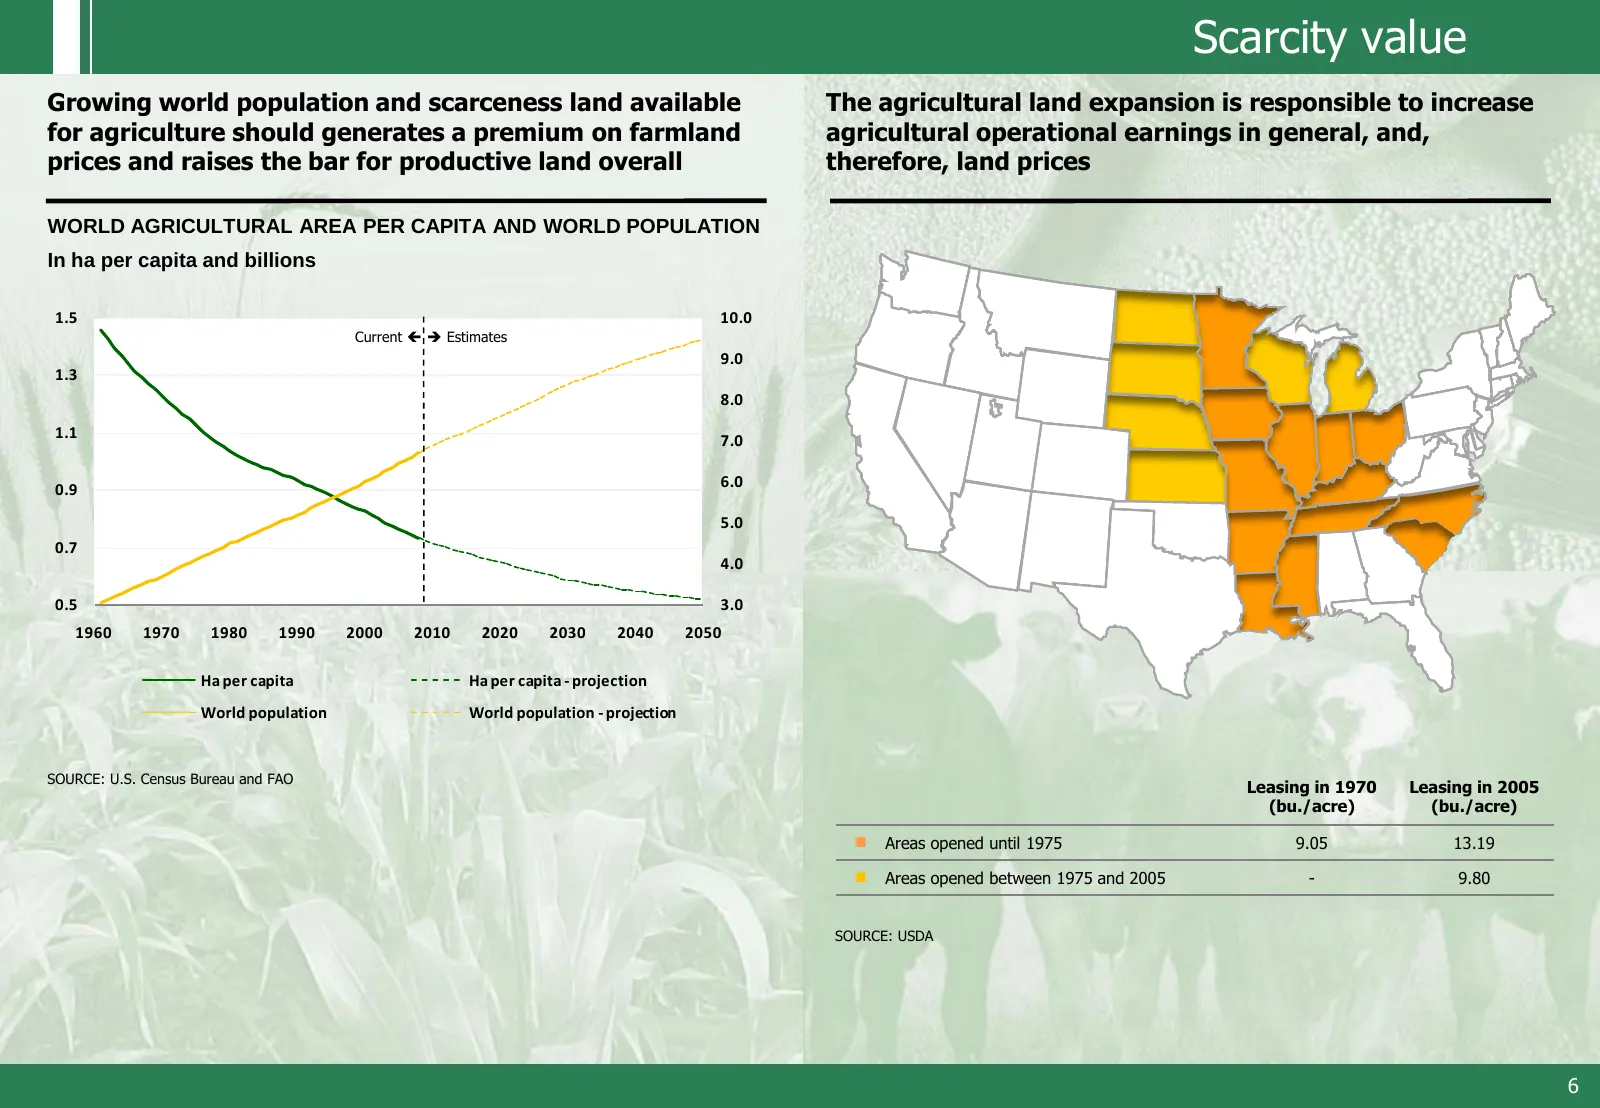
Scarcity value Growing world population and scarceness land available The agricultural land expansion is responsible to increase for agriculture should generates a premium on farmland agricultural operational earnings in general, and, prices and raises the bar for productive land overall therefore,
Slide 7: World growth and Food demand
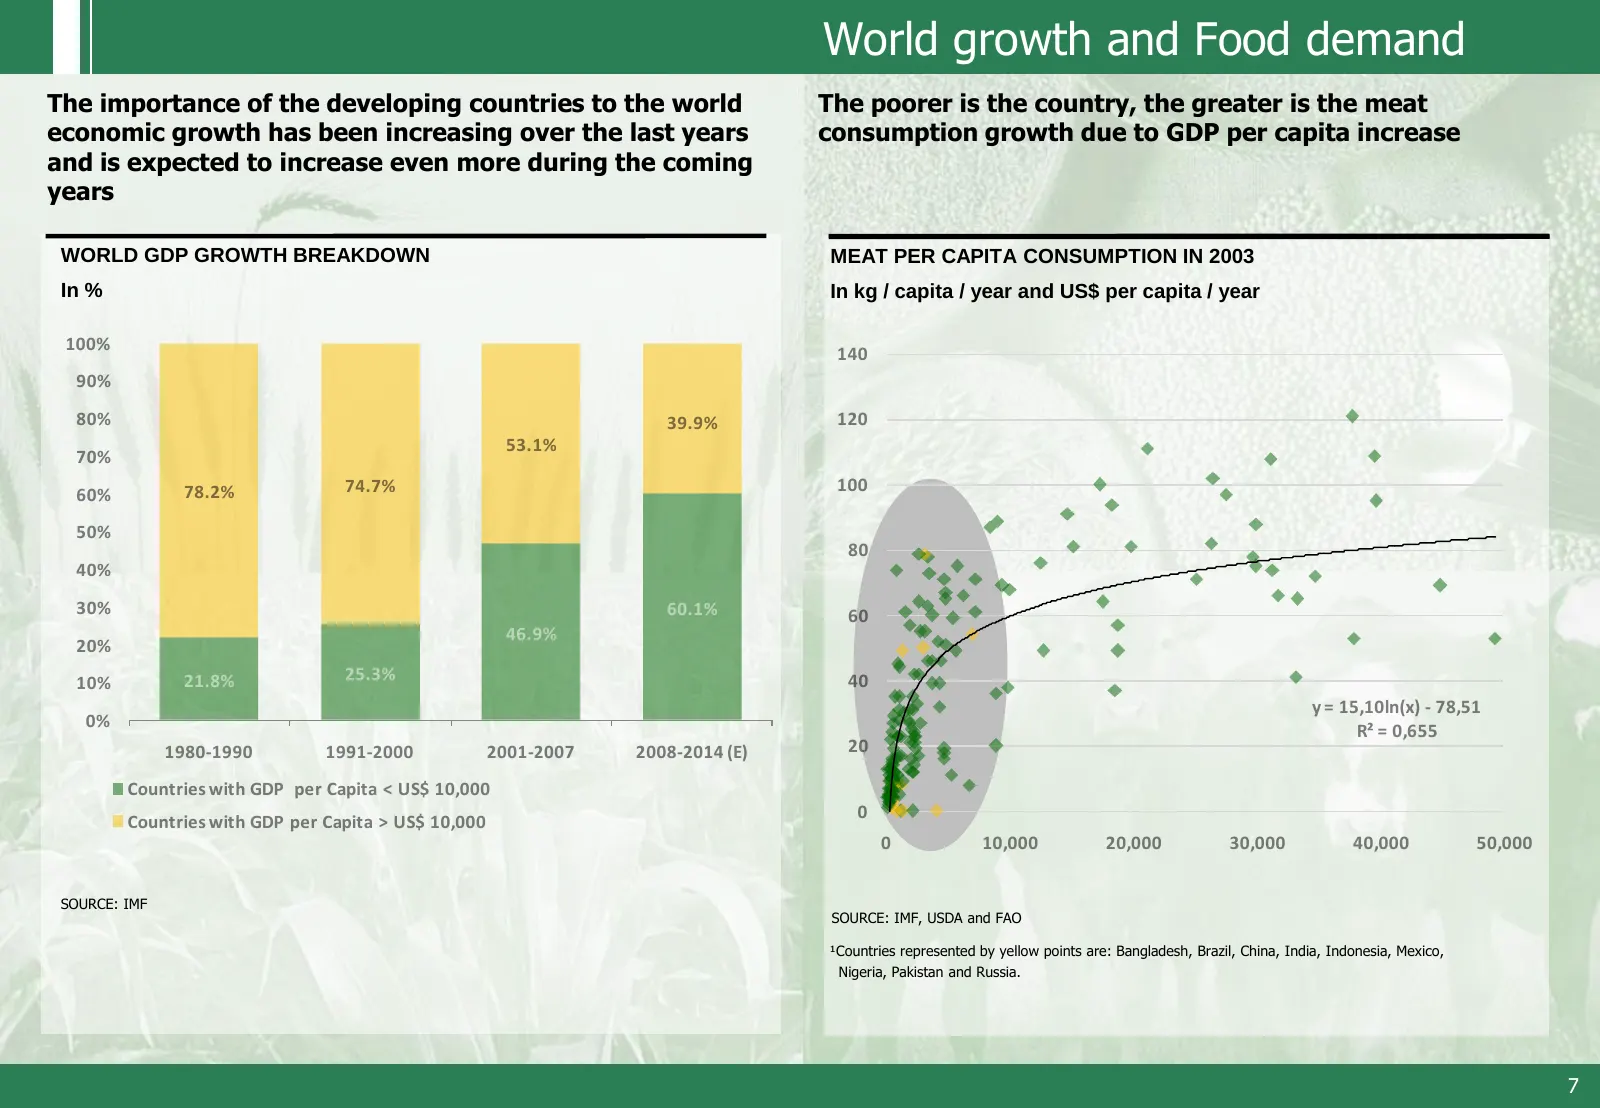
World growth and Food demand The importance of the developing countries to the world The poorer is the country, the greater is the meat economic growth has been increasing over the last years consumption growth due to GDP per capita increase and is expected to increase even more during the coming ye
Slide 8: World grain production evolution
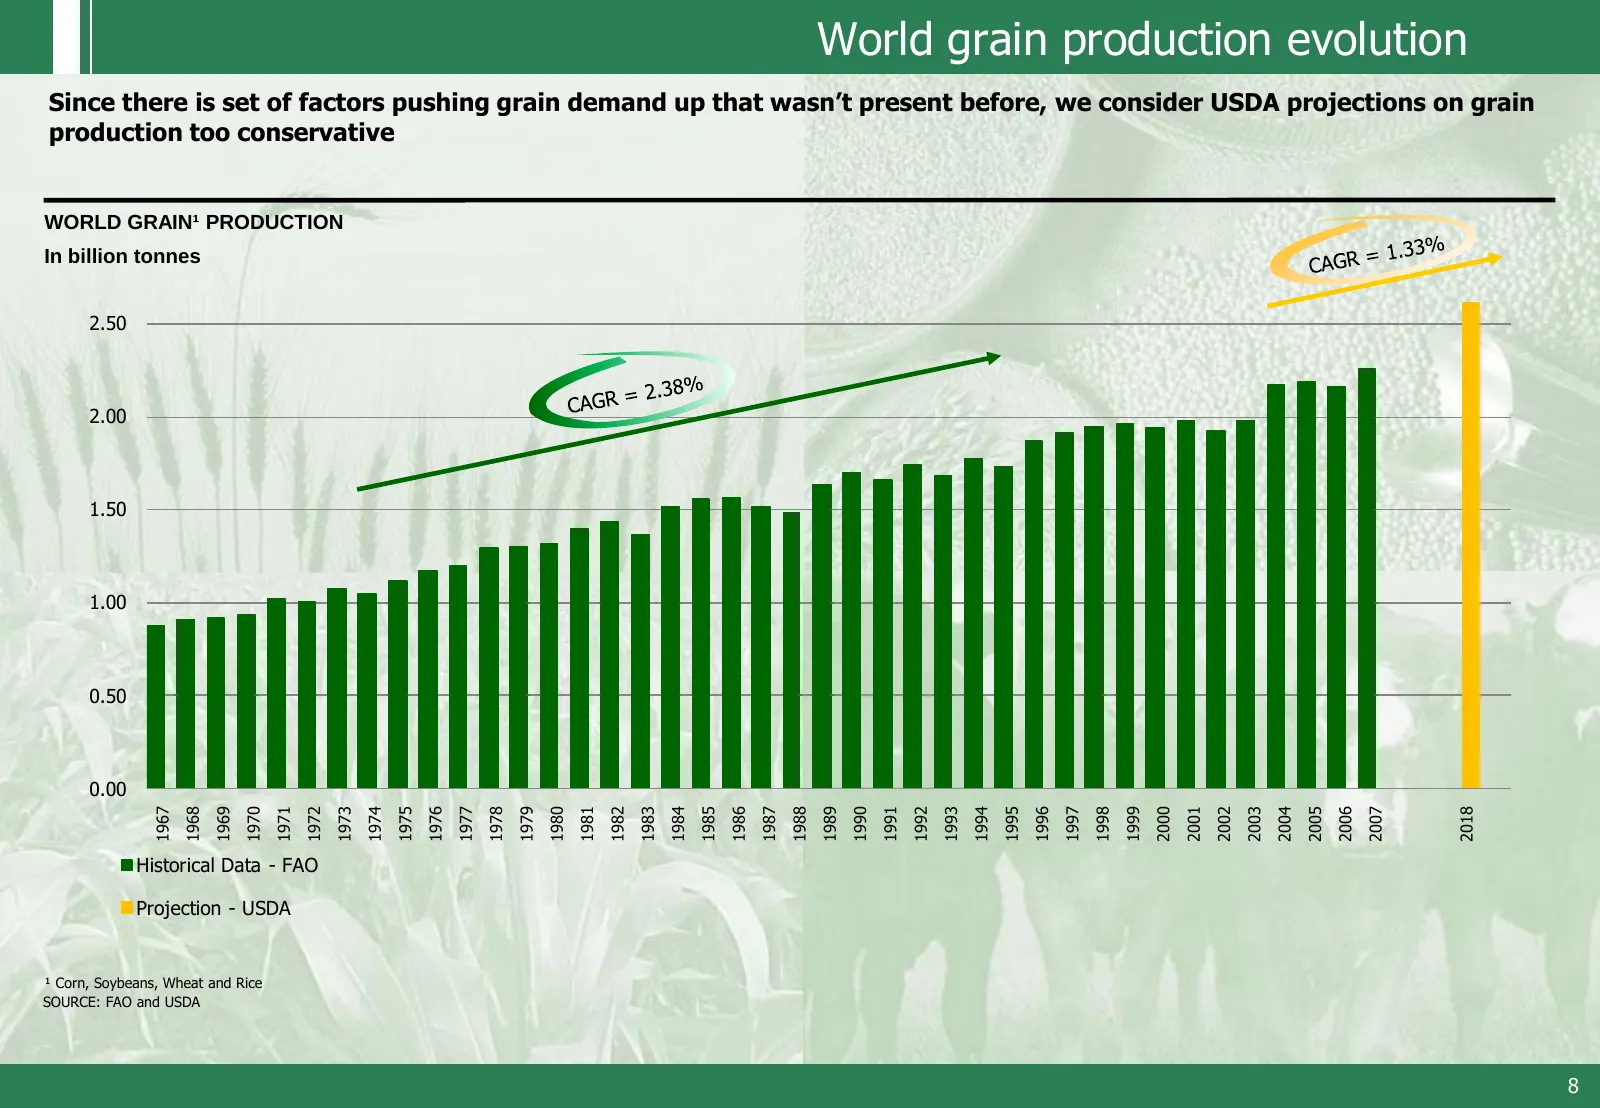
World grain production evolution Since there is set of factors pushing grain demand up that wasn’t present before, we consider USDA projections on grain production too conservative WORLD GRAIN¹ PRODUCTION In billion tonnes 2.50 2.00 1.50 1.00 0.50 0.00 1970 1974 1975 1979 1983 1984 1988 1992 1993 19
Slide 9: Grain production increase under different scenarios
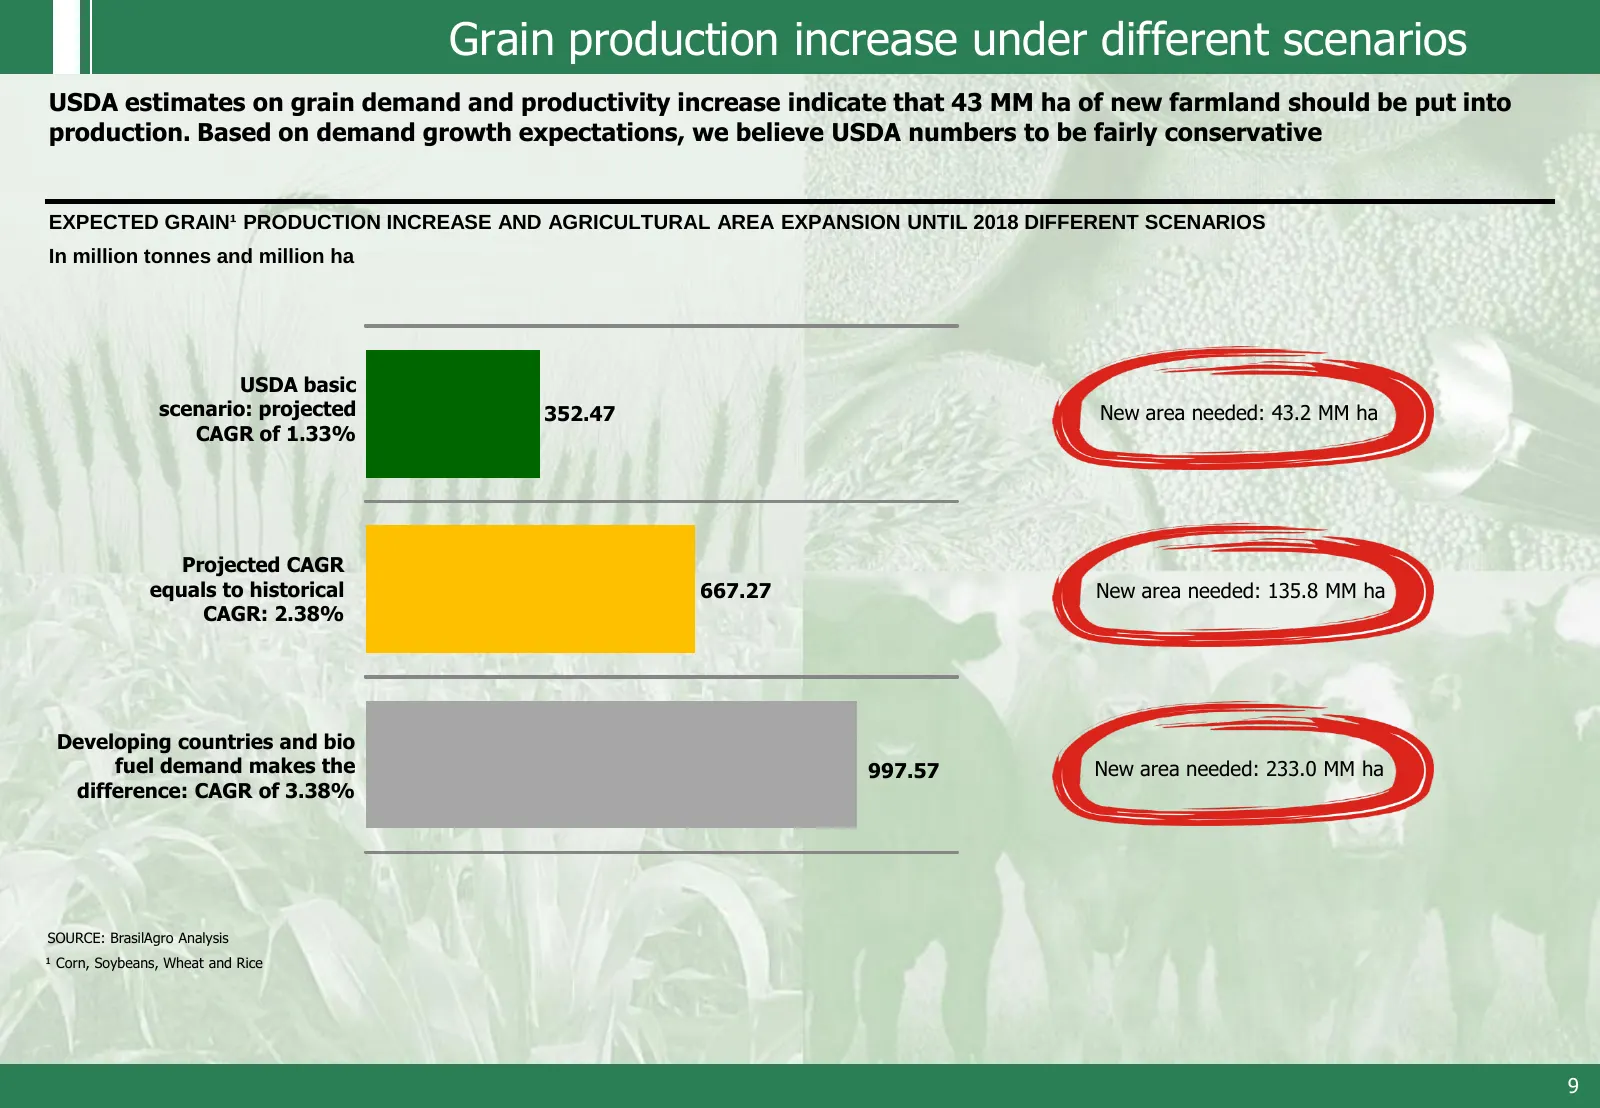
Grain production increase under different scenarios USDA estimates on grain demand and productivity increase indicate that 43 MM ha of new farmland should be put into production. Based on demand growth expectations, we believe USDA numbers to be fairly conservative EXPECTED GRAIN¹ PRODUCTION INCREAS
Slide 10: World arable land availability
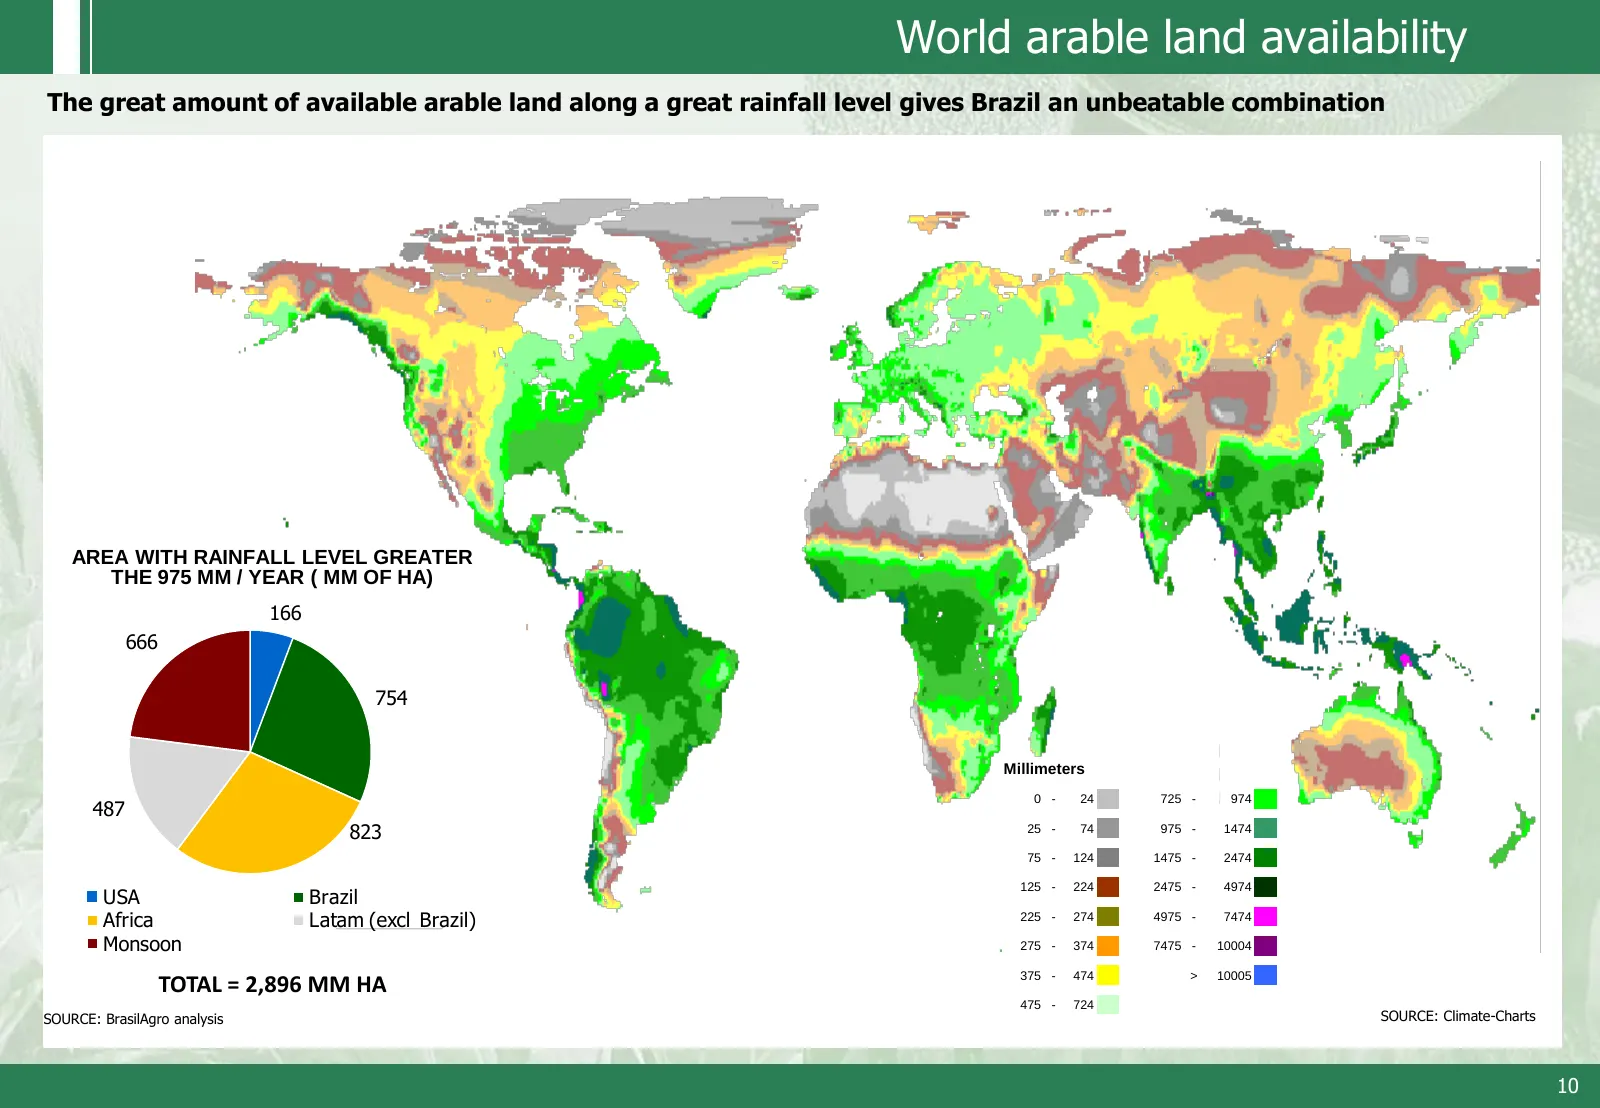
World arable land availability The great amount of available arable land along a great rainfall level gives Brazil an unbeatable combination AREA WITH RAINFALL LEVEL GREATER THE 975 MM / YEAR ( MM OF HA) 166 666 754 Millimeters 0 - 24 725 - 974 487 823 25 - 74 975 - 1474 75 - 124 1475 - 2474 125 - 2
Slide 11: Land Price Evolution in Brazil
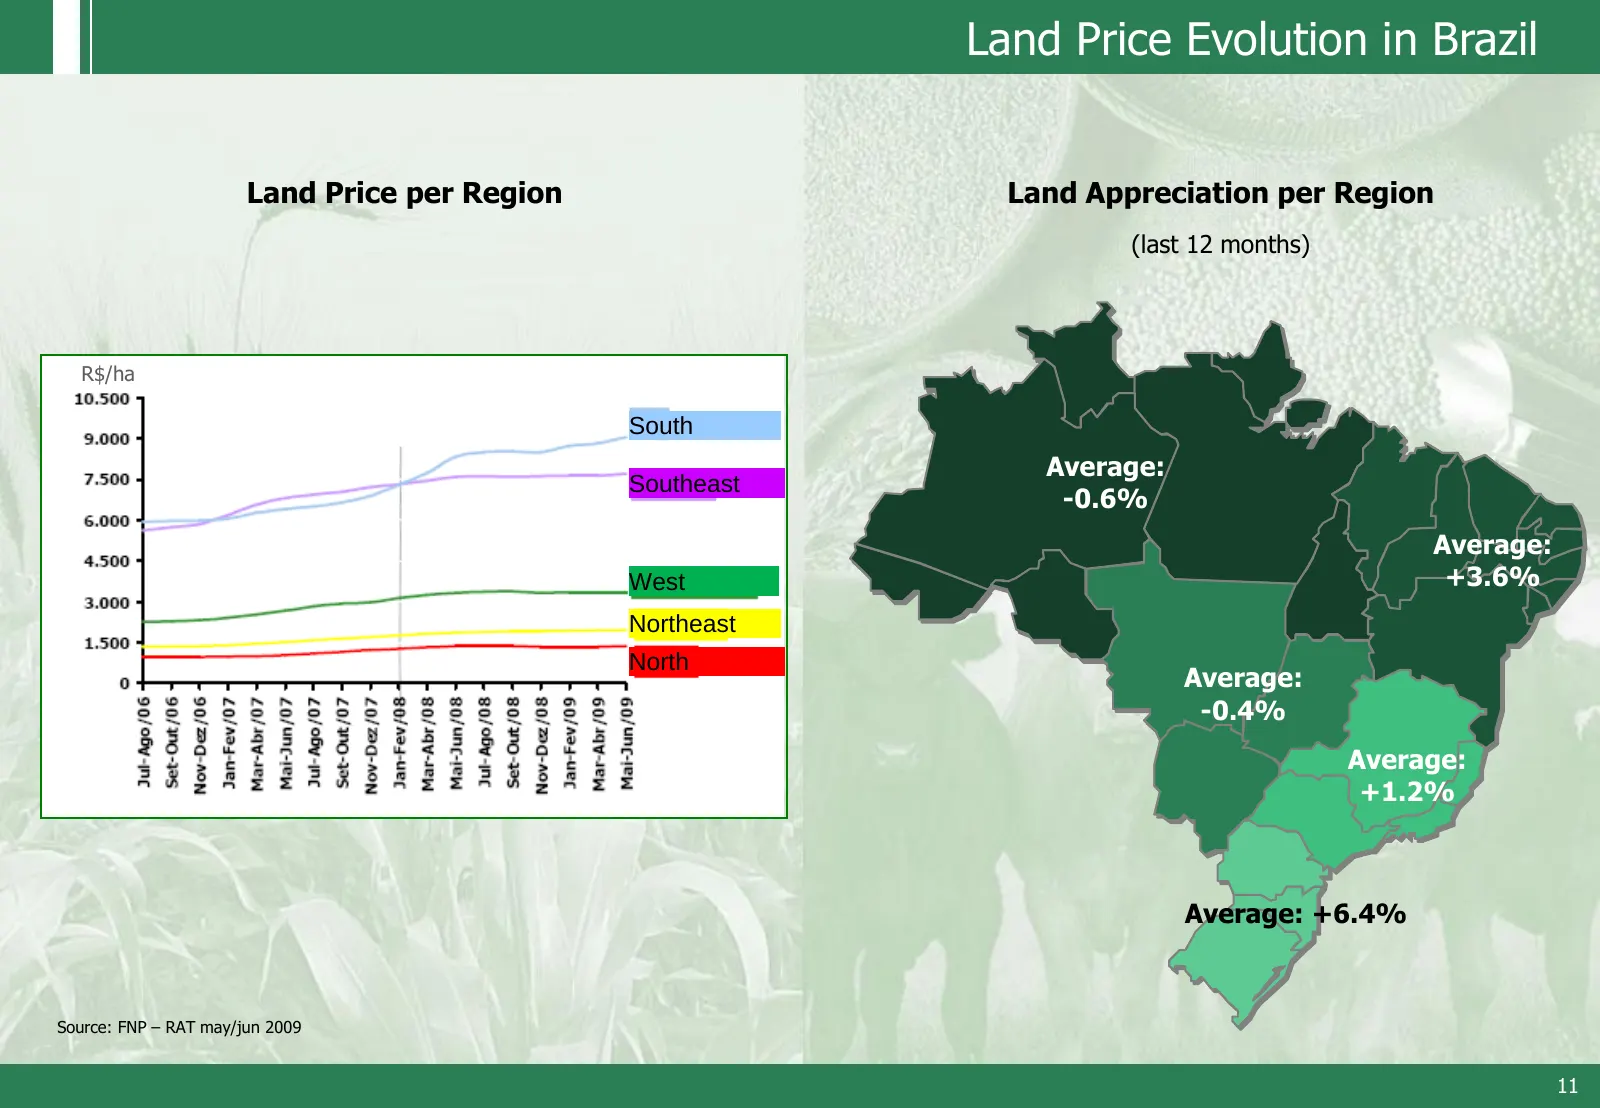
Land Price Evolution in Brazil Land Price per Region Land Appreciation per Region (last 12 months) R$/ha South Average: Southeast -0.6% Average: West +3.6% Northeast North Average: -0.4% Average: +1.2% Average: +6.4% Source: FNP – RAT may/jun 2009 11
Slide 12: Highlights
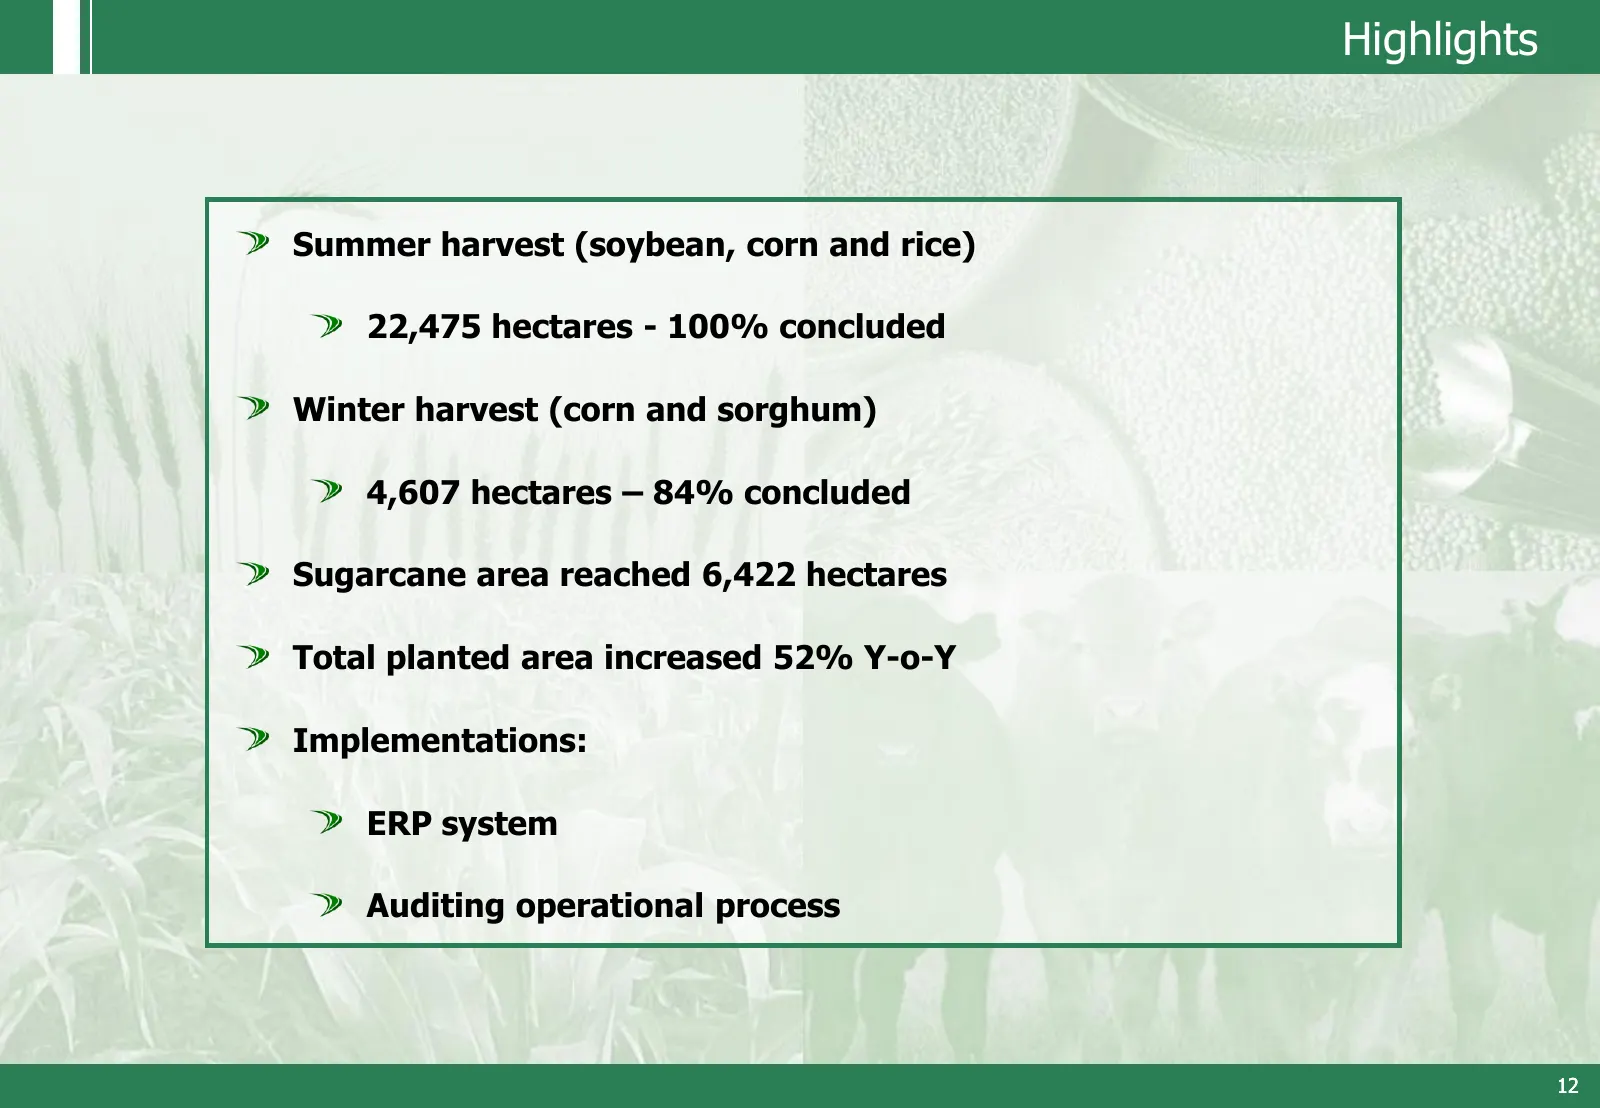
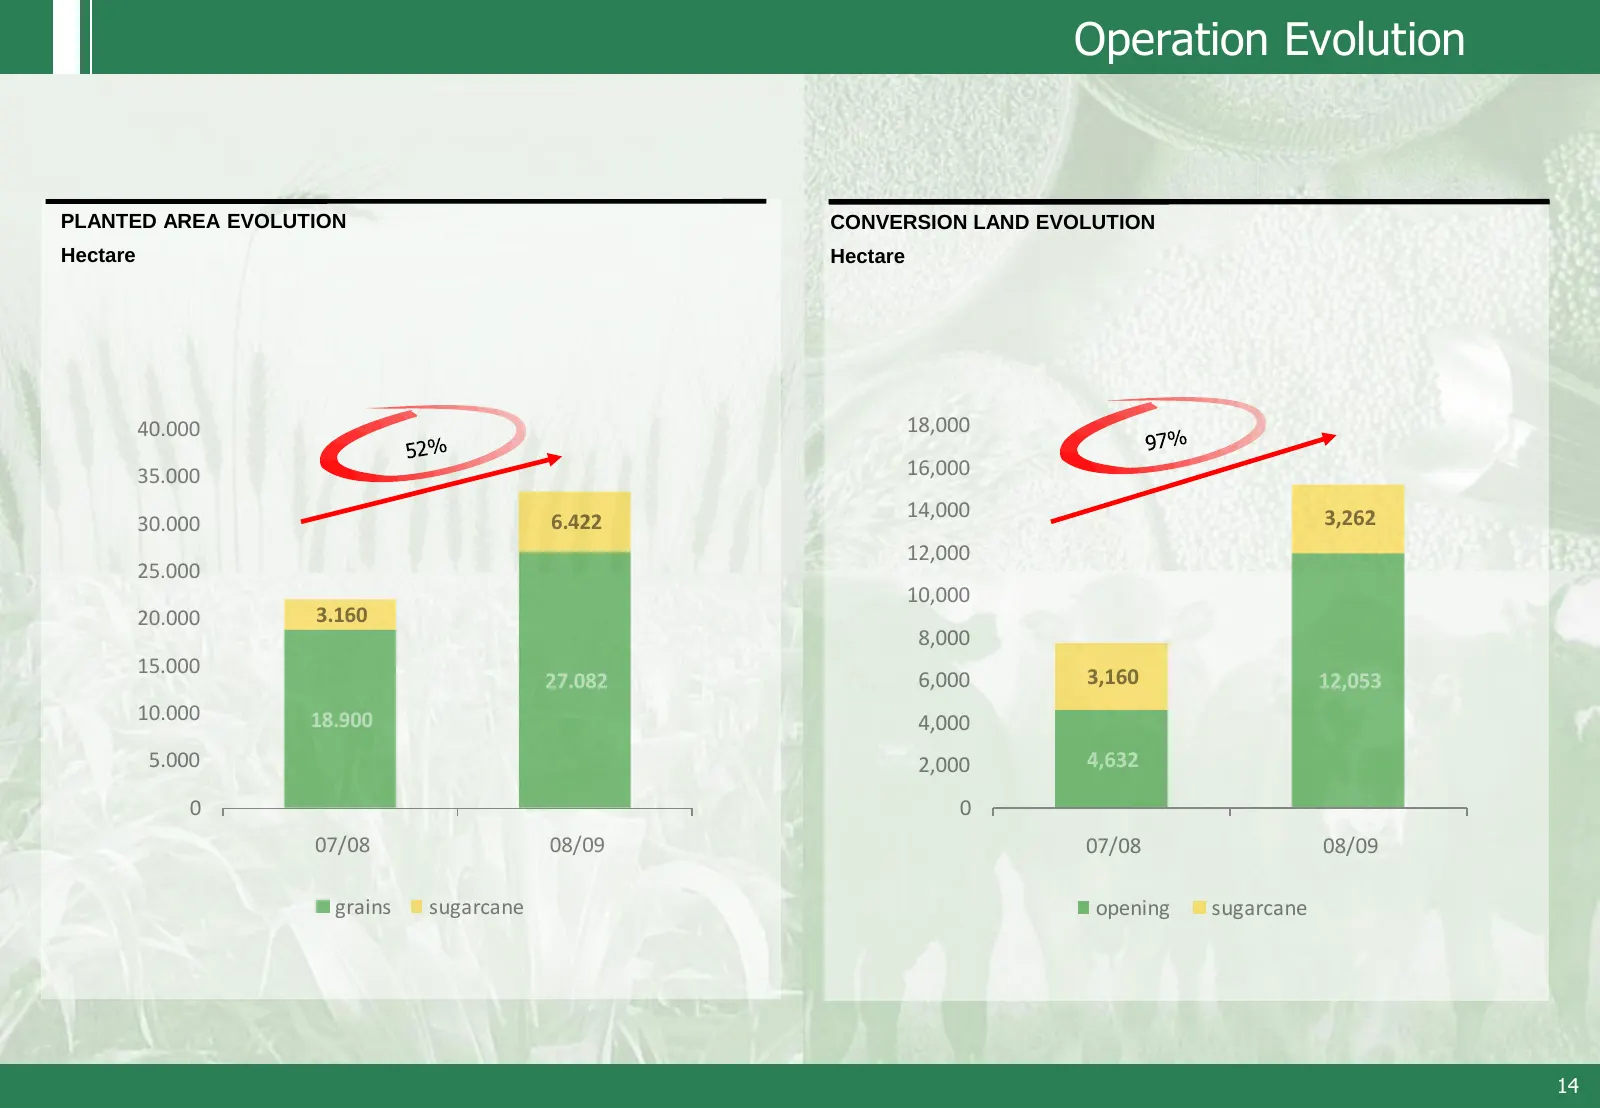
Highlights Summer harvest (soybean, corn and rice) 22,475 hectares - 100% concluded Winter harvest (corn and sorghum) 4,607 hectares – 84% concluded Sugarcane area reached 6,422 hectares Total planted area increased 52% Y-o-Y Implementations: ERP system Auditing operational process 12
Slide 13: Property Portfolio
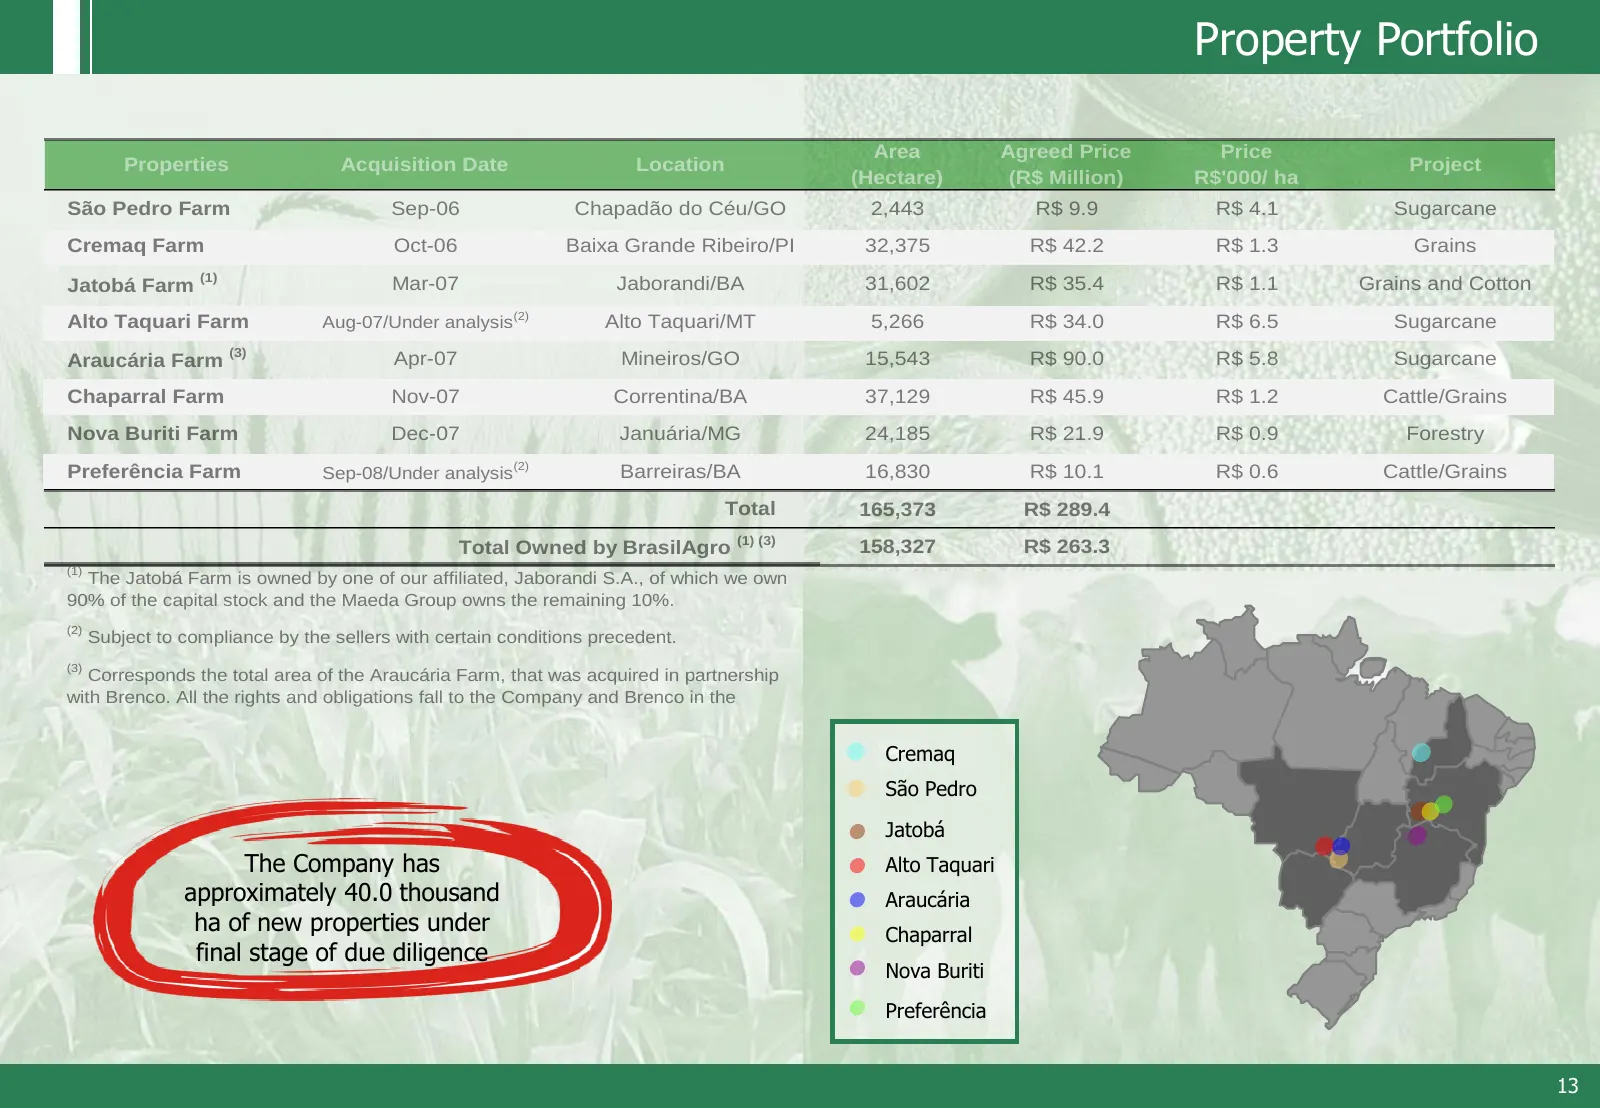
Property Portfolio Area Agreed Price Price Properties Acquisition Date Location Project (Hectare) (R$ Million) R$'000/ ha São Pedro Farm Sep-06 Chapadão do Céu/GO 2,443 R$ 9.9 R$ 4.1 Sugarcane Cremaq Farm Oct-06 Baixa Grande Ribeiro/PI 32,375 R$ 42.2 R$ 1.3 Grains Jatobá Farm (1) Mar-07 Jaborandi/BA
Slide 14: Operation Evolution
Operation Evolution PLANTED AREA EVOLUTION CONVERSION LAND EVOLUTION Hectare Hectare 40.000 18,000 35.000 16,000 14,000 3,262 30.000 6.422 12,000 25.000 10,000 20.000 3.160 8,000 15.000 3,160 27.082 6,000 12,053 10.000 18.900 4,000 5.000 2,000 4,632 0 0 07/08 08/09 07/08 08/09 grains sugarcane openi
Slide 15: Operational consolidation
Operational consolidation ERP System implementation The system went live on July 1st, 2009, connecting all farms to the main office in São Paulo. With broader insight, improved efficiency, and greater flexibility, the company can become more transparent, accountable, lean and agile. The system
Slide 16: Operational consolidation
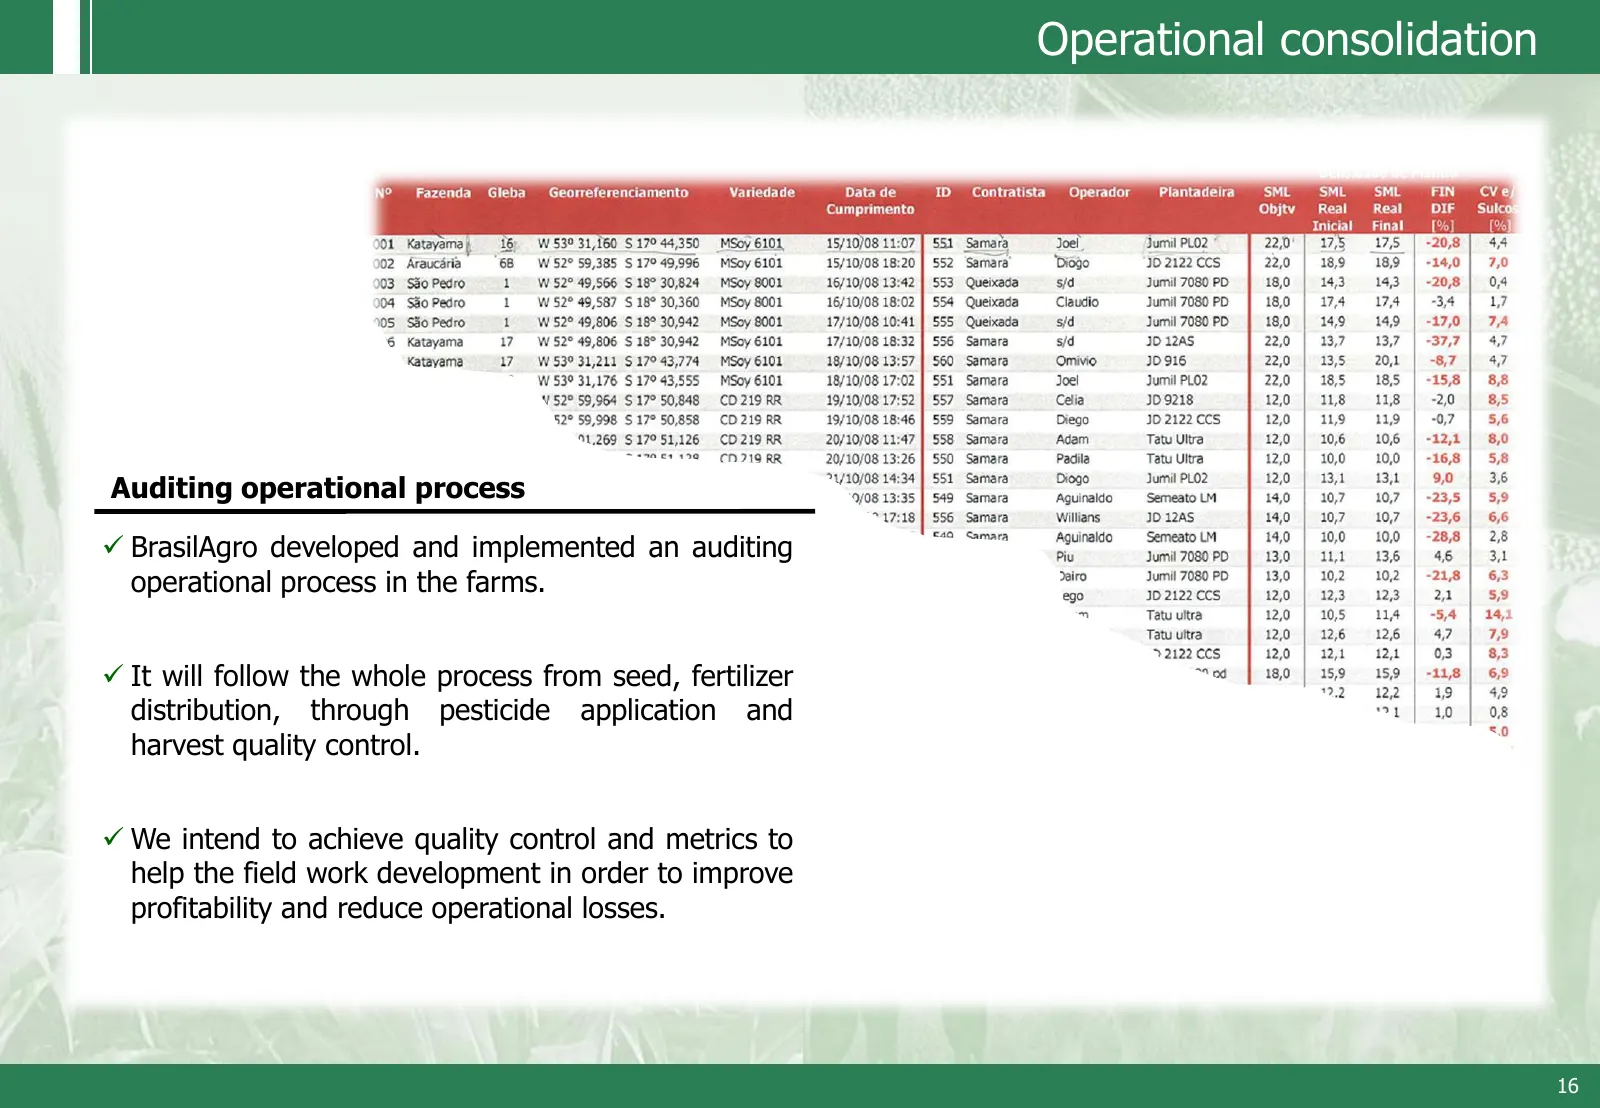
Operational consolidation Auditing operational process BrasilAgro developed and implemented an auditing operational process in the farms. It will follow the whole process from seed, fertilizer distribution, through pesticide application and harvest quality control. We intend to achieve quality
Slide 17: 2008/2009 Harvest Results
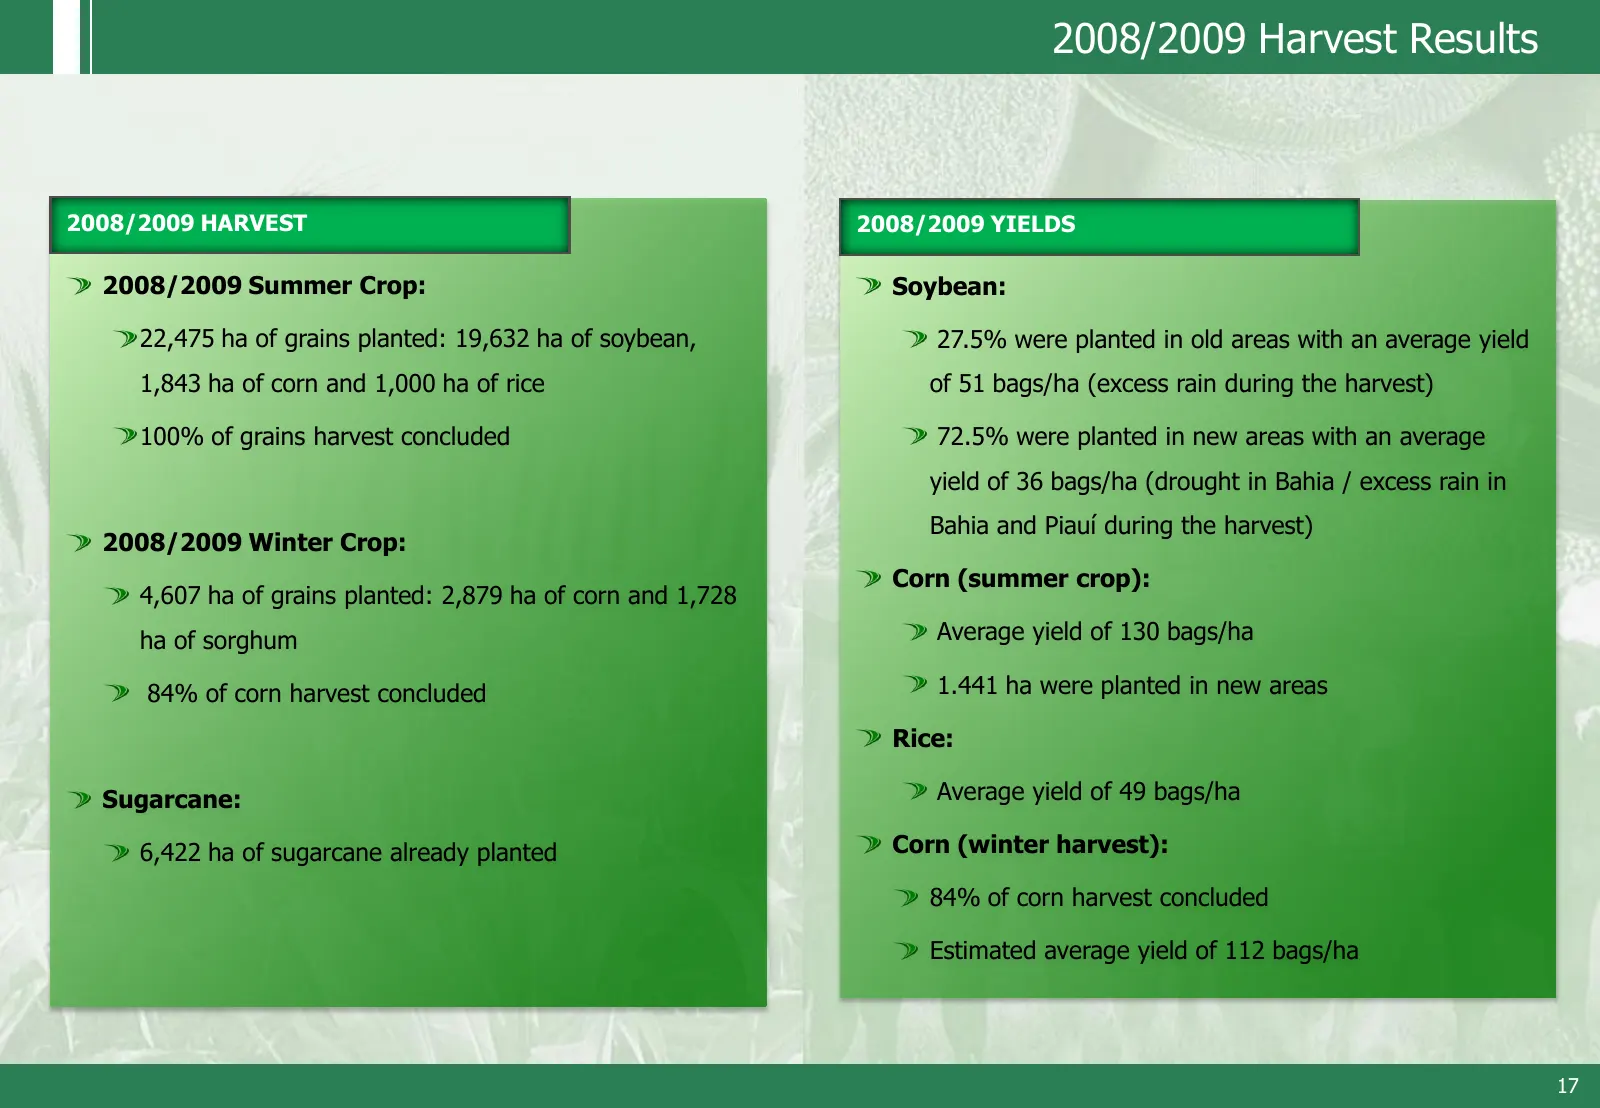
2008/2009 Harvest Results 2008/2009 HARVEST 2008/2009 YIELDS 2008/2009 Summer Crop: Soybean: 22,475 ha of grains planted: 19,632 ha of soybean, 27.5% were planted in old areas with an average yield 1,843 ha of corn and 1,000 ha of rice of 51 bags/ha (excess rain during the harvest) 100% of grains ha
Slide 18: Available cash as of June 30th
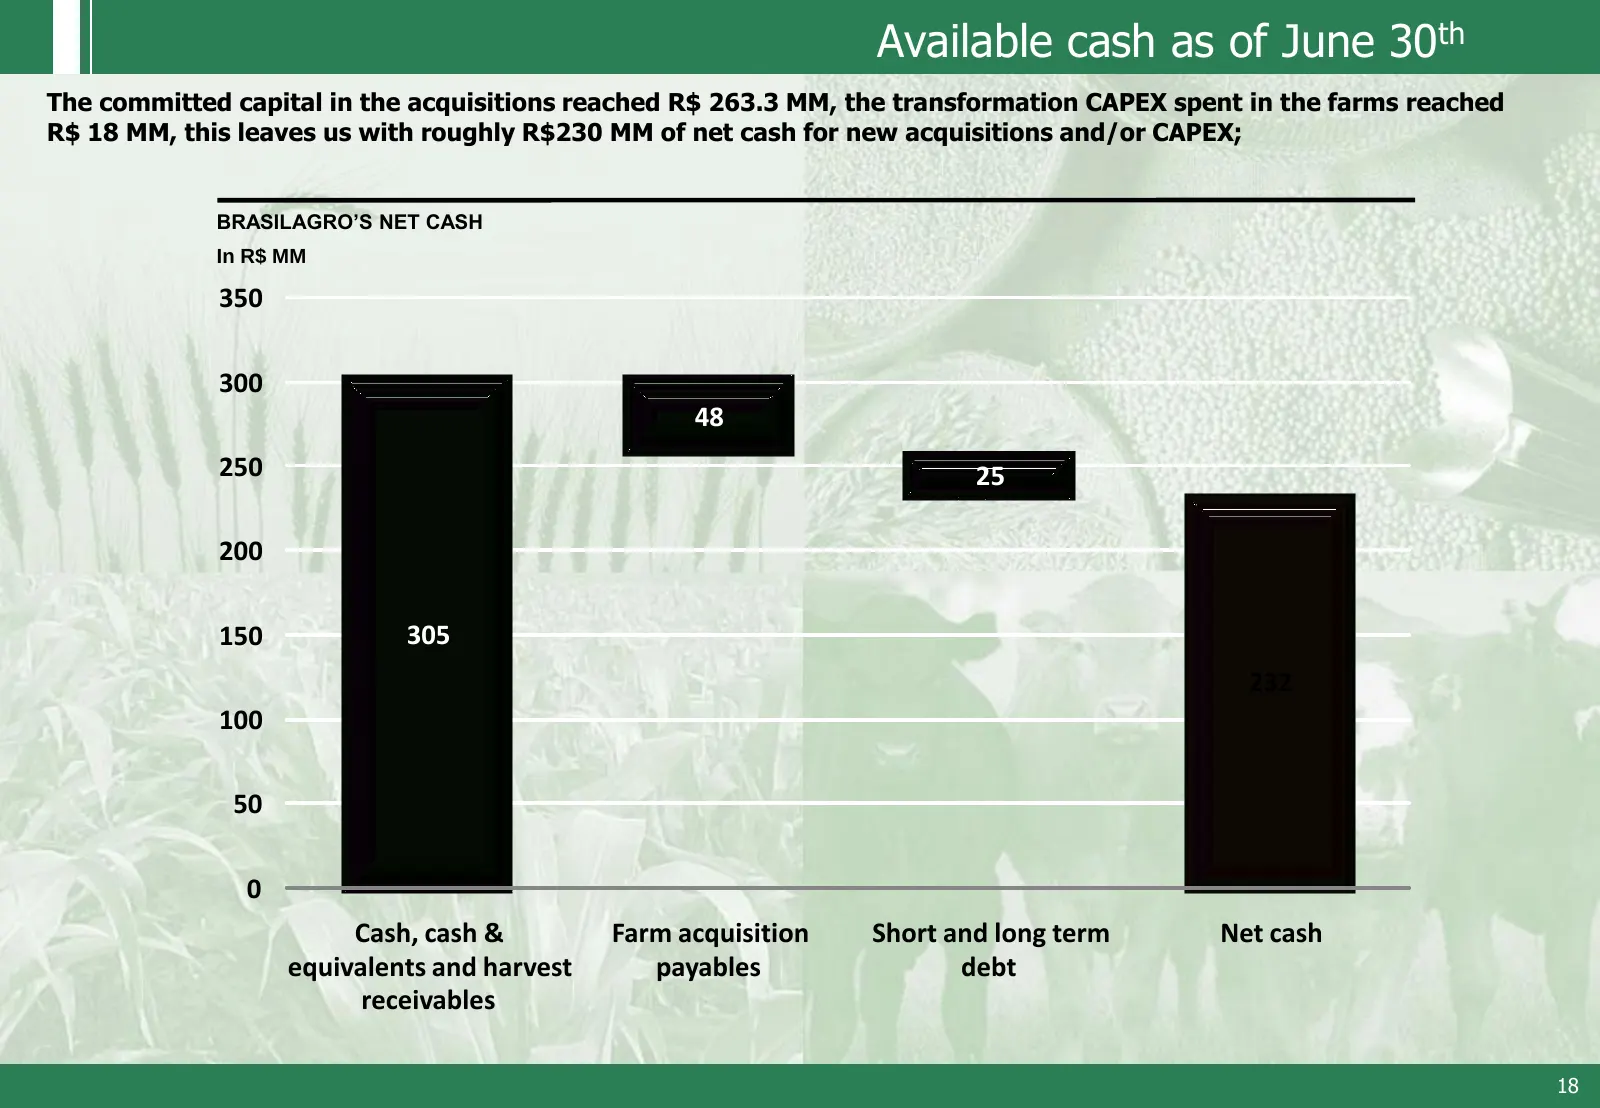
Available cash as of June 30th The committed capital in the acquisitions reached R$ 263.3 MM, the transformation CAPEX spent in the farms reached R$ 18 MM, this leaves us with roughly R$230 MM of net cash for new acquisitions and/or CAPEX; BRASILAGRO’S NET CASH In R$ MM 350 300 48 250 25 200 150 305
Slide 19: Hedge position as of September 3rd
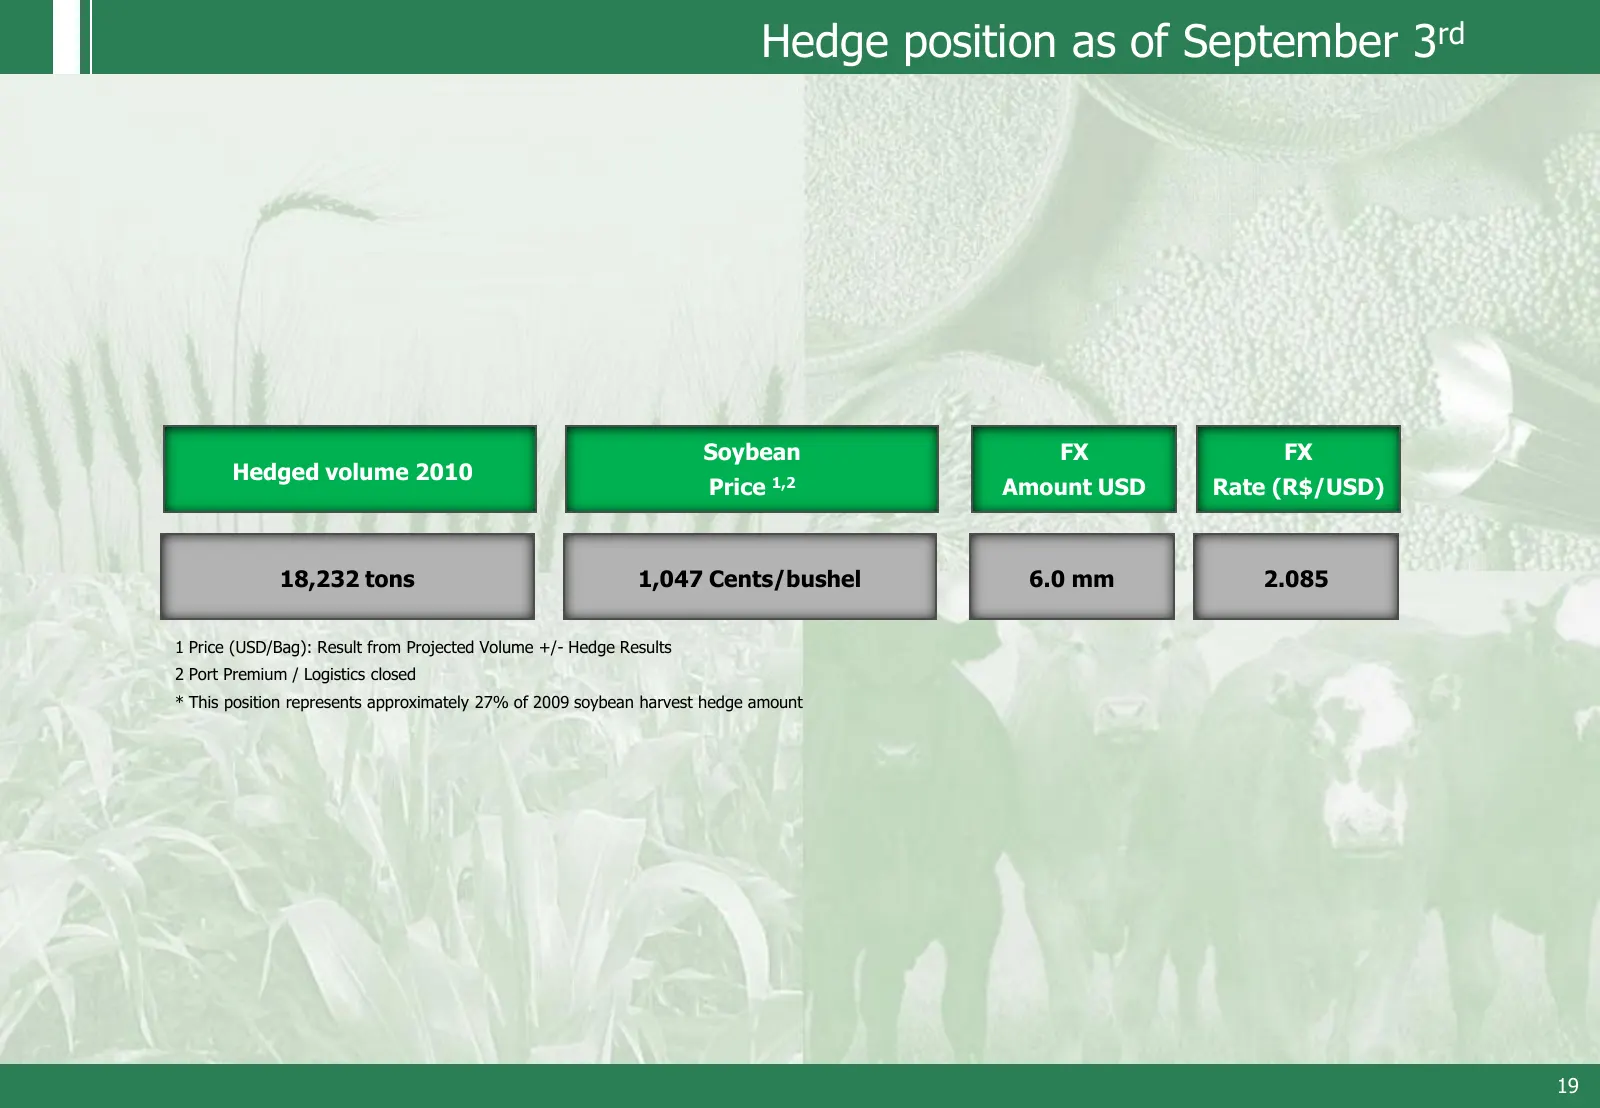
Hedge position as of September 3rd Soybean FX FX Hedged volume 2010 Price 1,2 Amount USD Rate (R$/USD) 18,232 tons 1,047 Cents/bushel 6.0 mm 2.085 1 Price (USD/Bag): Result from Projected Volume +/- Hedge Results 2 Port Premium / Logistics closed * This position represents approximately 27% of 2009
Slide 20: Income Statement
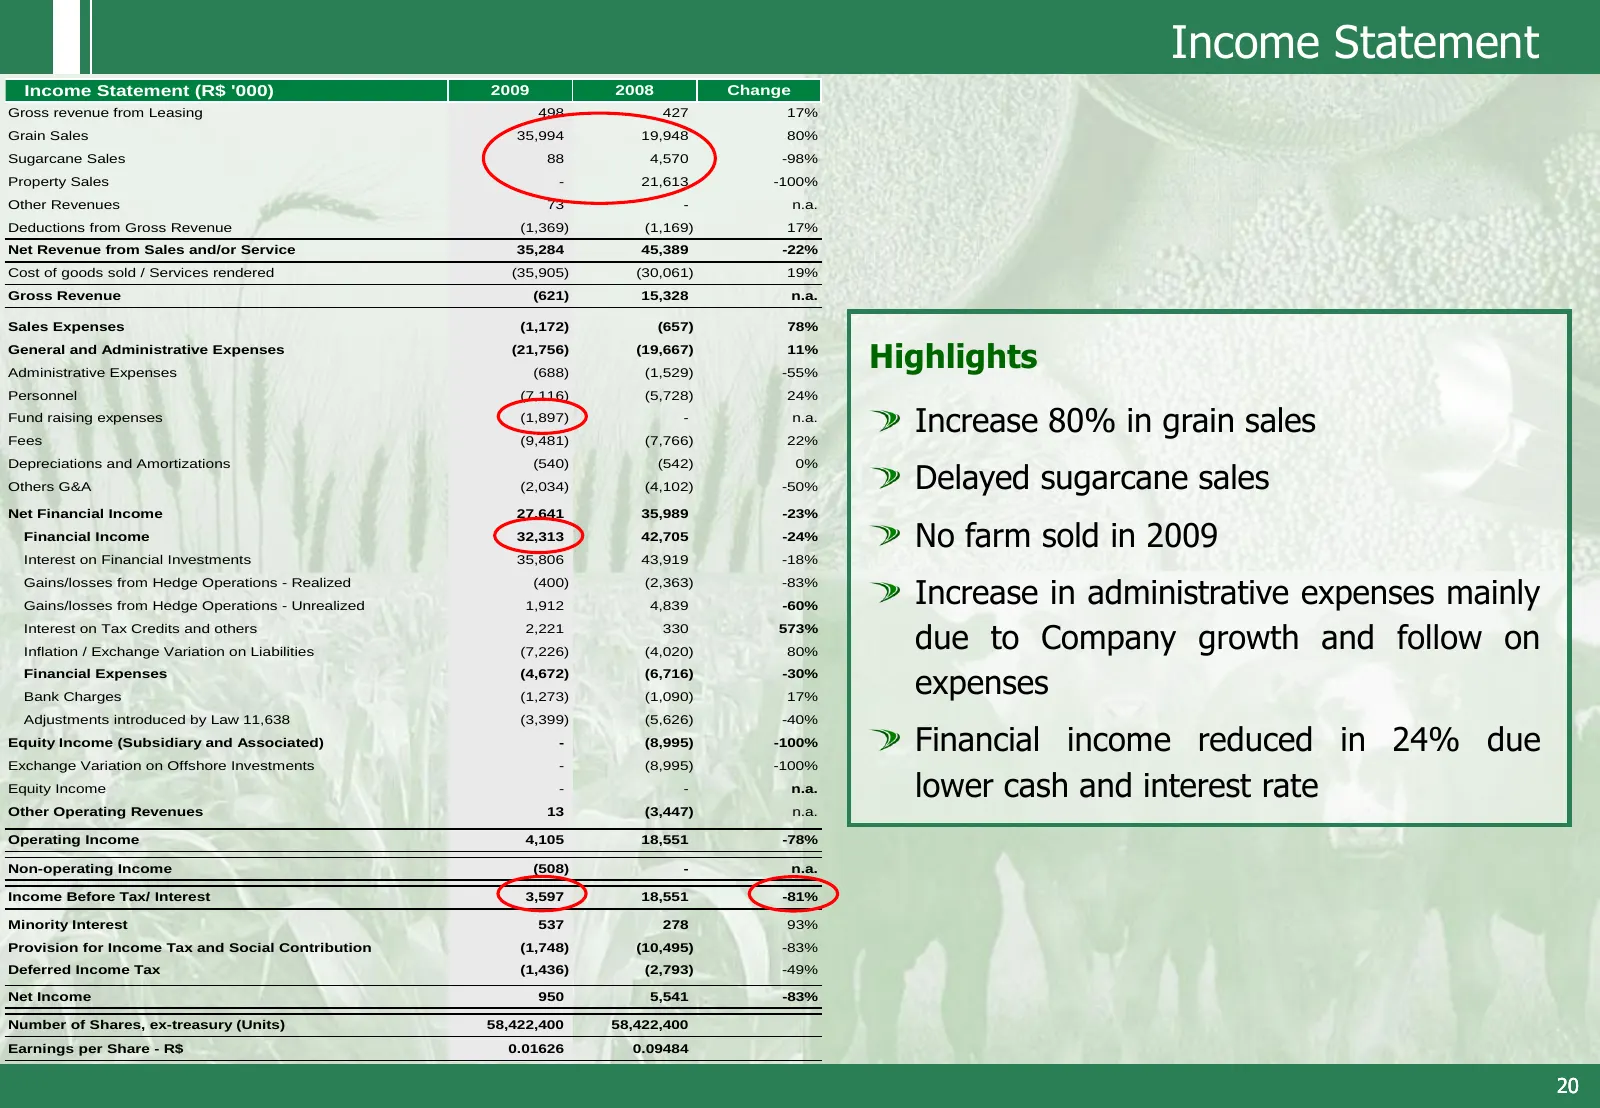
Income Statement Income Statement (R$ '000) 2009 2008 Change Gross revenue from Leasing 498 427 17% Grain Sales 35,994 19,948 80% Sugarcane Sales 88 4,570 -98% Property Sales - 21,613 -100% Other Revenues 73 - n.a. Deductions from Gross Revenue (1,369) (1,169) 17% Net Revenue from Sales and/or Servi
Slide 21: Balance Sheet
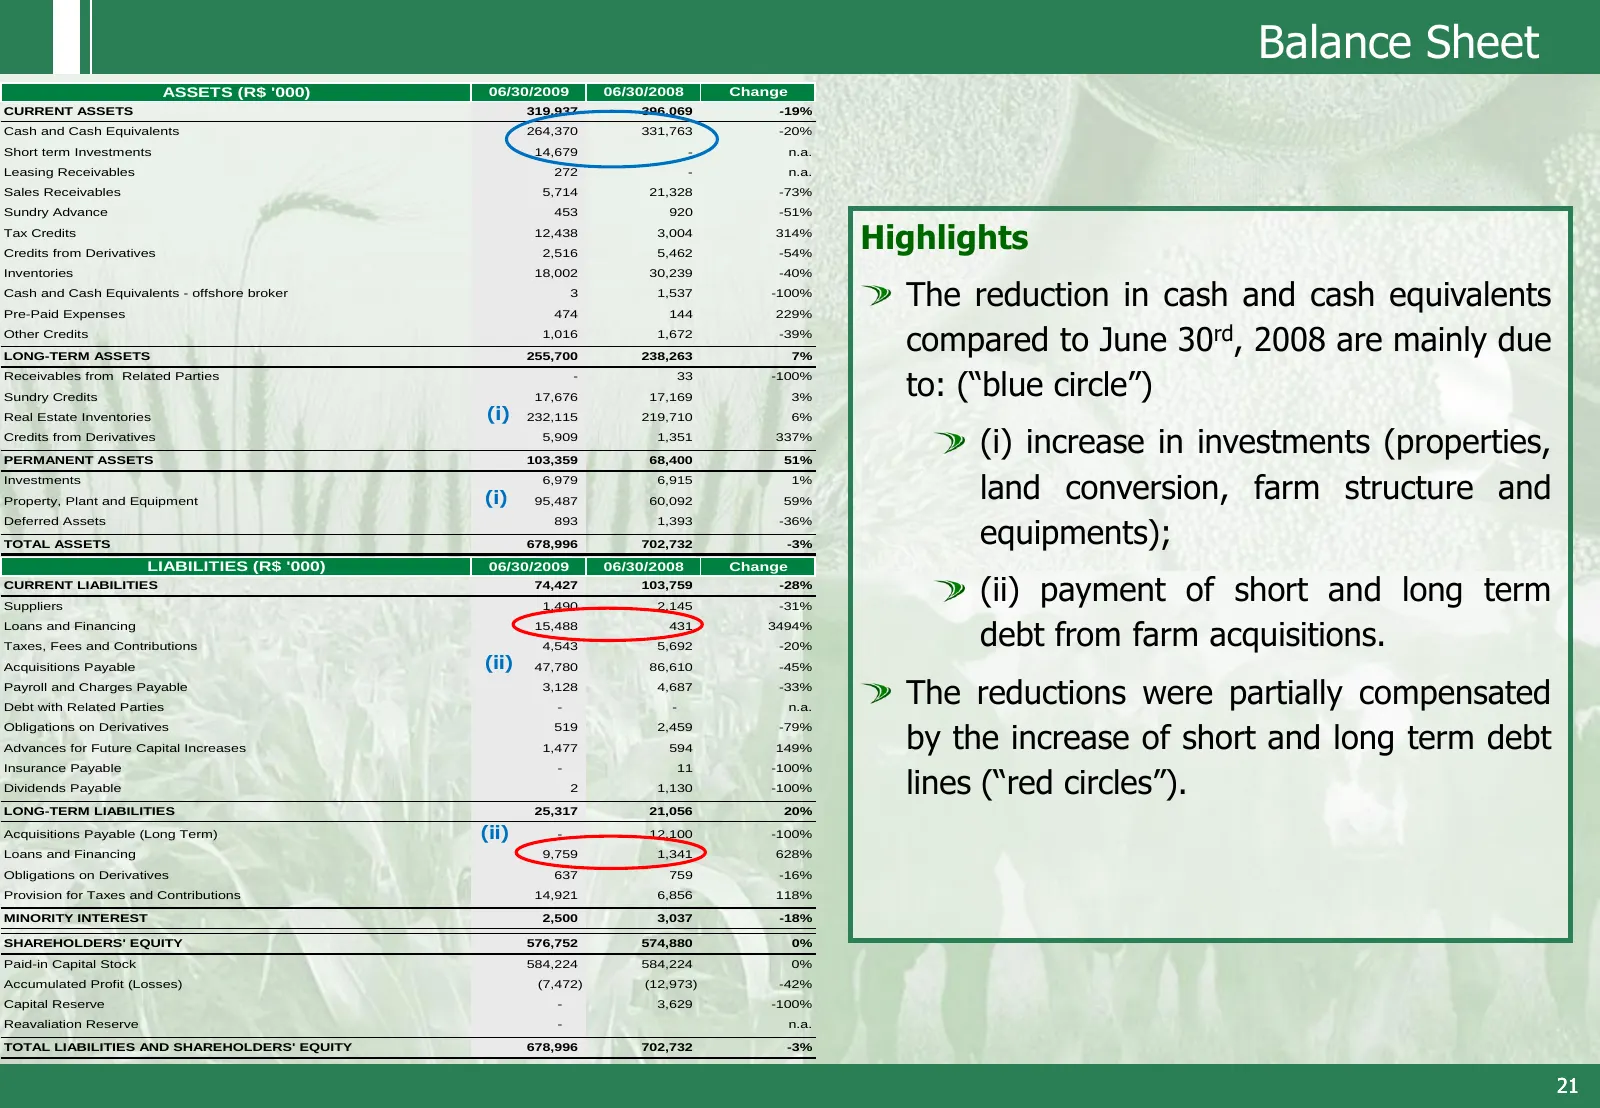
Balance Sheet ASSETS (R$ '000) 06/30/2009 06/30/2008 Change CURRENT ASSETS 319,937 396,069 -19% Cash and Cash Equivalents 264,370 331,763 -20% Short term Investments 14,679 - n.a. Leasing Receivables 272 - n.a. Sales Receivables 5,714 21,328 -73% Sundry Advance 453 920 -51% Tax Credits Credits from
Slide 22: Disclaimer – Forward Looking Statements
Disclaimer – Forward Looking Statements This presentation contains forward-looking statements relating to the prospects of the business, estimates for operating and financial results, and those related to growth prospects of BrasilAgro. These are merely projections and, as such, are based exclusivel
Source: Internet Archive copy of brasil-agro.com
More decks from BrasilAgro Cia Brasileira de Propriedades Agricolas
 Q3 2026 Earnings Presentation14 slides · May 8, 2026
 Q2 2026 Earnings Presentation15 slides · Feb 6, 2026
 Q1 2026 Earnings Presentation15 slides · Nov 10, 2025
 Q4 2025 Earnings Presentation18 slides · Sep 8, 2025
 Q3 2025 Earnings Presentation12 slides · May 9, 2025
 Q1 2025 Earnings Presentation20 slides · Nov 8, 2024
All 19 BrasilAgro Cia Brasileira de Propriedades Agricolas decks