Bob Evans Farms — Oppenheimer 15th Annual Consumer Conference 2015
34 slides from Bob Evans Farms's conference presentation, Jun 24, 2015
Slide 1: Investor Presentation – Oppenheimer 15th Annual Consumer Conference
Investor Presentation Oppenheimer 15th Annual Consumer Conference Boston, MA June 24, 2015 Mark Hood, Chief Financial Officer and Co-Interim CEO Scott Taggart, VP, Investor Relations Bob Evans
Slide 2: Safe Harbor Statement
SAFE HARBOR STATEMENT Certain statements in this presentation that are not historical facts are forward-looking statements. Forward-looking statements involve various important assumptions, risks and uncertainties. Actual results may differ materially from those predicted by the forward-looking stat
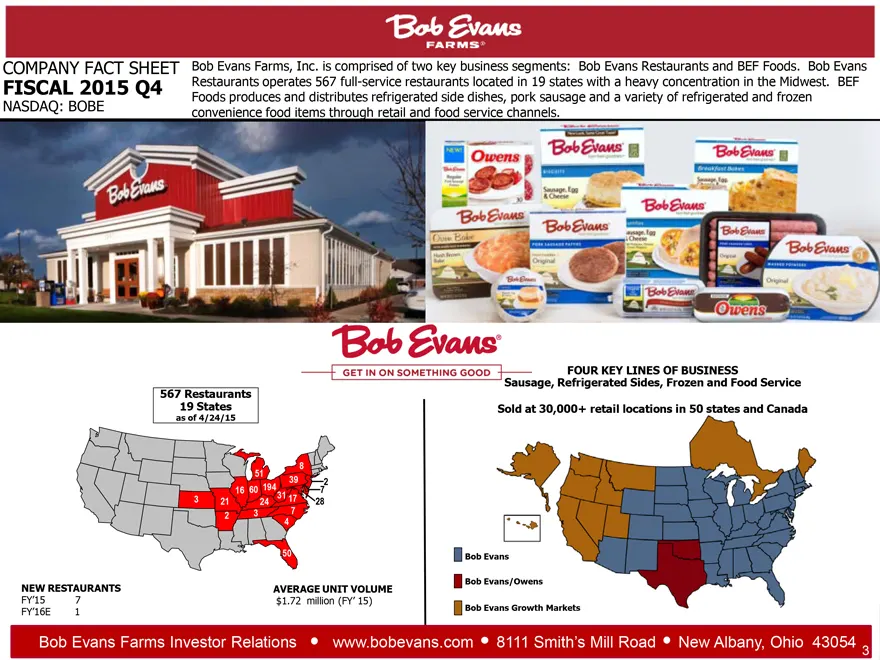
Slide 3: Company Fact Sheet
COMPANY FACT SHEET FISCAL 2015 Q4 NASDAQ: BOBE Bob Evans Farms, Inc. is comprised of two key business segments: Bob Evans Restaurants and BEF Foods. Bob Evans Restaurants operates 567 full-service restaurants located in 19 states with a heavy concentration in the Midwest. BEF Foods produces and dist
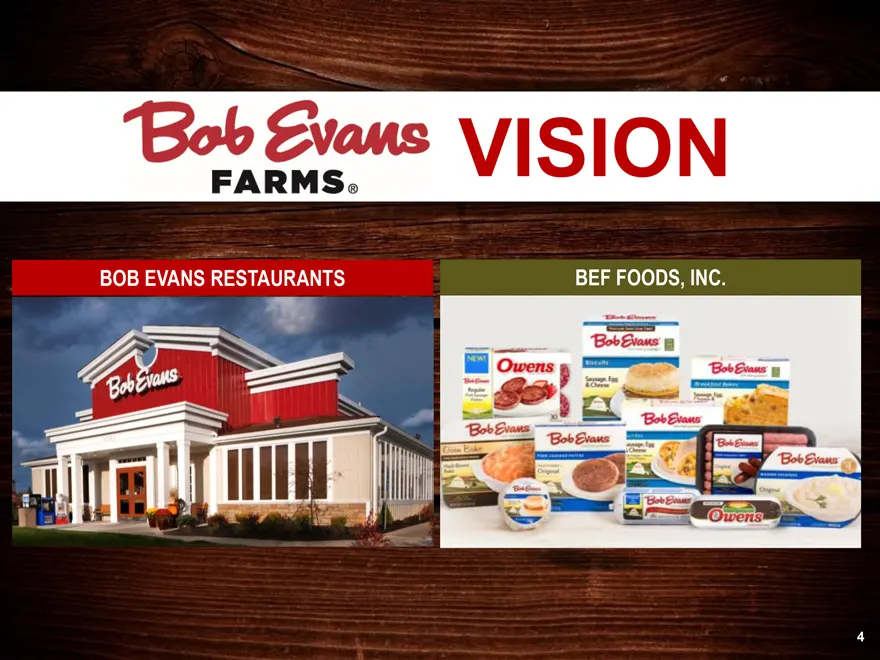
Slide 4: Vision
VISION BOB EVANS RESTAURANTS BEF FOODS, INC.
Slide 5: Business Segments (FY 2015)
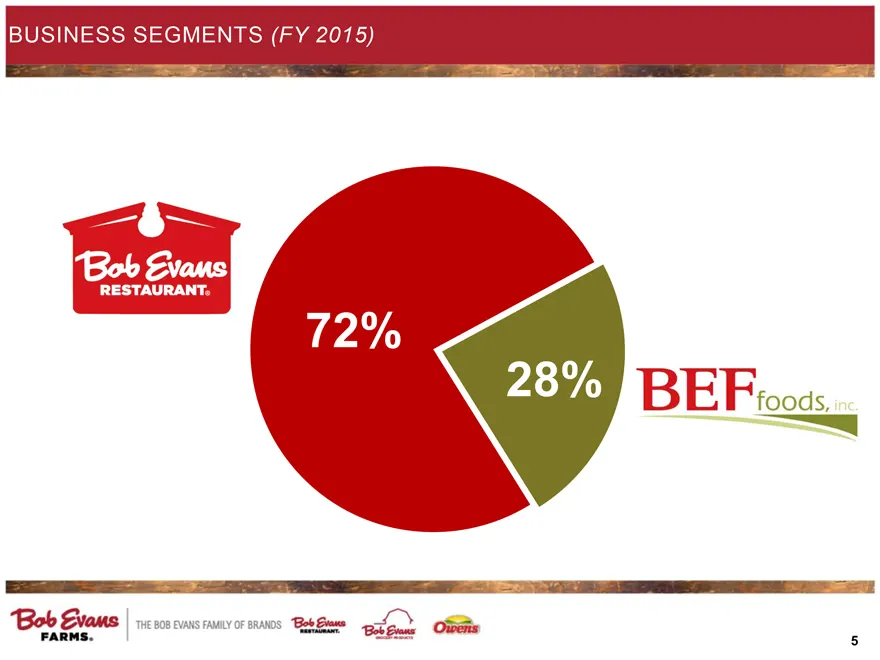
BUSINESS SEGMENTS (FY 2015) Bob Evans RESTAURANT 72% 28% BEF foods, inc.
Slide 6: 2016 Priorities
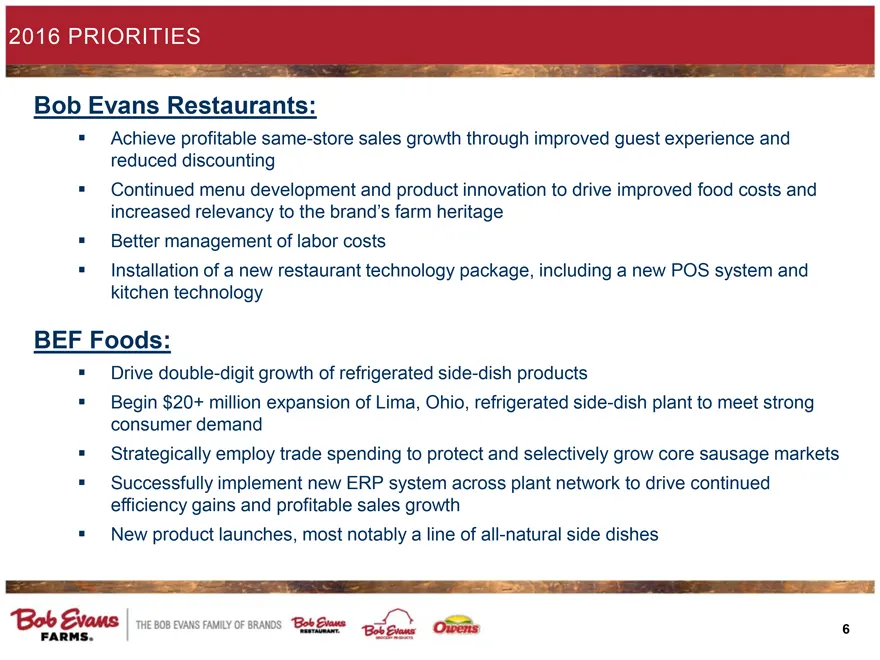
2016 PRIORITIES Bob Evans Restaurants: Achieve profitable same-store sales growth through improved guest experience and reduced discounting Continued menu development and product innovation to drive improved food costs and increased relevancy to the brand’s farm heritage Better management of labor c
Slide 7: 2016 Priorities – (continued)
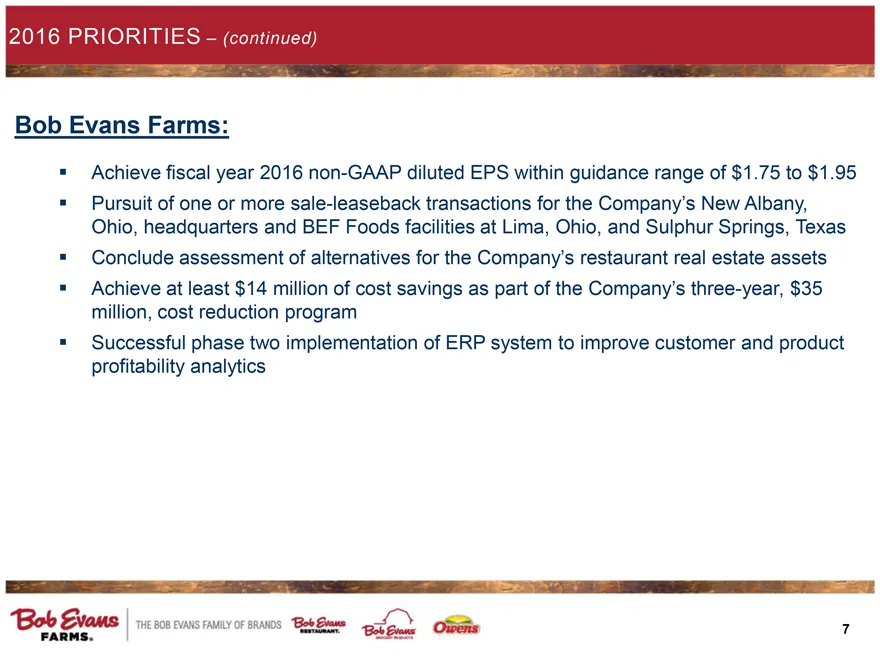
2016 PRIORITIES – (continued) Bob Evans Farms: Achieve fiscal year 2016 non-GAAP diluted EPS within guidance range of $1.75 to $1.95 Pursuit of one or more sale-leaseback transactions for the Company’s New Albany, Ohio, headquarters and BEF Foods facilities at Lima, Ohio, and Sulphur Springs, Texas
Slide 8: Summary of Performance Drivers: Fiscal 2016 Guidance
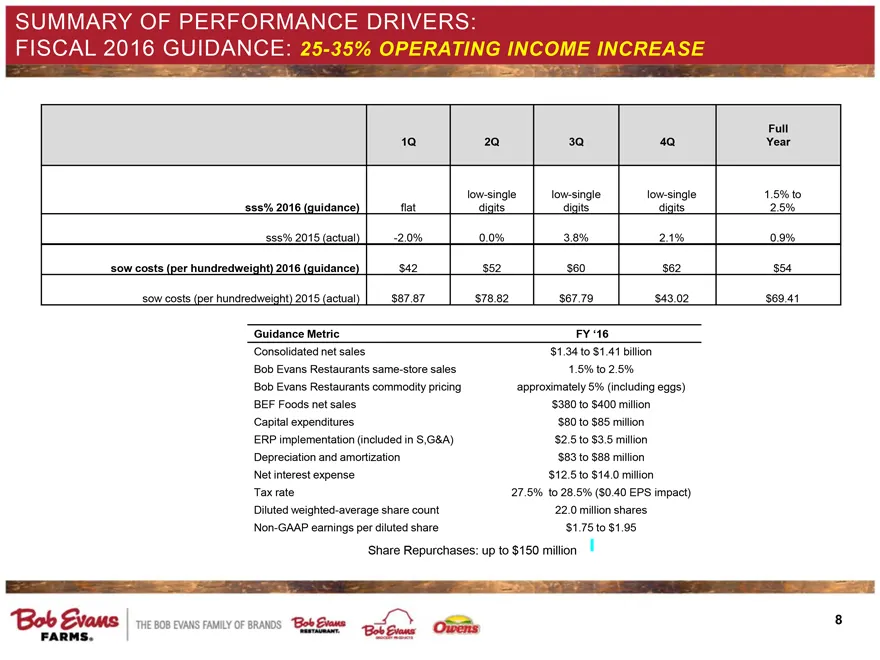
SUMMARY OF PERFORMANCE DRIVERS: FISCAL 2016 GUIDANCE: 25-35% OPERATING INCOME INCREASE 1Q 2Q 3Q 4Q Full Year low-single low-single low-single 1.5% to sss% 2016 (guidance) flat digits digits digits 2.5% sss% 2015 (actual) -2.0% 0.0% 3.8% 2.1% 0.9% sow costs (per hundredweight) 2016 (guidance) $42 $52
Slide 9: Bob Evans Restaurants in States
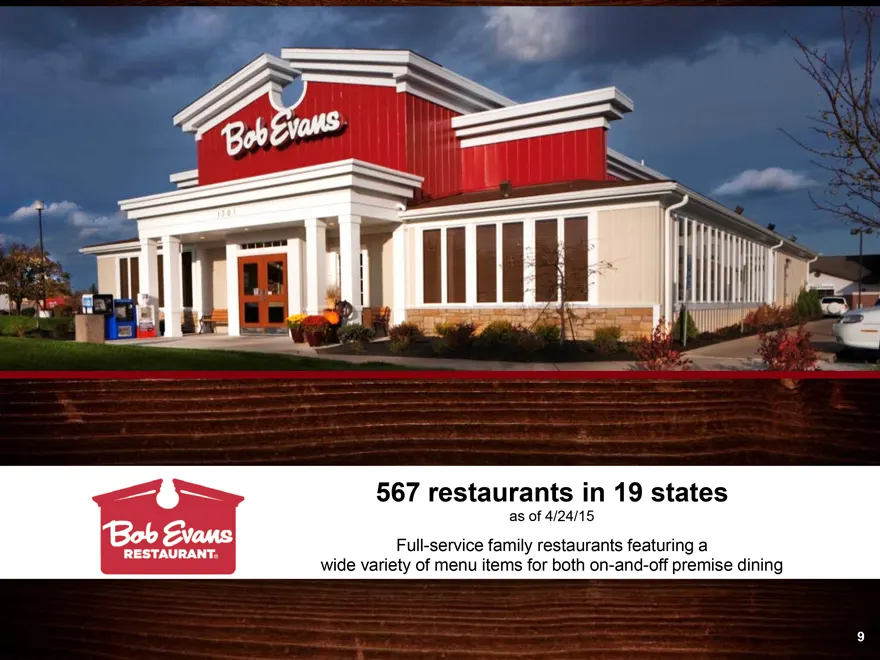
BOB EVANS RESTAURANT 567 restaurants in 19 states as of 4/24/15 Full-service family restaurants featuring a wide variety of menu items for both on-and-off premise dining
Slide 10: Overview: Bob Evans Restaurants
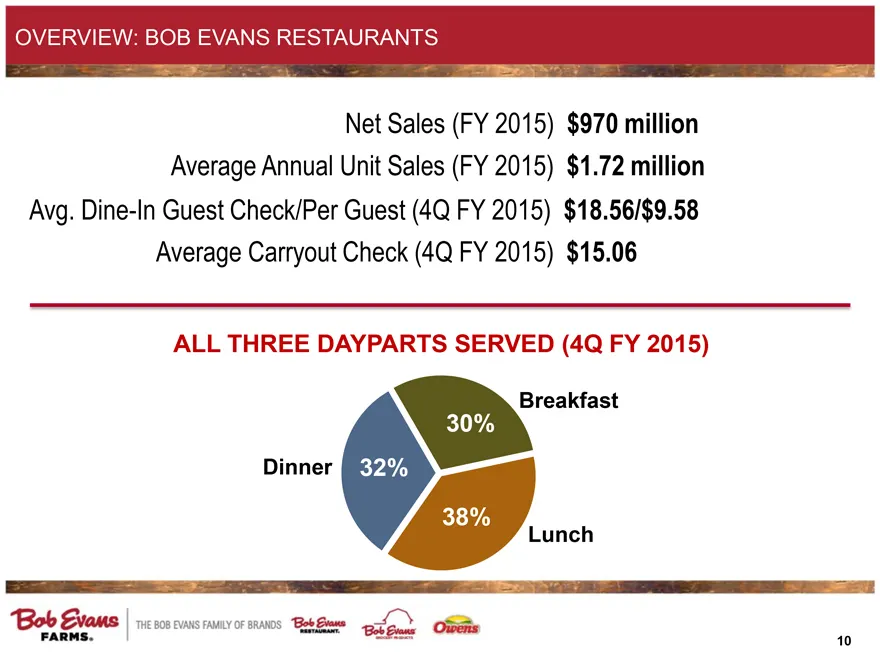
OVERVIEW: BOB EVANS RESTAURANTS Net Sales (FY 2015) $970 million Average Annual Unit Sales (FY 2015) $1.72 million Avg. Dine-In Guest Check/Per Guest (4Q FY 2015) $18.56/$9.58 Average Carryout Check (4Q FY 2015) $15.06 ALL THREE DAYPARTS SERVED (4Q FY 2015) Dinner 32% 30% 38% Breakfast Lunch
Slide 11: Intense Competition and Cautious Consumer Continues in FY16
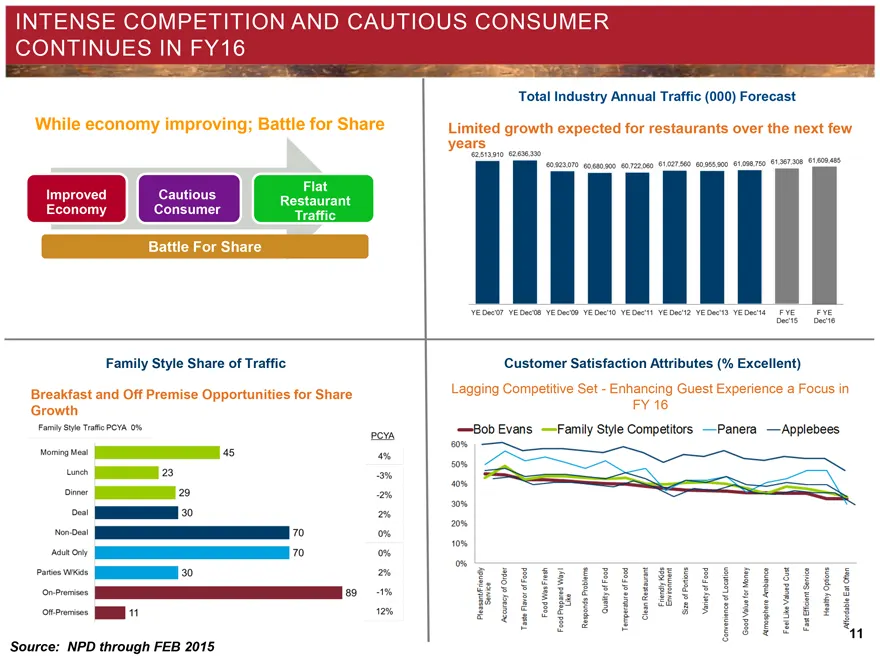
INTENSE COMPETITION AND CAUTIOUS CONSUMER CONTINUES IN FY16 While economy improving; Battle for Share Improved Economy Cautious Consumer Flat Restaurant Traffic Battle For Share Family Style Share of Traffic Breakfast and Off Premise Opportunities for Share Growth Family Style Traffic PCYA 0% PCYA M
Slide 12: FY'16 Turnaround Focus
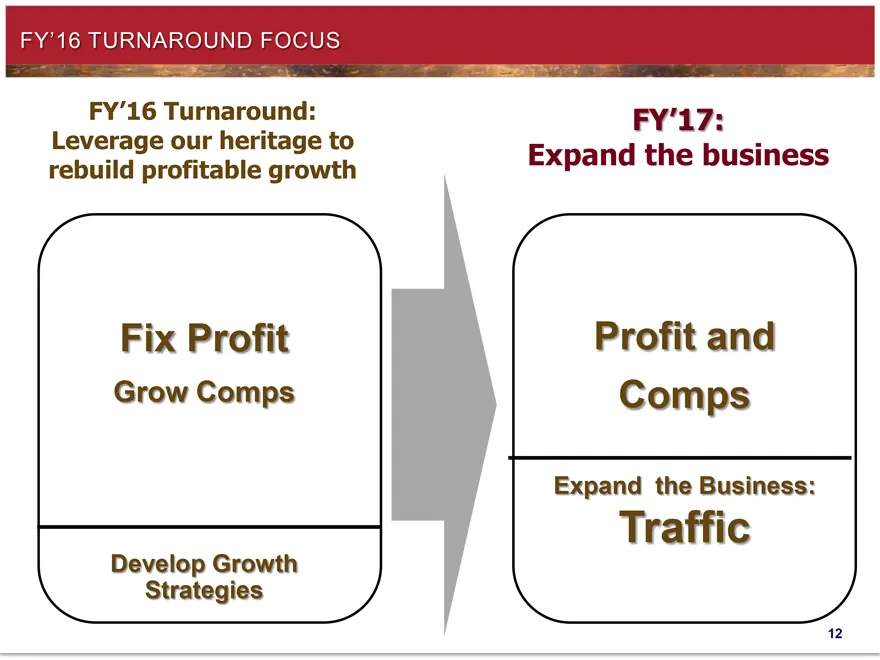
FY’16 TURNAROUND FOCUS FY’16 Turnaround: Leverage our heritage to rebuild profitable growth Fix Profit Grow Comps Develop Growth Strategies FY’17: Expand the business Profit and Comps Expand the Business: Traffic
Slide 13: Quartile Analysis
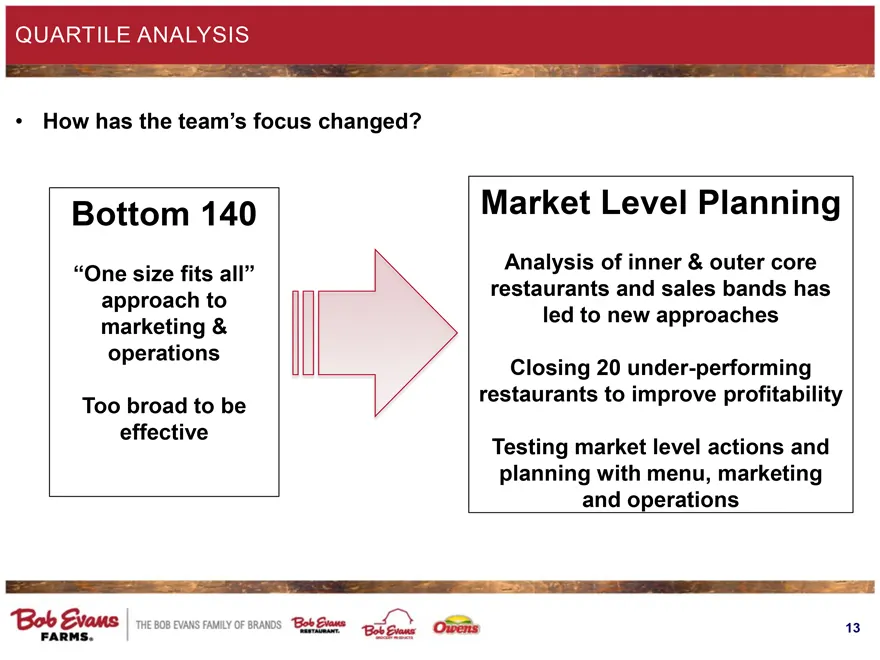
QUARTILE ANALYSIS How has the team’s focus changed? Bottom 140 “One size fits all” approach to marketing & operations Too broad to be effective Market Level Planning Analysis of inner & outer core restaurants and sales bands has led to new approaches Closing 20 under-performing restaurants to improv
Slide 14: Evolving Menu
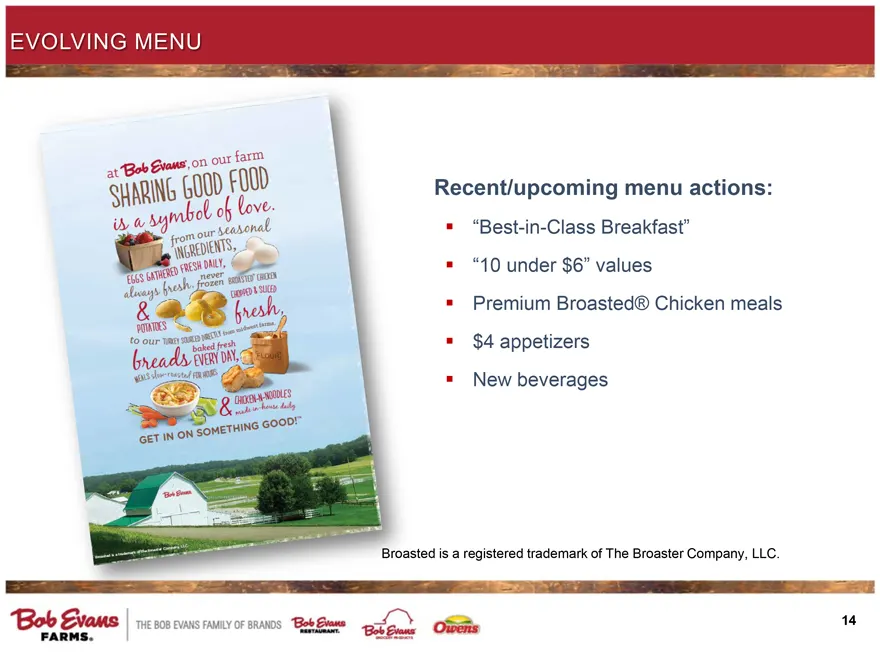
EVOLVING MENU Recent/upcoming menu actions: “Best-in-Class Breakfast” “10 under $6” values Premium Broasted® Chicken meals $4 appetizers New beverages Broasted is a registered trademark of The Broaster Company, LLC.
Slide 15: Build Best-in-Class Breakfast
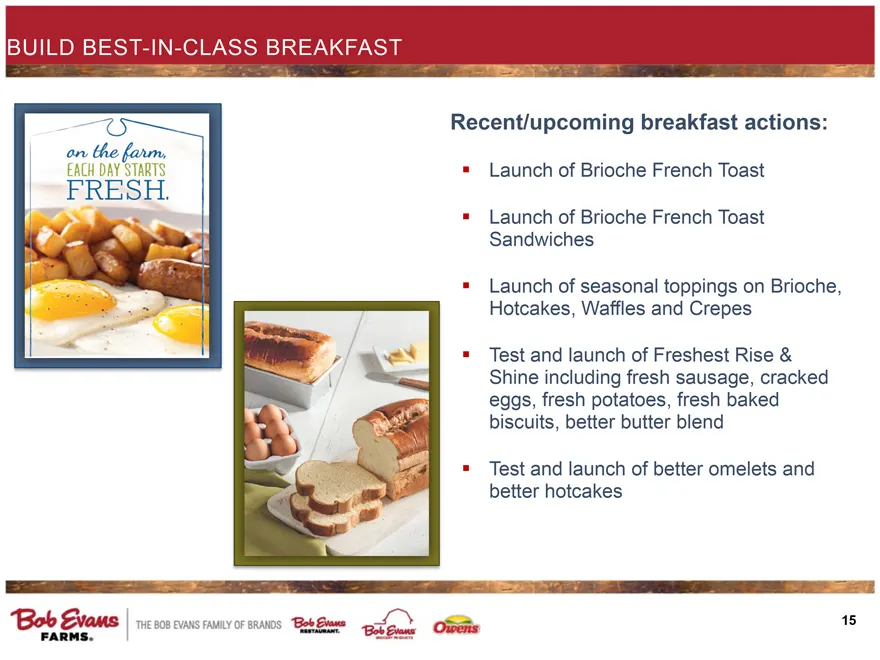
BUILD BEST-IN-CLASS BREAKFAST Recent/upcoming breakfast actions: Launch of Brioche French Toast Launch of Brioche French Toast Sandwiches Launch of seasonal toppings on Brioche, Hotcakes, Waffles and Crepes Test and launch of Freshest Rise & Shine including fresh sausage, cracked eggs, fresh potatoe
Slide 16: Best in Class Breakfast Ratings
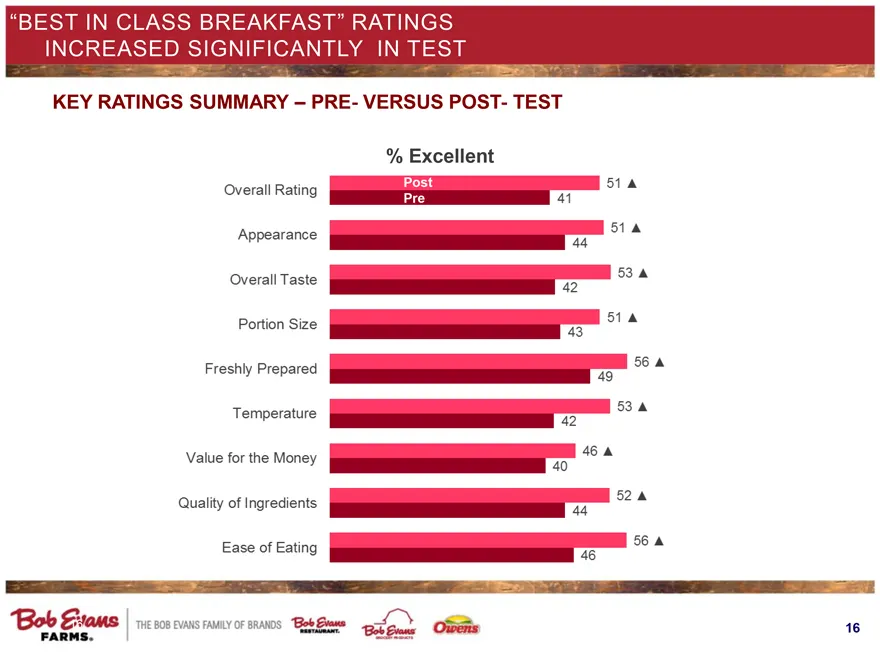
“BEST IN CLASS BREAKFAST” RATINGS INCREASED SIGNIFICANTLY IN TEST KEY RATINGS SUMMARY – PRE- VERSUS POST- TEST % Excellent Overall Rating Post 51 Pre 41 Appearance 51 Overall Taste 53 Portion Size 51 Freshly Prepared 56 Temperature 53 Value for the Money 46 Quality of Ingredients 52 Ease of Eating 5
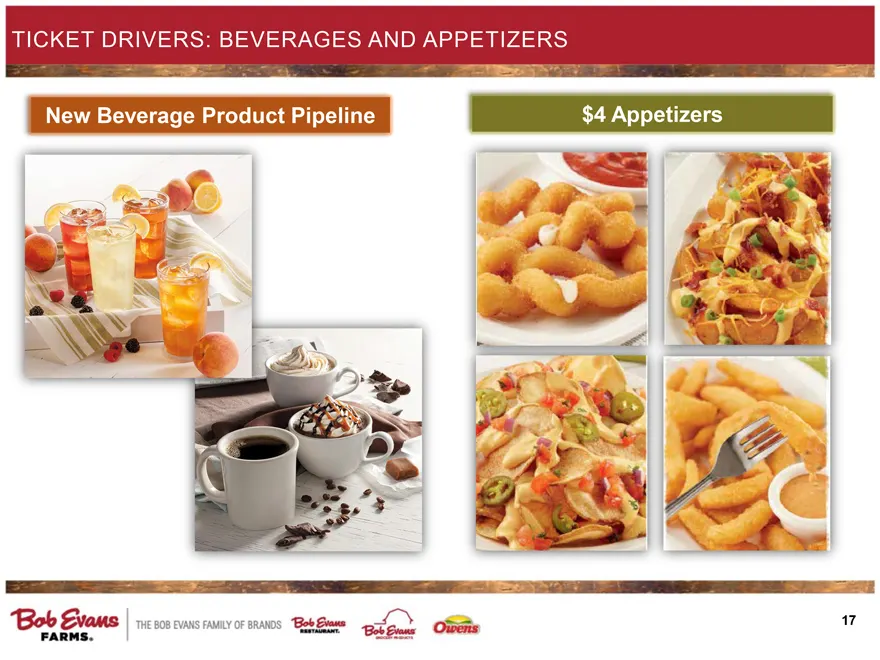
Slide 17: Ticket Drivers: Beverages and Appetizers
TICKET DRIVERS: BEVERAGES AND APPETIZERS New Beverage Product Pipeline $4 Appetizers
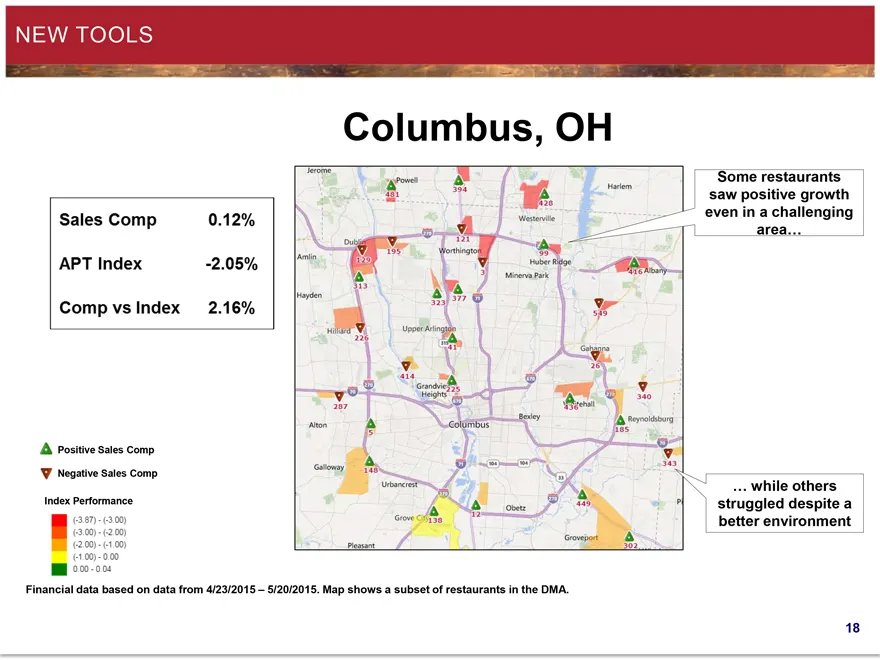
Slide 18: New Tools
NEW TOOLS Sales Comp 0.12% APT Index -2.05% Comp vs Index 2.16% Positive Sales Comp Negative Sales Comp Index Performance (-3.87) - (-3.00) (-3.00) - (-2.00) (-2.00) - (-1.00) (-1.00) - 0.00 0.00 - 0.04 Columbus, OH Some restaurants saw positive growth even in a challenging area… … while others stru
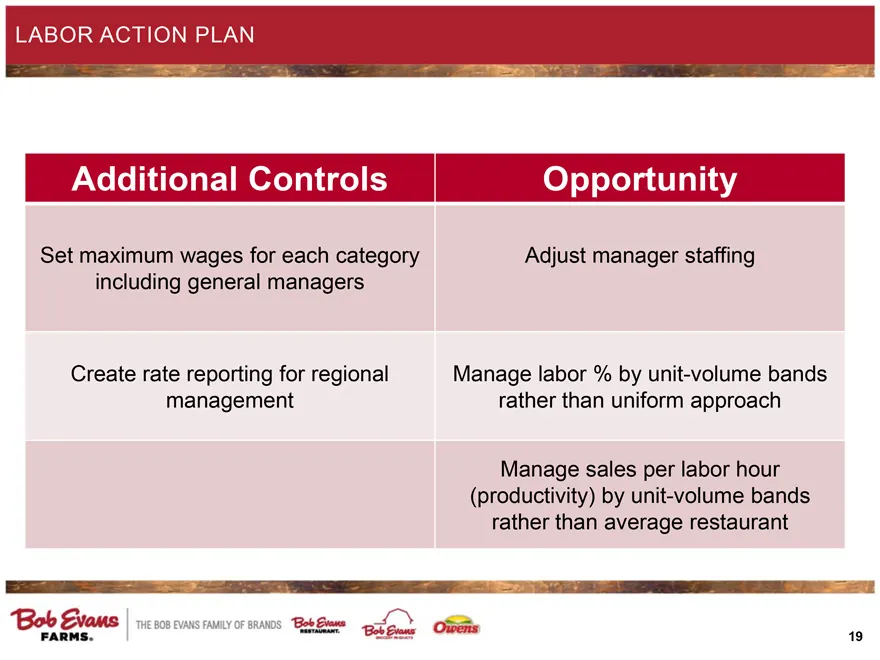
Slide 19: Labor Action Plan
LABOR ACTION PLAN Additional Controls Set maximum wages for each category including general managers Create rate reporting for regional management Opportunity Adjust manager staffing Manage labor % by unit-volume bands rather than uniform approach Manage sales per labor hour (productivity) by unit-v
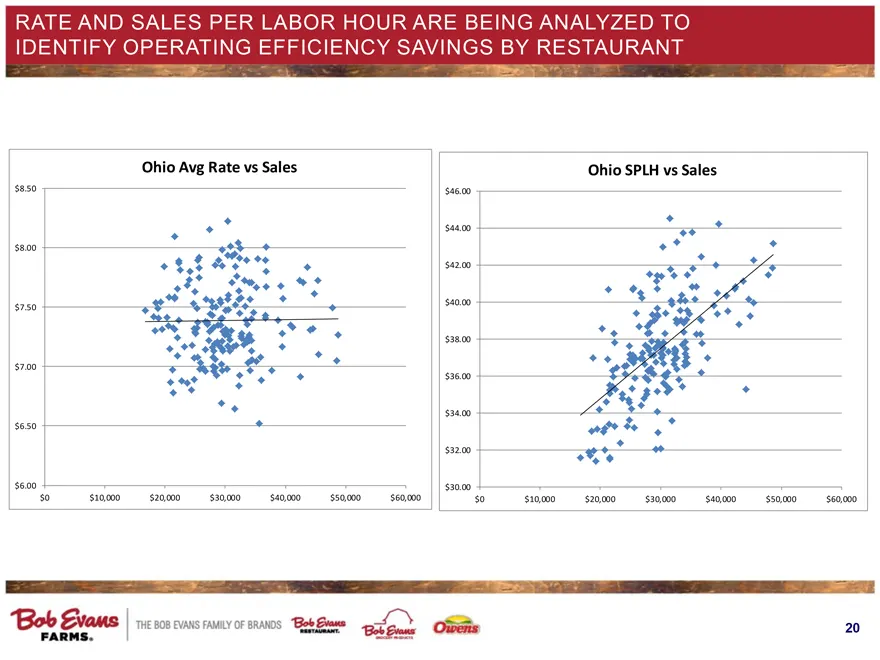
Slide 20: Rate and Sales per Labor Hour Analysis
RATE AND SALES PER LABOR HOUR ARE BEING ANALYZED TO IDENTIFY OPERATING EFFICIENCY SAVINGS BY RESTAURANT Ohio Avg Rate vs Sales $8.50 $8.00 $7.50 $7.00 $6.50 $6.00 $0 $10,000 $20,000 $30,000 $40,000 $50,000 $60,000 Ohio SPLH vs Sales $46.00 $44.00 $42.00 $40.00 $38.00 $36.00 $34.00 $32.00 $30.00 $0 $
Slide 21: Bob Evans and Owens Grocery Products
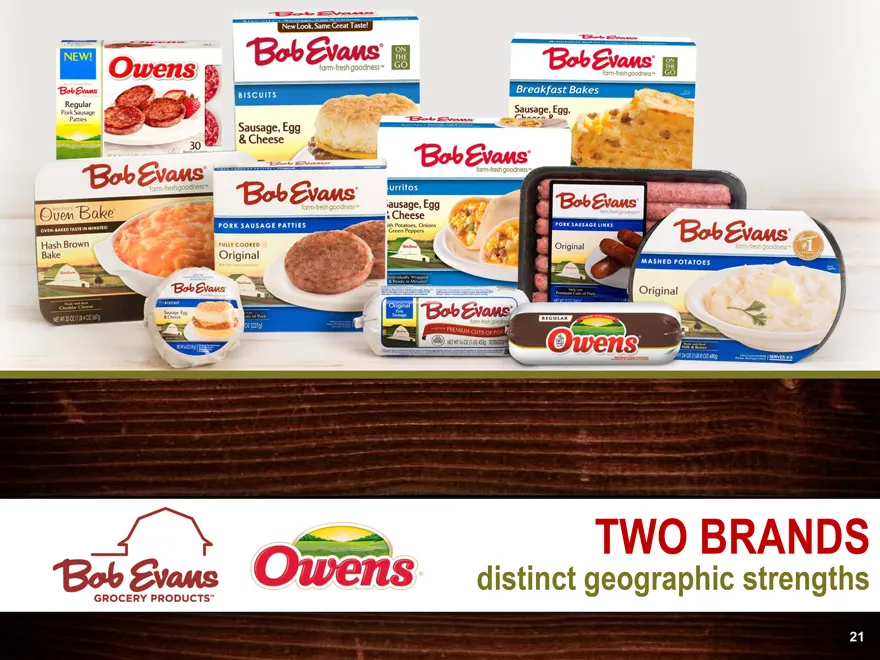
Bob Evans GROCERY PRODUCTS Owens TWO BRANDS distinct geographic strengths
Slide 22: Overview: BEF Foods
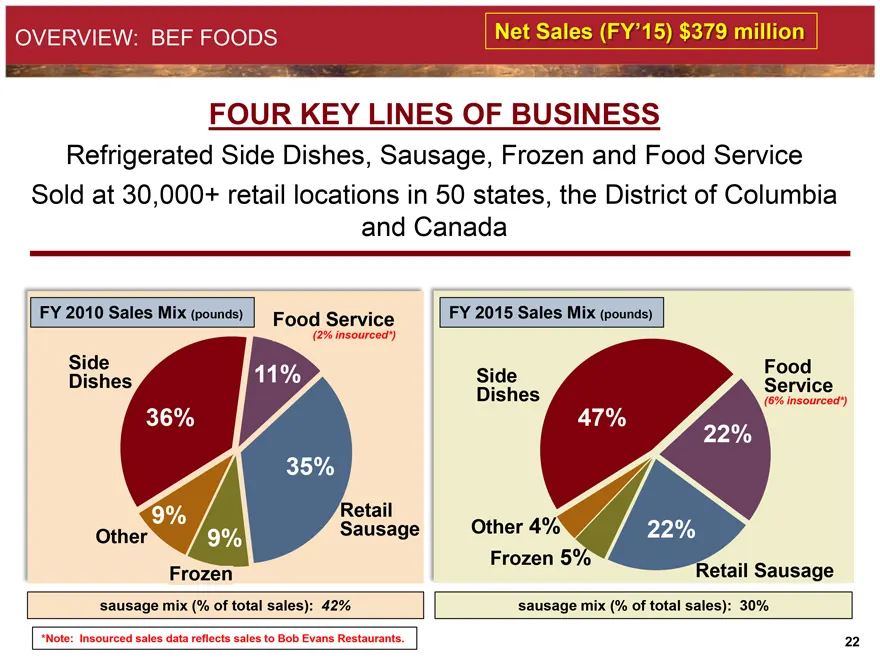
OVERVIEW: BEF FOODS Net Sales (FY’15) $379 million FOUR KEY LINES OF BUSINESS Refrigerated Side Dishes, Sausage, Frozen and Food Service Sold at 30,000+ retail locations in 50 states, the District of Columbia and Canada FY 2010 Sales Mix (pounds) Side Dishes 36% Other 9% Frozen 9% Retail Sausage 35%
Slide 23: The Big Picture Today and Tomorrow
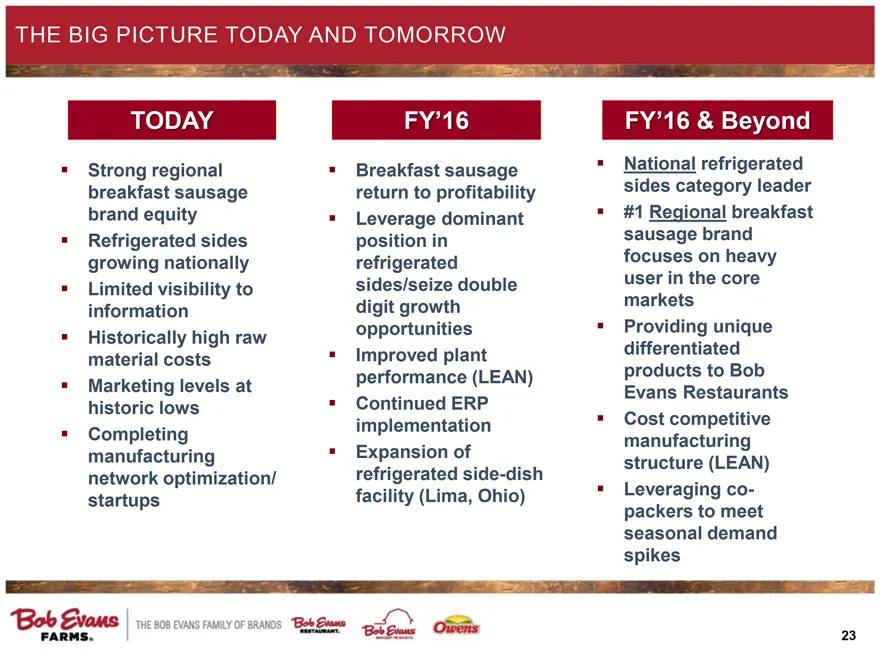
THE BIG PICTURE TODAY AND TOMORROW TODAY Strong regional breakfast sausage brand equity Refrigerated sides growing nationally Limited visibility to information Historically high raw material costs Marketing levels at historic lows Completing manufacturing network optimization/startups FY’16 Breakfas
Slide 24: Bob Evans Foods Business Strategy
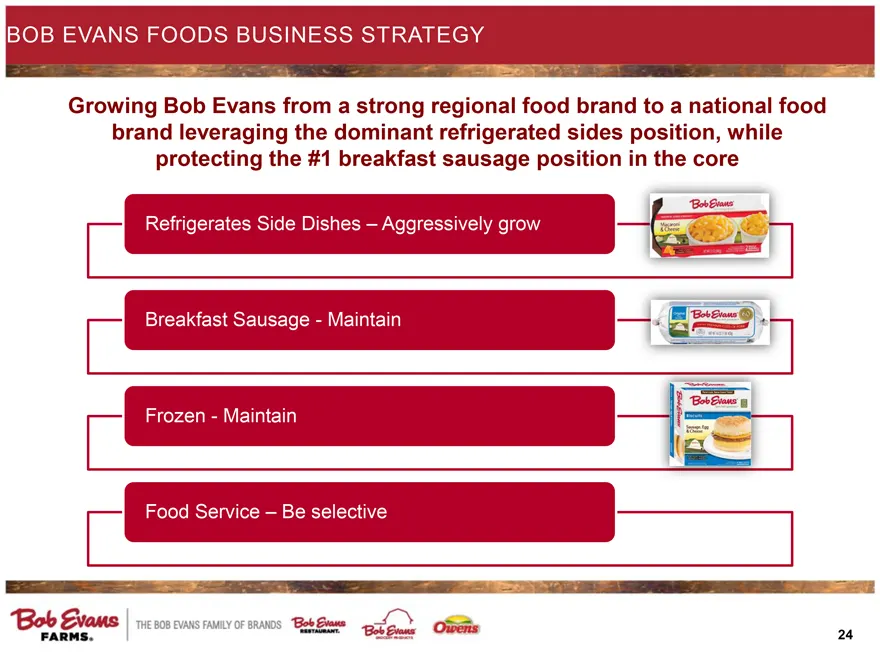
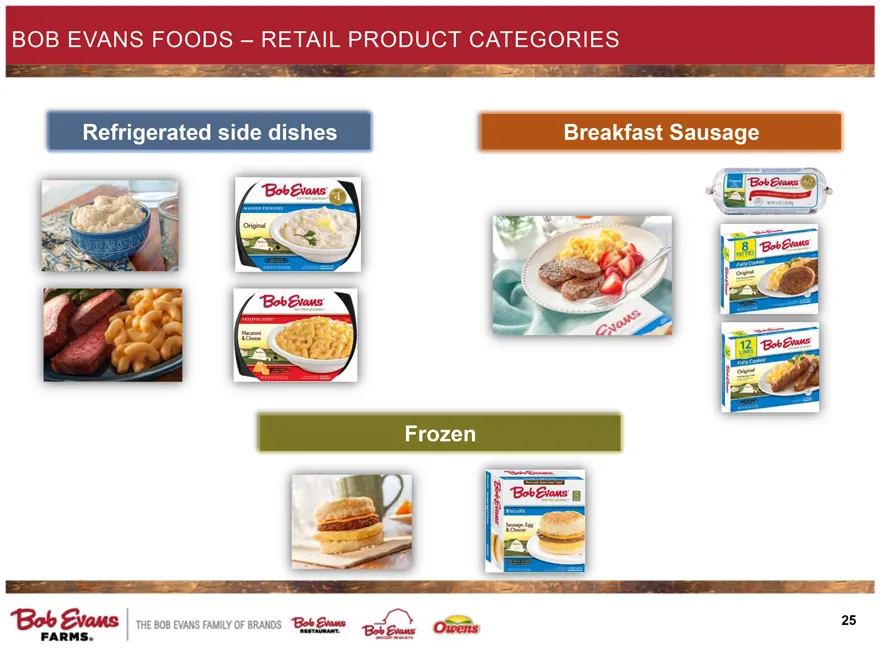
BOB EVANS FOODS BUSINESS STRATEGY Growing Bob Evans from a strong regional food brand to a national food brand leveraging the dominant refrigerated sides position, while protecting the #1 breakfast sausage position in the core Refrigerates Side Dishes – Aggressively grow Breakfast Sausage - Maintain
Slide 25: Bob Evans Foods – Retail Product Categories
BOB EVANS FOODS – RETAIL PRODUCT CATEGORIES Refrigerated side dishes Breakfast Sausage Frozen
Slide 26: Our Sides Uniquely Deliver a Quality Eating Experience
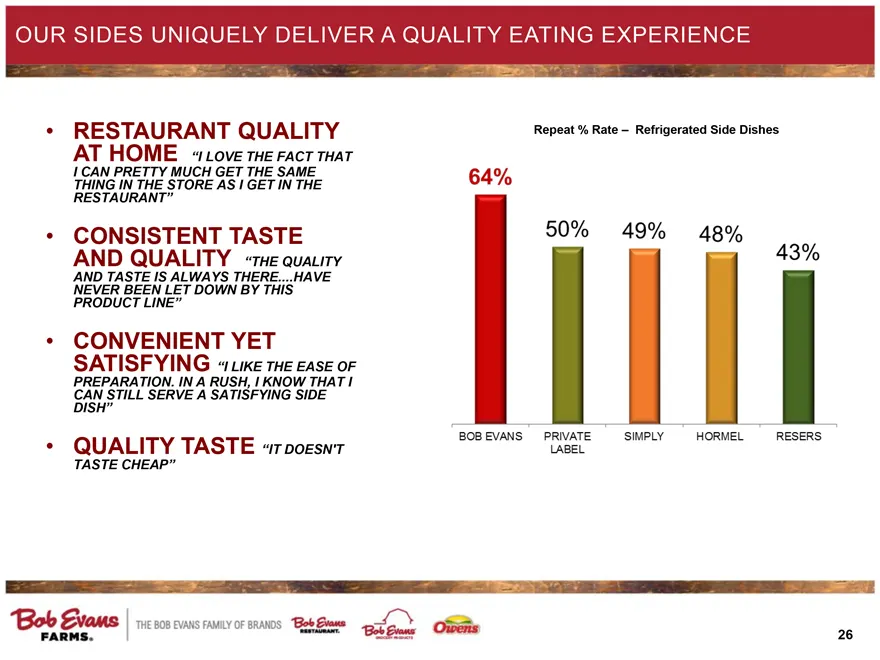
OUR SIDES UNIQUELY DELIVER A QUALITY EATING EXPERIENCE • RESTAURANT QUALITY AT HOME “I LOVE THE FACT THAT I CAN PRETTY MUCH GET THE SAME THING IN THE STORE AS I GET IN THE RESTAURANT” • CONSISTENT TASTE AND QUALITY “THE QUALITY AND TASTE IS ALWAYS THERE.…HAVE NEVER BEEN LET DOWN BY THIS PRODUCT LINE
Slide 27: And the Proof Is with Consumers at the Shelf
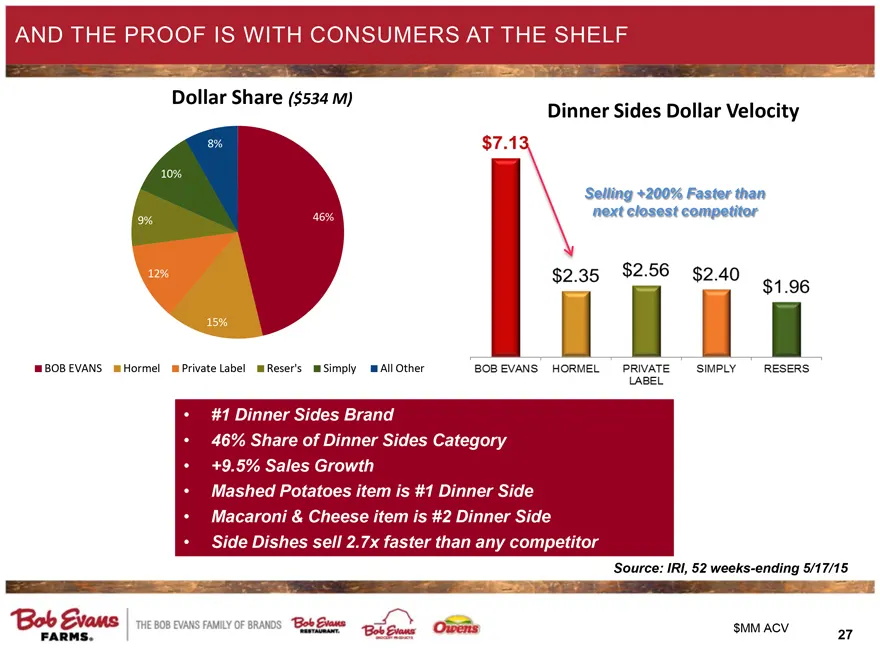
AND THE PROOF IS WITH CONSUMERS AT THE SHELF Dollar Share ($534 M) 8% 10% 9% 12% 15% 46% BOB EVANS Hormel Private Label Reser’s Simply All Other Dinner Sides Dollar Velocity $7.13 Selling +200% Faster than next closest competitor $2.35 $2.56 $2.40 $1.96 BOB EVANS HORMEL PRIVATE LABEL SIMPLY RESERS •
Slide 28: Appendix
Appendix
Slide 29: Fourth-Quarter Fiscal 2015 Same Store Sales Summary
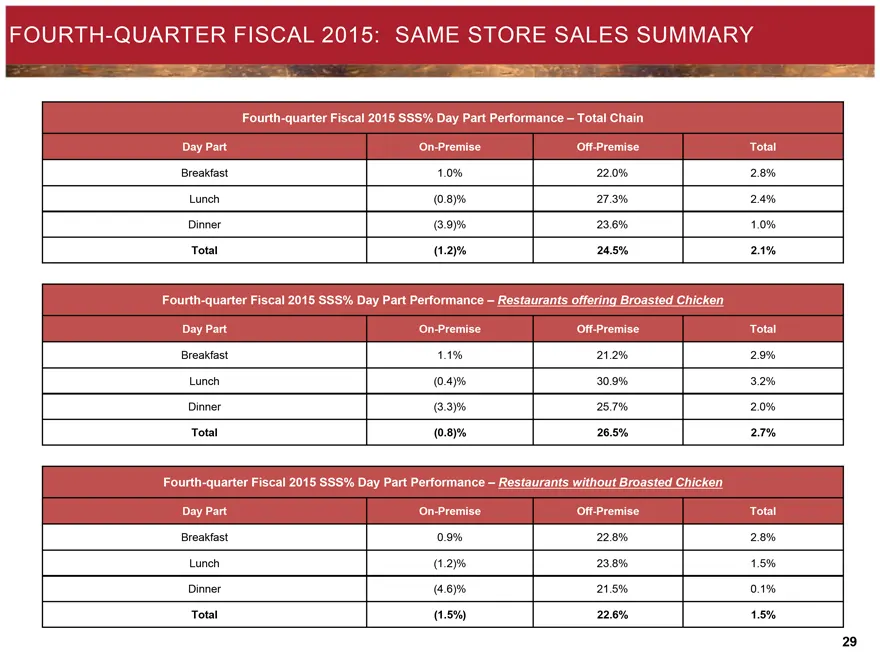
FOURTH-QUARTER FISCAL 2015: SAME STORE SALES SUMMARY Fourth-quarter Fiscal 2015 SSS% Day Part Performance – Total Chain Day Part On-Premise Off-Premise Total Breakfast 1.0% 22.0% 2.8% Lunch (0.8)% 27.3% 2.4% Dinner (3.9)% 23.6% 1.0% Total (1.2)% 24.5% 2.1% Fourth-quarter Fiscal 2015 SSS% Day Part Pe
Slide 30: Off-Premises Sales Layers
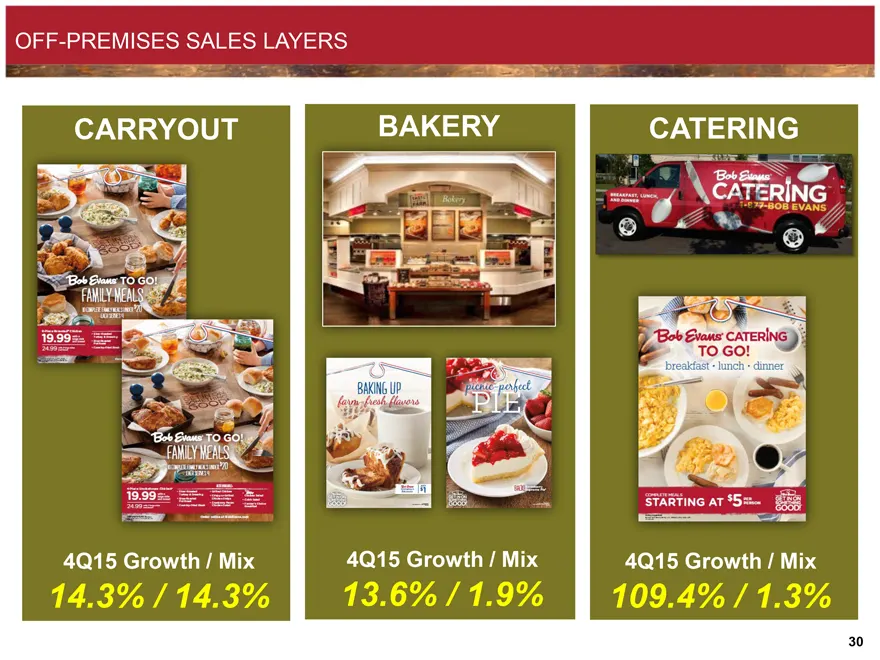
OFF-PREMISES SALES LAYERS CARRYOUT 4Q15 Growth / Mix 14.3% / 14.3% BAKERY 4Q15 Growth / Mix 13.6% / 1.9% CATERING 4Q15 Growth / Mix 109.4% / 1.3%
Slide 31: BEF Foods Inc. Network Optimization
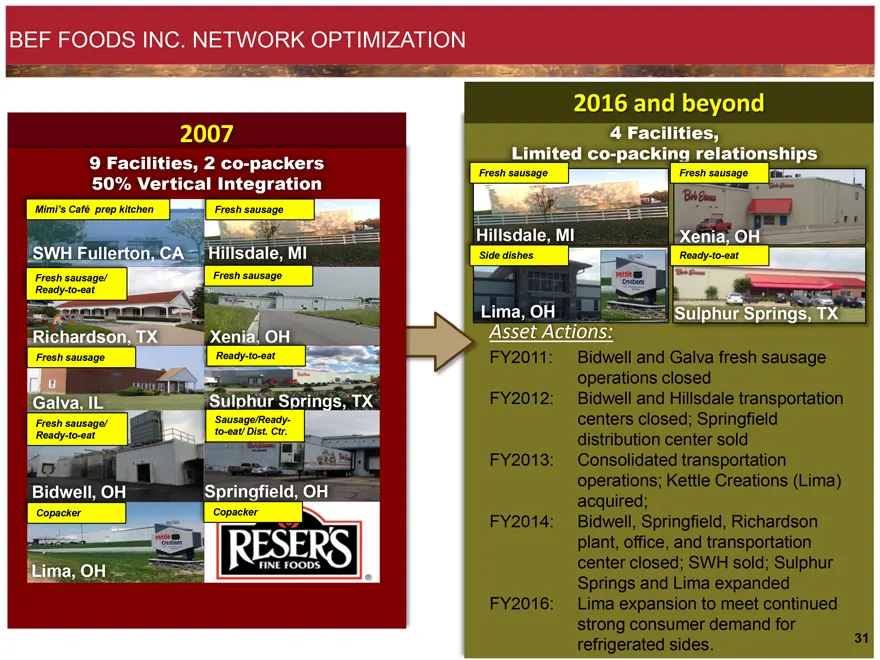
BEF FOODS INC. NETWORK OPTIMIZATION 9 Facilities, 2 co-packers 50% Vertical Integration Mimi’s Café prep kitchen Fresh sausage SWH Fullerton, CA Hillsdale, MI Fresh sausage/Ready-to-eat Fresh sausage Richardson, TX Xenia, OH Fresh sausage Ready-to-eat Galva, IL Sulphur Springs, TX Fresh sausage/Read
Slide 32: Historical and Forecasted Sow Cost Pricing
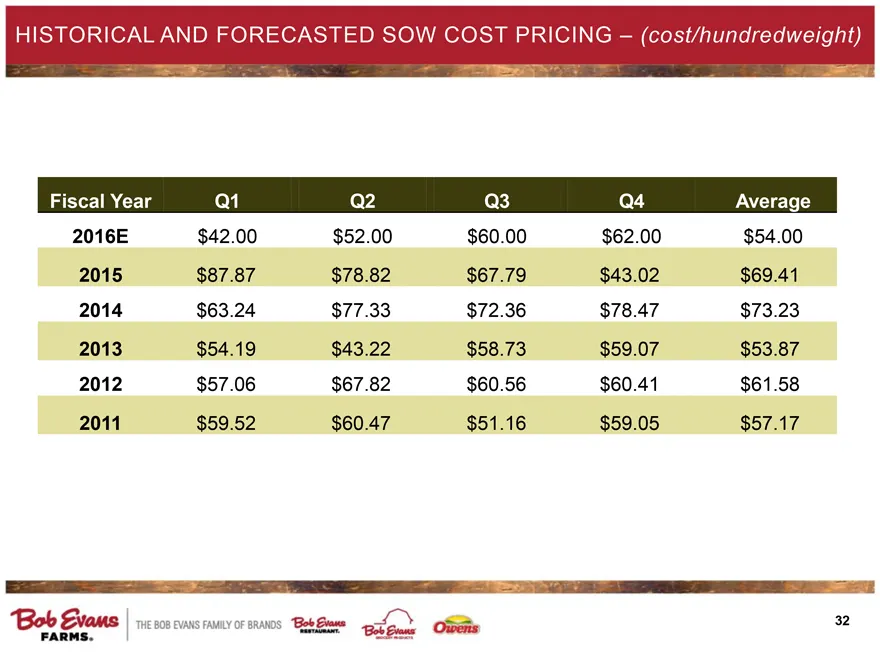
HISTORICAL AND FORECASTED SOW COST PRICING – (cost/hundredweight) Fiscal Year Q1 Q2 Q3 Q4 Average 2016E $42.00 $52.00 $60.00 $62.00 $54.00 2015 $87.87 $78.82 $67.79 $43.02 $69.41 2014 $63.24 $77.33 $72.36 $78.47 $73.23 2013 $54.19 $43.22 $58.73 $59.07 $53.87 $57.06 $67.82 $60.56 $60.41 $61.58 2011 $
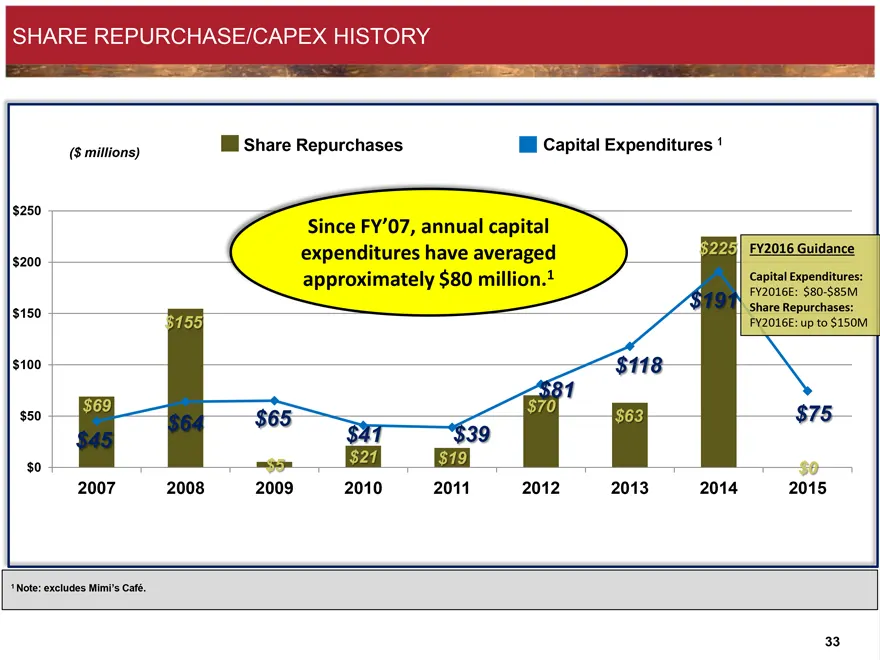
Slide 33: Share Repurchase/Capex History
SHARE REPURCHASE/CAPEX HISTORY ($ millions) Share Repurchases Capital Expenditures 1 $250 $200 $150 $100 $50 $0 Since FY’07, annual capital expenditures have averaged approximately $80 million.1 $69 $45 $155 $64 $65 $5 $41 $21 $39 $19 $81 $70 $118 $63 $225 $191 $75 $0 2007 2008 2009 2010 2011 2012 2
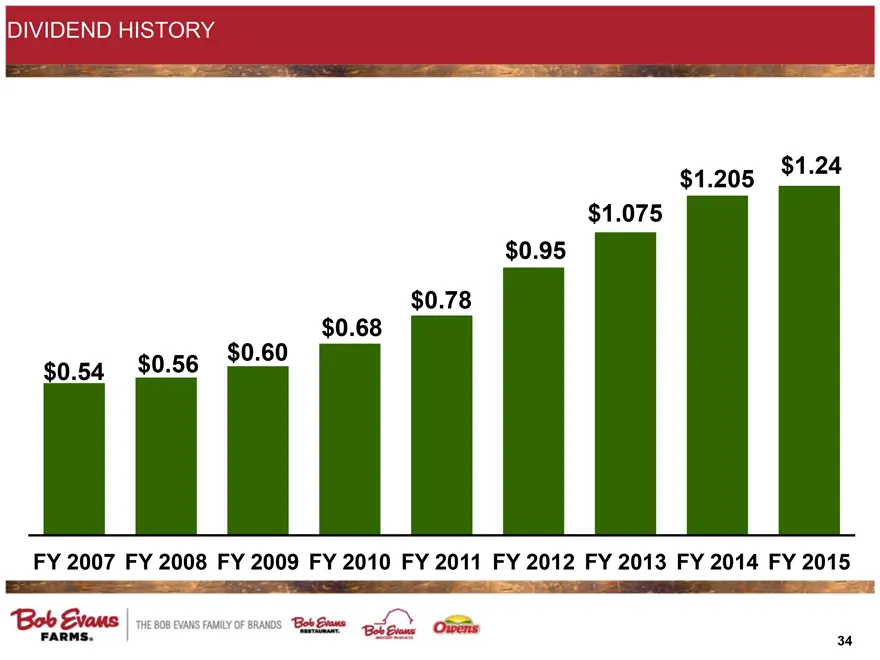
Slide 34: Dividend History
DIVIDEND HISTORY $1.24 $1.205 $1.075 $0.95 $0.78 $0.68 $0.60 $0.56 $0.54 FY 2007 FY 2008 FY 2009 FY 2010 FY 2011 FY 2012 FY 2013 FY 2014 FY 2015
Source: SEC EDGAR · 8-K filed Jun 24, 2015
More decks from Bob Evans Farms Inc
 Merger or Acquisition (September 2017)18 slides · Sep 28, 2017
 Merger or Acquisition (September 2017)12 slides · Sep 19, 2017
 Merger or Acquisition (September 2017)17 slides · Sep 19, 2017
 Merger or Acquisition (September 2017)10 slides · Sep 19, 2017
 Investor Presentation (September 2017)32 slides · Sep 14, 2017
 Investor Presentation (June 2017)30 slides · Jun 15, 2017