Westmoreland Coal — BB&T Capital Markets: St. Louis Coal Summit 2015
21 slides from Westmoreland Coal's conference presentation, Aug 17, 2015
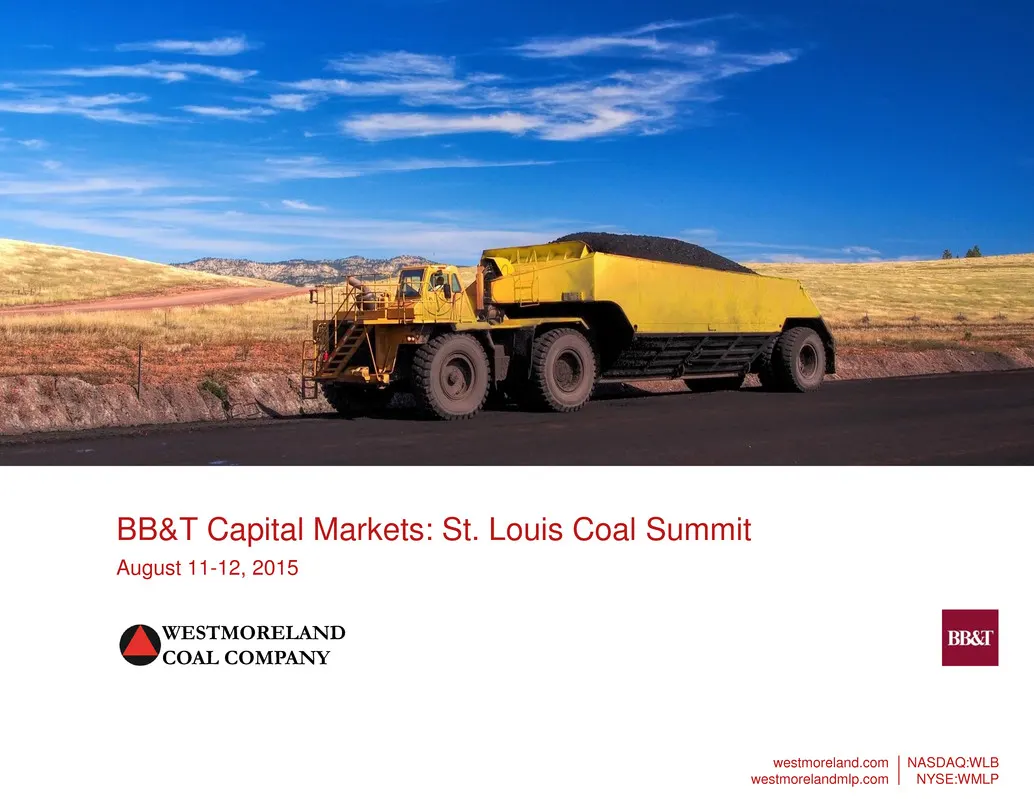
Slide 1: BB&T Capital Markets: St. Louis Coal Summit
BB&T Capital Markets: St. Louis Coal Summit August 11-12, 2015 WESTMORELAND BB&T COAL COMPANY westmoreland.com | NASDAQ:WLB westmorelandmip.com | NYSE:WMLP
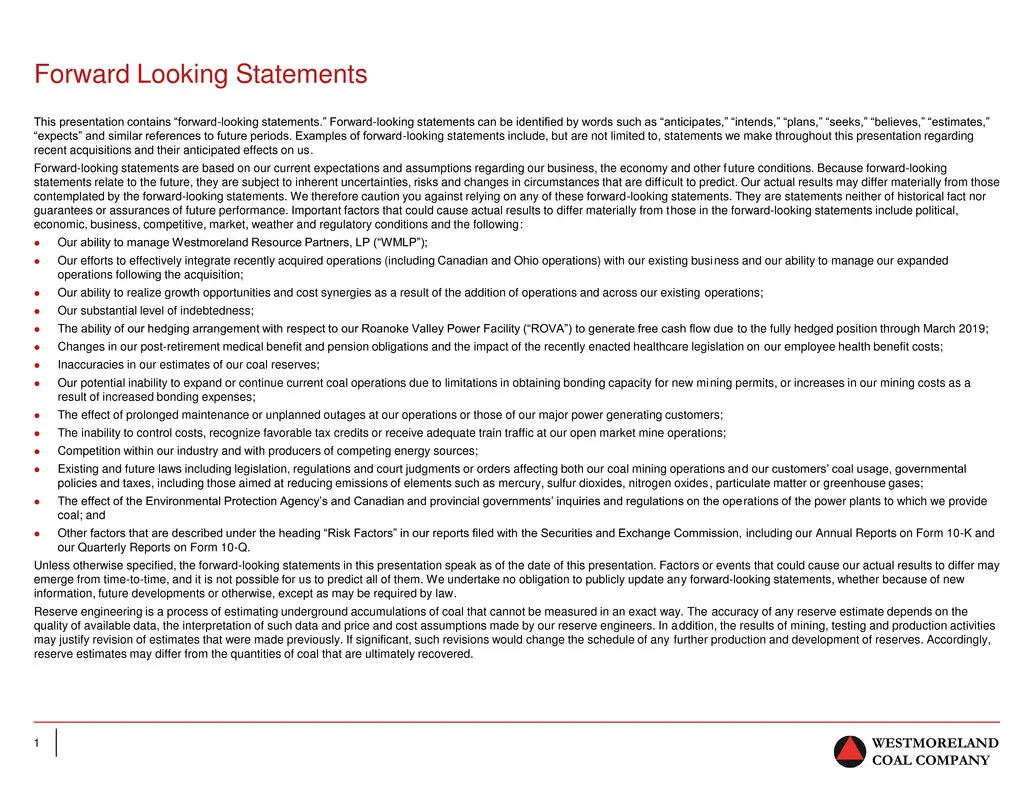
Slide 2: Forward Looking Statements
Forward Looking Statements - if “anticipates,” “intends,” “plans,” “seeks,” “believes,” “estimates,” “expects” recent acquisitions and their anticipated effects on us. i tit Ket, '* Our ability to manage Westmoreland Resource Partners, LP (‘WMLP” operations following the acquisitior ‘+ Our substanti
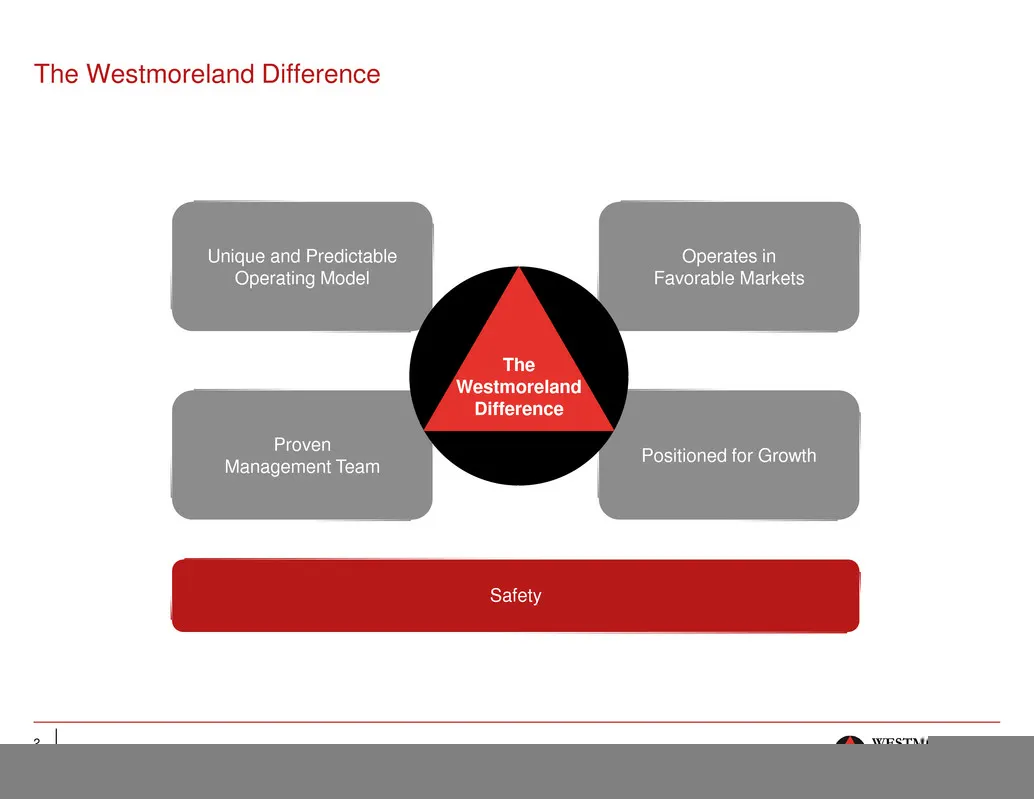
Slide 3: The Westmoreland Difference
The Westmoreland Difference Unique and Predictable Operating Model Favorable Markets Positioned for Growth Proven Management Team
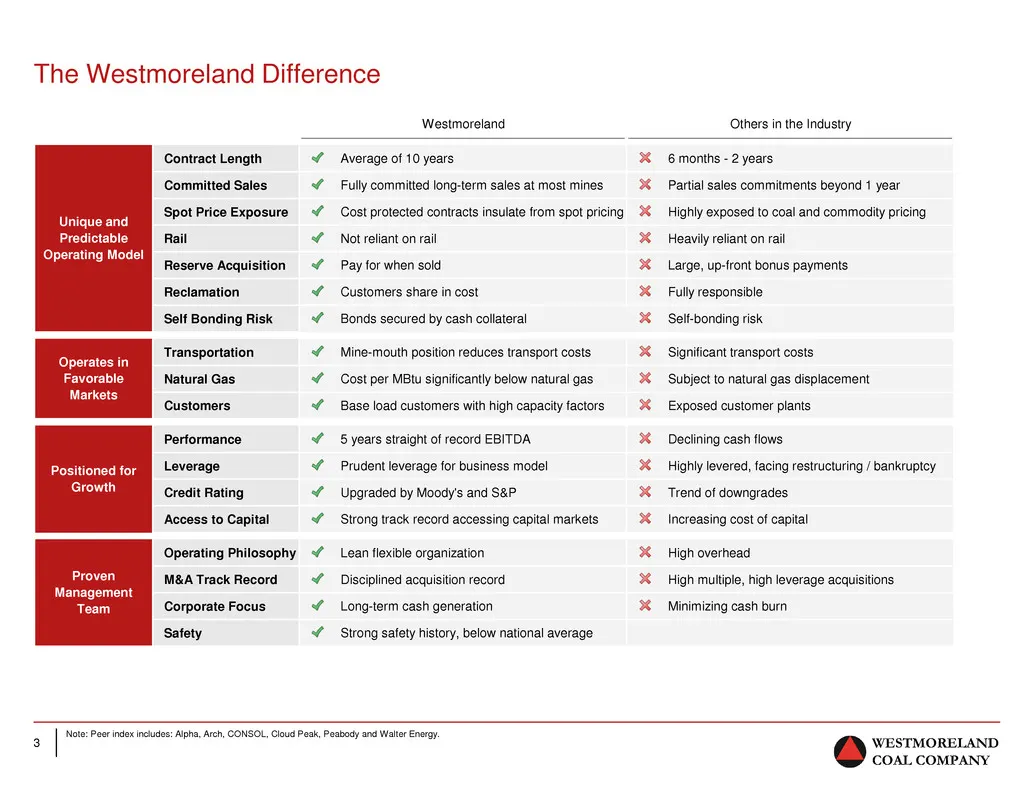
Slide 4: The Westmoreland Difference
The Westmoreland Difference Westmoreland Others in the Industry Unique and Predictable Operating Model Operates in Customers Performance Positioned for [iA Grows Credit Rating Contract Length ‘Average of 10 years 6 months - 2 years i 1 year pot Price Exp Pot pr Not reliant on rail Heavily reliant on
Slide 5: Recent Accomplishments
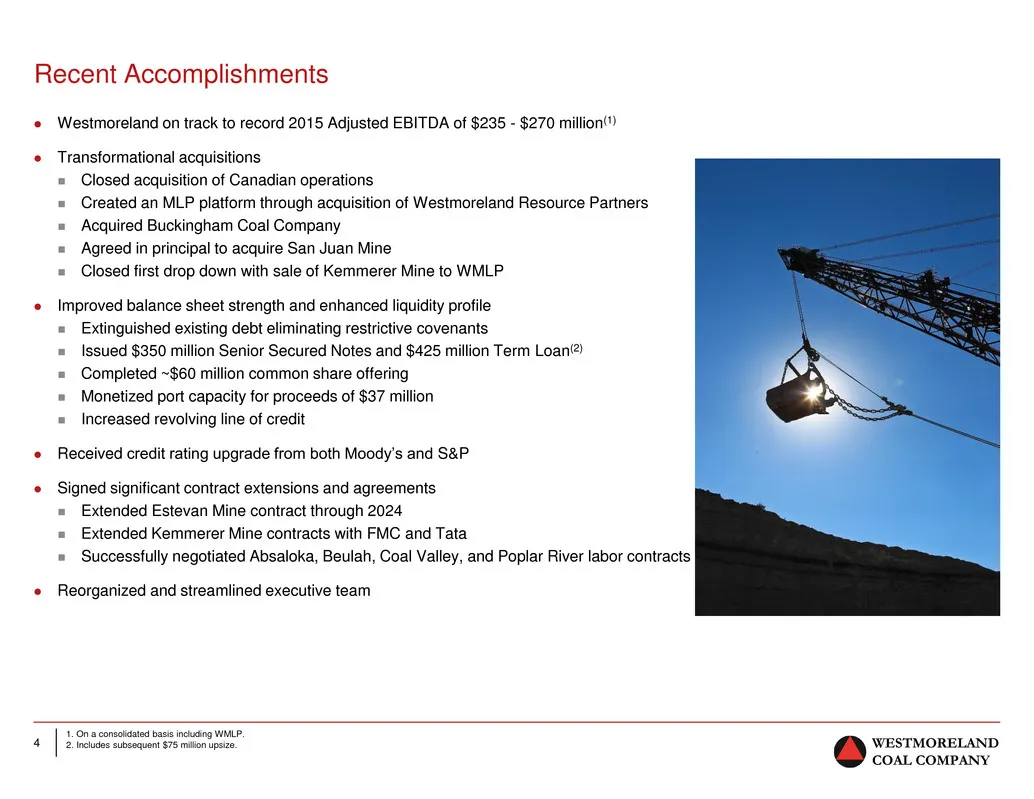
Recent Accomplishments Westmoreland on track to record 2015 Adjusted EBITDA of $235 - $270 million‘) © Transformational acquisitions = Closed acquisition of Canadian operations = Created an MLP platform nes = of Westmoreland Resource Partners Acquired Buckingham Coal Com Agreed in principal to acqui
Slide 6: Building a Diversified North American Coal Leader
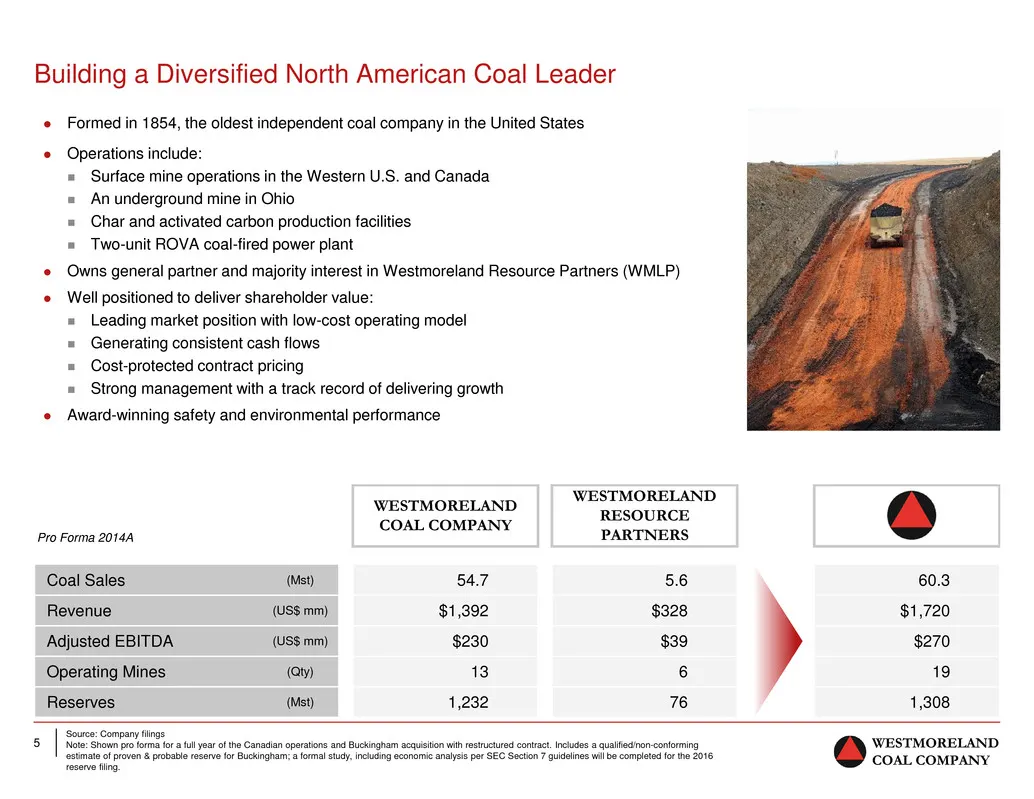
Building a Diversified North American Coal Leader . © Operations include: = Surface mine operations in the Western U.S. and Canada = Anunderground mine in Ohio = Char and activated carbon production facilities = Two-unit ROVA coal-fired power plant Formed in 1854, the oldest independent coal company
Slide 7: Two Ways to Invest in Westmoreland Coal
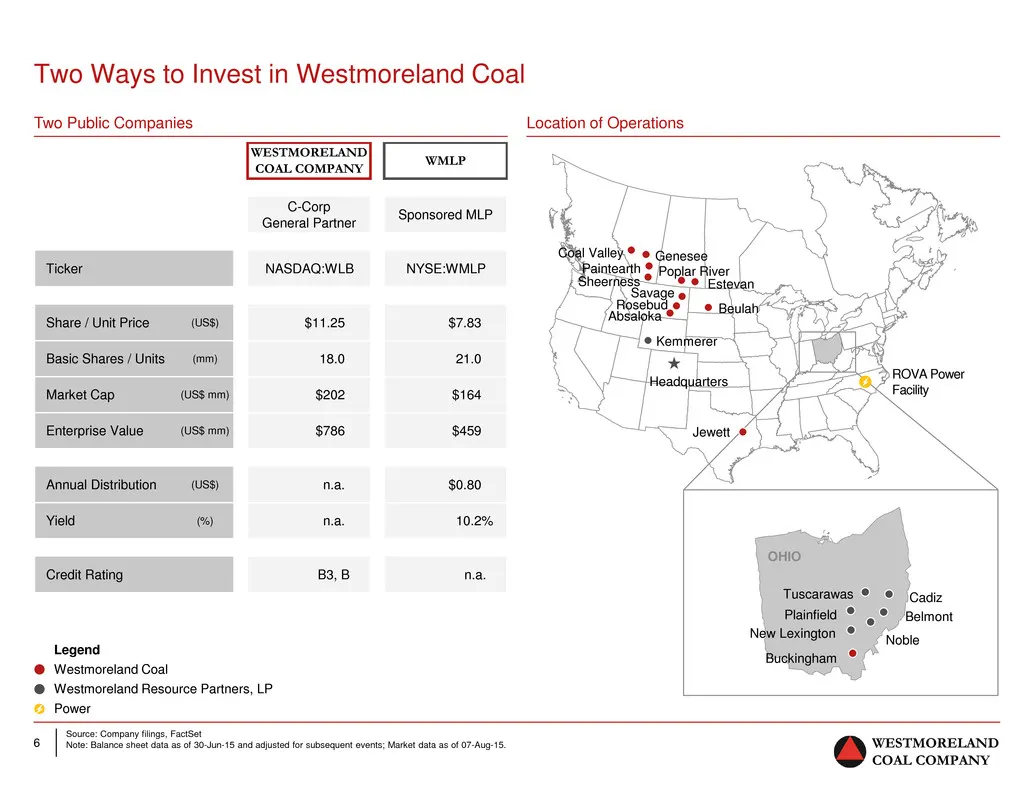
Two Ways to Invest in Westmoreland Coal Two Public Companies Location of Operations = €-Corp General Partner SPonsored MLP t NASDAG:WLB NYSEWMLP $11.25 $7.83 18.0 21.0 ROVA Power X Facility na. 10.2% is 8 ¢ 2 Legend @ Westmoreland Coal @ Westmoreland ae Partners, LP © Pe ‘Source: Company tings, Fact
Slide 8: Unique and Predictable Operating Model
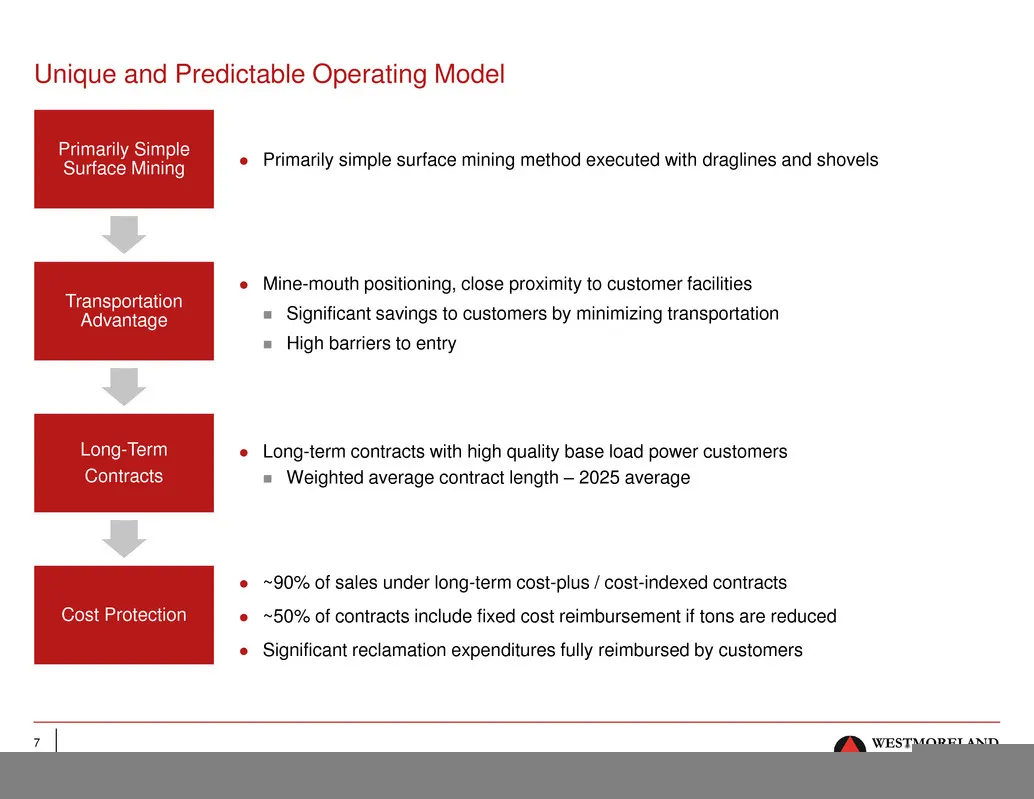
Unique and Predictable Operating Model Primarily Simple Surface Mining Transportation Advantage Long-Term Contracts Cost Protection Primarily simple surface mining method executed with draglines and shovels Mine-mouth positioning, close proximity to customer facilities = Significant savings to custo
Slide 9: Long-Term Cost-Protected Contracts Provide Stable Predictable Cash Flows
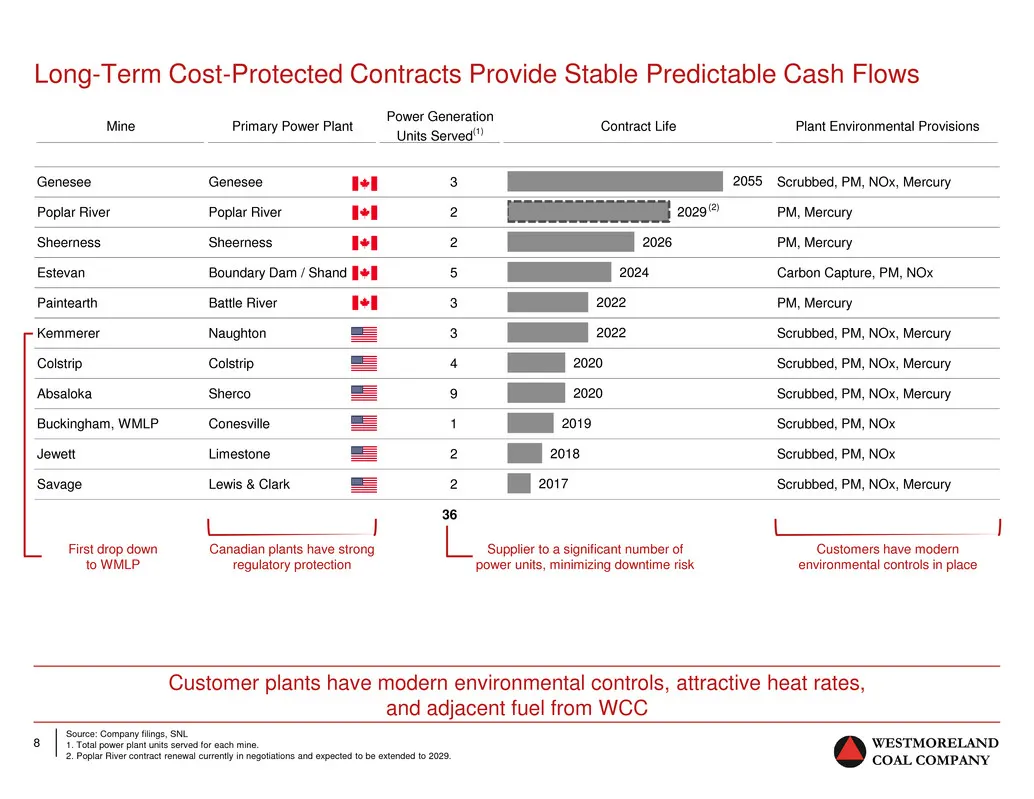
Long-Term Cost-Protected Contracts Provide Stable Predictable Cash Flows Mine Primary Power Plant Bieteuetg Contract Life Plant Environmental Provisions Genesee Genesee BI 3 (III, 2055 scrubbed, PM, NOx, Mercury Poplar River Poplar River ie 2 DA 2022” PM, Mercury ‘Sheerness Sheerness bl 2 EN 2025 PM
Slide 10: Proximity to Captive Customer Base with Export Opportunity
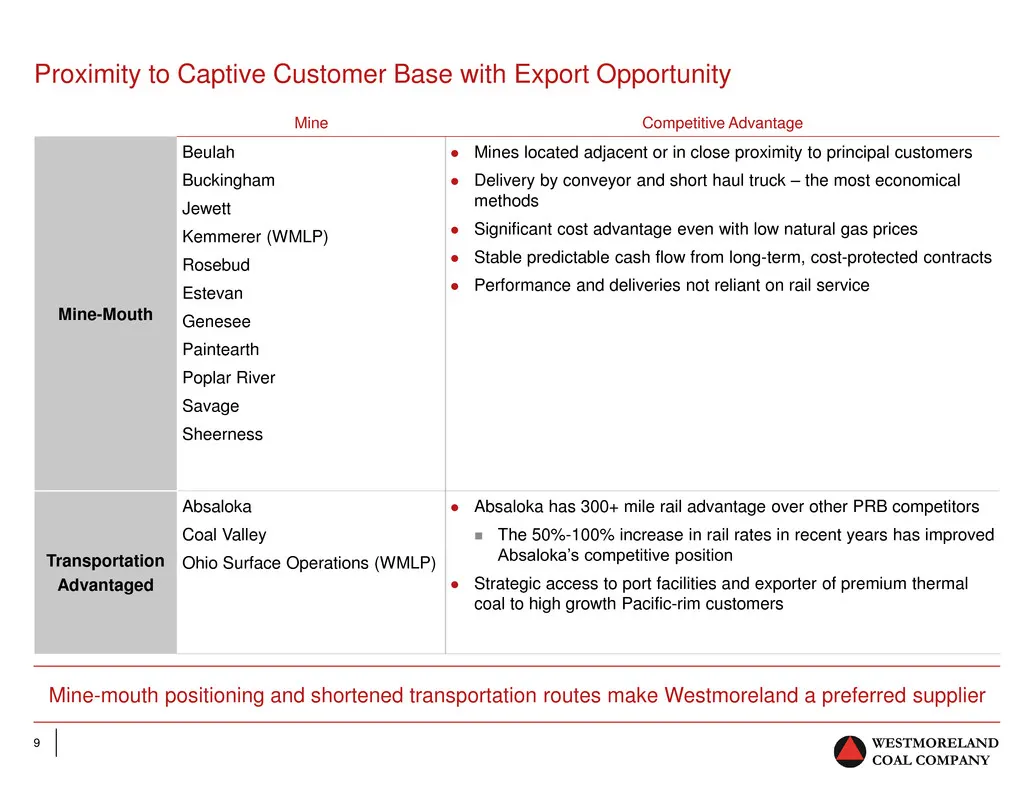
Proximity to Captive Customer Base with Export Opportunity Mine Competitive Advantage Beulah ‘Mines located adjacent or in close proximity to principal customers Buckingham Delivery by conveyor and short haul truck — the most economical Jewett methods Kemmerer (WMLP) e Significant cost advantage eve
Slide 11: Coal is the Primary Fuel in the Markets Served
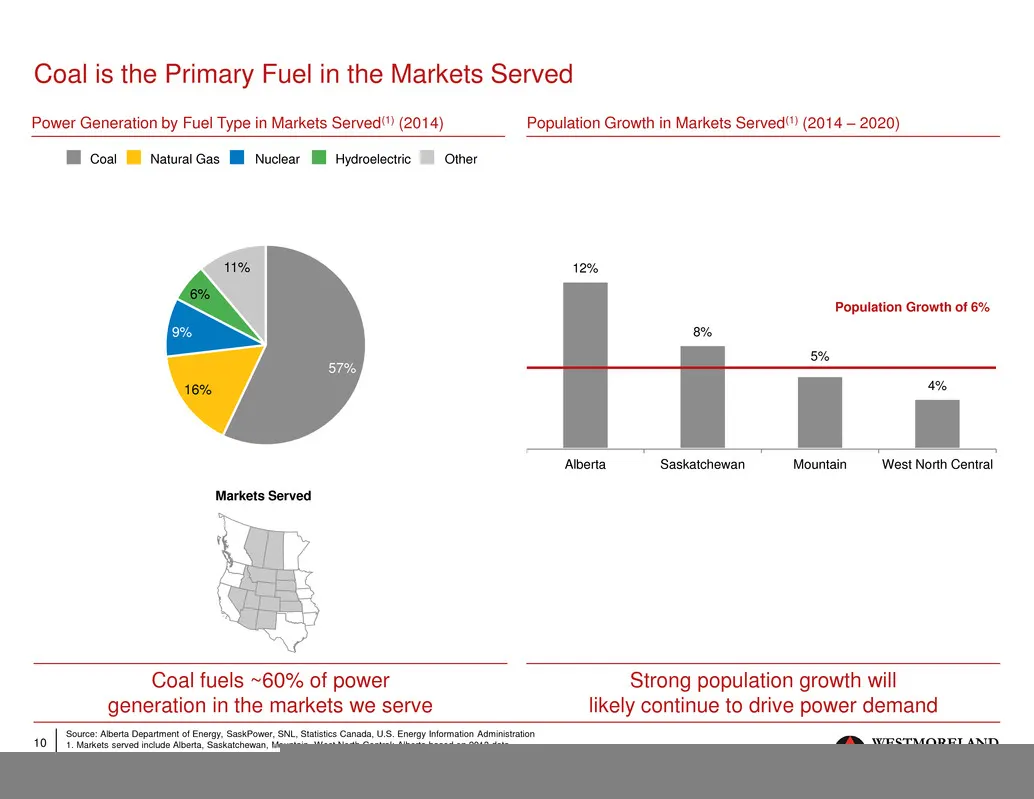
Coal is the Primary Fuel in the Markets Served Power Generation by Fuel Type in Markets Served(") (2014) pulati in 1020 Coal Ml NaturalGas MM Nuclear Ml Hydroelectric |) Other Population Growth of 6% Alberta Saskatchewan Mountain West North Central Coal fuels ~60% of power Strong population growth w
Slide 12: Significant Scale with Built-in Resource Growth
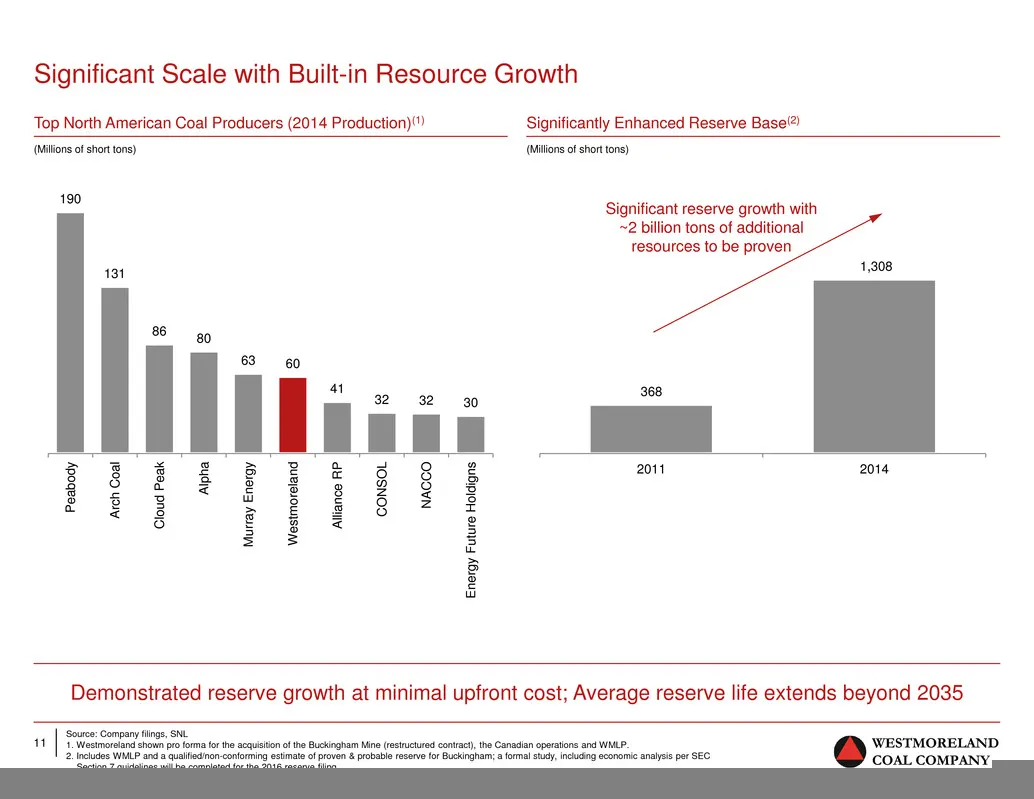
Significant Scale with Built-in Resource Growth Top North American Coal Producers (2014 Production)(") Significantly Enhanced Reserve Base) (tions of short tons) (tions of short tons) 190 Significant reserve growth with ~2 billion tons of additional resources to be proven 80 63 60 a Tr S68 $8 @ € 8
Slide 13: Westmoreland Customers Purchase Fuel Well Below the Competition
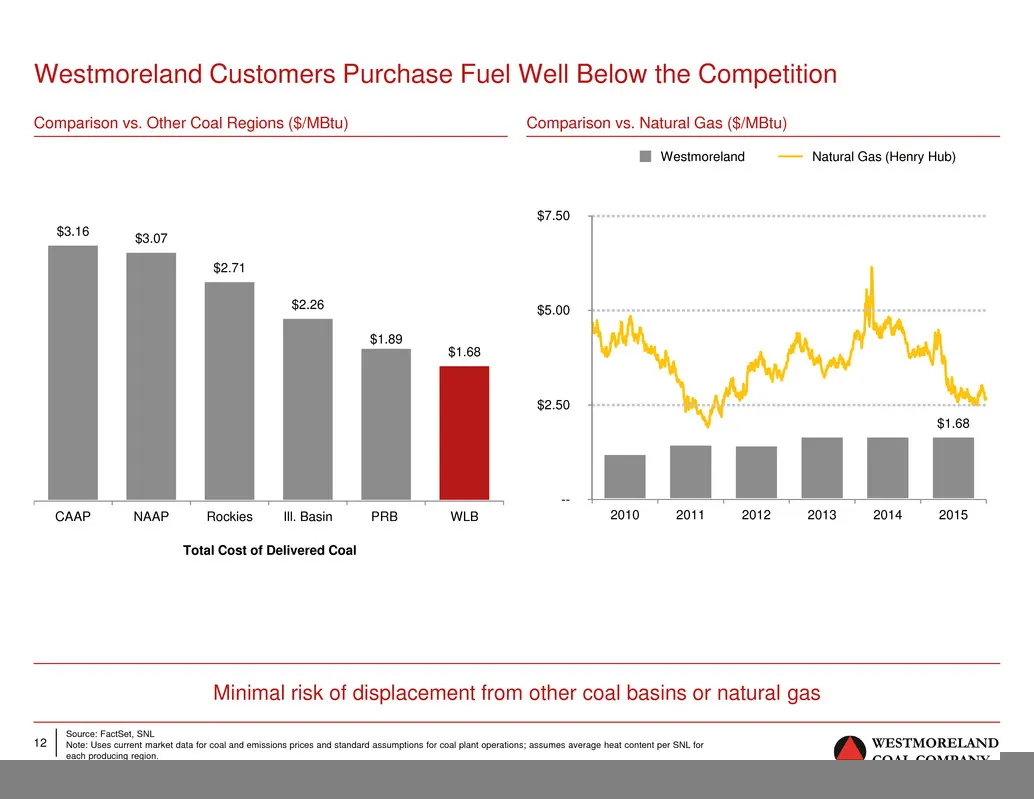
Westmoreland Customers Purchase Fuel Well Below the Competition Comparison vs. Other Coal Regions ($/MBtu) Comparison vs. Natural Gas ($/MBtu) | Westmoreland © —— Natural Gas (Henry Hub) $7.50 $5.00 | Dace eee CAAP NAAP Rockies i. Basin. «= PRB Wie 2010-2011 2012 Total Cost of Delivered Coal Minimal
Slide 14: Strong Safety Culture
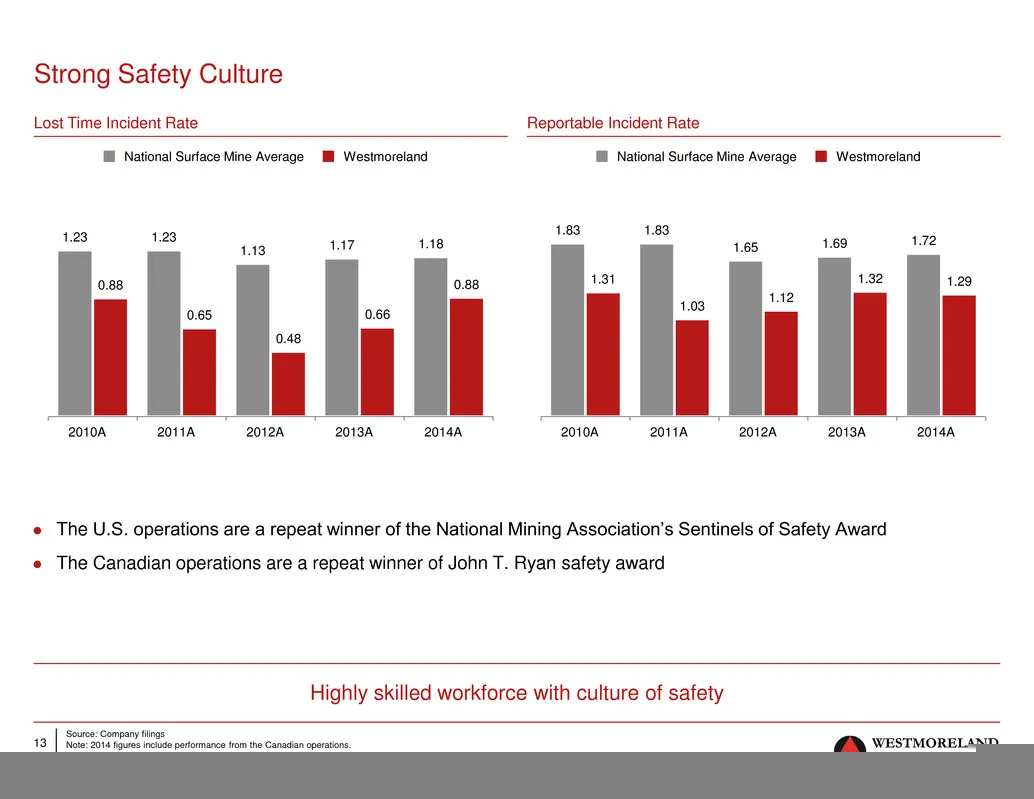
Strong Safety Culture Reportable Incident Rate lH National Surface Mine Average Ill. Westmoreland Lost Time Incident Rate 1§ National Surface Mine Average 1.83 1.83 1.23 1.23 ‘ia 147 ery ies 1.69 1.72 0.88 0.88 uel 1.32 1.29 142 0.65 0.66 iis 0.48 20138 20148 I Westmoreland 2010A 20118 20128 2010 20
Slide 15: Strong Cash Flow Generation Leads to Reduced Leverage
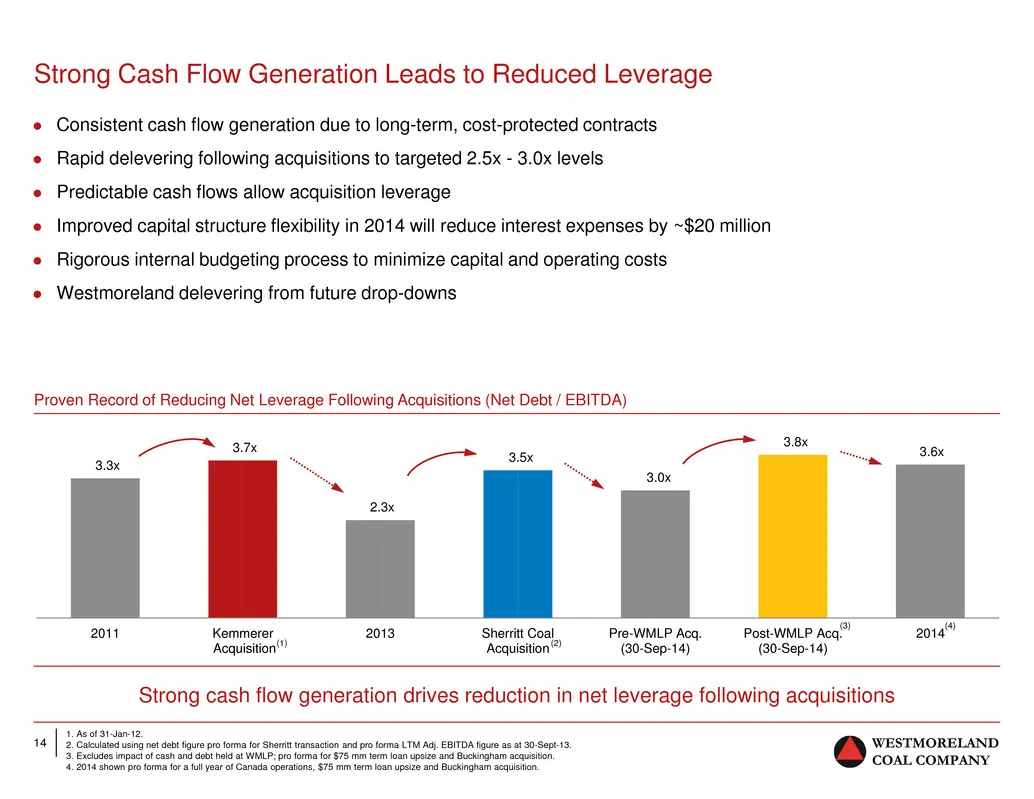
Strong Cash Flow Generation Leads to Reduced Leverage Consistent cash flow generation due to long-term, cost-protected contracts Rapid delevering following acquisitions to targeted 2.5x - 3.0x levels e Predictable cash flows allow acquisition leverage e Improved capital structure flexibility in 2014
Slide 16: Proven Management Team
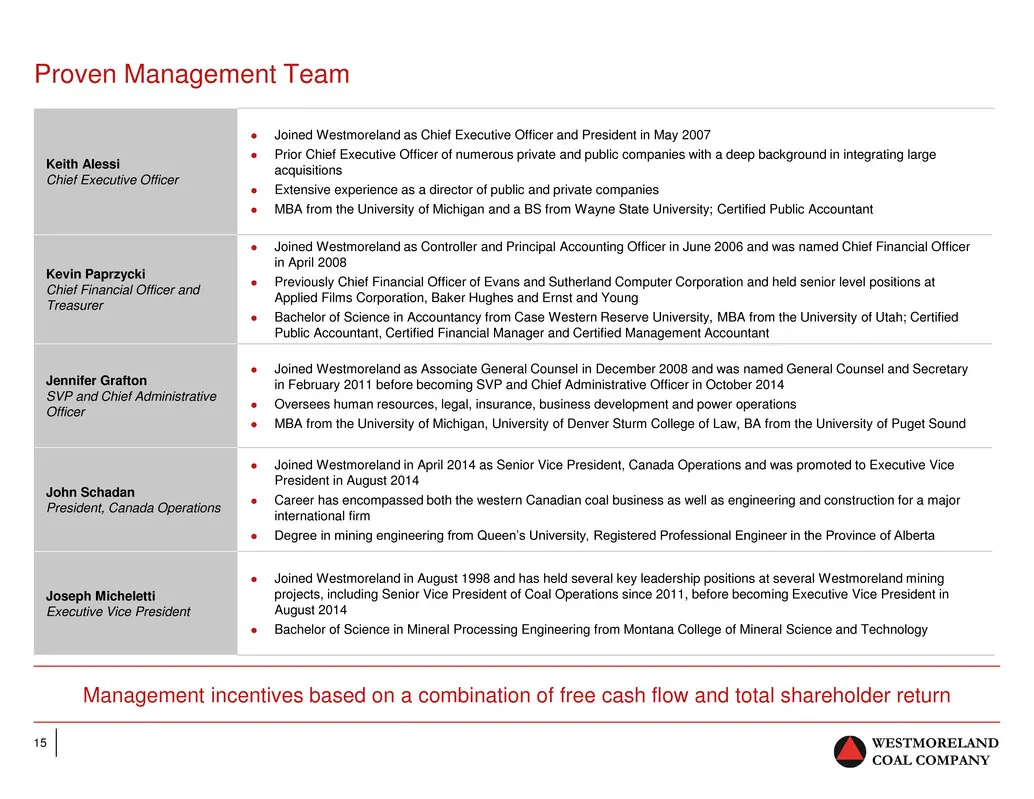
Proven Management Team © Join a May 2007 Keith Alessi Hist / : ef Executive Officer me cnsneat «MBA y y; Certified Publi Joined Princi i o ef Financial Officer in April 2008 ki os Bon Chief Financial Officer and eee sie Ohioat vee © Bachelor , MBA from the Universit Public Accountant, Certified tant
Slide 17: Proven Record of Successful Acquisition Integration
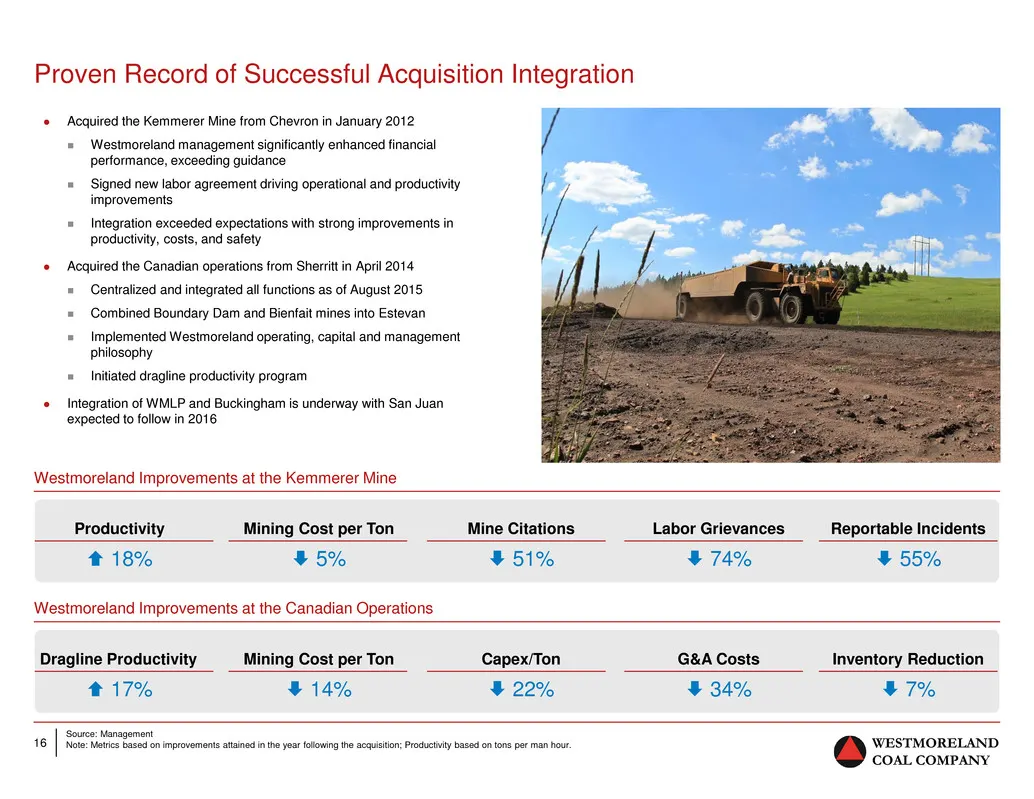
Proven Record of Successful Acquisition Integration performance, exceeding guidance improvements productivity, costs, and safety . in April 2014 = Combined Boundary Dam and Bientait mines into Estevan philosophy Initiated dragline productivity program 9 San Juan ‘expected to follow in 2016 Westmorel
Slide 18: Attractively Valued Investment Opportunities
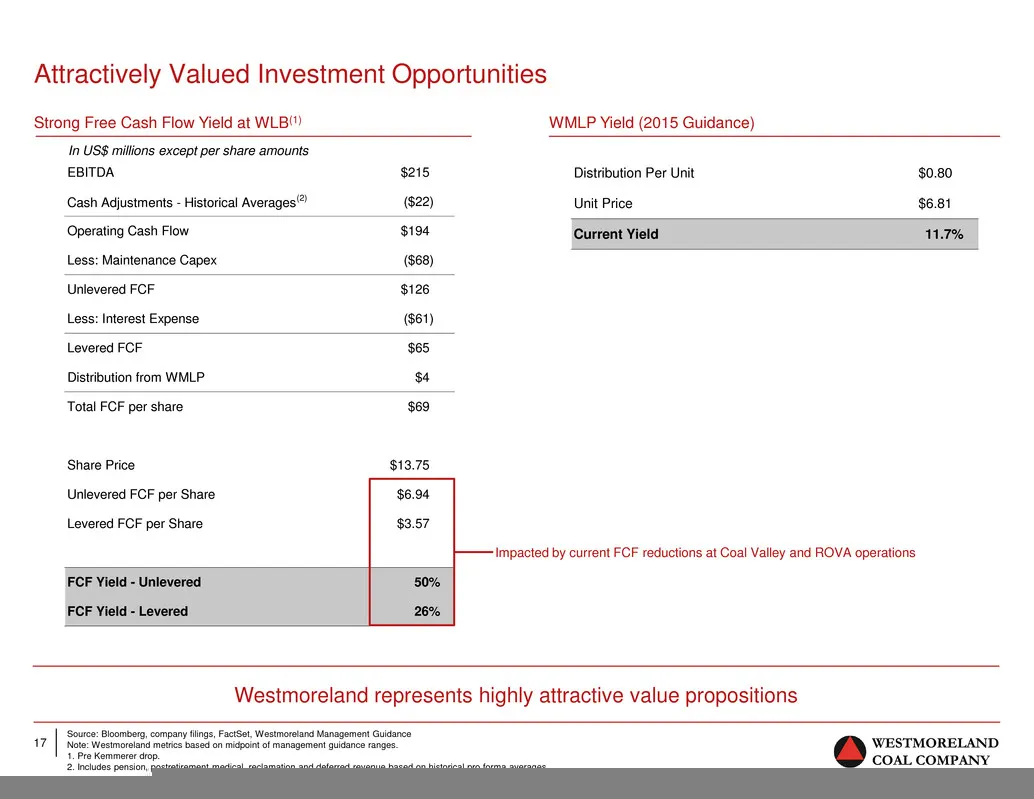
Attractively Valued Investment Opportunities Strong Free Cash Flow Yield at WLB() WMLP Yield (2015 Guidance) In US$ millions except per share amounts EBITDA $215 Distribution Per Unit $0.80 Cash Adjustments - Historical Averages” ($22) Unit Price $6.81 Operating Cash Flow $194 Current Yield 11.7% Le
Slide 19: Identified Value Drivers and Growth Projects
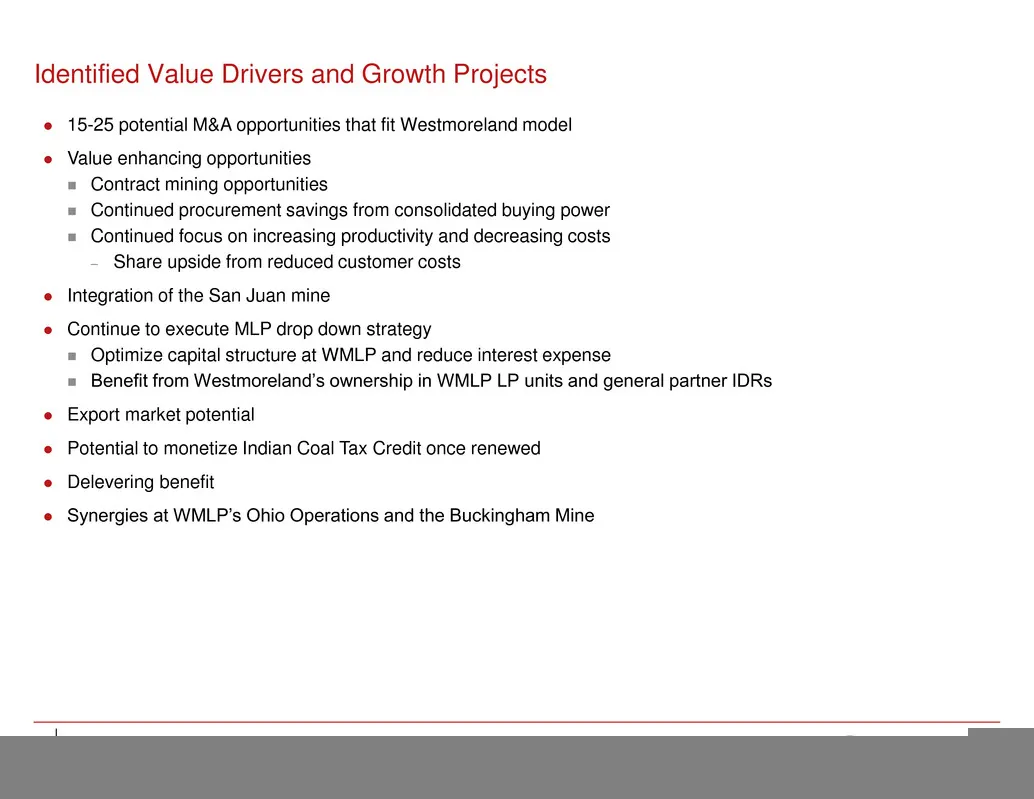
Identified Value Drivers and Growth Projects 15-25 potential M&A opportunities that fit Westmoreland model Value enhancing opportunities = Contract mining opportunities = Continued savings from buying power = Continued focus on increasing productivity and decreasing costs ~ Share upside from reduced
Slide 20: Future Potential Drop Downs
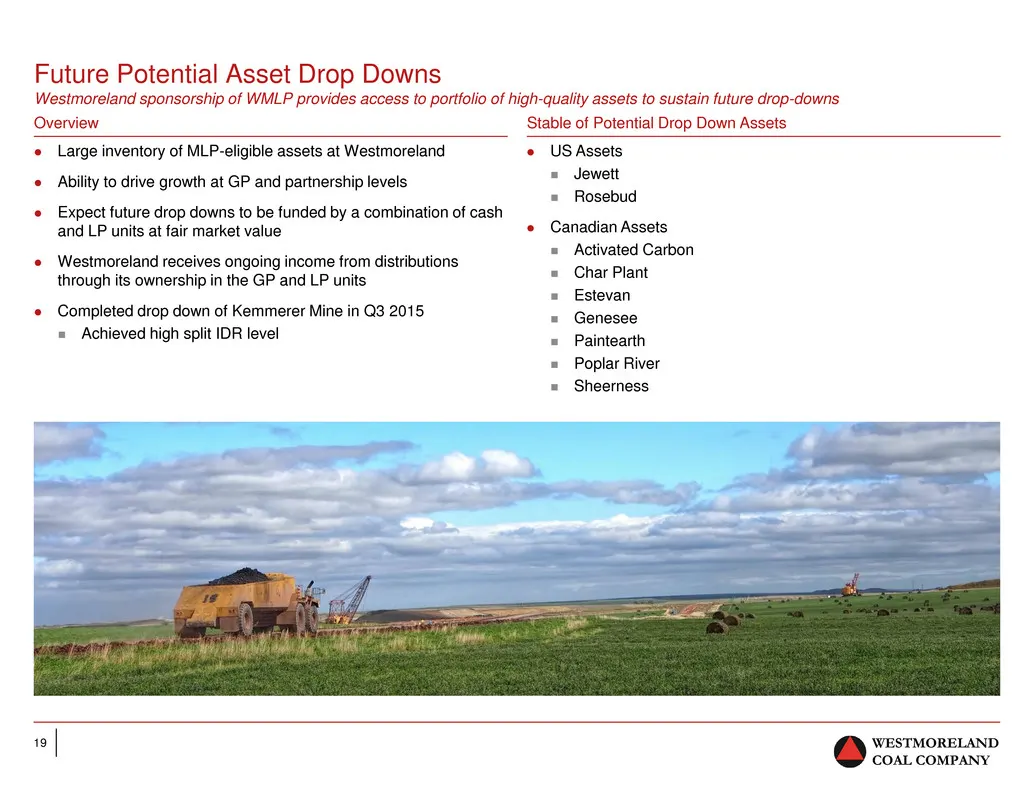
Future Potential aoe Drop Downs Overview to portfolio of high-q T de Stable of Potential Drop Down Assets «Large inventory of MLP-eligible assets at Westmoreland . sty to drive growth at GP and partnership levels e Exper be funded by and iP units at fair market value cash through its ownership in th
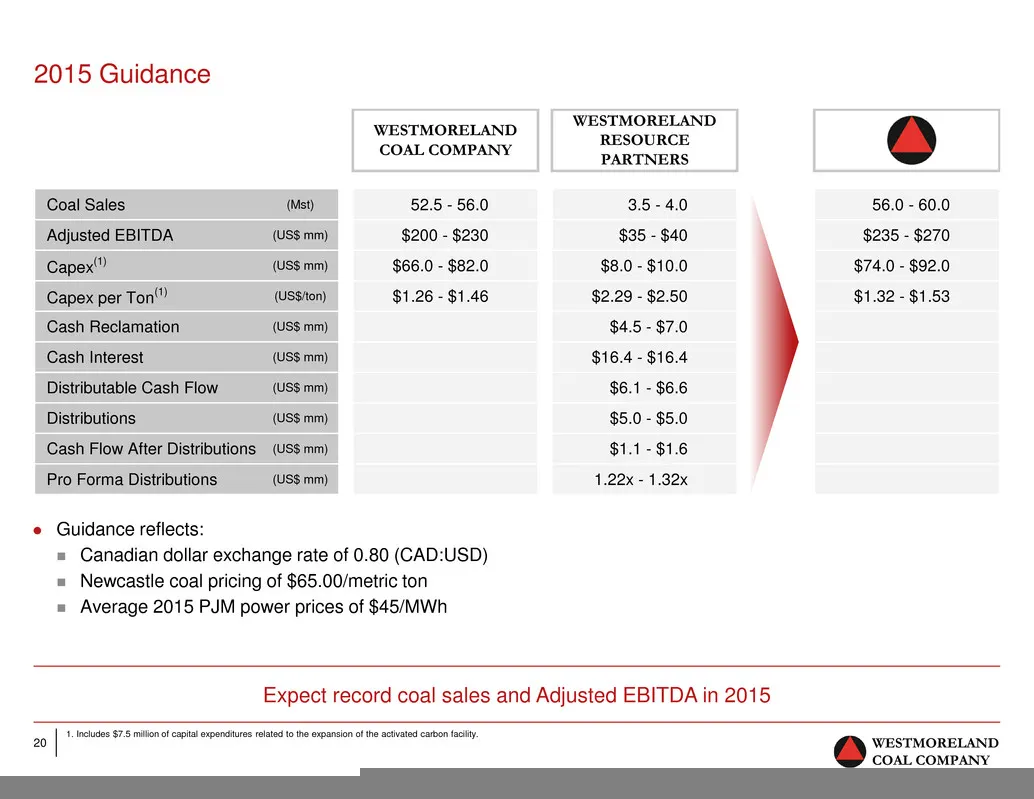
Slide 21: 2015 Guidance
2015 Guidance WESTMORELAND WESTMORELAND O COAL COMPANY RESOURCE, PARTNERS Coal Sales (Msi) 52.5 - 56.0 3.5-4.0 56.0 - 60.0 Adjusted EBITDA (USS mm) $200 - $230 $35 - $40 $235 - $270 Capex" (US$ mm) $66.0 - $82.0 $8.0 - $10.0 $74.0 - $92.0 Capex per Ton”) (Ussiton) $1.26 - $1.46 $2.29 - $2.50 $1.32 -
Source: SEC EDGAR · 8-K filed Aug 17, 2015
More decks from Westmoreland Coal Company
 Debt Investor Presentation (January 2019)7 slides · Jan 2, 2019
 Debt Investor Presentation (December 2018)22 slides · Dec 19, 2018
 Debt Investor Presentation (October 2018)31 slides · Oct 9, 2018
 Investor Presentation (May 2018)50 slides · May 23, 2018
 FY2017 Earnings Presentation11 slides · Apr 2, 2018
 Q3 2017 Earnings Presentation13 slides · Oct 31, 2017