Alpha Natural Resources — Jefferies 2nd Annual Boston Energy Day 2010
30 slides from Alpha Natural Resources's conference presentation, Jun 28, 2010

Slide 1: Jefferies 2nd Annual Boston Energy Day
Jefferies 2 nd Annual Boston Energy Day June 28-29, 2010 Exhibit 99.1

Slide 2: Forward Looking Statements
Forward Looking Statements Statements in this presentation which are not statements of historical fact are “forward-looking statements” within the Safe Harbor provision of the Private Securities Litigation Reform Act of 1995. Such statements are not guarantees of future performance. Many factors cou

Slide 3: ANR: Uniquely Positioned Industry Leader
ANR: Uniquely Positioned Industry Leader v Leading U.S. supplier and exporter of metallurgical coal with expertise in blending and optimization v Low-cost, high margin Pittsburgh #8 longwall mines can supply U.S. or international markets, including recent ~100K ton met shipment to China v High volum

Slide 4: Coal Industry Themes - 2010
Coal Industry Themes - 2010 v Strong met coal pricing continues to be driven by growing Asian demand, global recovery, and supply disruptions v Met coal tightness intensified in the United States by recent and unexpected loss of high- vol production v Utility inventory levels anticipated to approach

Slide 5: Alpha Natural Resources
A Alpha Nezural Resources ‘noms maT
Slide 6: U.S. Thermal Coal Market Improving
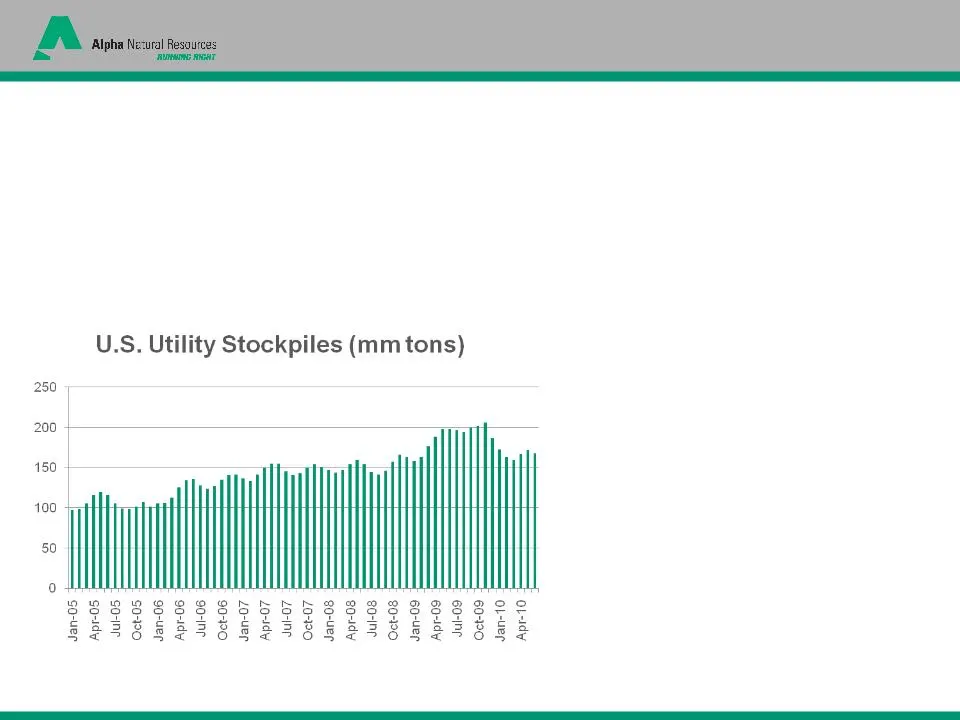
U.S. Thermal Coal Market Improving — Utility inventories decreased by approximately 40MTs from the 11/09 peak — Eastern thermal coal production unlikely to expand in 2010 and may decline further — Economic recovery driving increased industrial electricity demand — Global recovery and shifting seabor
Slide 7: China & India Rely on Coal-fired Electricity
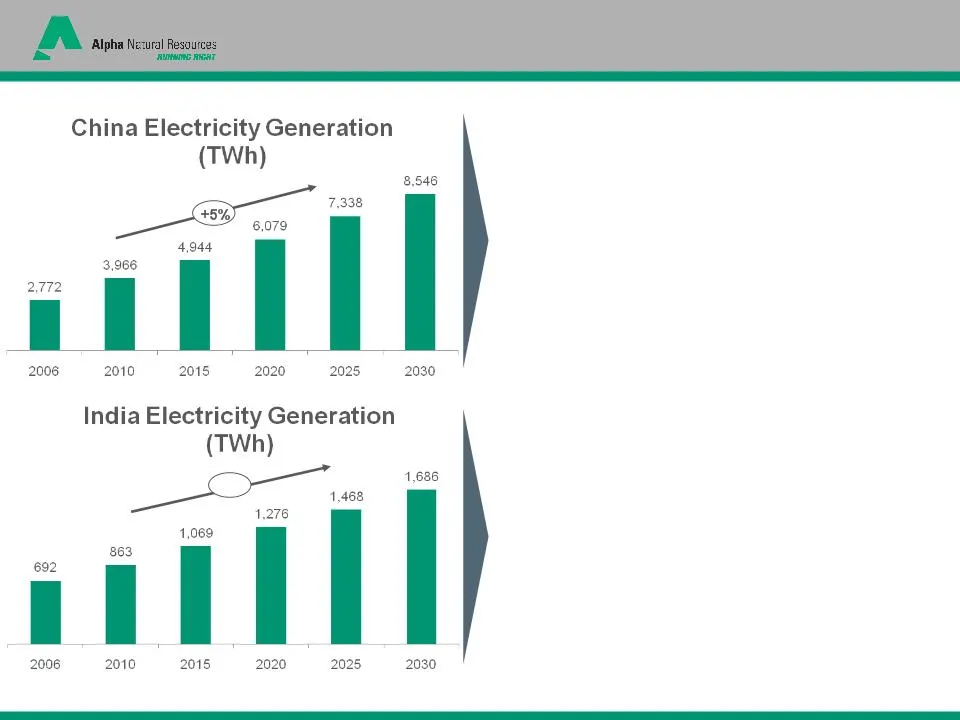
China & India Rely on Coal-fired Electricity 2010E: 78% coal-fired 2030E: 75% coal-fired 2010E: 65% coal-fired 2030E: 56% coal-fired (Indian thermal coal imports have grown at 13% CAGR from 1990 - 2008) Source: EIA IEO 2009; Booz & Company analysis +4%
Slide 8: Scarcity of Metallurgical Coal
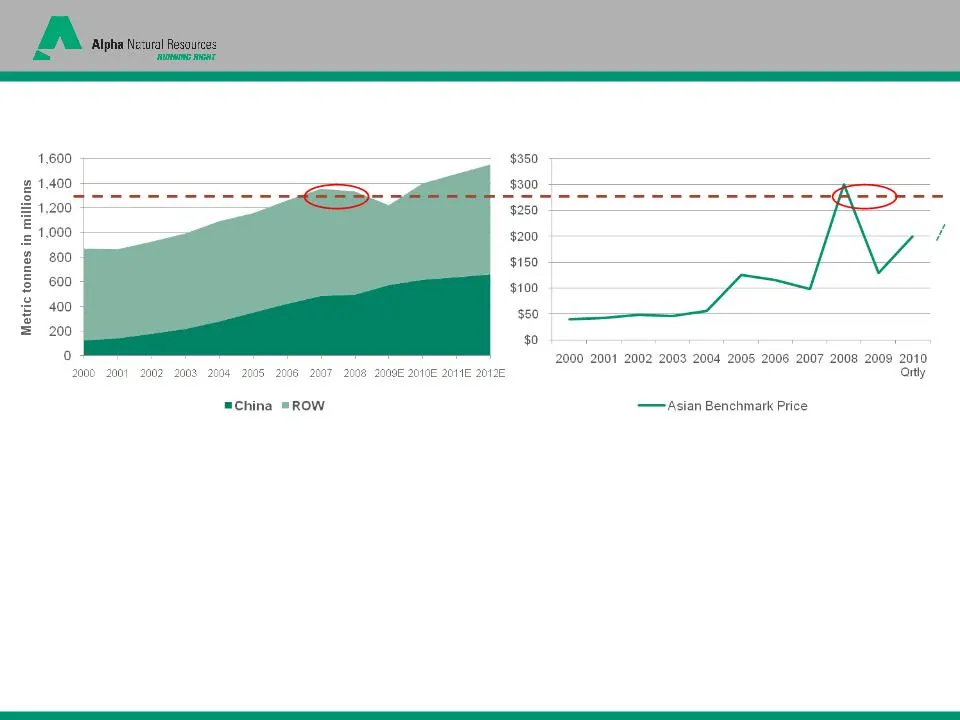
Source: Wood Mackenzie; Booz & Company analysis China = 14.8% CAGR ROW = 1.5% CAGR Scarcity of Metallurgical Coal Global Steel Production Metallurgical Coal Pricing (US$) — As global steel production has grown, metallurgical coal has come to be viewed as a scarce and differentiated product — When wo
Slide 9: China Driving Worldwide Met Demand
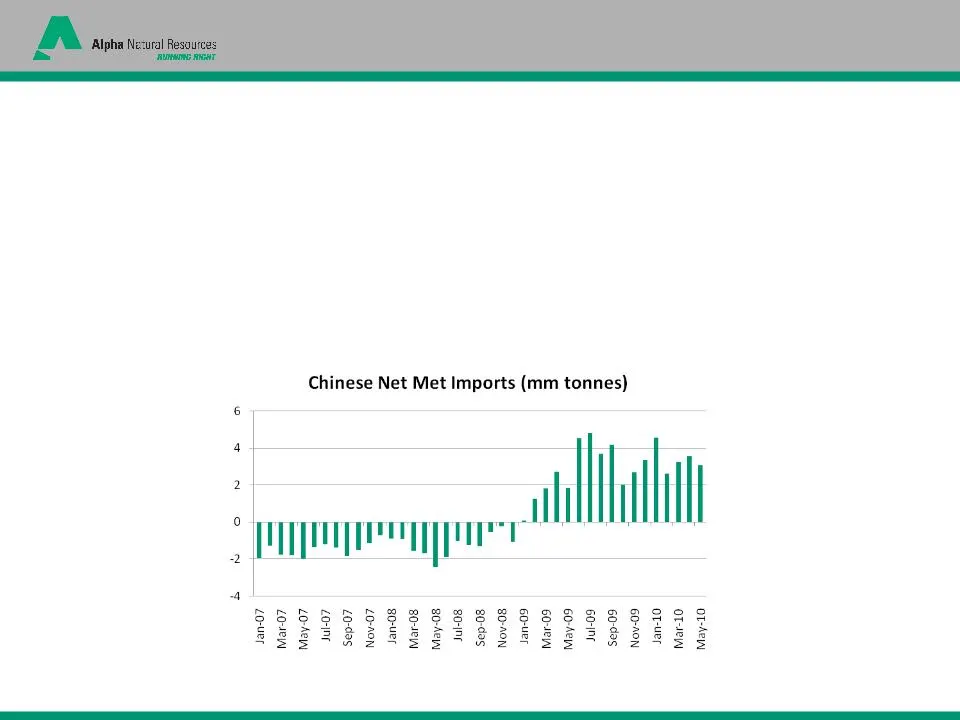
China Driving Worldwide Met Demand Chinese Growth is Permanently Changing Global Seaborne Met Coal Trading Dynamics — Worldwide steel production is estimated to be on an annual pace of greater than 1.3B tonnes, with over 600M tonnes expected from China alone in 2010, despite recent concerns of slowi
Slide 10: Robust Met Demand in Atlantic Basin
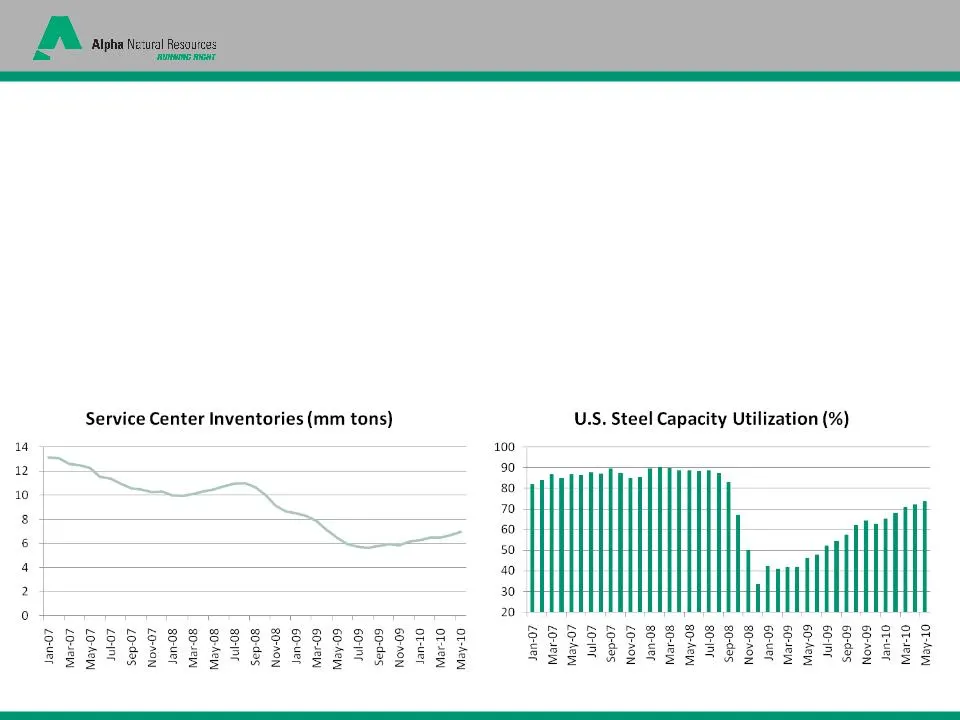
Robust Met Demand in Atlantic Basin Met Coal Demand in the Atlantic Basin Has Increased As Developed Economies Have Recovered and Steel Production Ramped Up * ANR is a leading U.S. supplier & exporter of metallurgical coal with 13-14MTPA export capacity* — Domestic producers’ rapid response to the r
Slide 11: Trends in Seaborne Trading Patterns
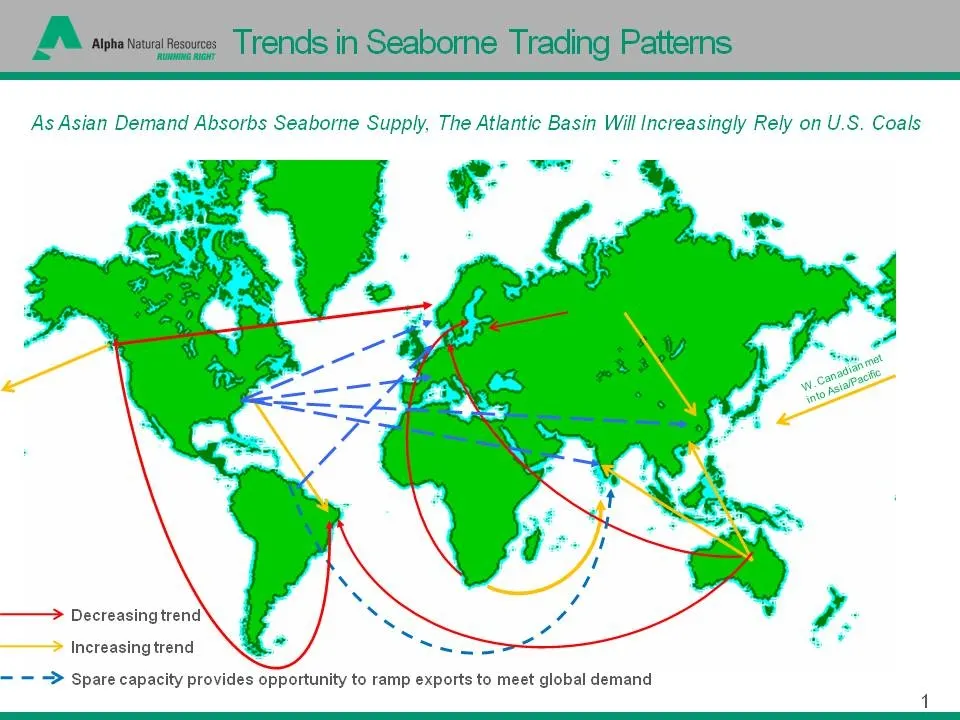
A AphaNaualfexowes Trends in Seaborne Trading Patterns ‘Row RT As Asian Demand Absorbs Seaborne Supply, The Atlantic Basin Will Increasingly Rely on U.S. Coals ——> Decreasing trend > Increasing trend > Spare capacity provides opportunity to ramp exports to meet global demand

Slide 12: Alpha Natural Resources
A Alpha Nezural Resources ‘noms maT
Slide 13: Diversification/Scale=Consistent Execution
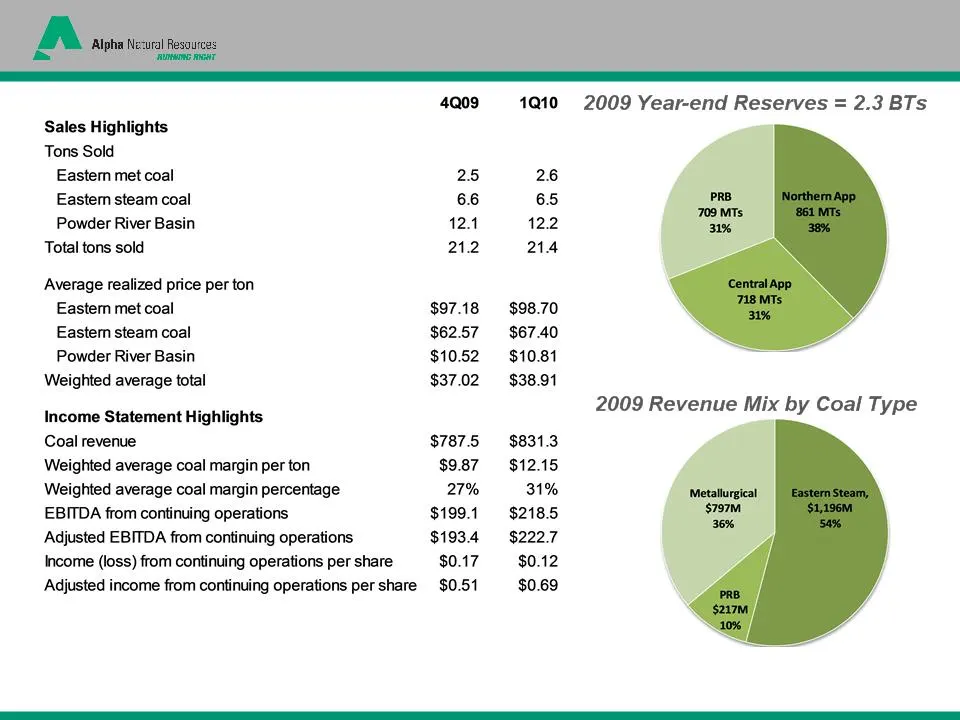
Diversification/Scale=Consistent Execution Following our merger on July 31, 2009, Alpha has delivered consistent execution demonstrating the benefit of the company’s enhanced scale and diversification. *ANR is arguably the most regionally diversified producer in the U.S. today*
Slide 14: Consistent History of Positive Cash Flow
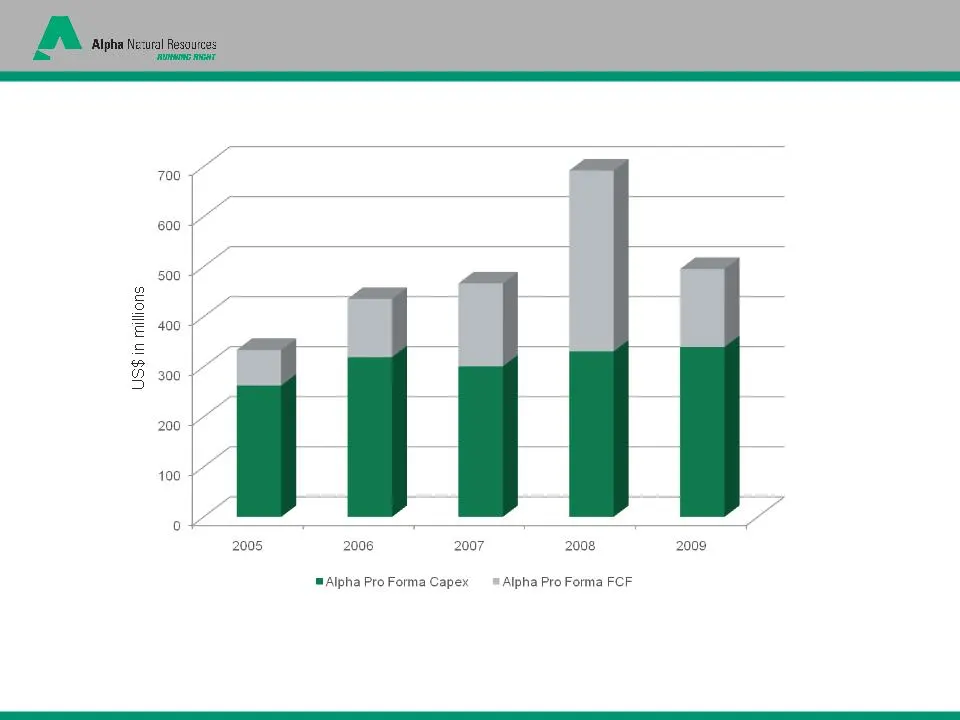
Consistent History of Positive Cash Flow Note: Pro forma capex for 2008 and 2009 includes Lease-By-Application (LBA) bonus bid payments of $36.1 million each year. FCF = Operating cash flow less capex

Slide 15: Excellent Liquidity and Low Leverage
($ millions) Maturity As of 6/18/10 $854mm Revolving Credit Facility 1 July, 2014 $0 Term Loan A July, 2014 236 2.375% Convertible Notes April, 2015 288 7.25% Senior Unsecured Bonds August, 2014 298 Total Long-term Debt $822 Liquidity and Credit Statistics Cash & Equivalents and marketable securitie

Slide 16: Strategic Intent & Uses of Cash
• Maintaining safe and well-capitalized mines is priority #1 • Organic development—moving forward with development of organic met projects, DM #41 and Freeport; continuing the permitting of the Foundation Pitt #8 longwall mine; evaluating other organic development opportunities as market conditions

Slide 17: Strategic Intent & Uses of Cash (cont'd)
• Returning cash to shareholders while retaining the financial flexibility to pursue strategic growth opportunities • $125 million share repurchase authorization recently approved by Alpha’s board • Approximately $25 million purchased to date at an average price of $36.33 per share • Repurchases mad
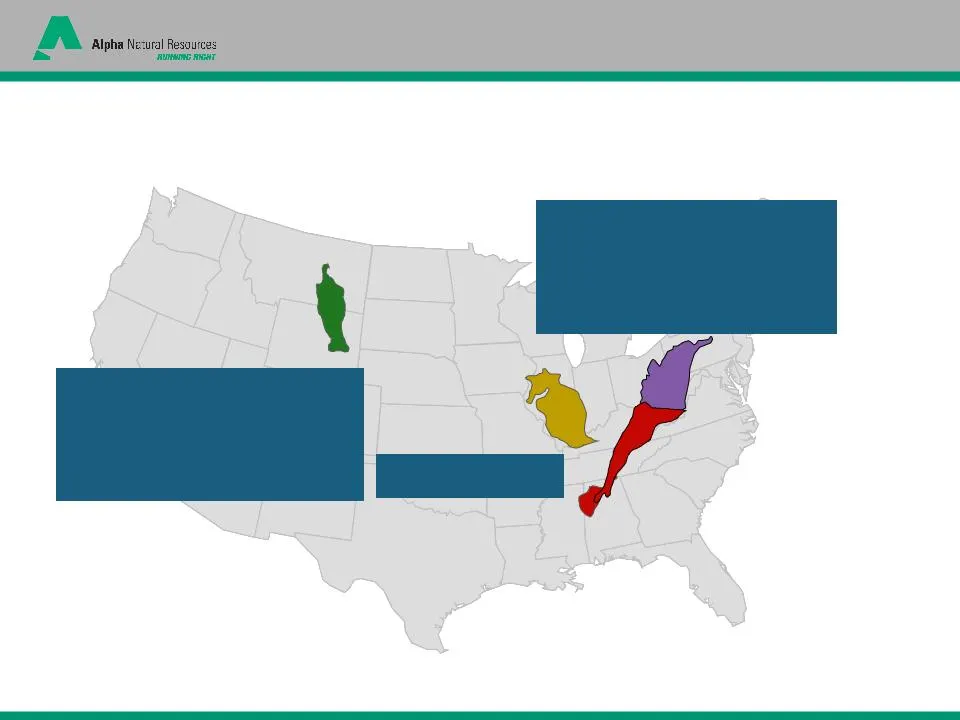
Slide 18: A Leader in the Domestic Coal Industry
Production capacity 55.0 2009 Shipments 50.1 Reserves 709 Reserves 26 Production Capacity 42.0 2009 Shipments 36.0 Reserves 1579 A Leader in the Domestic Coal Industry Eastern Coal Operations Illinois Basin Western Coal Operations Note: Figures pro forma as of 12/31/09 Strength, Scale, Diversificati
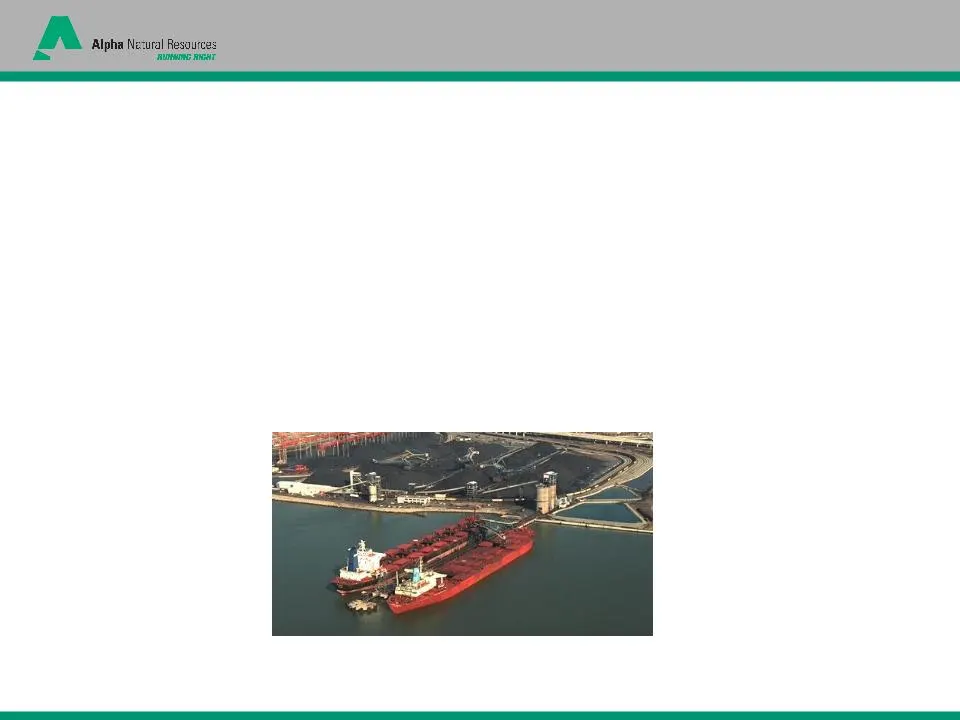
Slide 19: U.S. Leader in Export Capacity
• Alpha’s total export capacity from all US terminals is 13-14 MTPA, providing unique blending, storage and transportation advantages • Alpha holds a 41% interest in Dominion Terminal Associates (DTA): Alpha’s estimated proportional export capacity is ~5.5 MTPA • Alpha controls ~5.0 MT of capacity a

Slide 20: Organic Growth Opportunities
Powder River Basin Wyoming Operations Expansion (MM tons/yr) Capacity Truck/shovel expansion 10 65 MTPY Belle Ayr LBA 200 Million Tons Late 2010 Central Appalachia Mine Resource Description Production Deep Mine #41 ~ 70 MM Ton Reserve 1.0 - 1.2 MTPY (metallurgical) Harts Creek/Atenville ~ 120 MM Ton
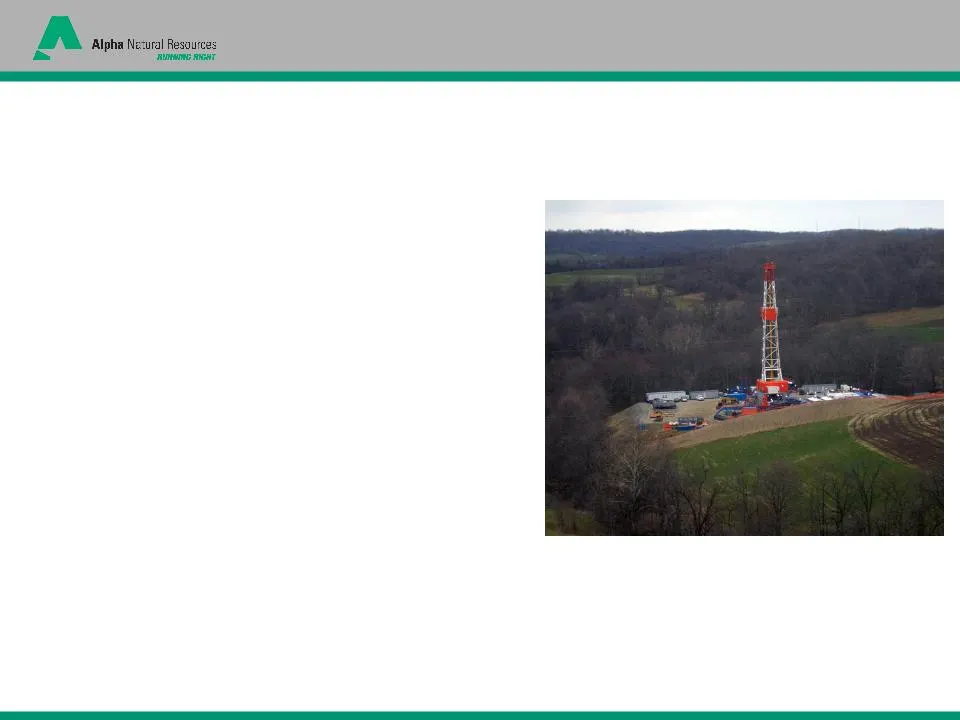
Slide 21: Unconventional Gas Development
• 50/50 Joint Venture with Rice Energy, LP • Alpha controls ~18,000 acres of Marcellus in Greene and Washington Counties of Pennsylvania • Initial phase underway, recently drilled the first of four wells planned for 2010 • Each partner committing acreage and cash • Total phase 1 capital anticipated
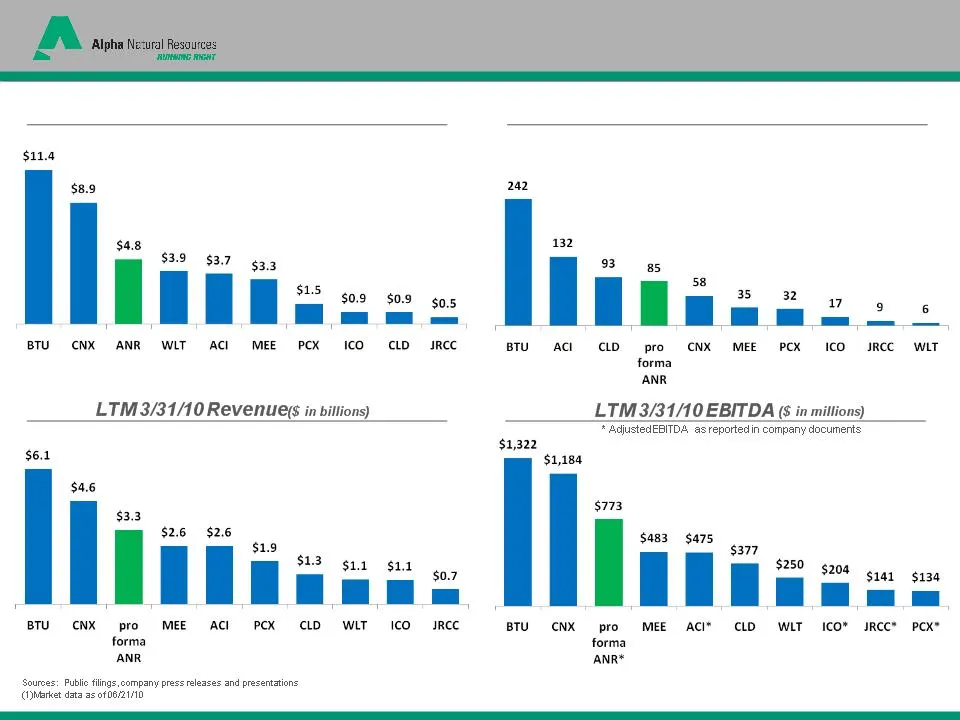
Slide 22: Peer Group Comparisons
Market Capitalization 1 ($ in billions) LTM 3/31/10 Tons Sold (in millions) Peer Group Comparisons
Slide 23: Recent Valuation Comparison 6/21/10
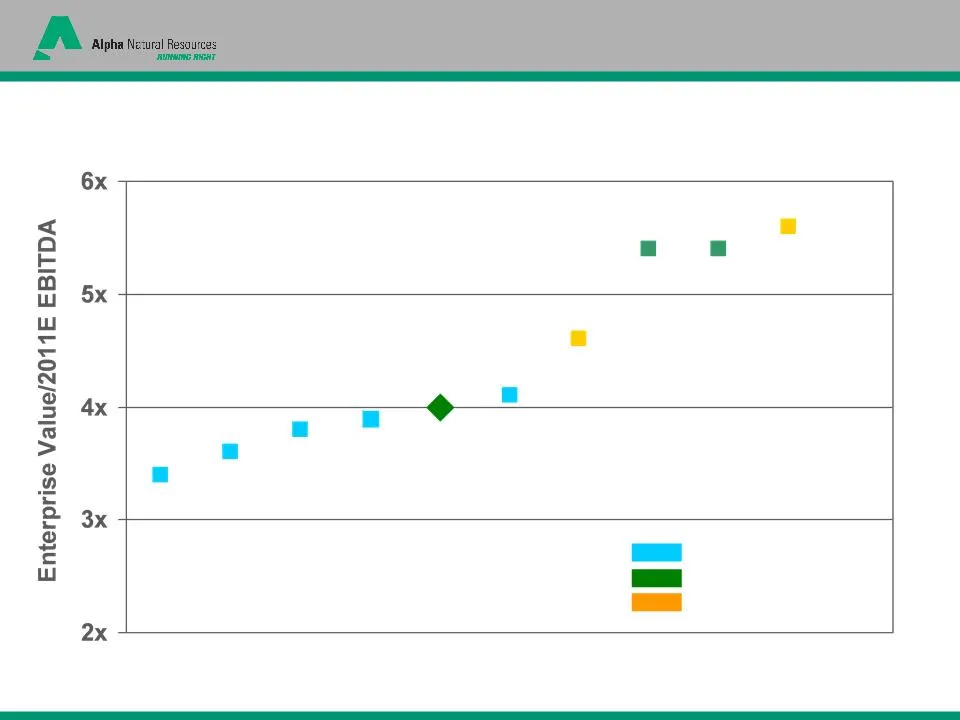
Recent Valuation Comparison 6/21/10 Notes: Market data and First Call consensus 2011 EBITDA estimates as of 6/21/10, pro forma for the MEE acquisition of Cumberland Resources and the CNX acquisition of the Dominion gas assets and the remaining 17% of CXG. < 50 MM TPY, regional > 50 MM TPY, diversifi

Slide 24: Coal Industry Themes
Coal Industry Themes ü ANR is a leading U.S. supplier and exporter of met coal with 13-14MTs of export terminal capacity and worldwide customer base ü ANR is positioned to benefit from the near- term shortage of domestic high-vol stemming from recent mine closures ü ANR’s operations in NAPP, CAPP an

Slide 25: Alpha Natural Resources
A Alpha Nezural Resources ‘noms maT
Slide 26: 4Q09 Reconciliation of Adjusted EBITDA
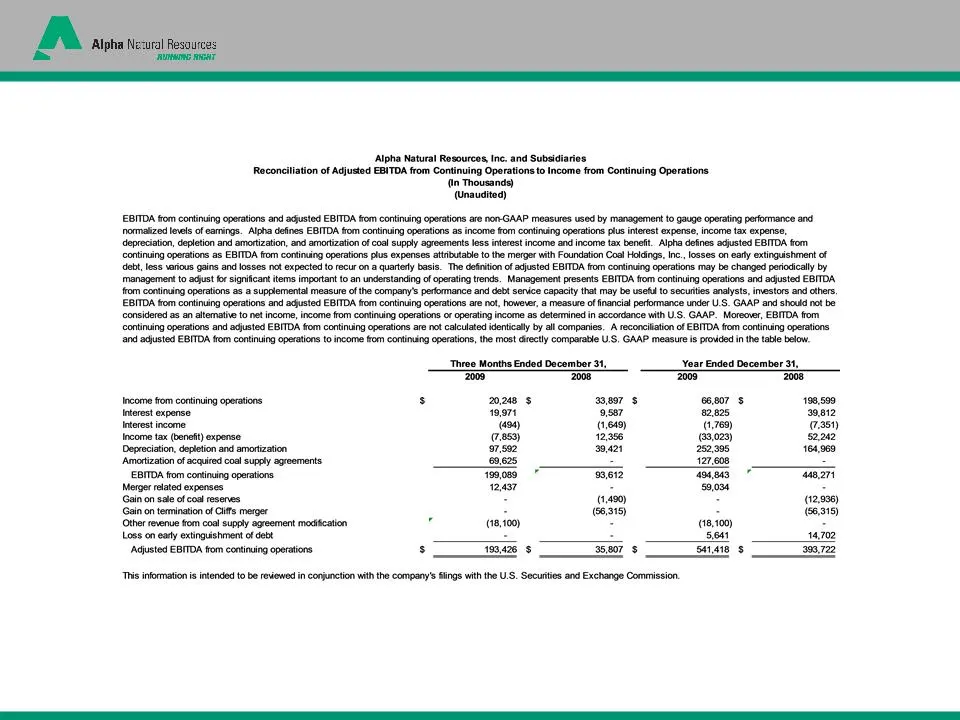
4Q09 Reconciliation of Adjusted EBIDTA
Slide 27: 4Q09 Reconciliation of Adjusted Income
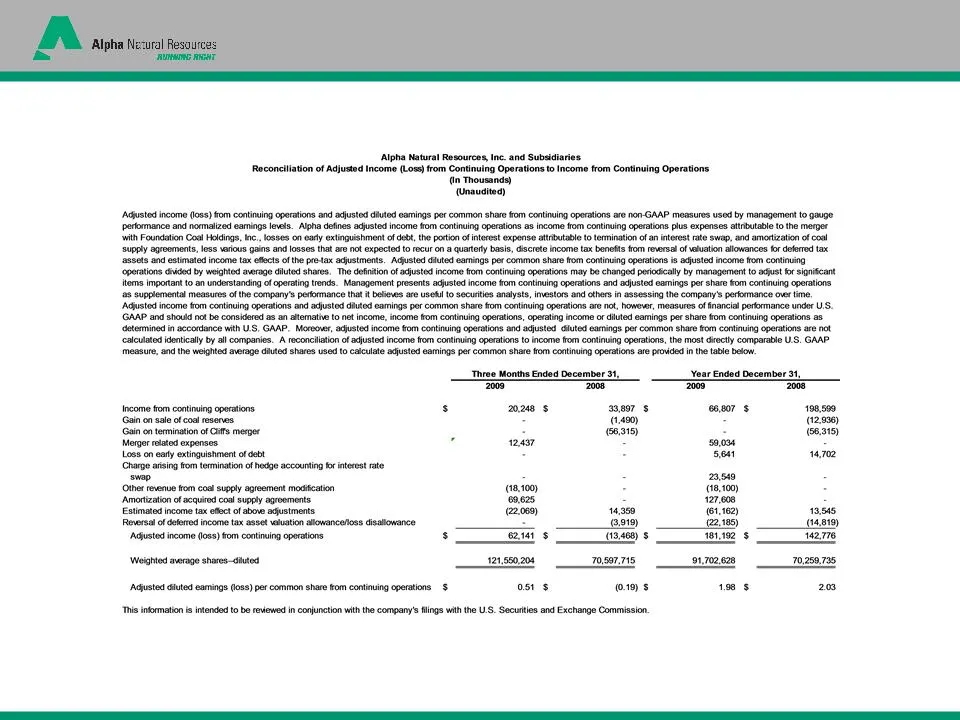
4Q09 Reconciliation of Adjusted Income
Slide 28: 1Q10 Reconciliation of Adjusted EBITDA
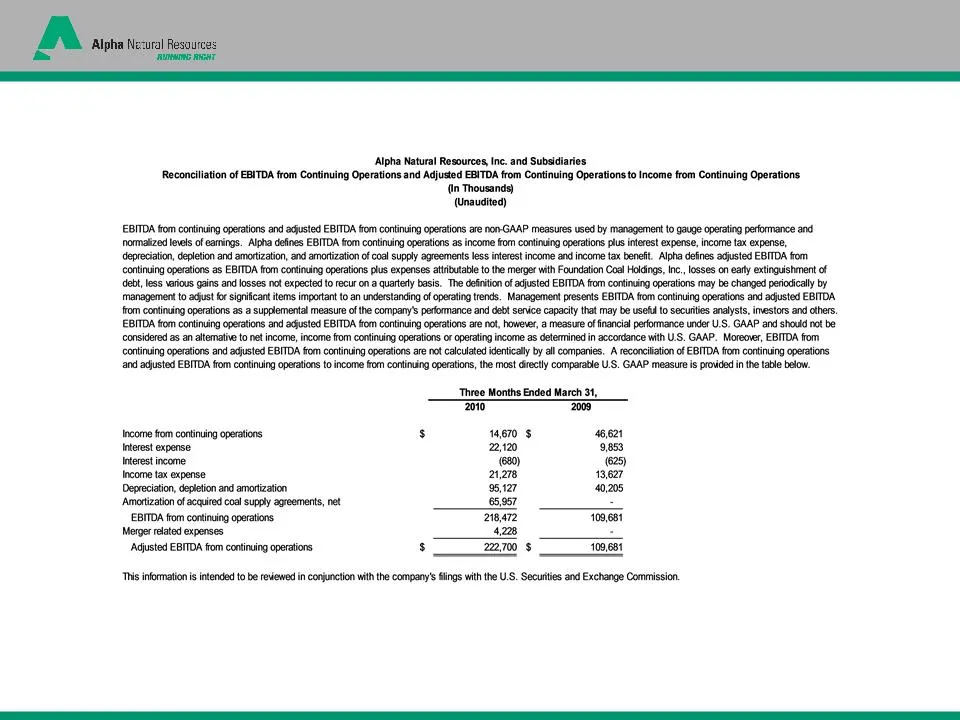
1Q10 Reconciliation of Adjusted EBIDTA
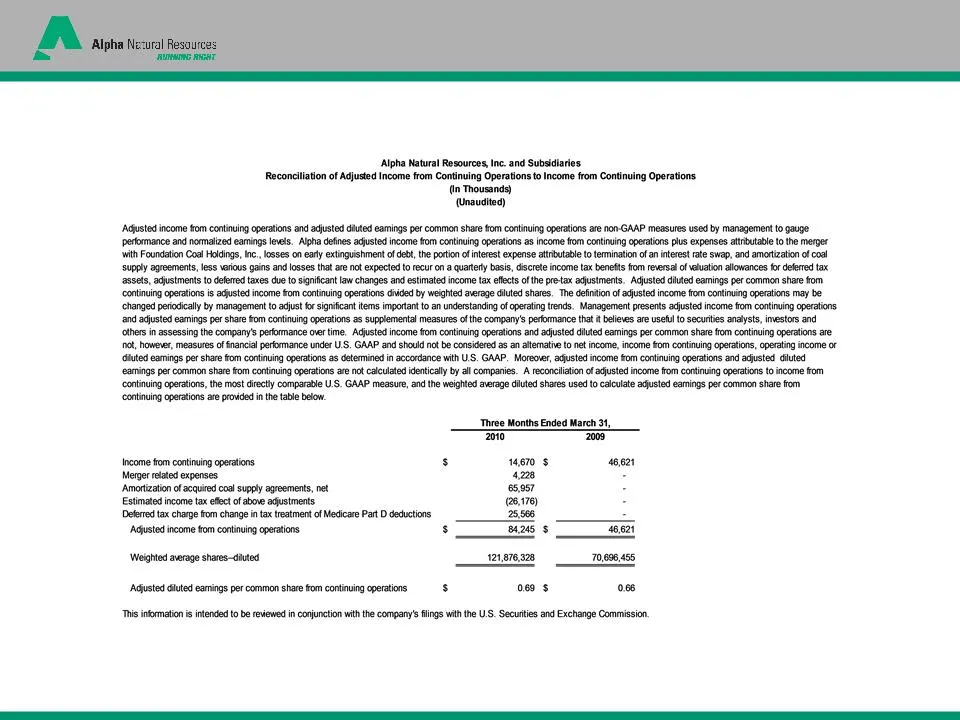
Slide 29: 1Q10 Reconciliation of Adjusted Income
1Q10 Reconciliation of Adjusted Income
Slide 30: Alpha Natural Resources
A Alpha Natural Resources >
Source: SEC EDGAR · 8-K filed Jun 28, 2010
More decks from Alpha Natural Resources Inc
 J.P. Morgan Global High Yield & Leveraged Finance Conference (February 2015)36 slides · Feb 23, 2015
 Barclays CEO Energy-Power Conference 201435 slides · Sep 2, 2014
 2014 BMO 23rd Global Metals and Mining Conference; Sterne Agee 2014 Boston Executive Summi33 slides · Jun 17, 2014
 2014 BMO 23rd Global Metals and Mining Conference / Brean Capital 2014 Global Resources &30 slides · May 28, 2014
 2014 BMO 23rd Global Metals and Mining Conference30 slides · Feb 24, 2014
 Tuohy Brothers' 4th Annual Energy Conference (August 2013)26 slides · Aug 5, 2013