Hi-Crush Partners LP — Investor Presentation (February 2013)
24 slides from Hi-Crush Partners LP's investor presentation, Feb 1, 2013
Slide 1: Investor Presentation
Exhibit 99.2 Investor Presentation February 2013
Slide 2: Forward Looking Statements
Forward Looking Statements Some of the information in this news release may contain forward-looking statements within the meaning of Section 27A of the Securities Act of 1933, as amended, and Section 21E of the Securities Exchange Act of 1934, as amended (the “Exchange Act”). Forward-looking stateme
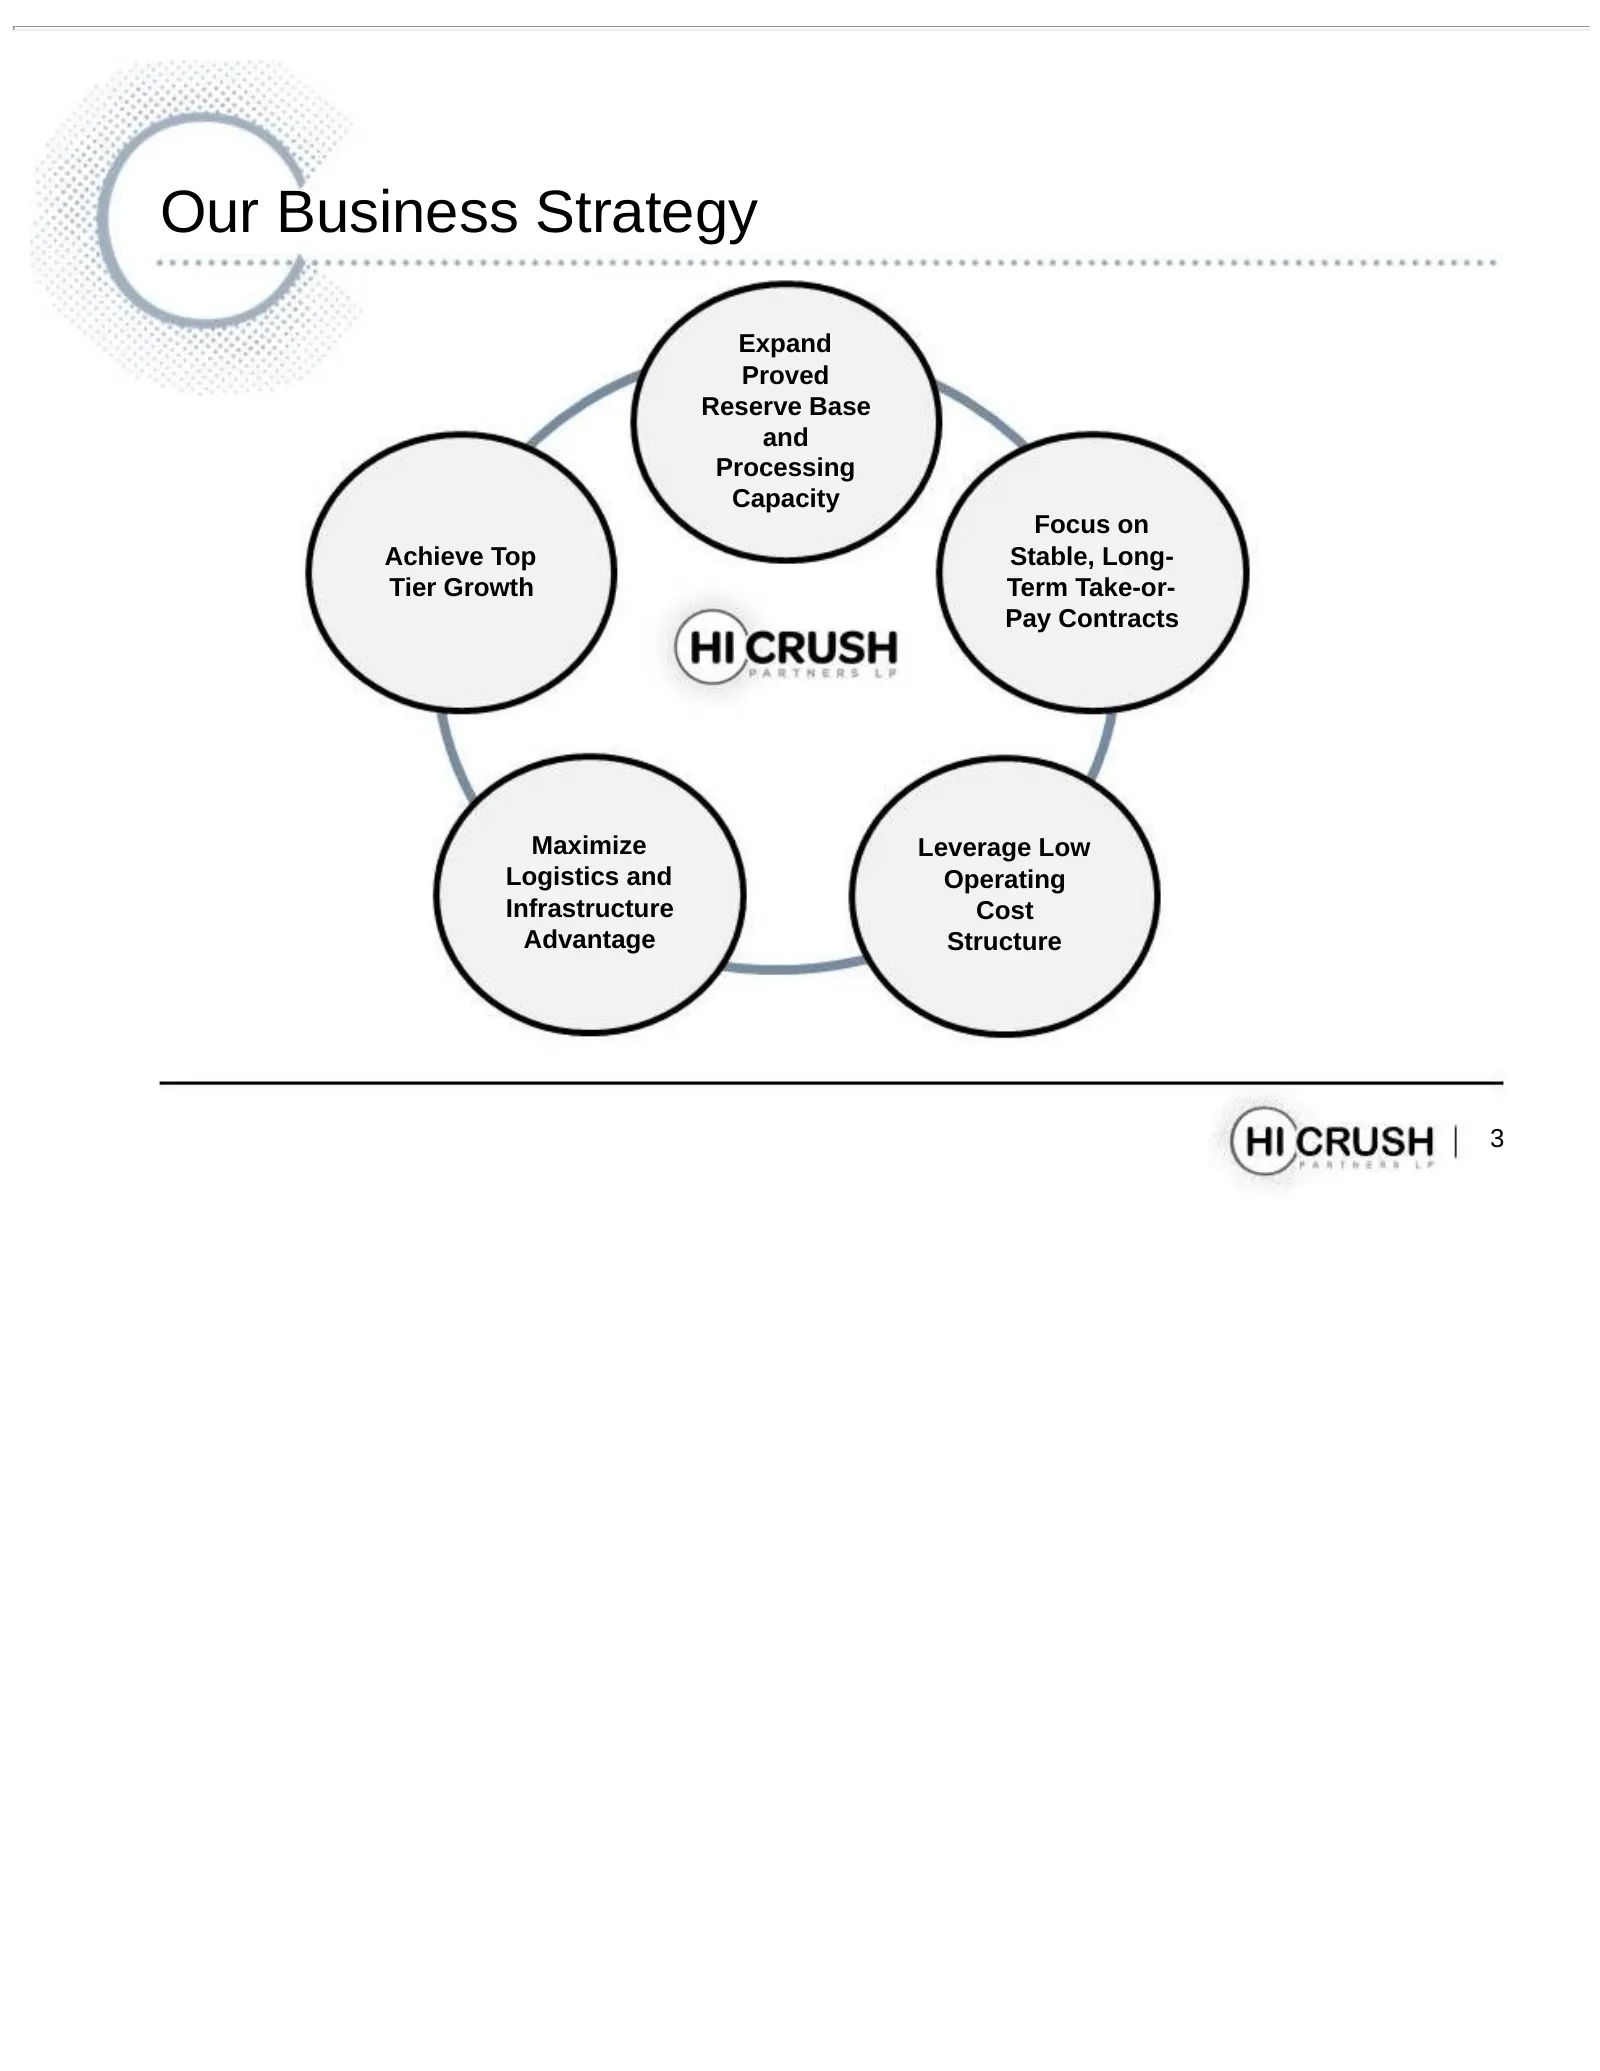
Slide 3: Our Business Strategy
Our Business Strategy Expand Proved Reserve Base and Processing Capacity Focus on Achieve Top Stable, Long- Tier Growth Term Take-or- Pay Contracts Maximize Leverage Low Logistics and Operating Infrastructure Cost Advantage Structure 3
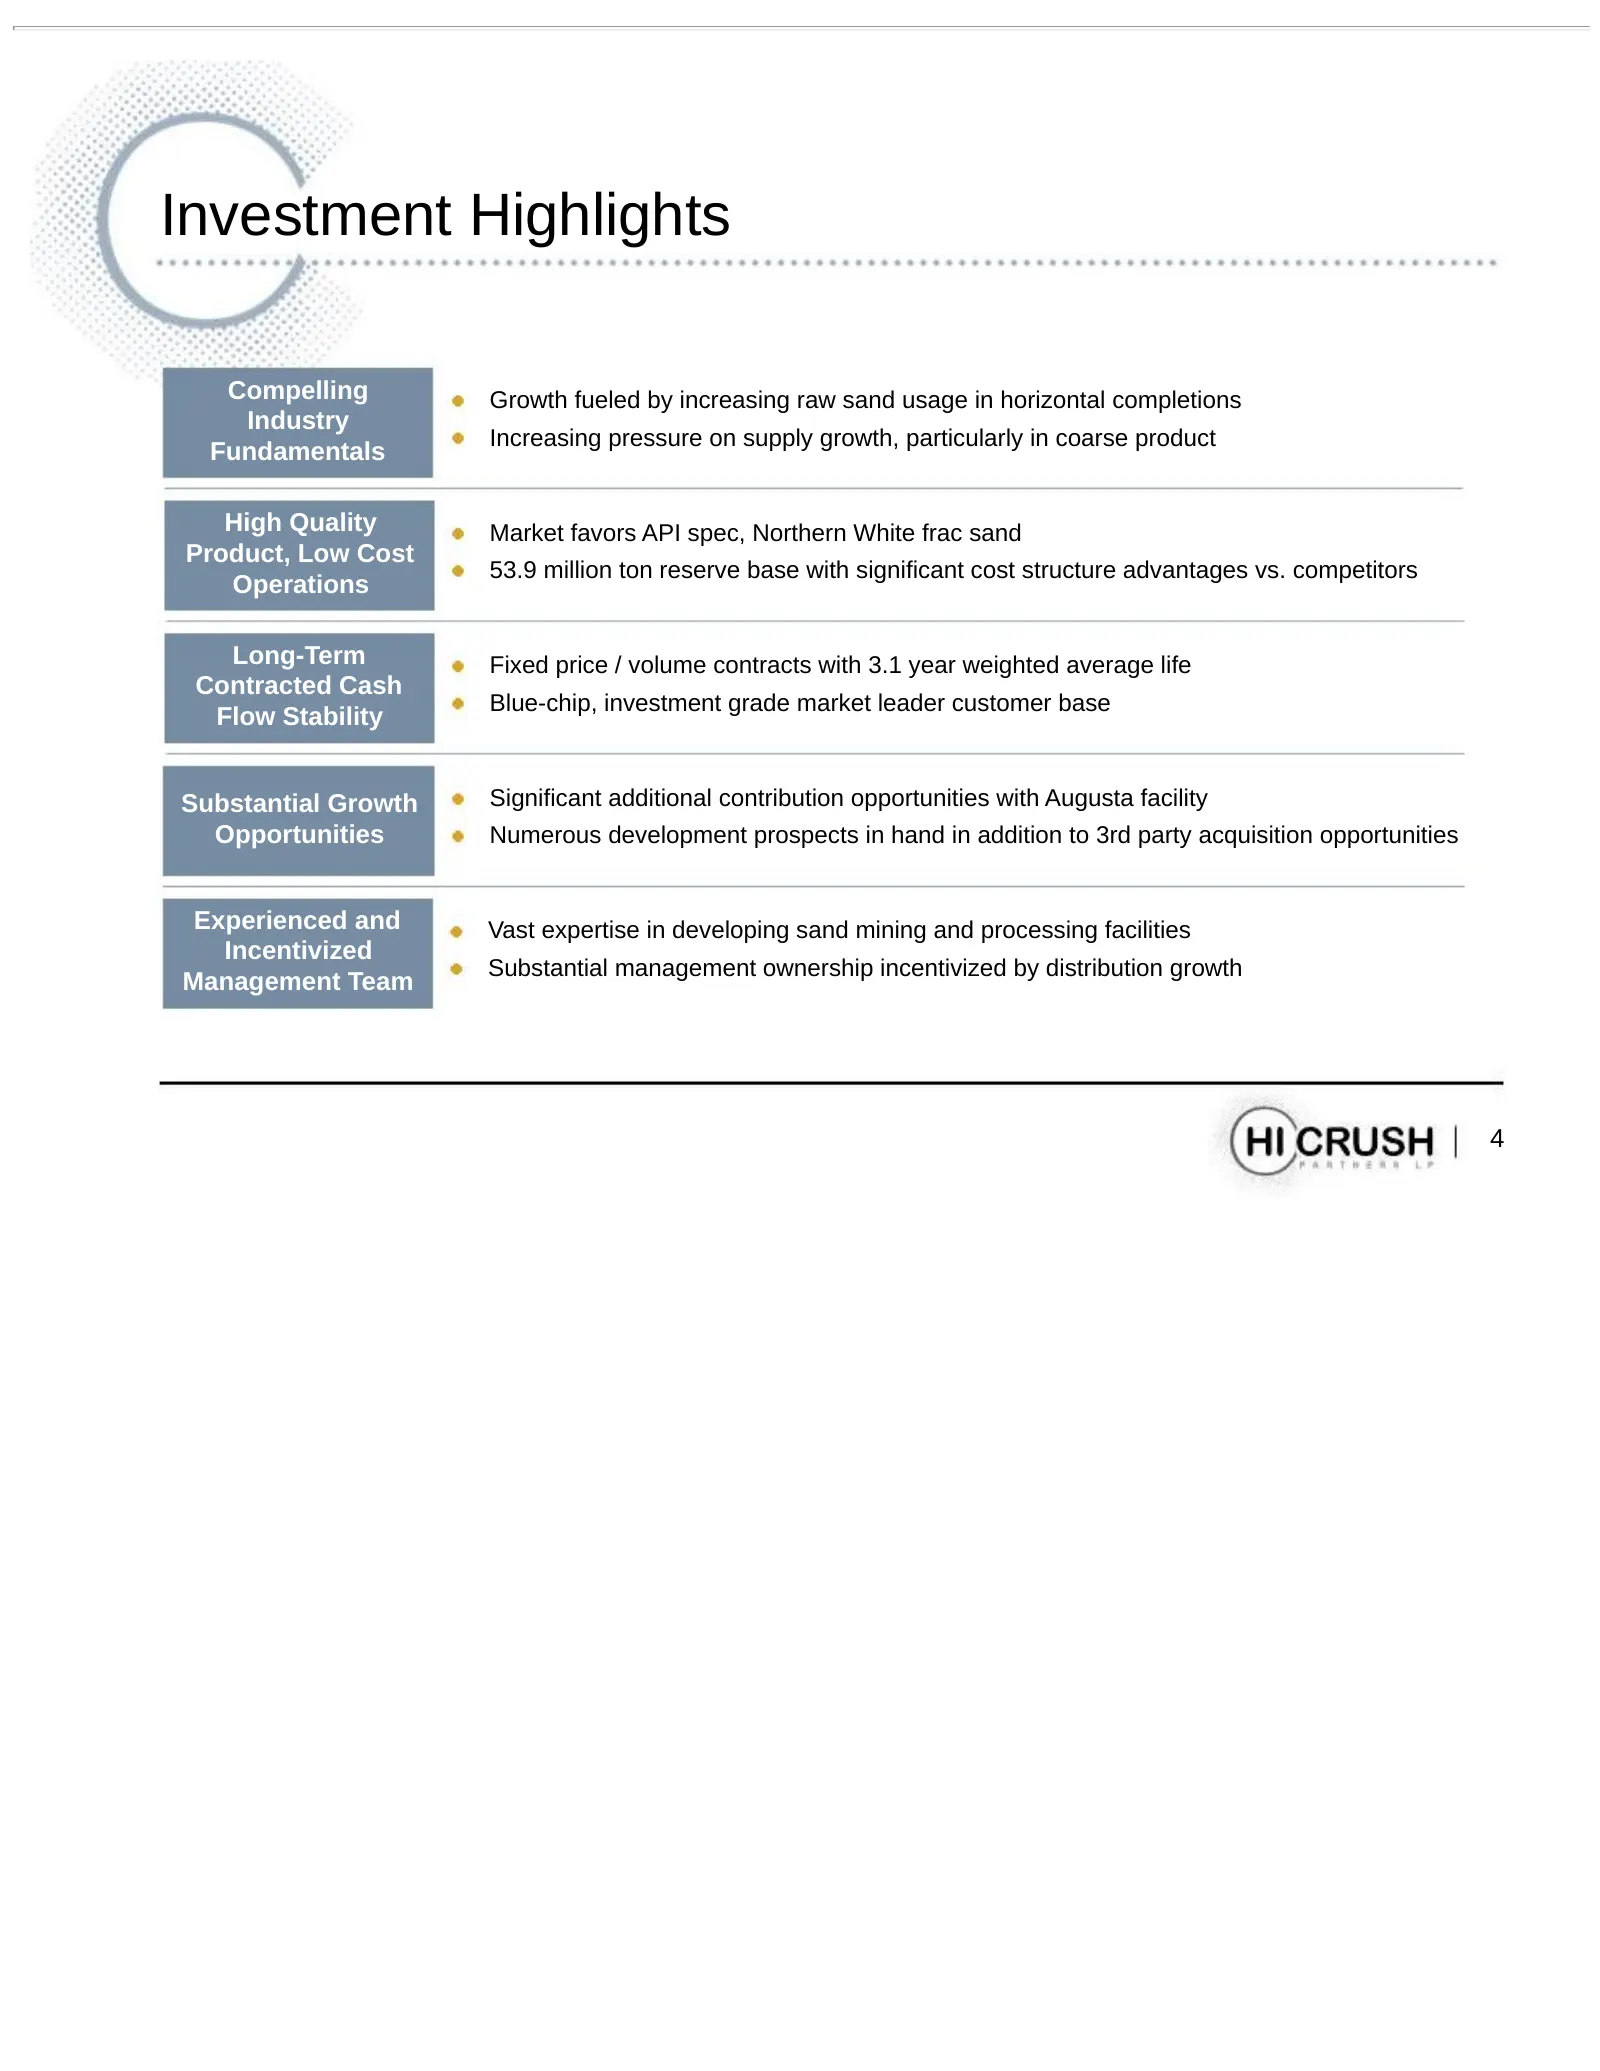
Slide 4: Investment Highlights
Investment Highlights Compelling Growth fueled by increasing raw sand usage in horizontal completions Industry Increasing pressure on supply growth, particularly in coarse product Fundamentals High Quality Market favors API spec, Northern White frac sand Product, Low Cost 53.9 million ton reserve ba
Slide 5: Proppants are Critical to Shale Revolution
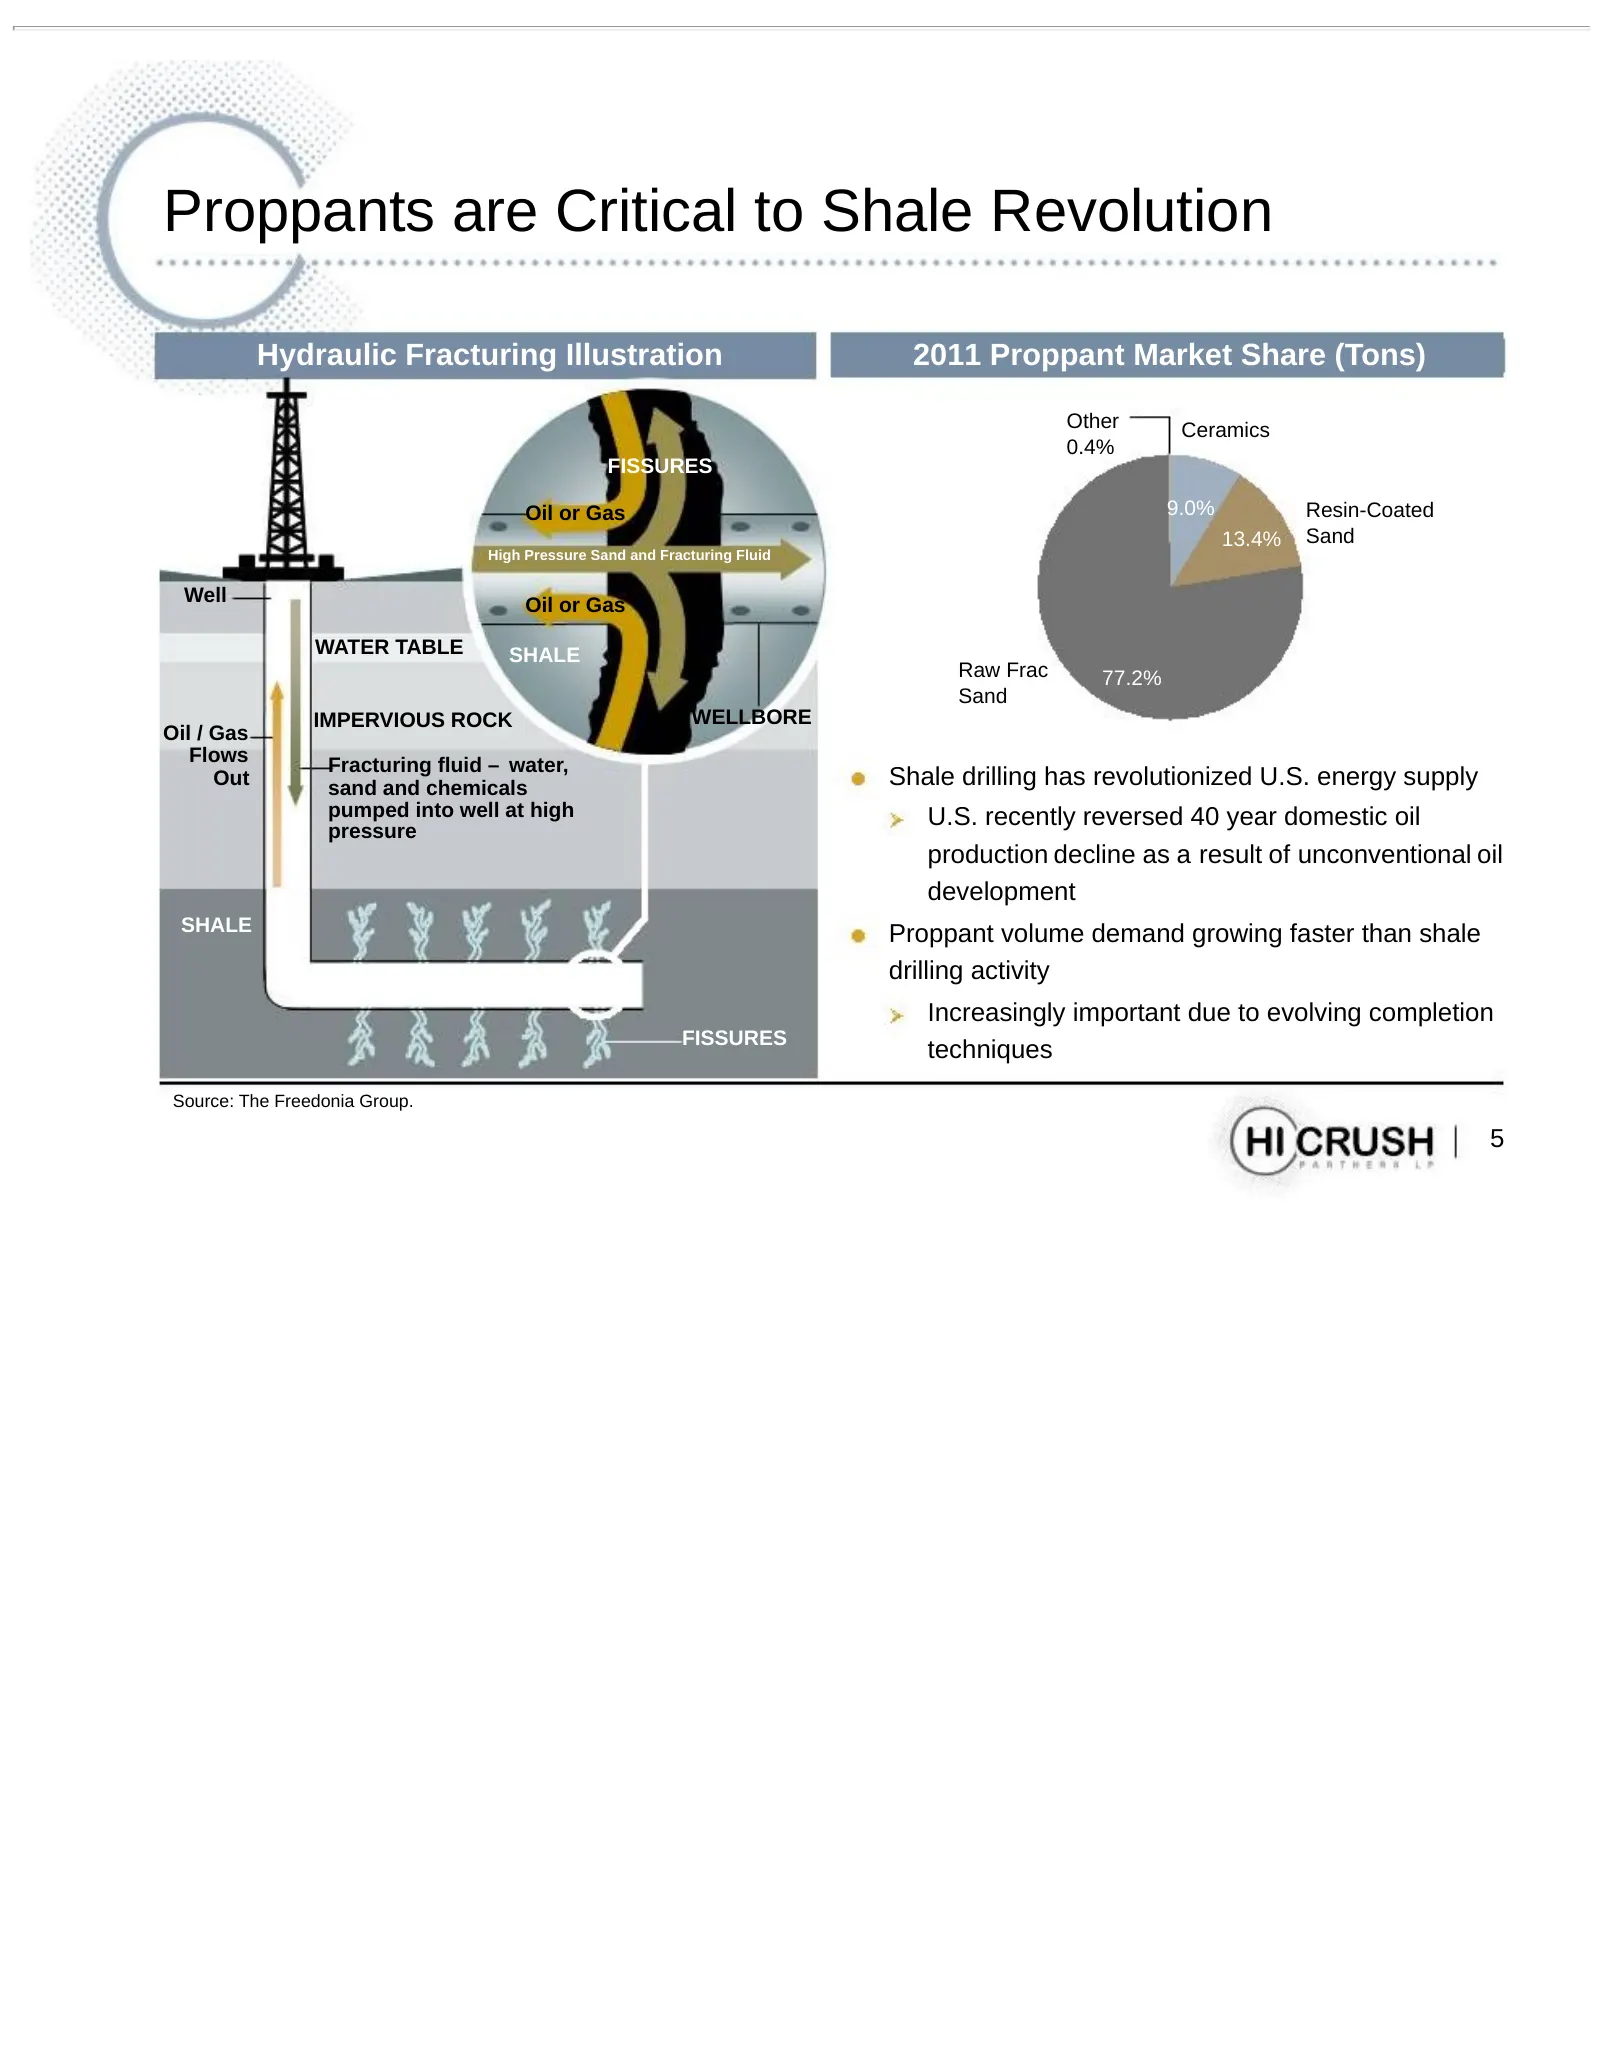
Proppants are Critical to Shale Revolution Hydraulic Fracturing Illustration 2011 Proppant Market Share (Tons) Other Ceramics 0.4% FISSURES Oil or Gas 9.0% Resin-Coated 13.4% Sand High Pressure Sand and Fracturing Fluid Well Oil or Gas WATER TABLE SHALE Raw Frac 77.2% Sand IMPERVIOUS ROCK WELLBORE O
Slide 6: Rapidly Growing Proppant Industry
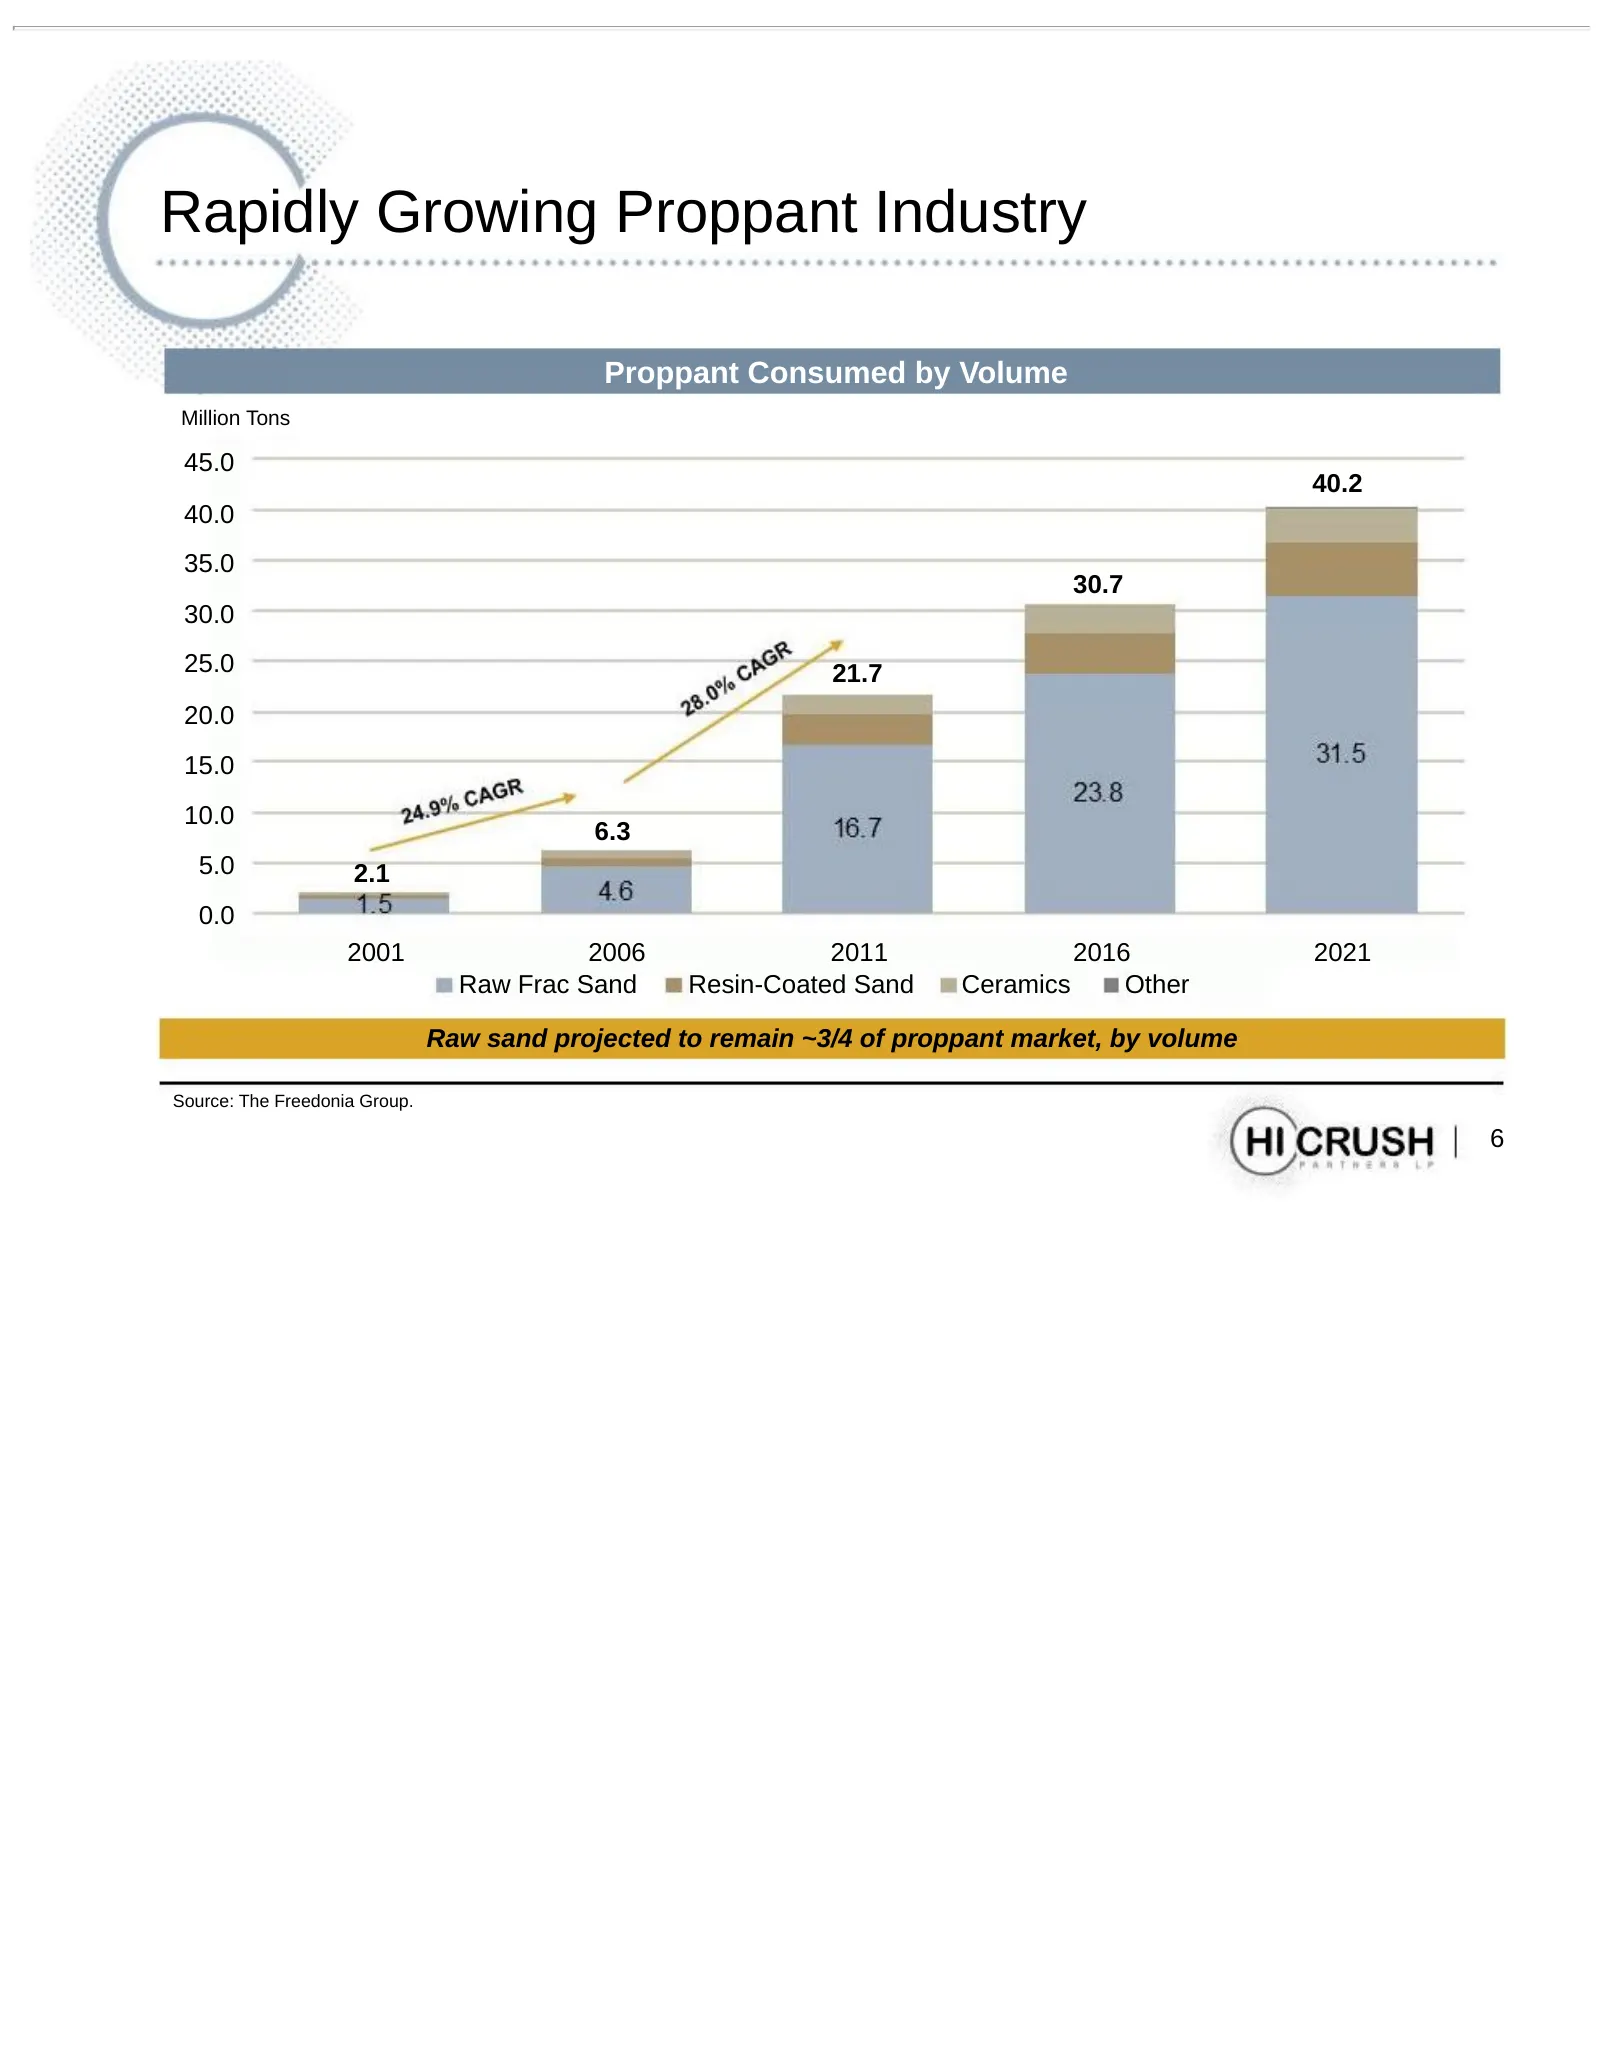
Rapidly Growing Proppant Industry Proppant Consumed by Volume Million Tons 45.0 40.2 40.0 35.0 30.7 30.0 25.0 21.7 20.0 15.0 10.0 6.3 5.0 2.1 0.0 2001 2006 2011 2016 2021 Raw Frac Sand Resin-Coated Sand Ceramics Other Raw sand projected to remain ~3/4 of proppant market, by volume Source: The Freedo
Slide 7: New Entrants Face Multiple Hurdles
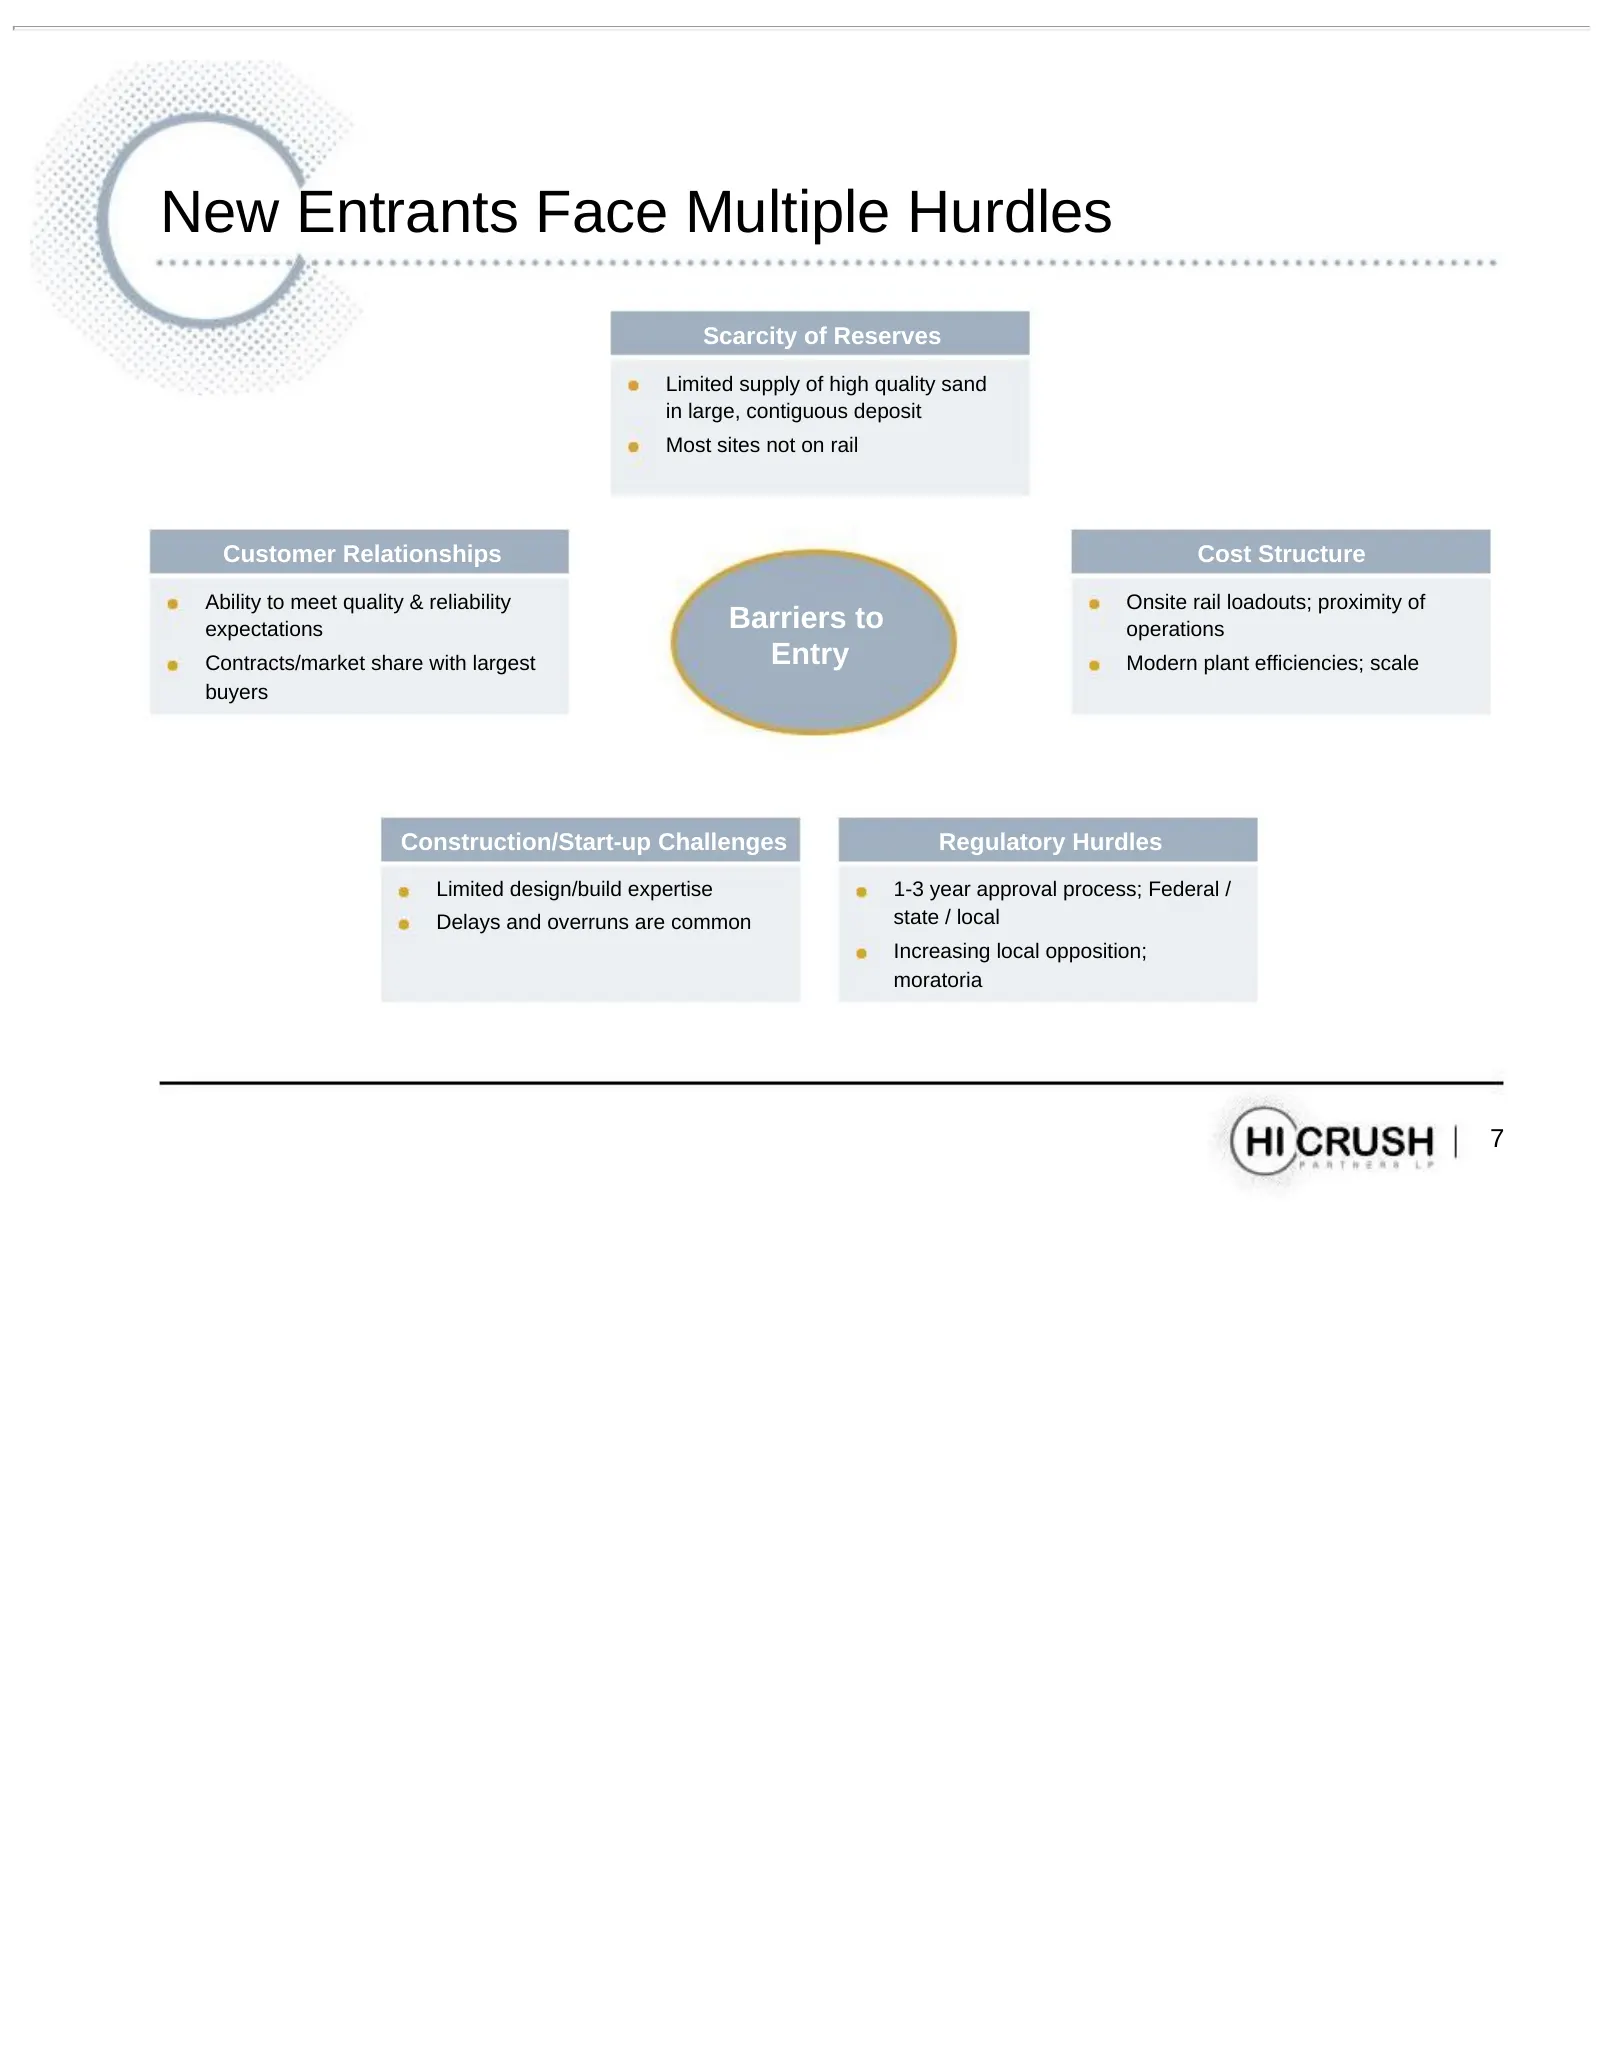
New Entrants Face Multiple Hurdles Scarcity of Reserves Limited supply of high quality sand in large, contiguous deposit Most sites not on rail Customer Relationships Cost Structure Ability to meet quality & reliability Onsite rail loadouts; proximity of expectations Barriers to operations Contracts
Slide 8: Hi-Crush Management: Experience in Key Areas
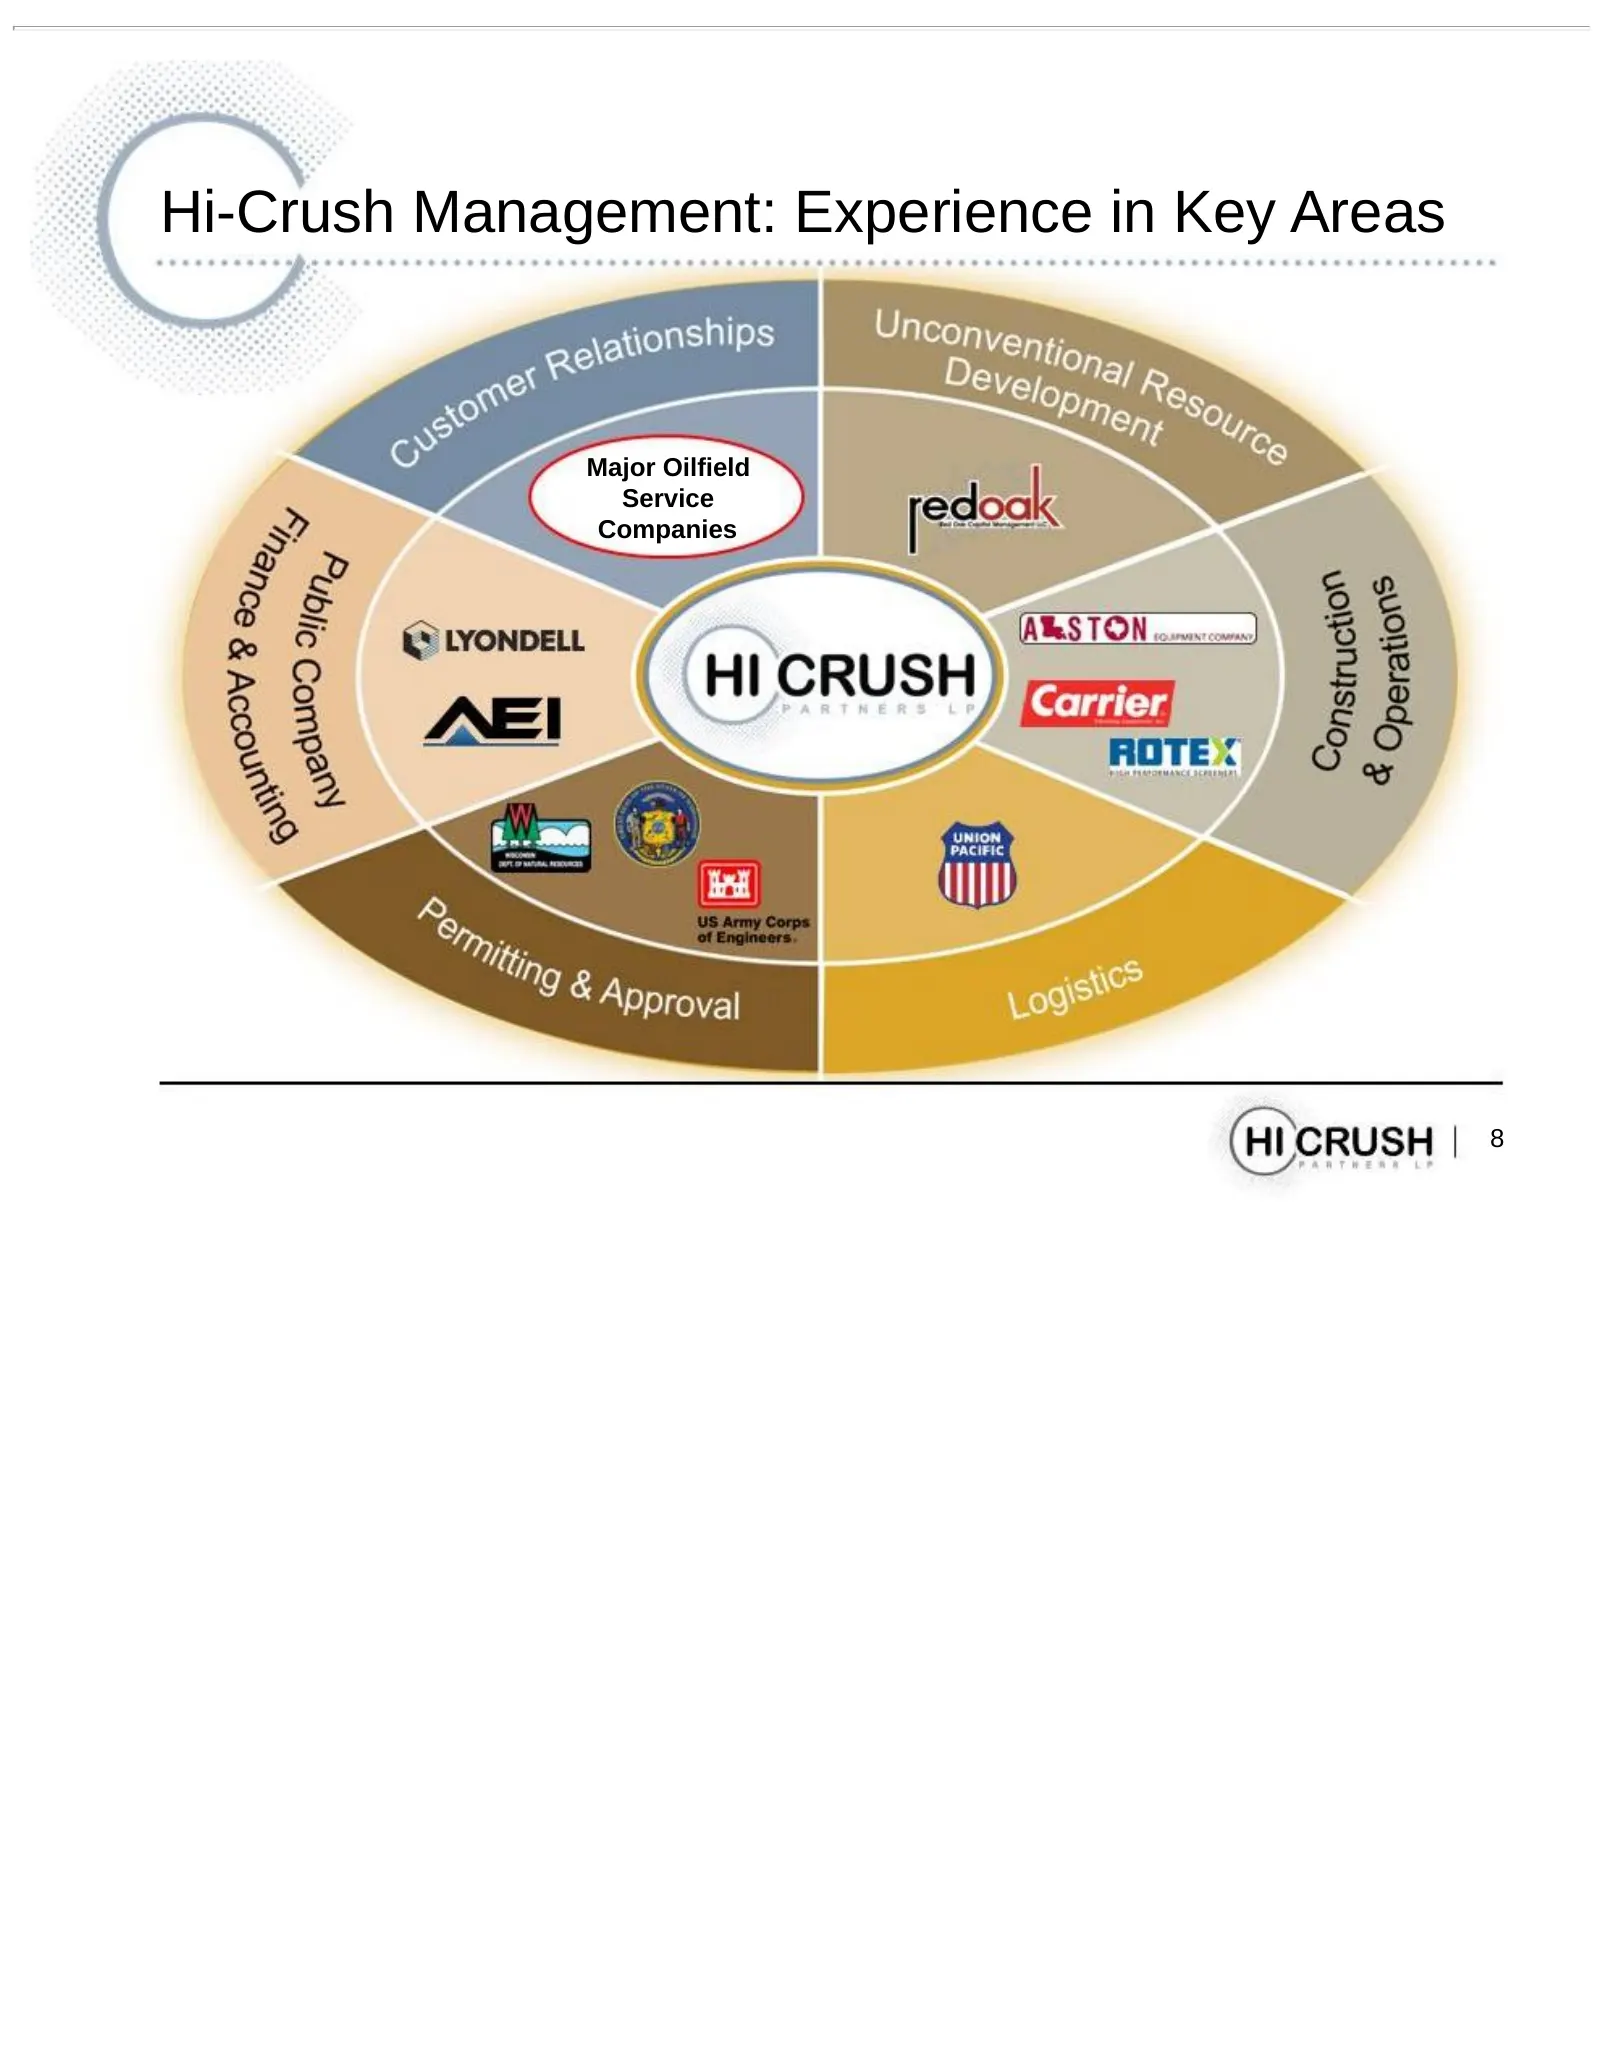
Hi-Crush Management: Experience in Key Areas Major Oilfield Service Companies 8
Slide 9: Wyeville: Our Foundation Asset
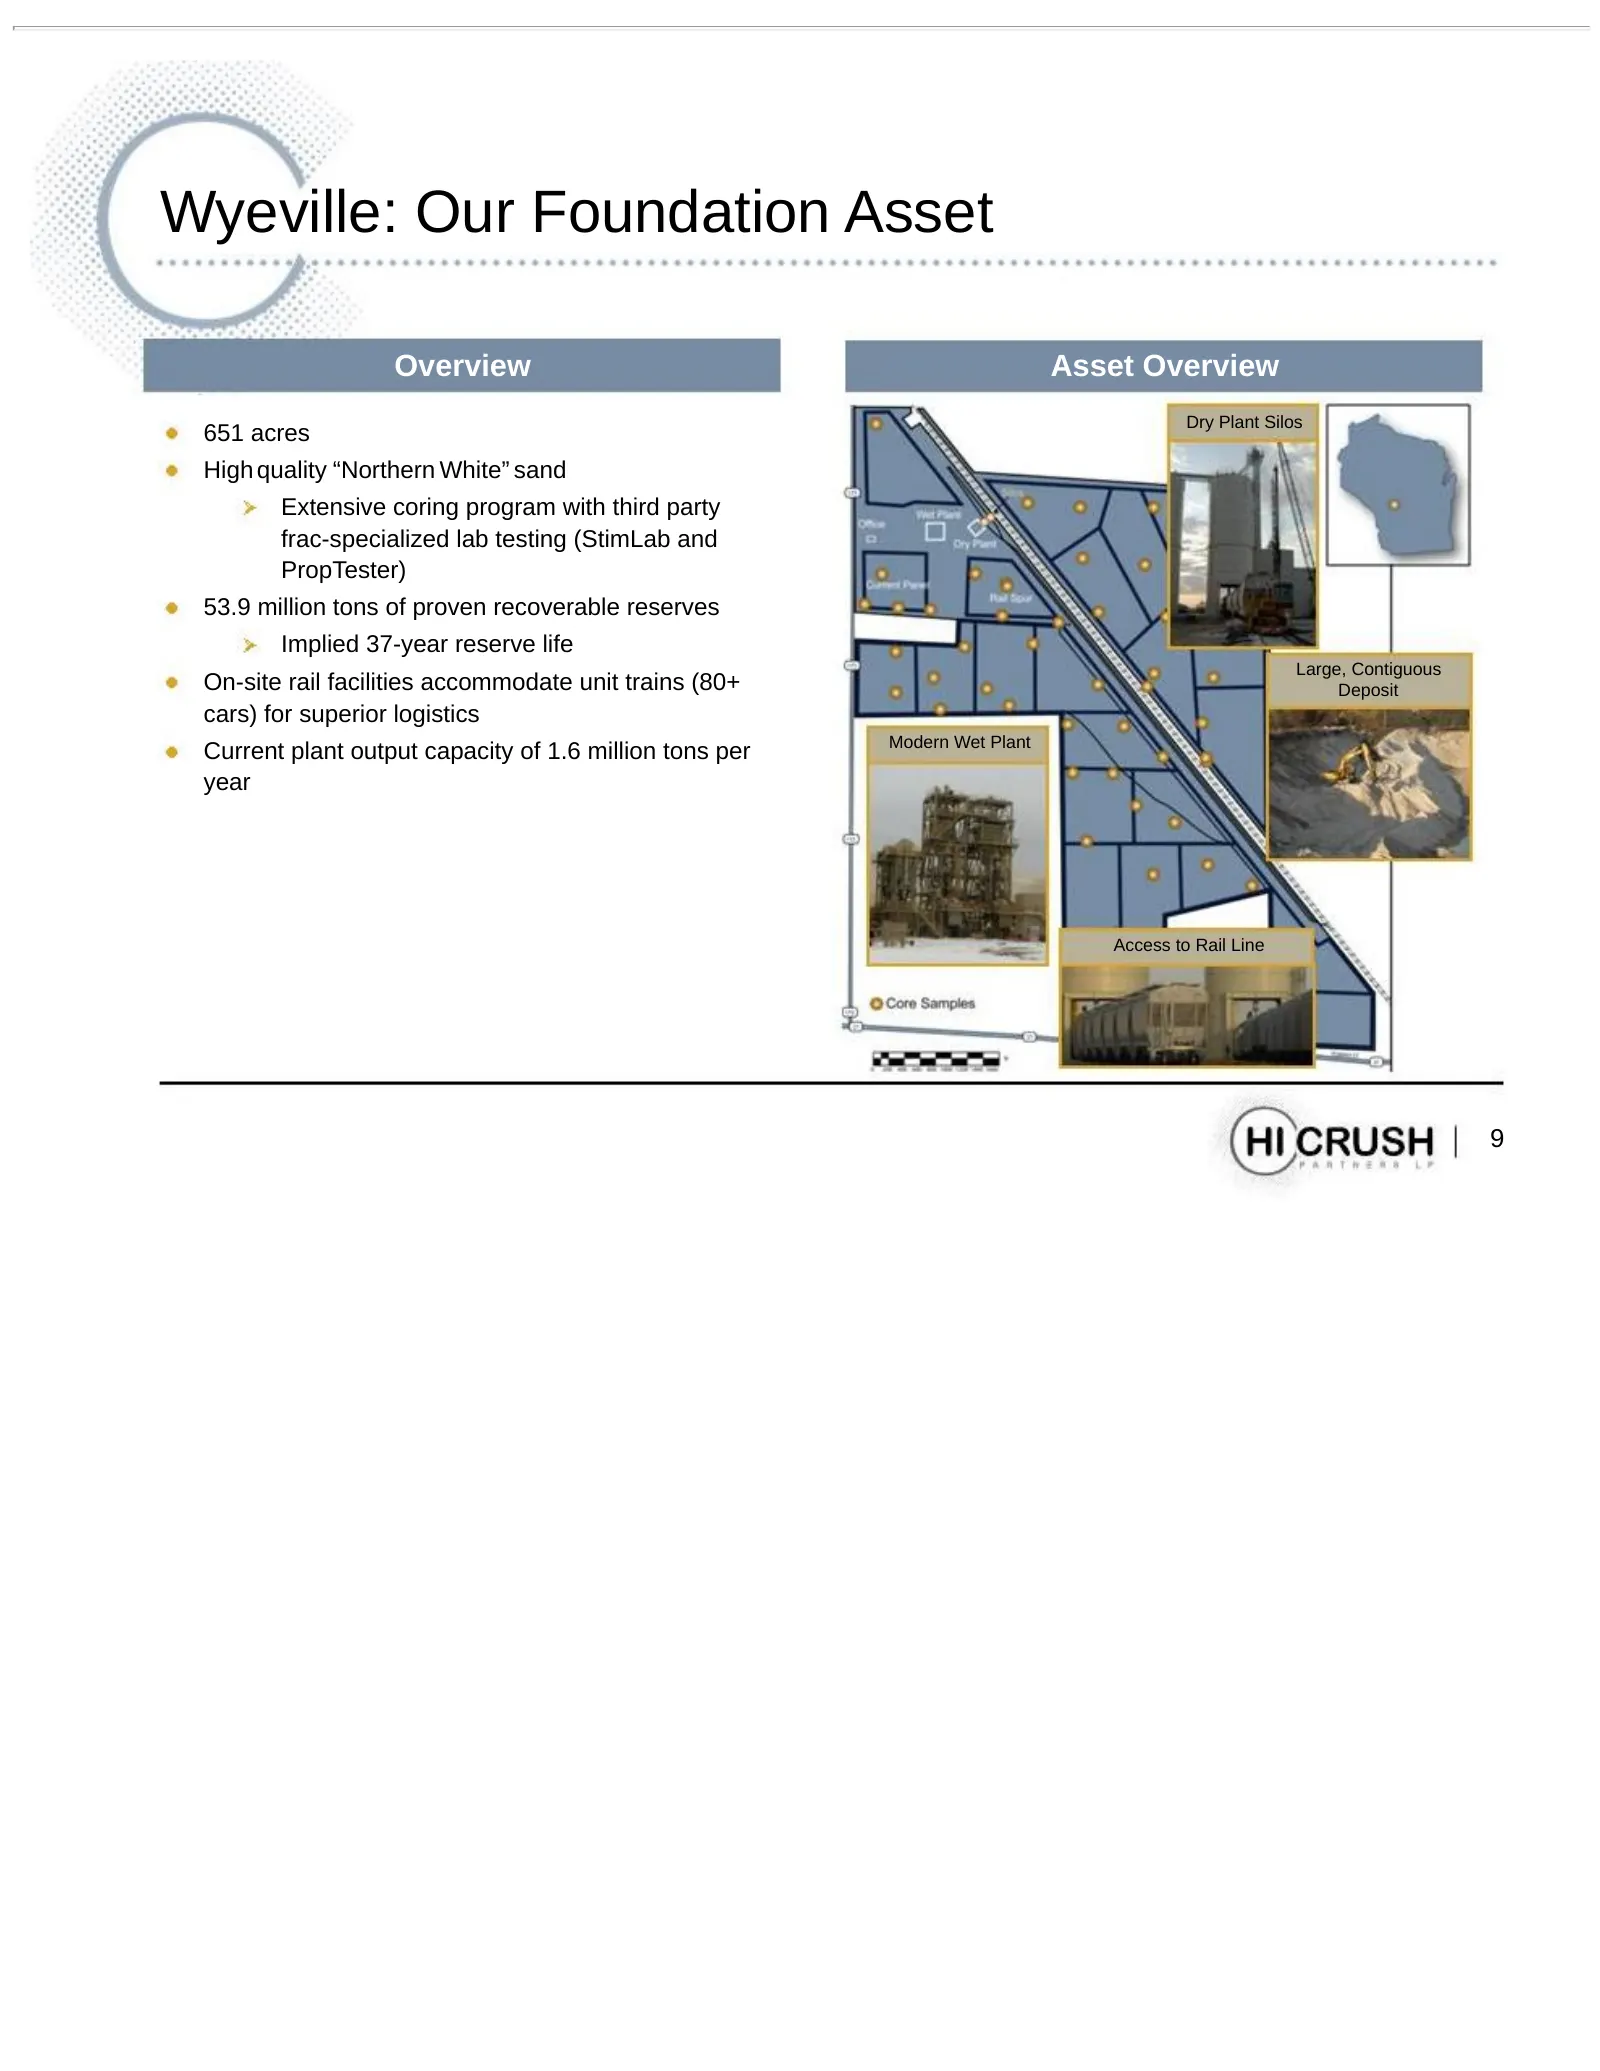
Wyeville: Our Foundation Asset Overview Asset Overview Dry Plant Silos 651 acres High quality “Northern White” sand Extensive coring program with third party frac-specialized lab testing (StimLab and PropTester) 53.9 million tons of proven recoverable reserves Implied 37-year reserve life Large, Con
Slide 10: Critical Logistics Capabilities
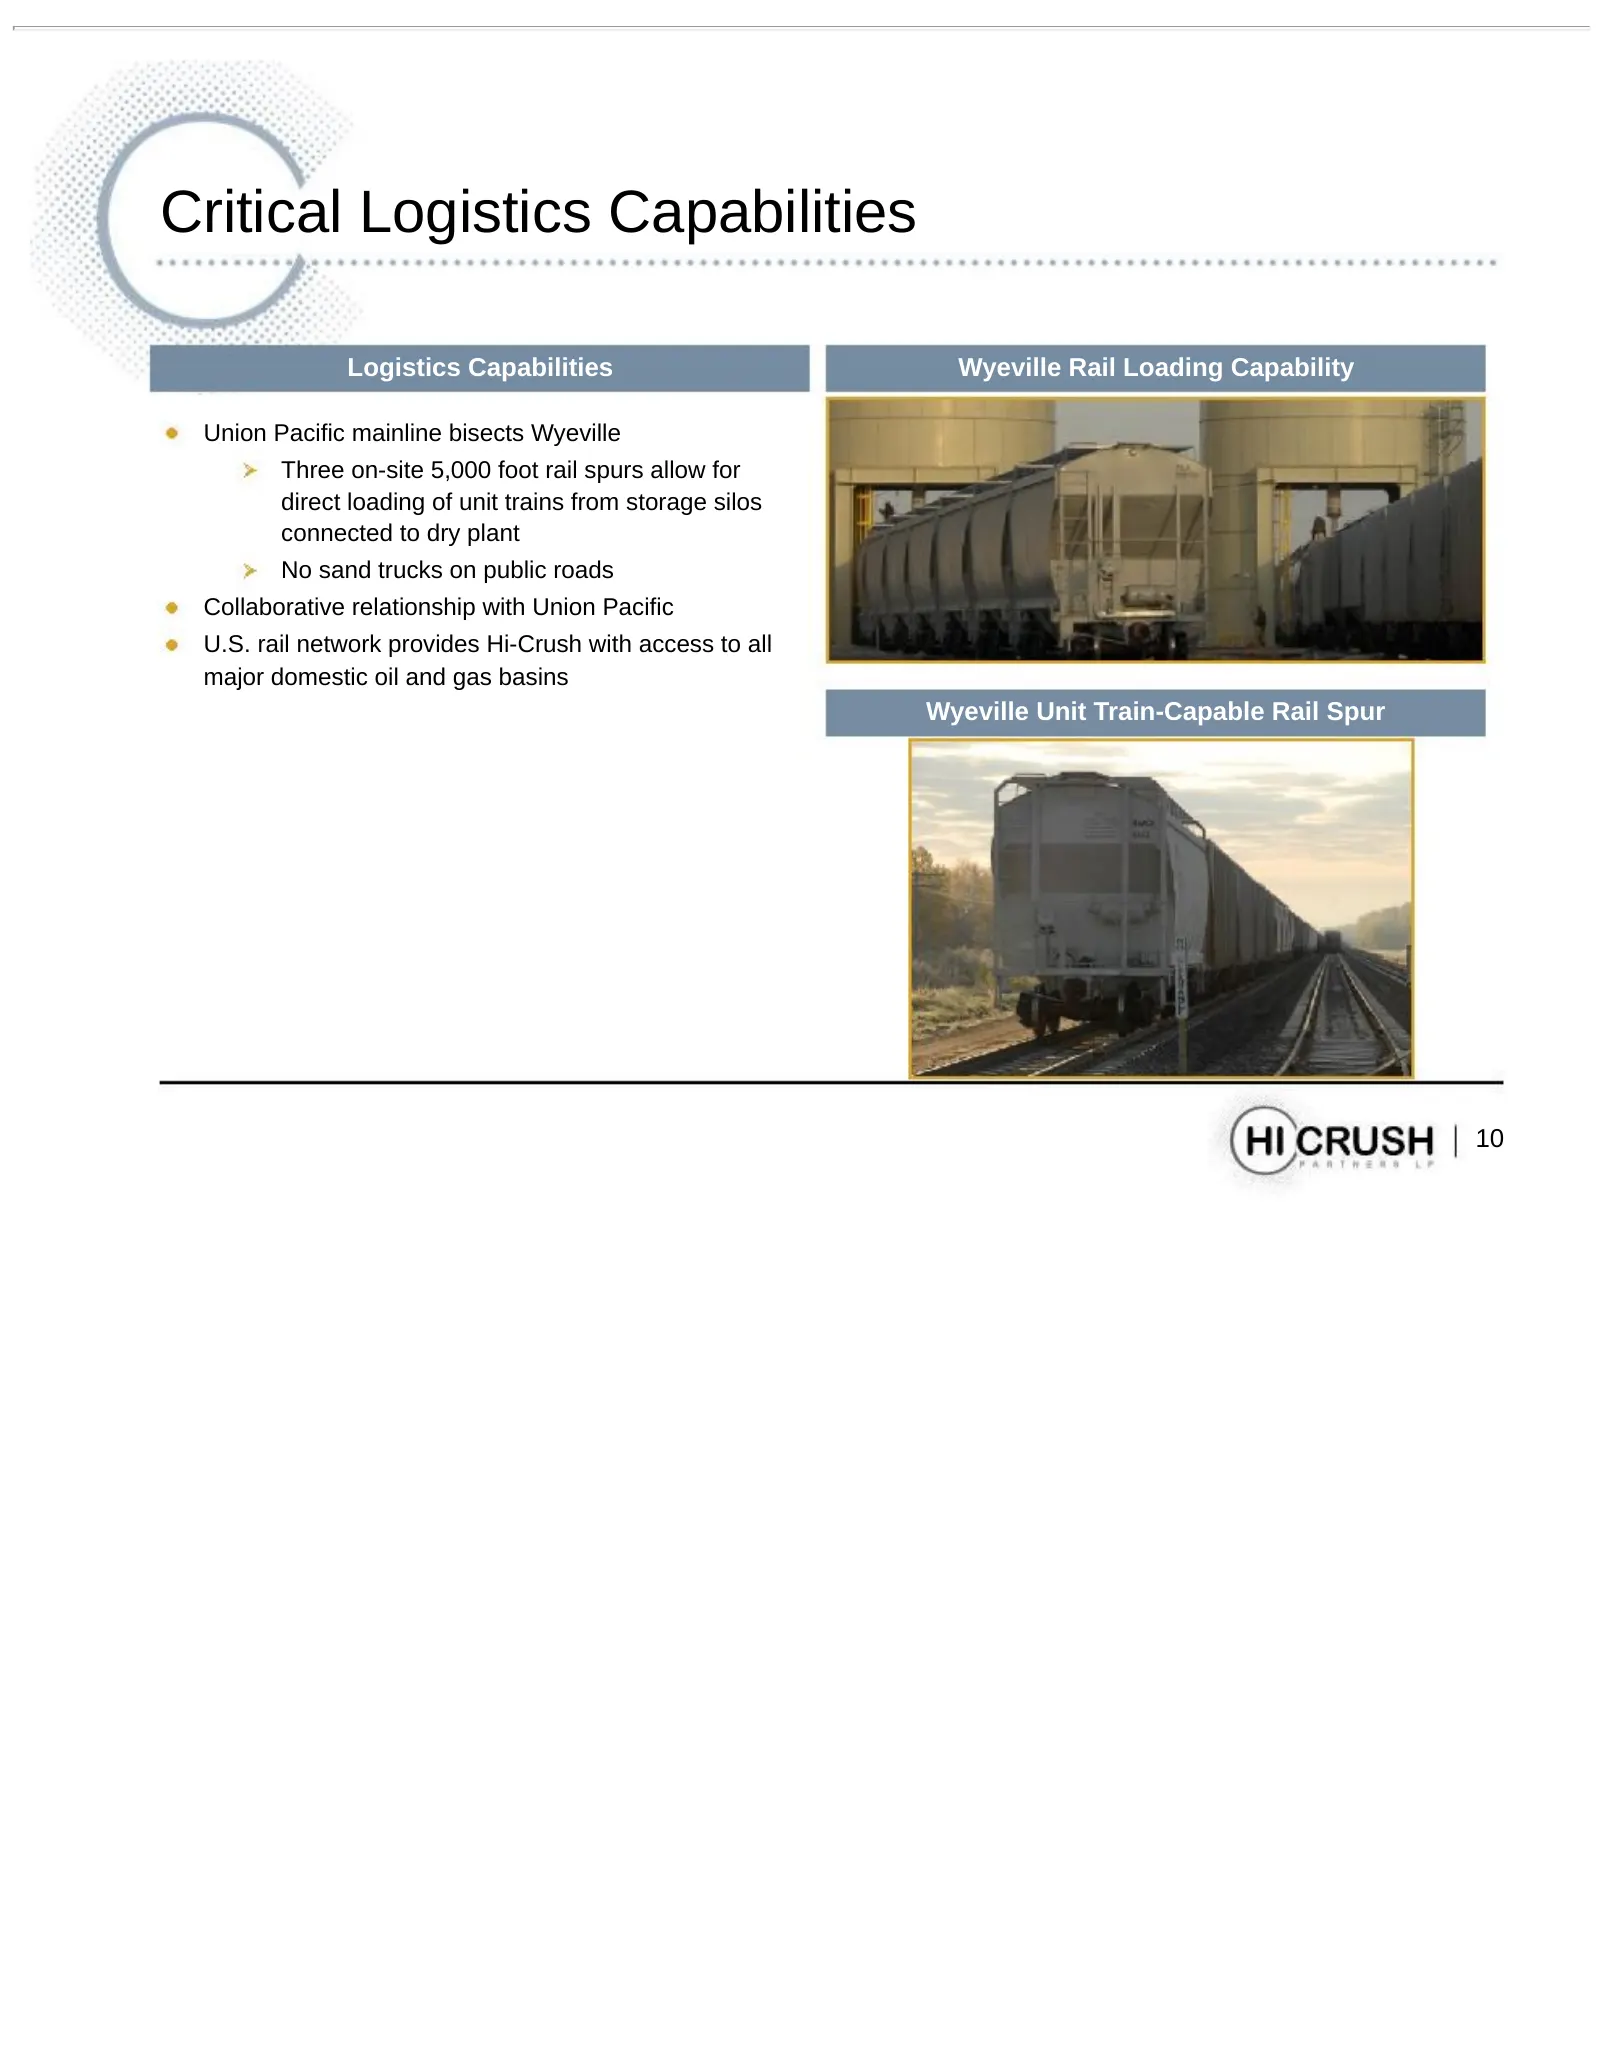
Critical Logistics Capabilities Logistics Capabilities Wyeville Rail Loading Capability Union Pacific mainline bisects Wyeville Three on-site 5,000 foot rail spurs allow for direct loading of unit trains from storage silos connected to dry plant No sand trucks on public roads Collaborative relations
Slide 11: HCLP Sand Destinations
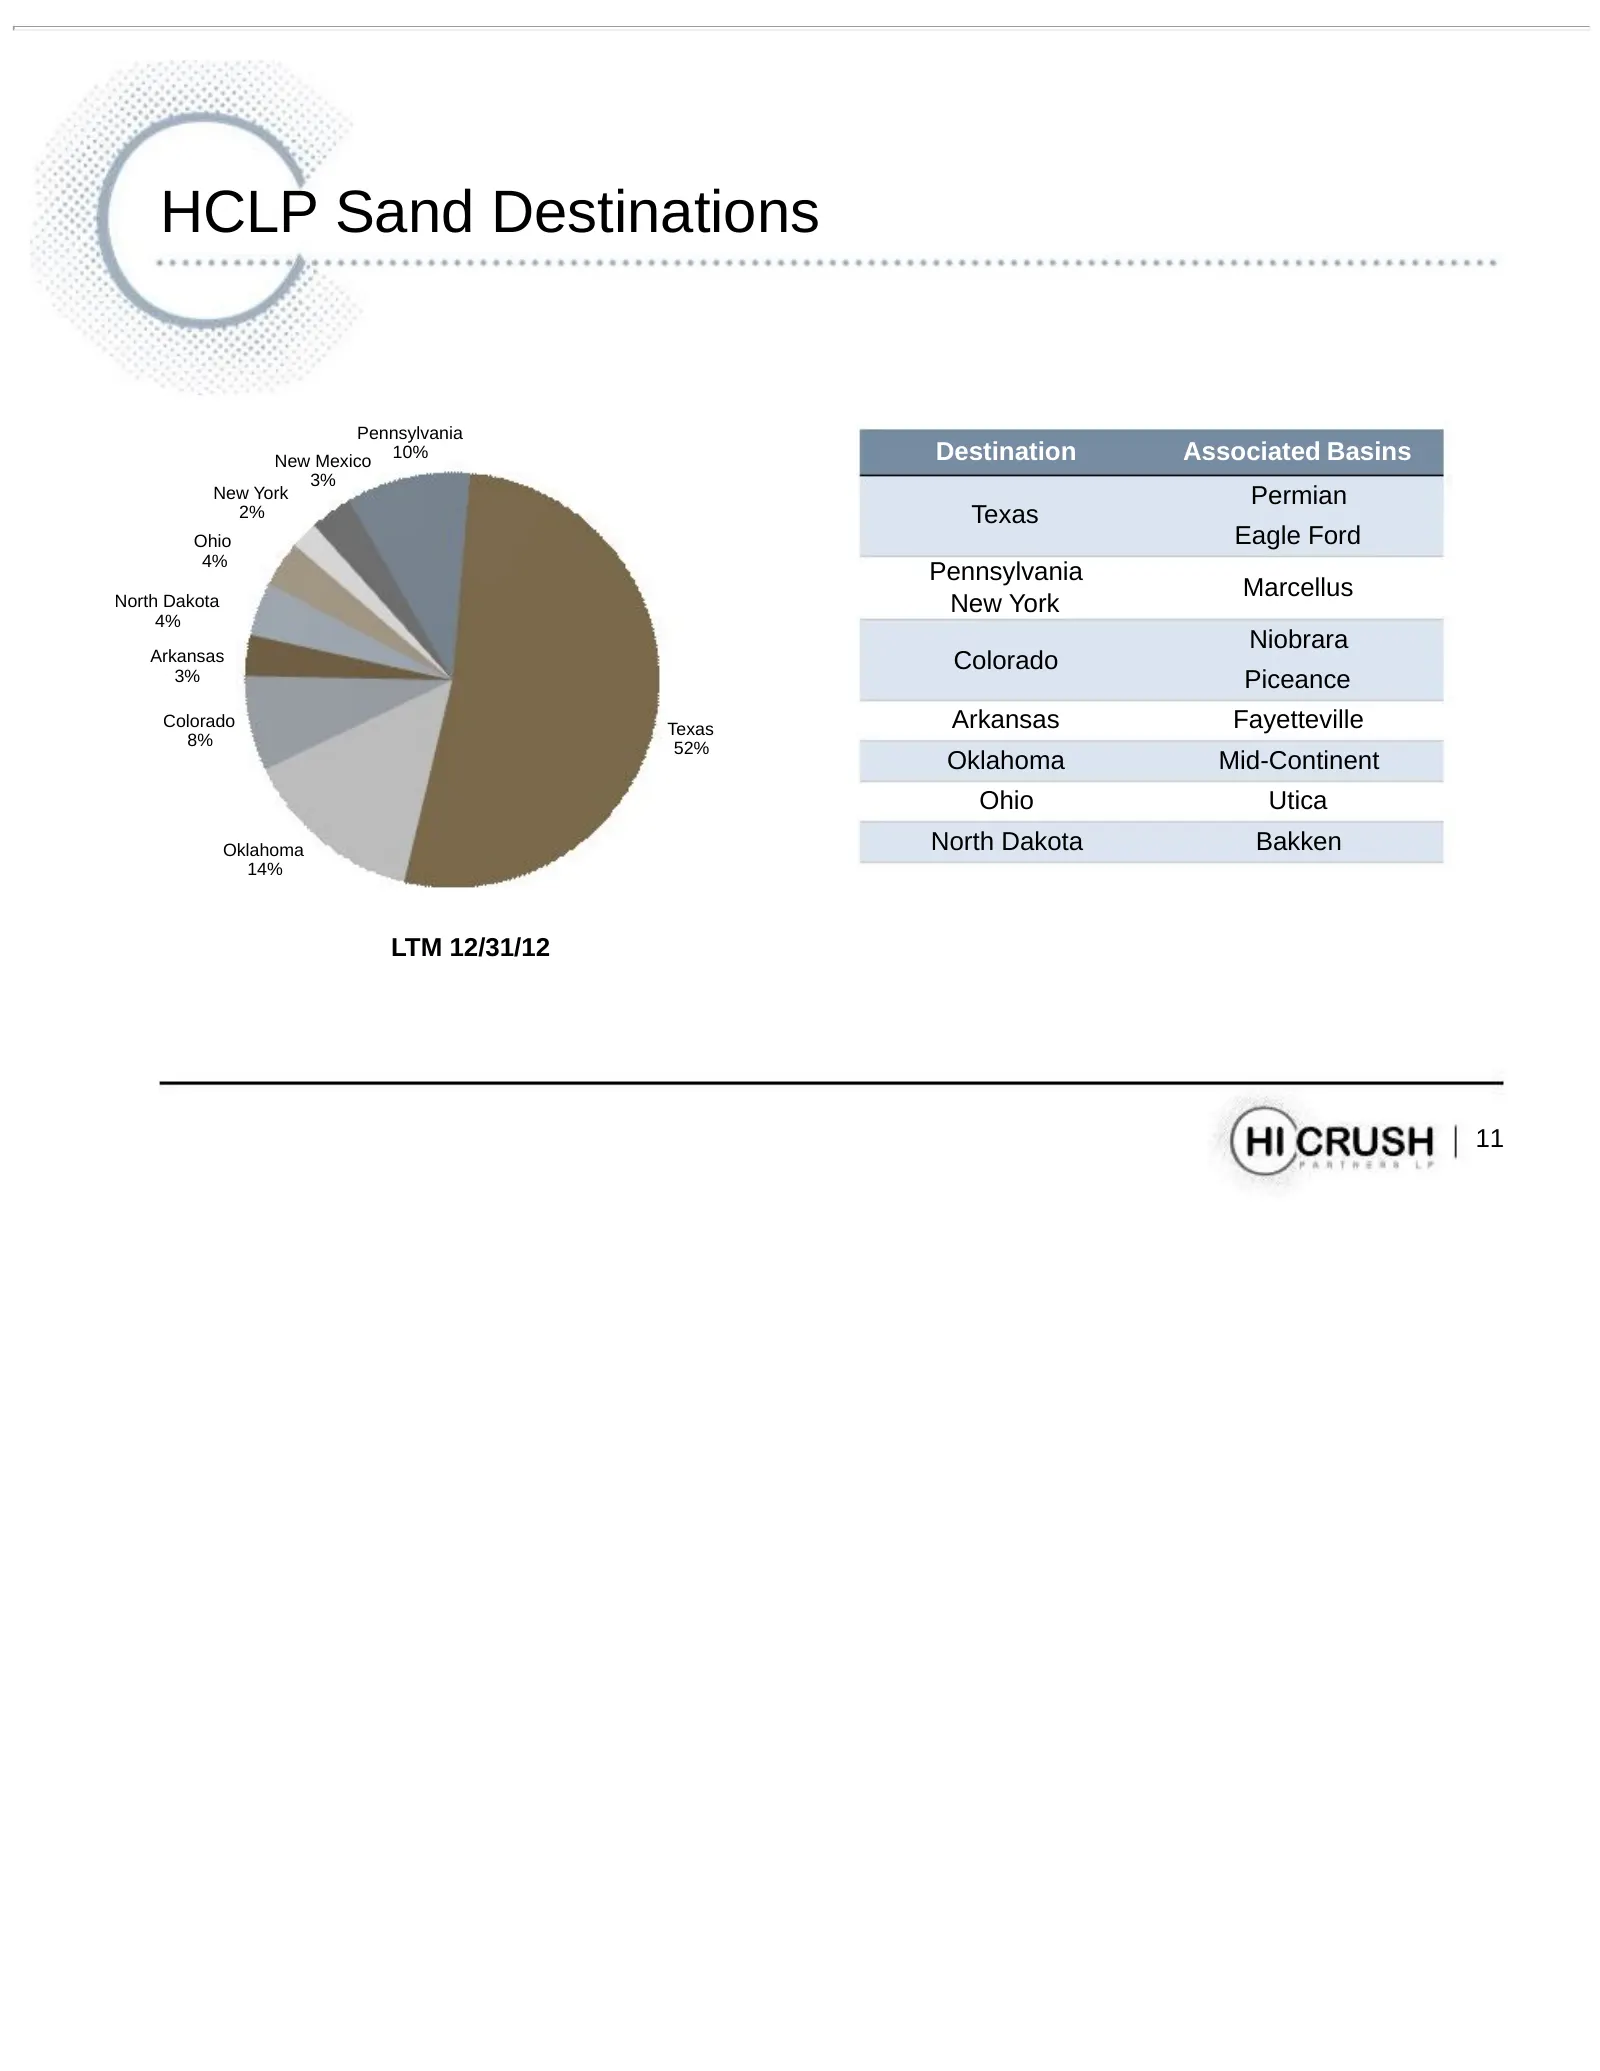
HCLP Sand Destinations Pennsylvania New Mexico 10% Destination Associated Basins 3% New York Permian 2% Texas Ohio Eagle Ford 4% Pennsylvania Marcellus North Dakota New York 4% Niobrara Arkansas Colorado 3% Piceance Colorado Texas Arkansas Fayetteville 8% 52% Oklahoma Mid-Continent Ohio Utica Oklaho
Slide 12: Low-Cost Producer
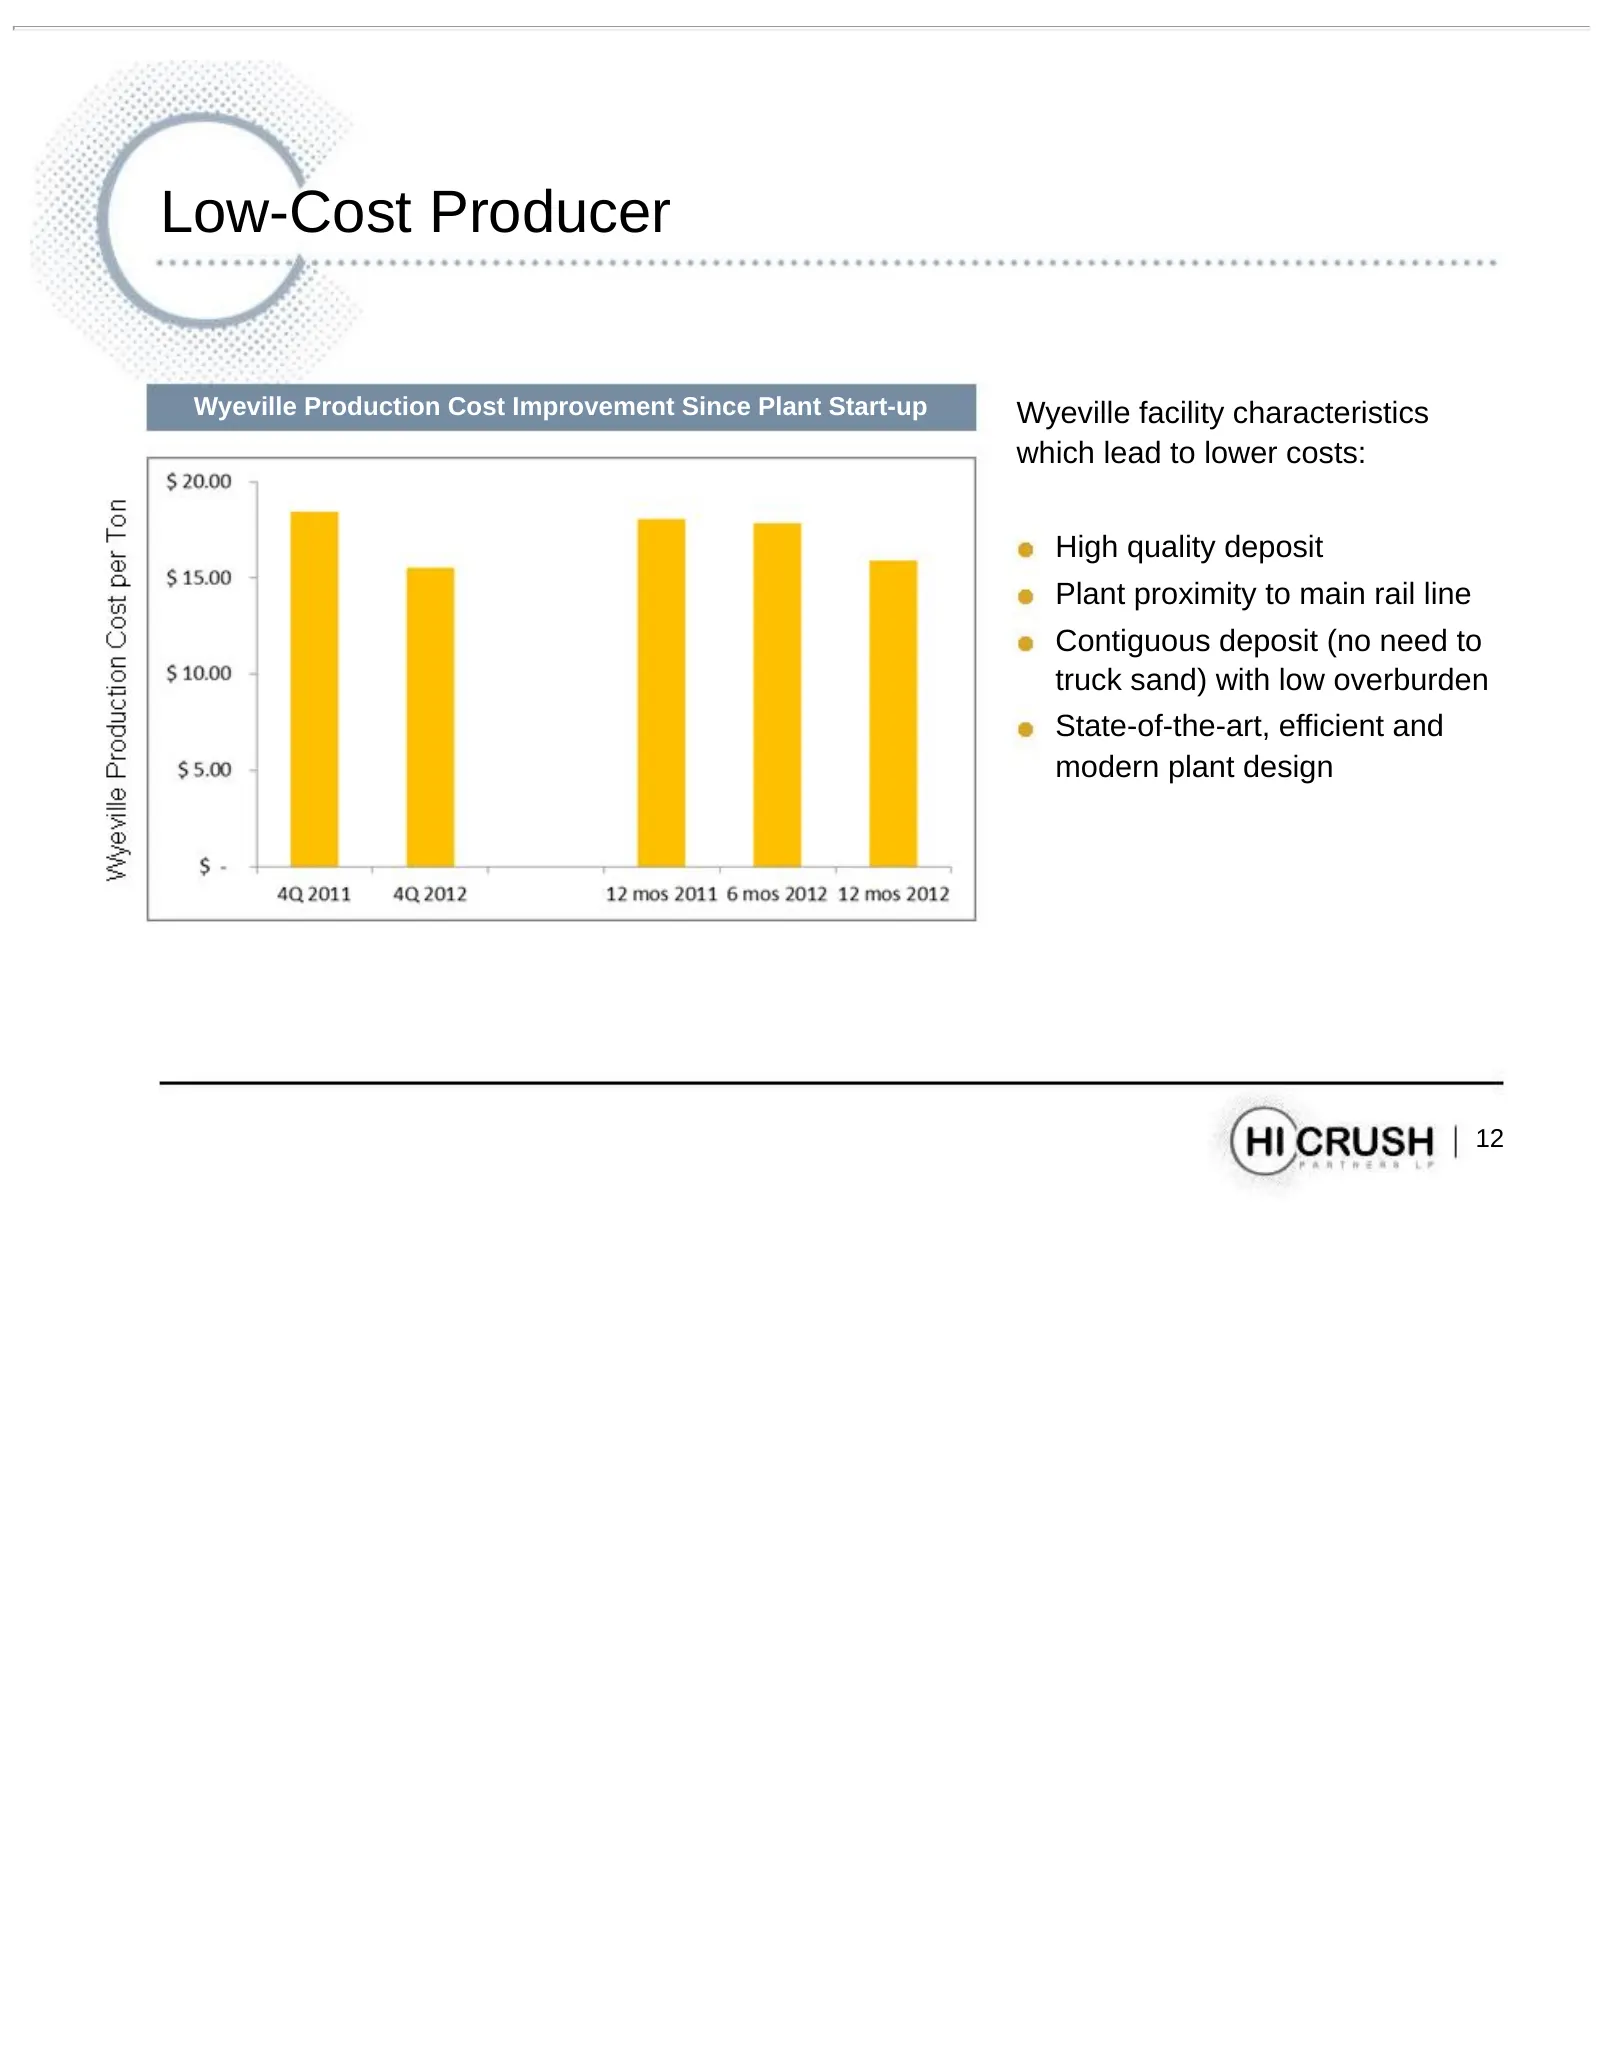
Low-Cost Producer Wyeville Production Cost Improvement Since Plant Start-up Wyeville facility characteristics which lead to lower costs: High quality deposit Plant proximity to main rail line Contiguous deposit (no need to truck sand) with low overburden State-of-the-art, efficient and modern plant
Slide 13: Market Trends
Market Trends • Appetite for premium white sand is increasing and continues to gain market share • E&Ps increasing well complexity • Service companies continue to make gains in drilling efficiencies • Customers increasingly need proppant providers to be able to “spec-in” immediately • Technology dri
Slide 14: Asset Contribution Announced January 31
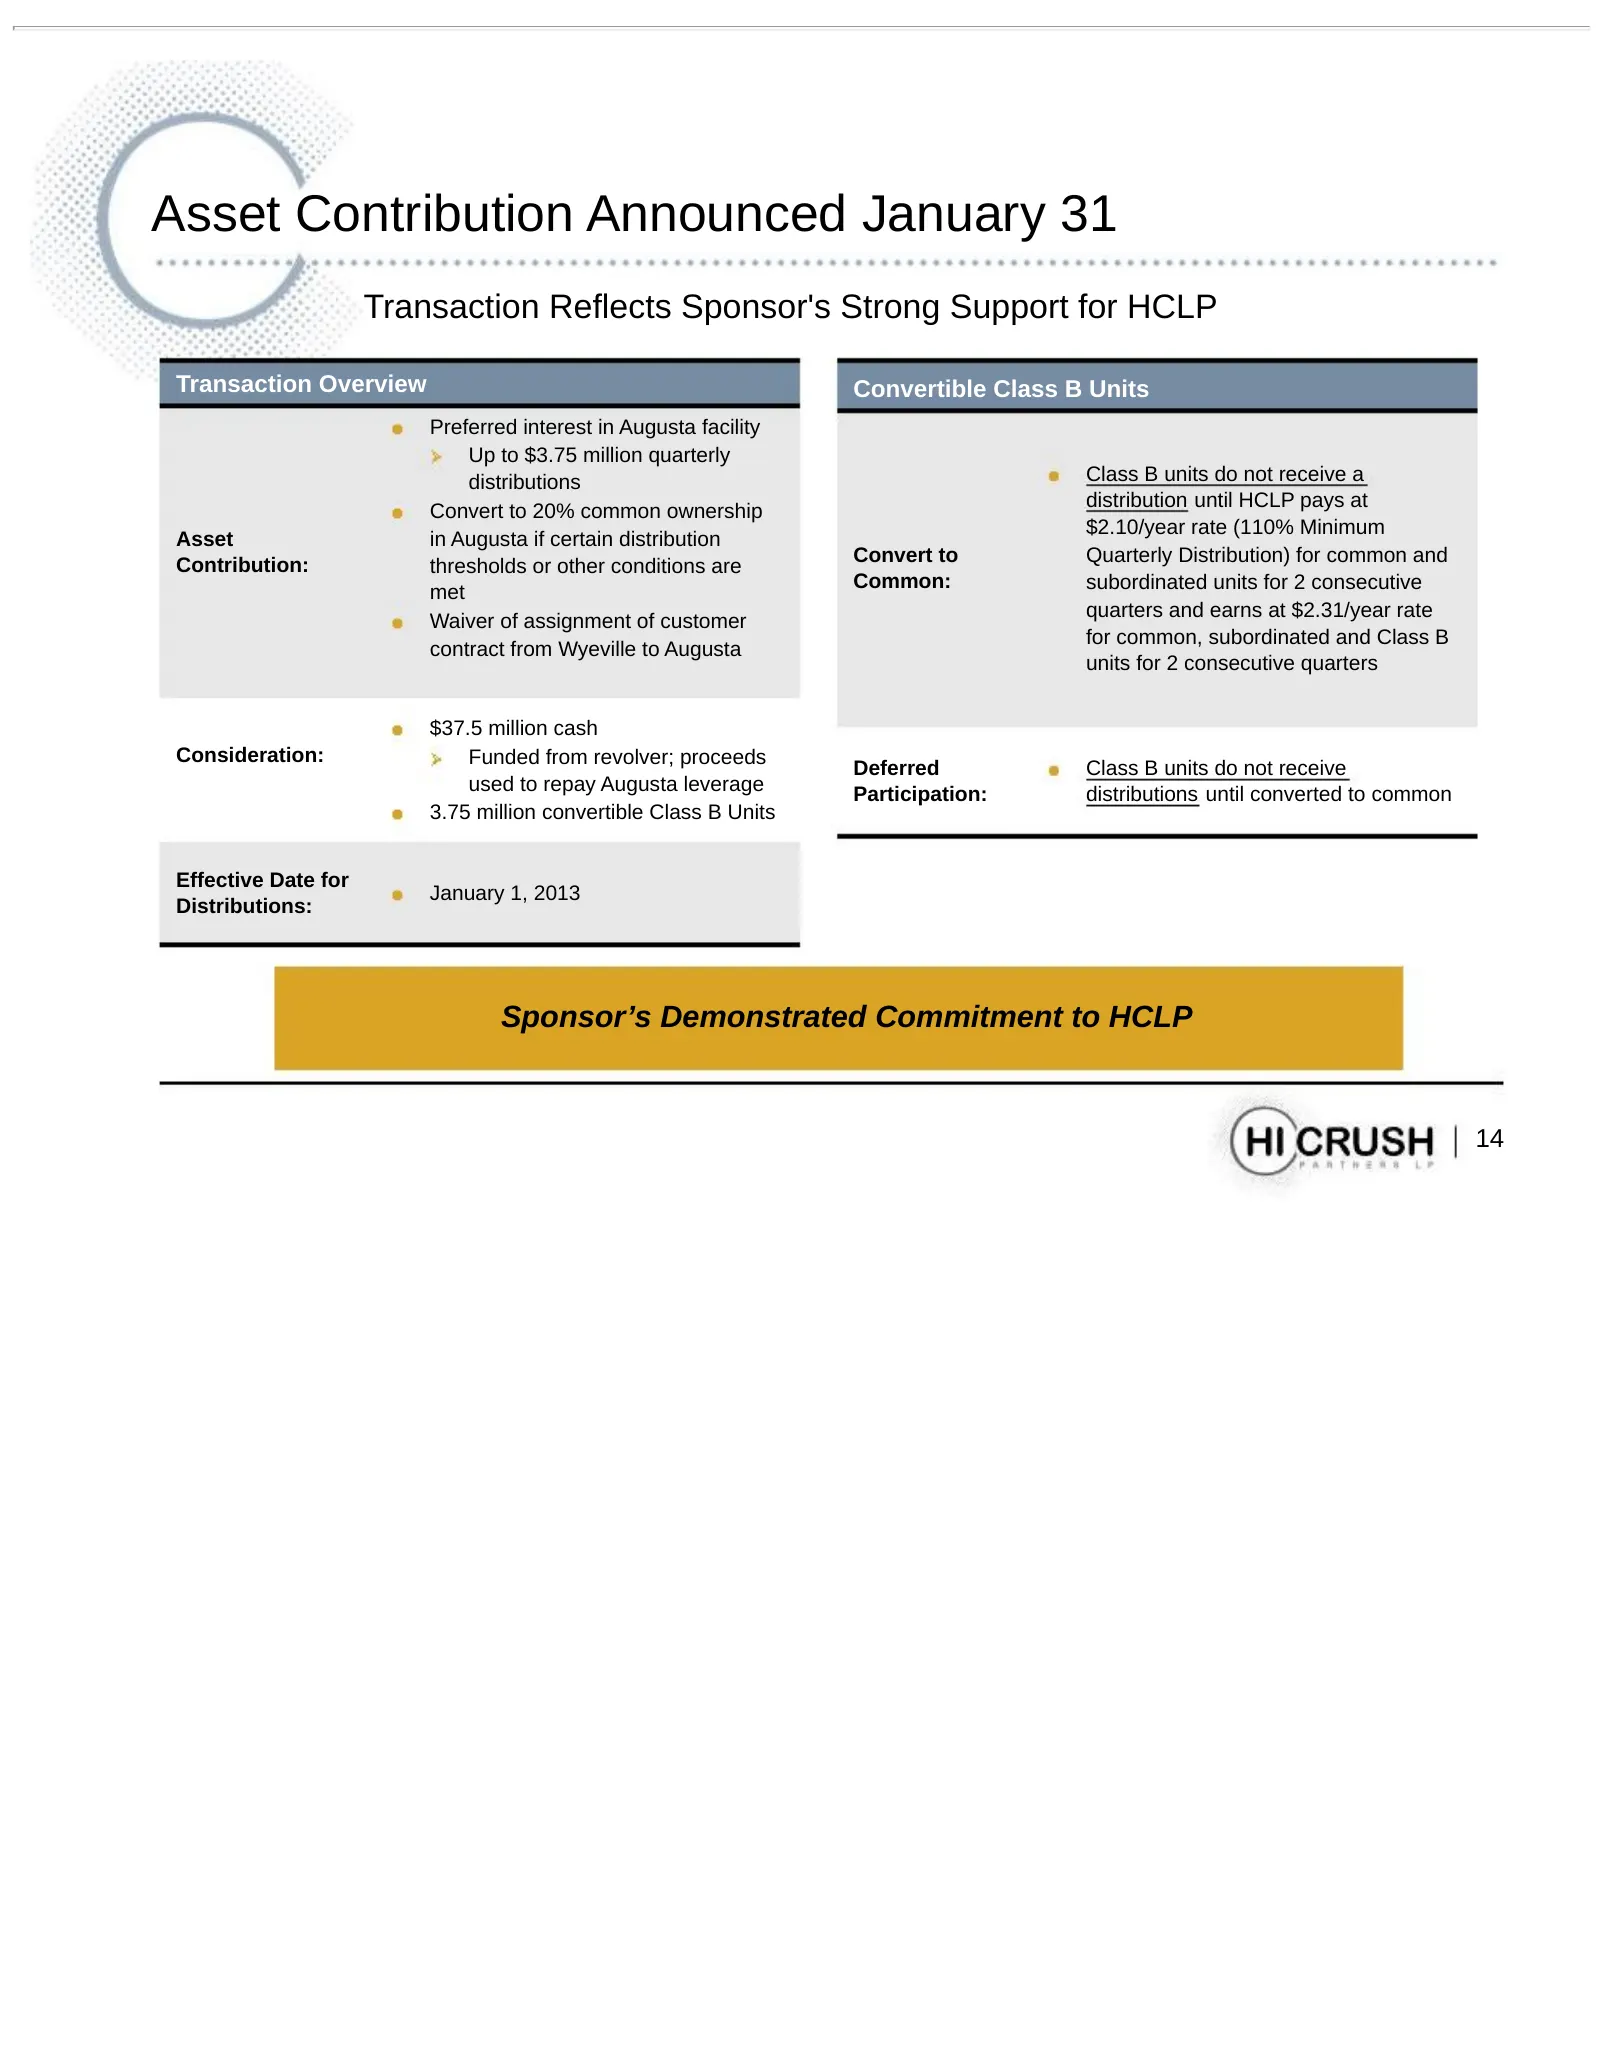
Asset Contribution Announced January 31 Transaction Reflects Sponsor's Strong Support for HCLP Transaction Overview Convertible Class B Units Preferred interest in Augusta facility Up to $3.75 million quarterly distributions Class B units do not receive a distribution until HCLP pays at Convert to 2
Slide 15: Augusta: Growth Vehicle
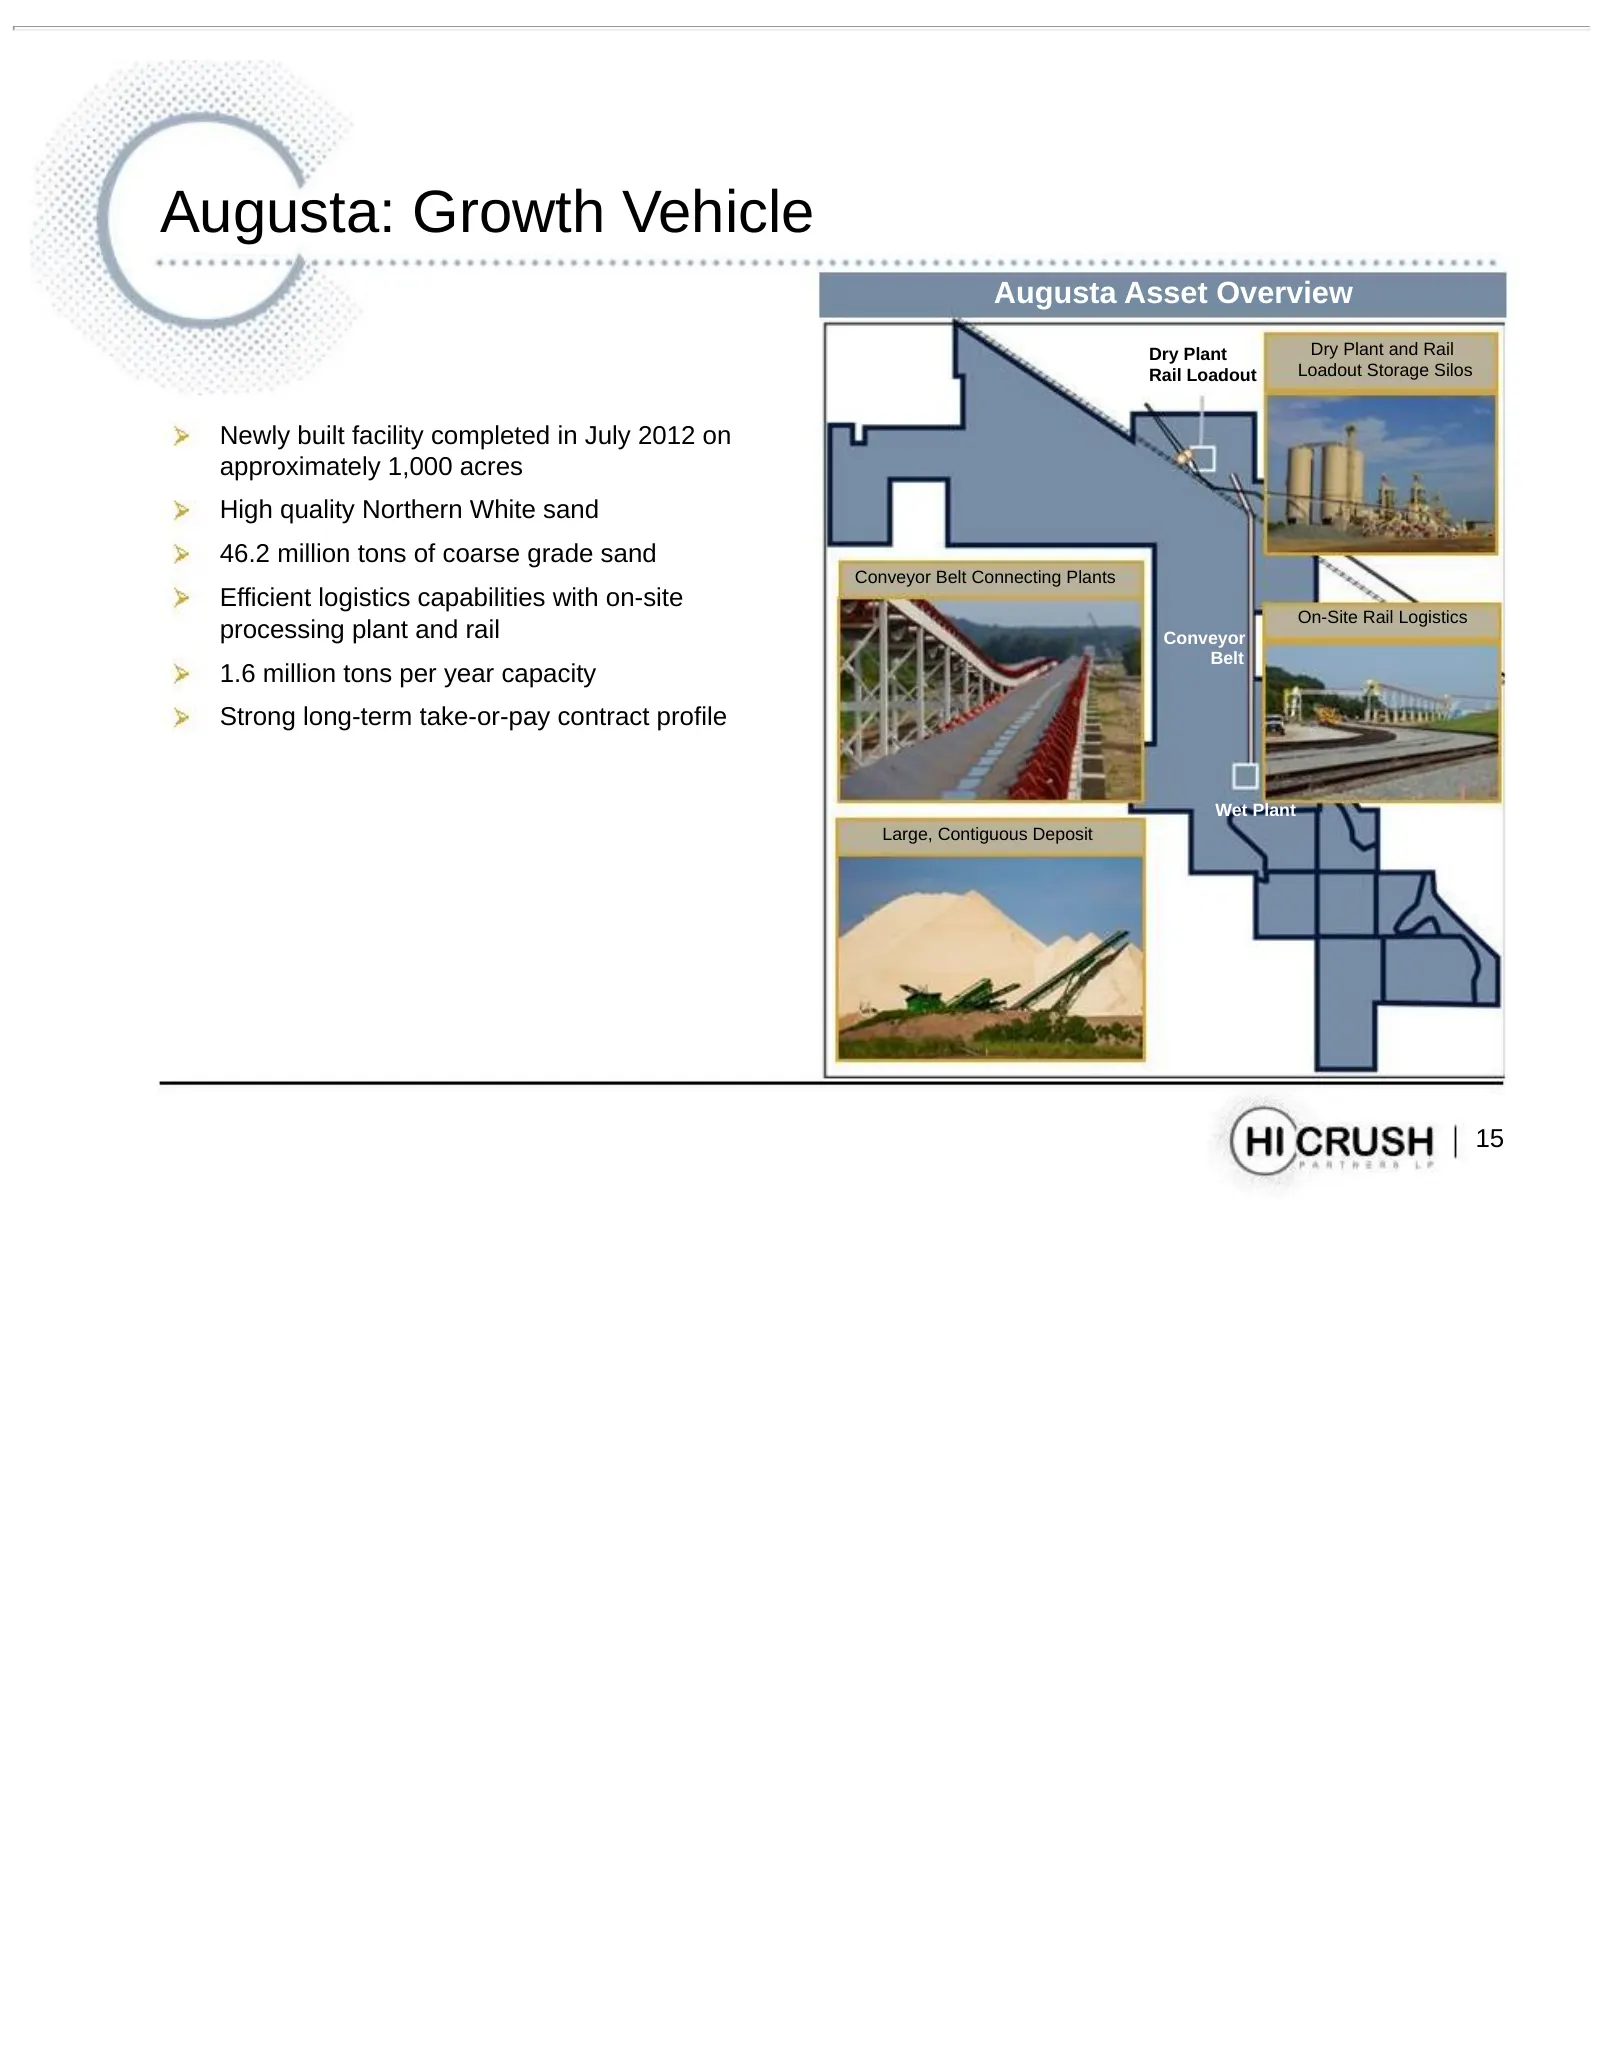
Augusta: Growth Vehicle Augusta Asset Overview Dry Plant Dry Plant and Rail Rail Loadout Loadout Storage Silos Newly built facility completed in July 2012 on approximately 1,000 acres High quality Northern White sand 46.2 million tons of coarse grade sand Conveyor Belt Connecting Plants Efficient lo
Slide 16: Corporate Structure
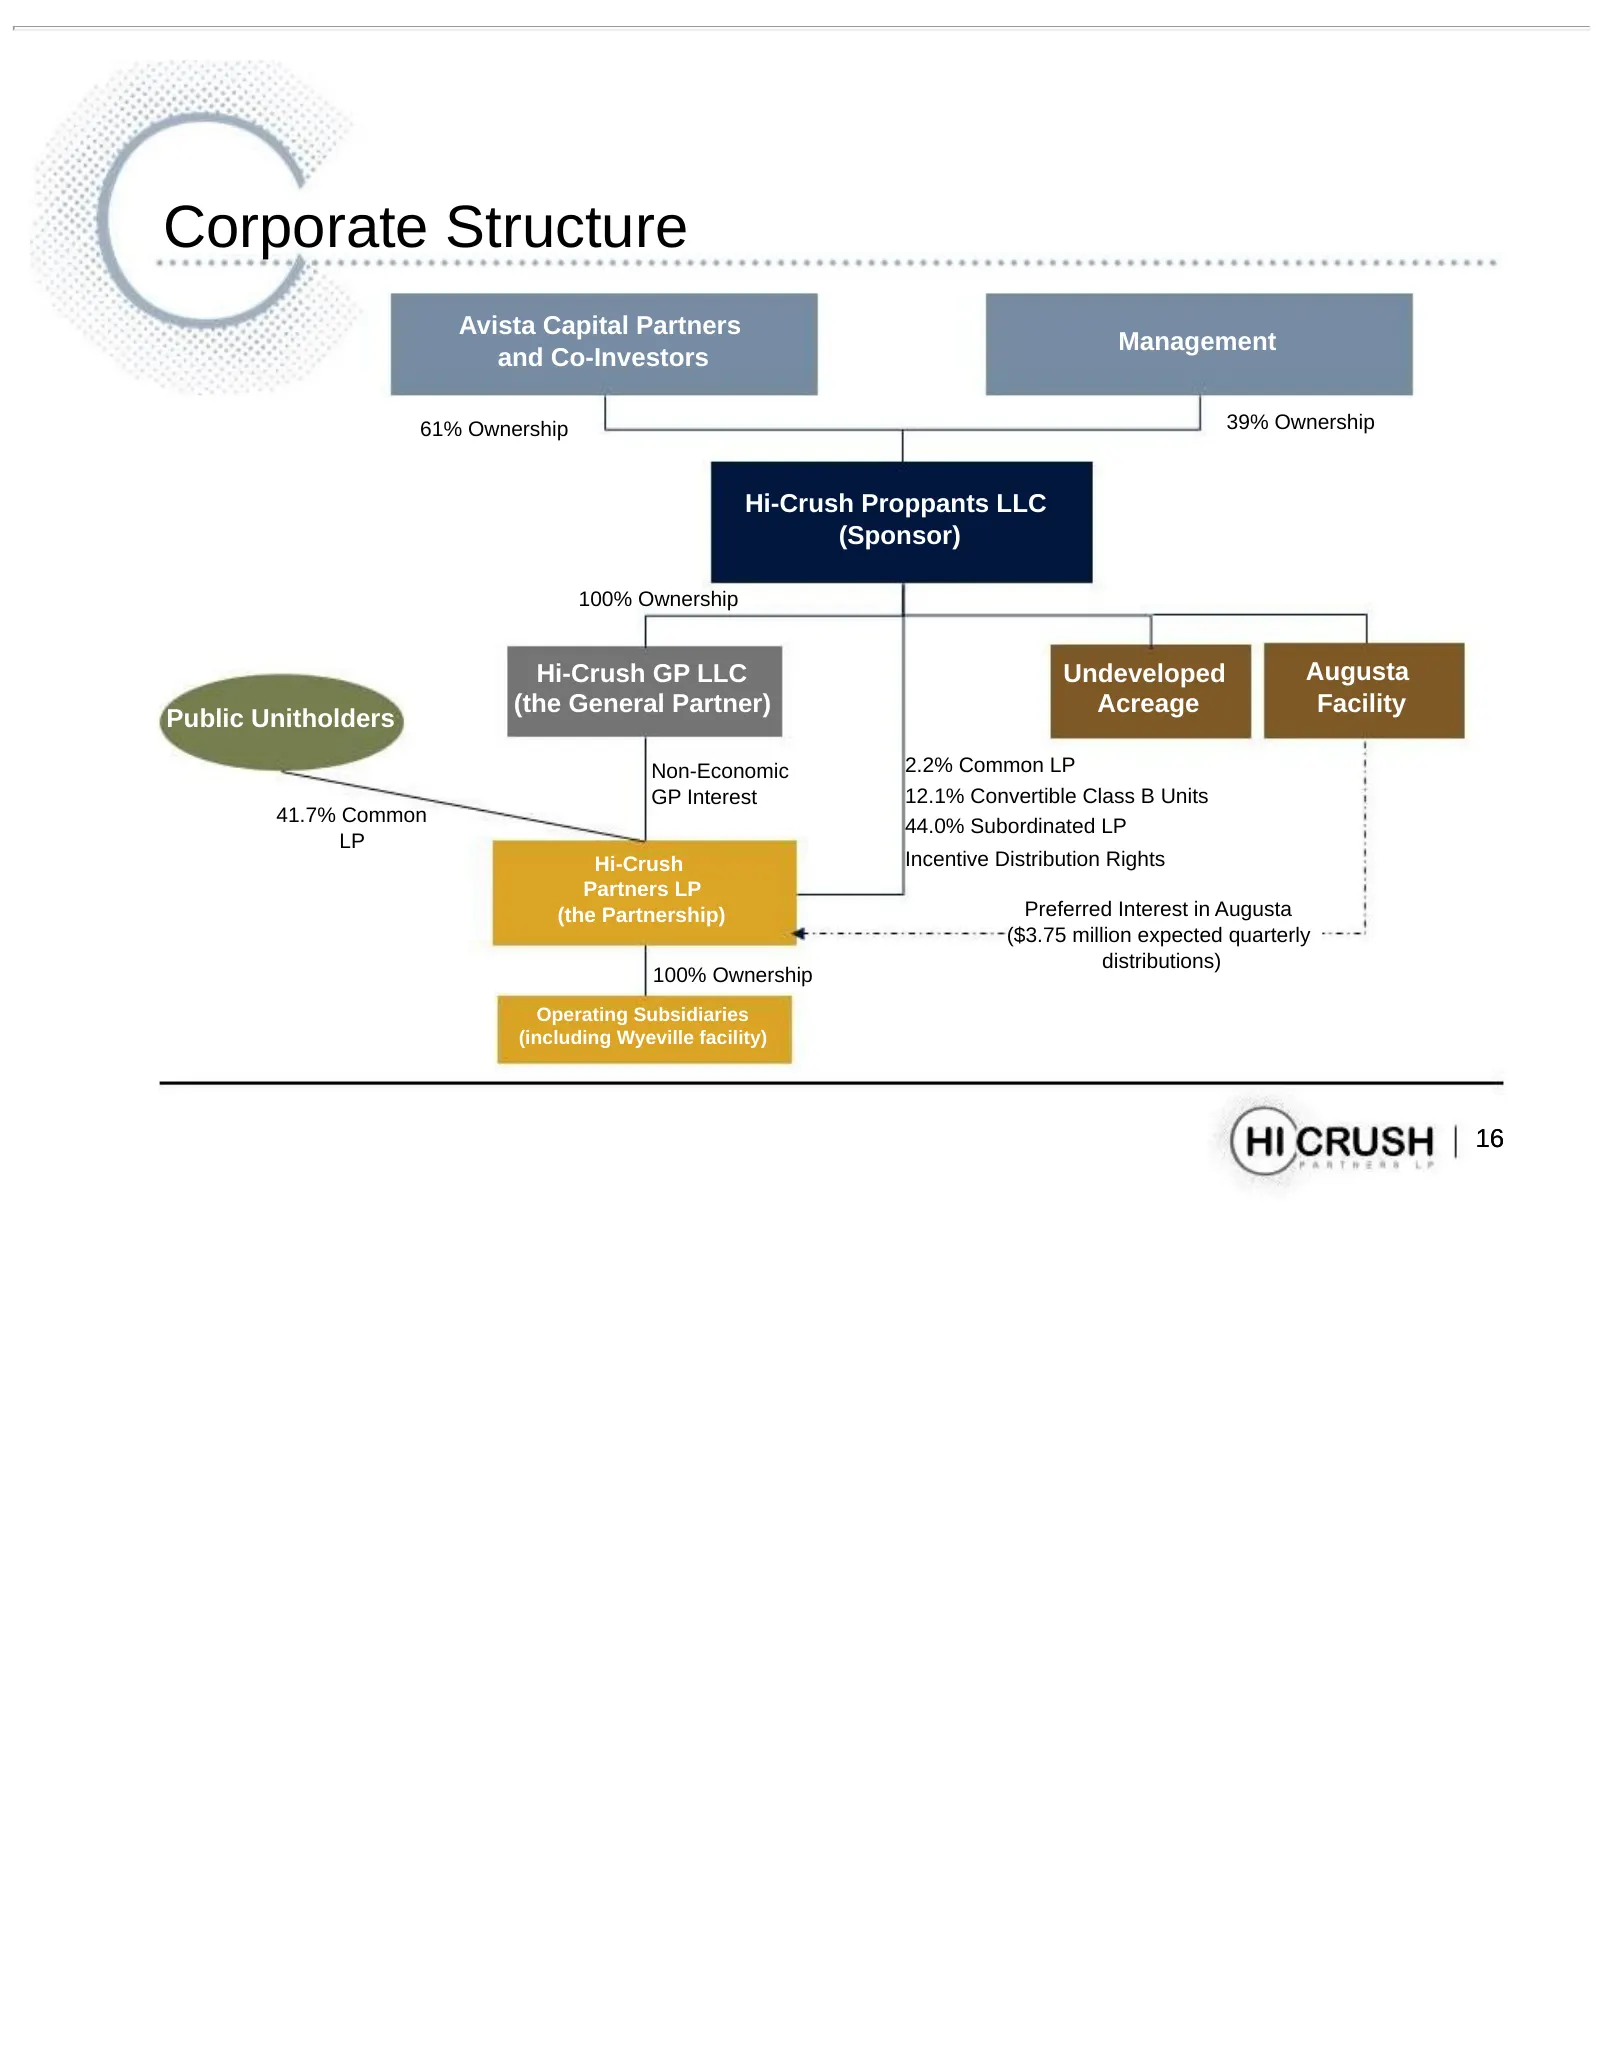
Corporate Structure Avista Capital Partners Management and Co-Investors 61% Ownership 39% Ownership Hi-Crush Proppants LLC (Sponsor) 100% Ownership Hi-Crush GP LLC Undeveloped Augusta (the General Partner) Acreage Facility Public Unitholders Non-Economic 2.2% Common LP GP Interest 12.1% Convertible
Slide 17: Multiple Future Opportunities
Multiple Future Opportunities • Contributions: Future contributions from Augusta and sponsor- level projects in development • Organic Expansion: Sponsor owns or has options on additional acres of undeveloped land • M&A: Industry ripe for consolidation of small, private sand companies 17
Slide 18: Appendix
Appendix
Slide 19: Fourth Quarter and Year-End Summary
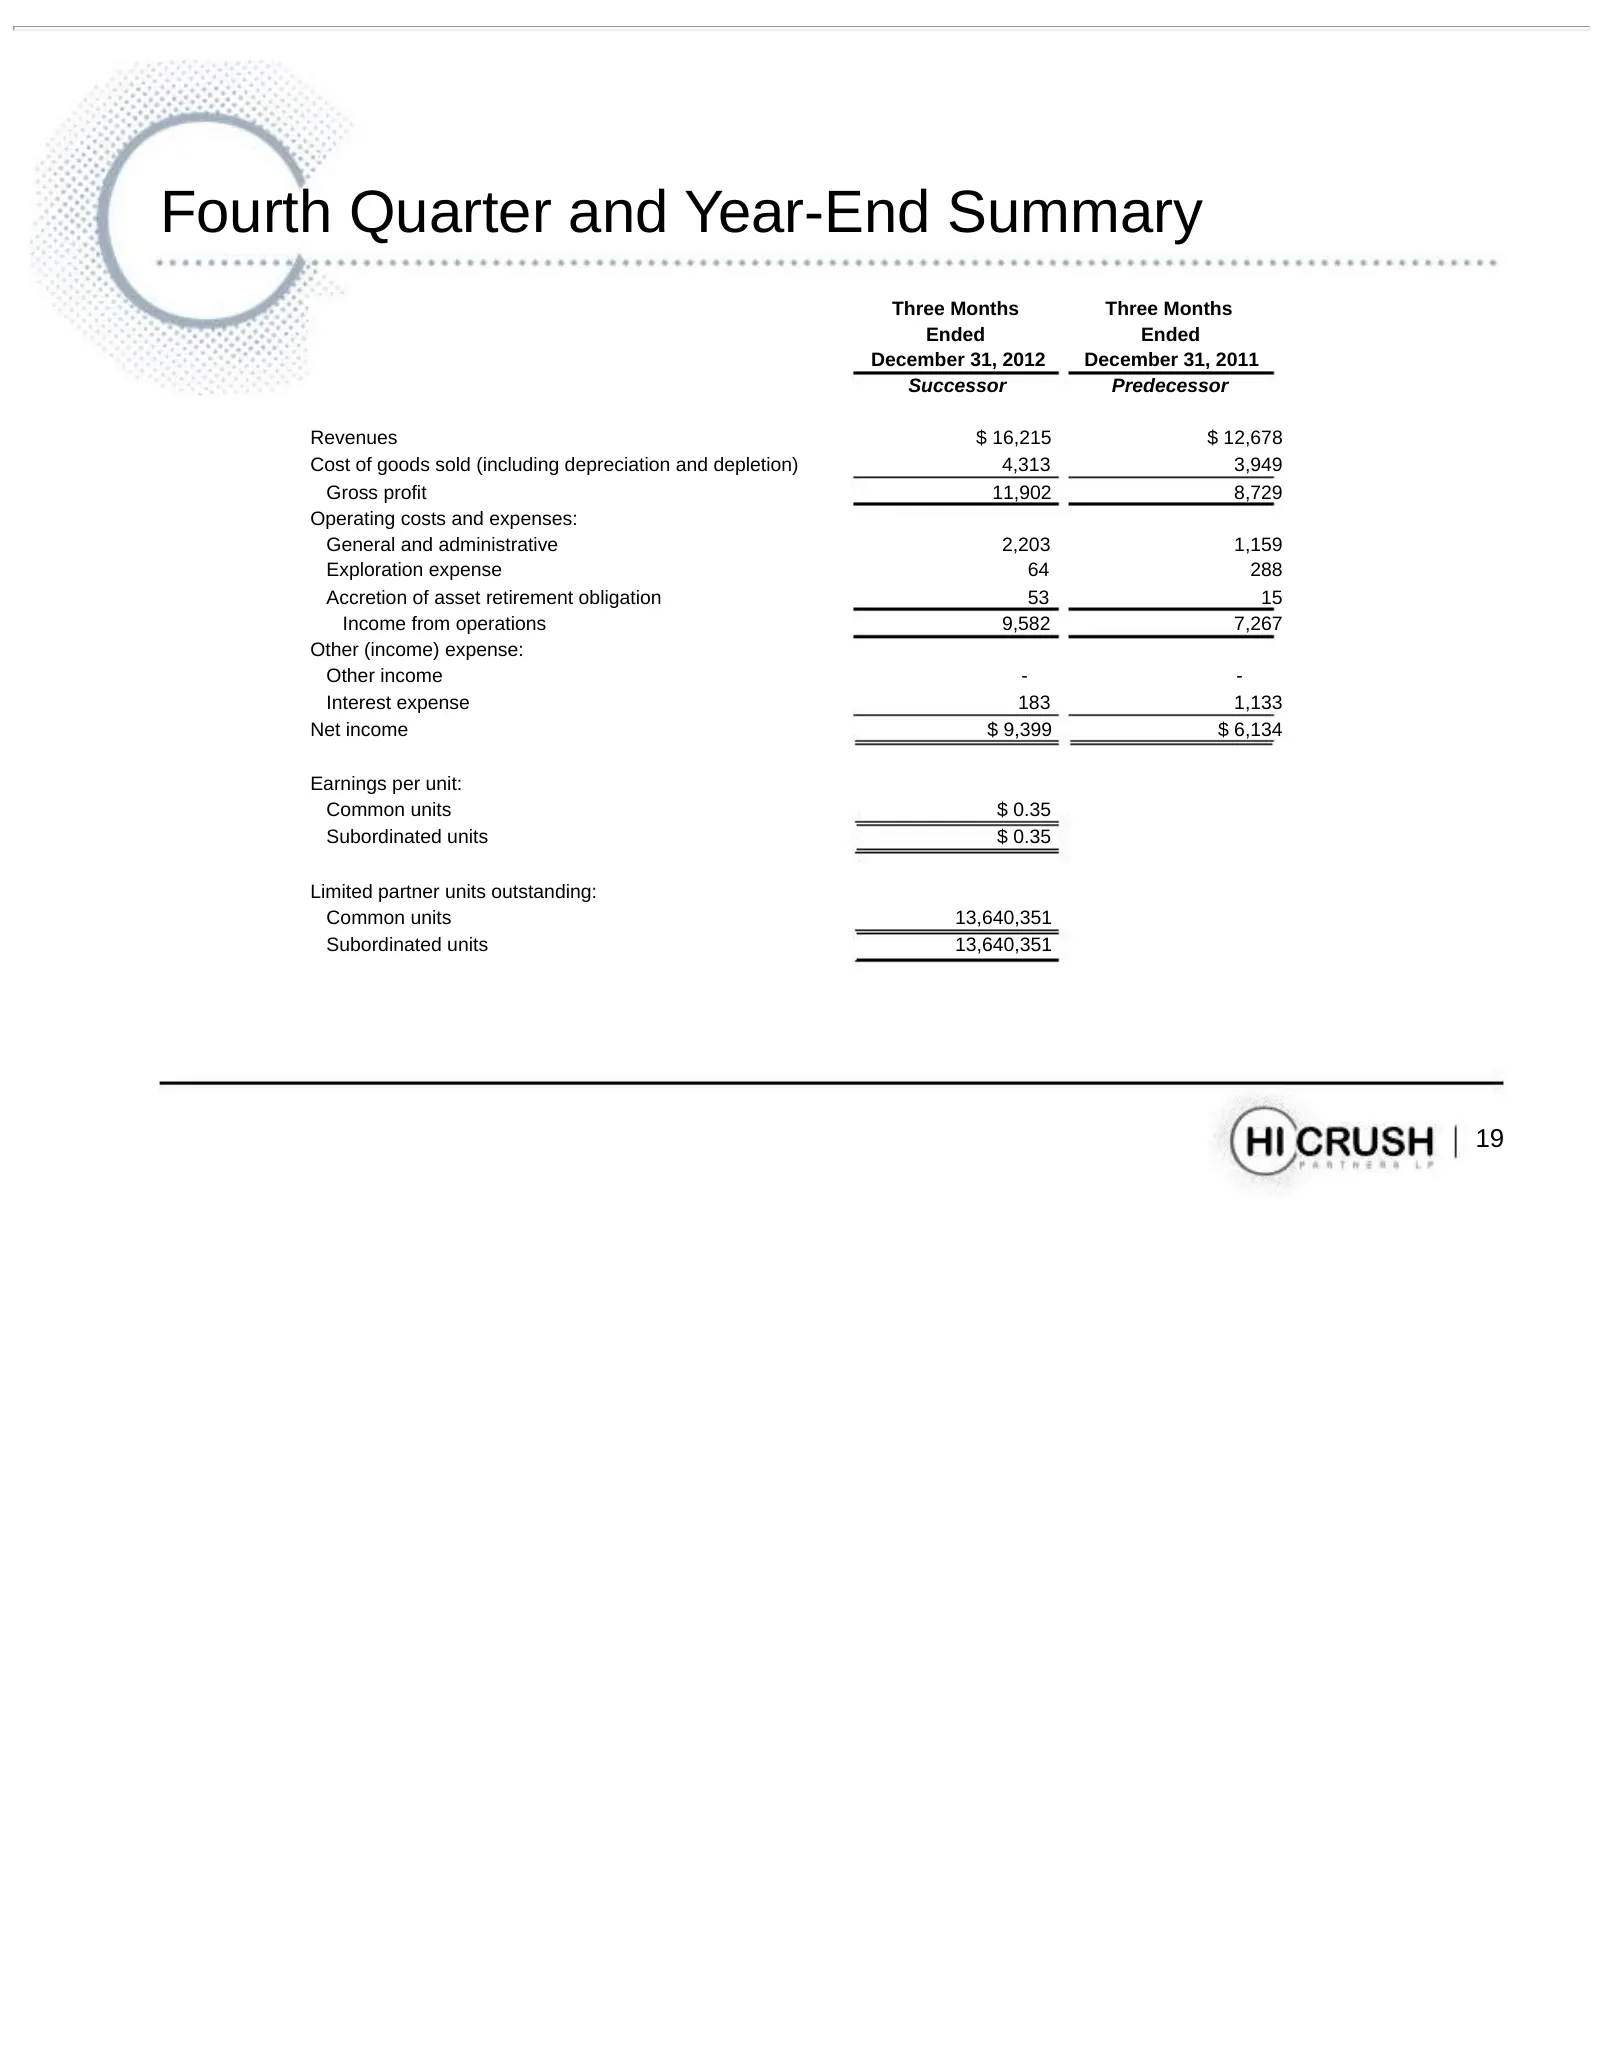
Fourth Quarter and Year-End Summary Three Months Three Months Ended Ended December 31, 2012 December 31, 2011 Successor Predecessor Revenues $ 16,215 $ 12,678 Cost of goods sold (including depreciation and depletion) 4,313 3,949 Gross profit 11,902 8,729 Operating costs and expenses: General and adm
Slide 20: Fourth Quarter and Year-End Summary
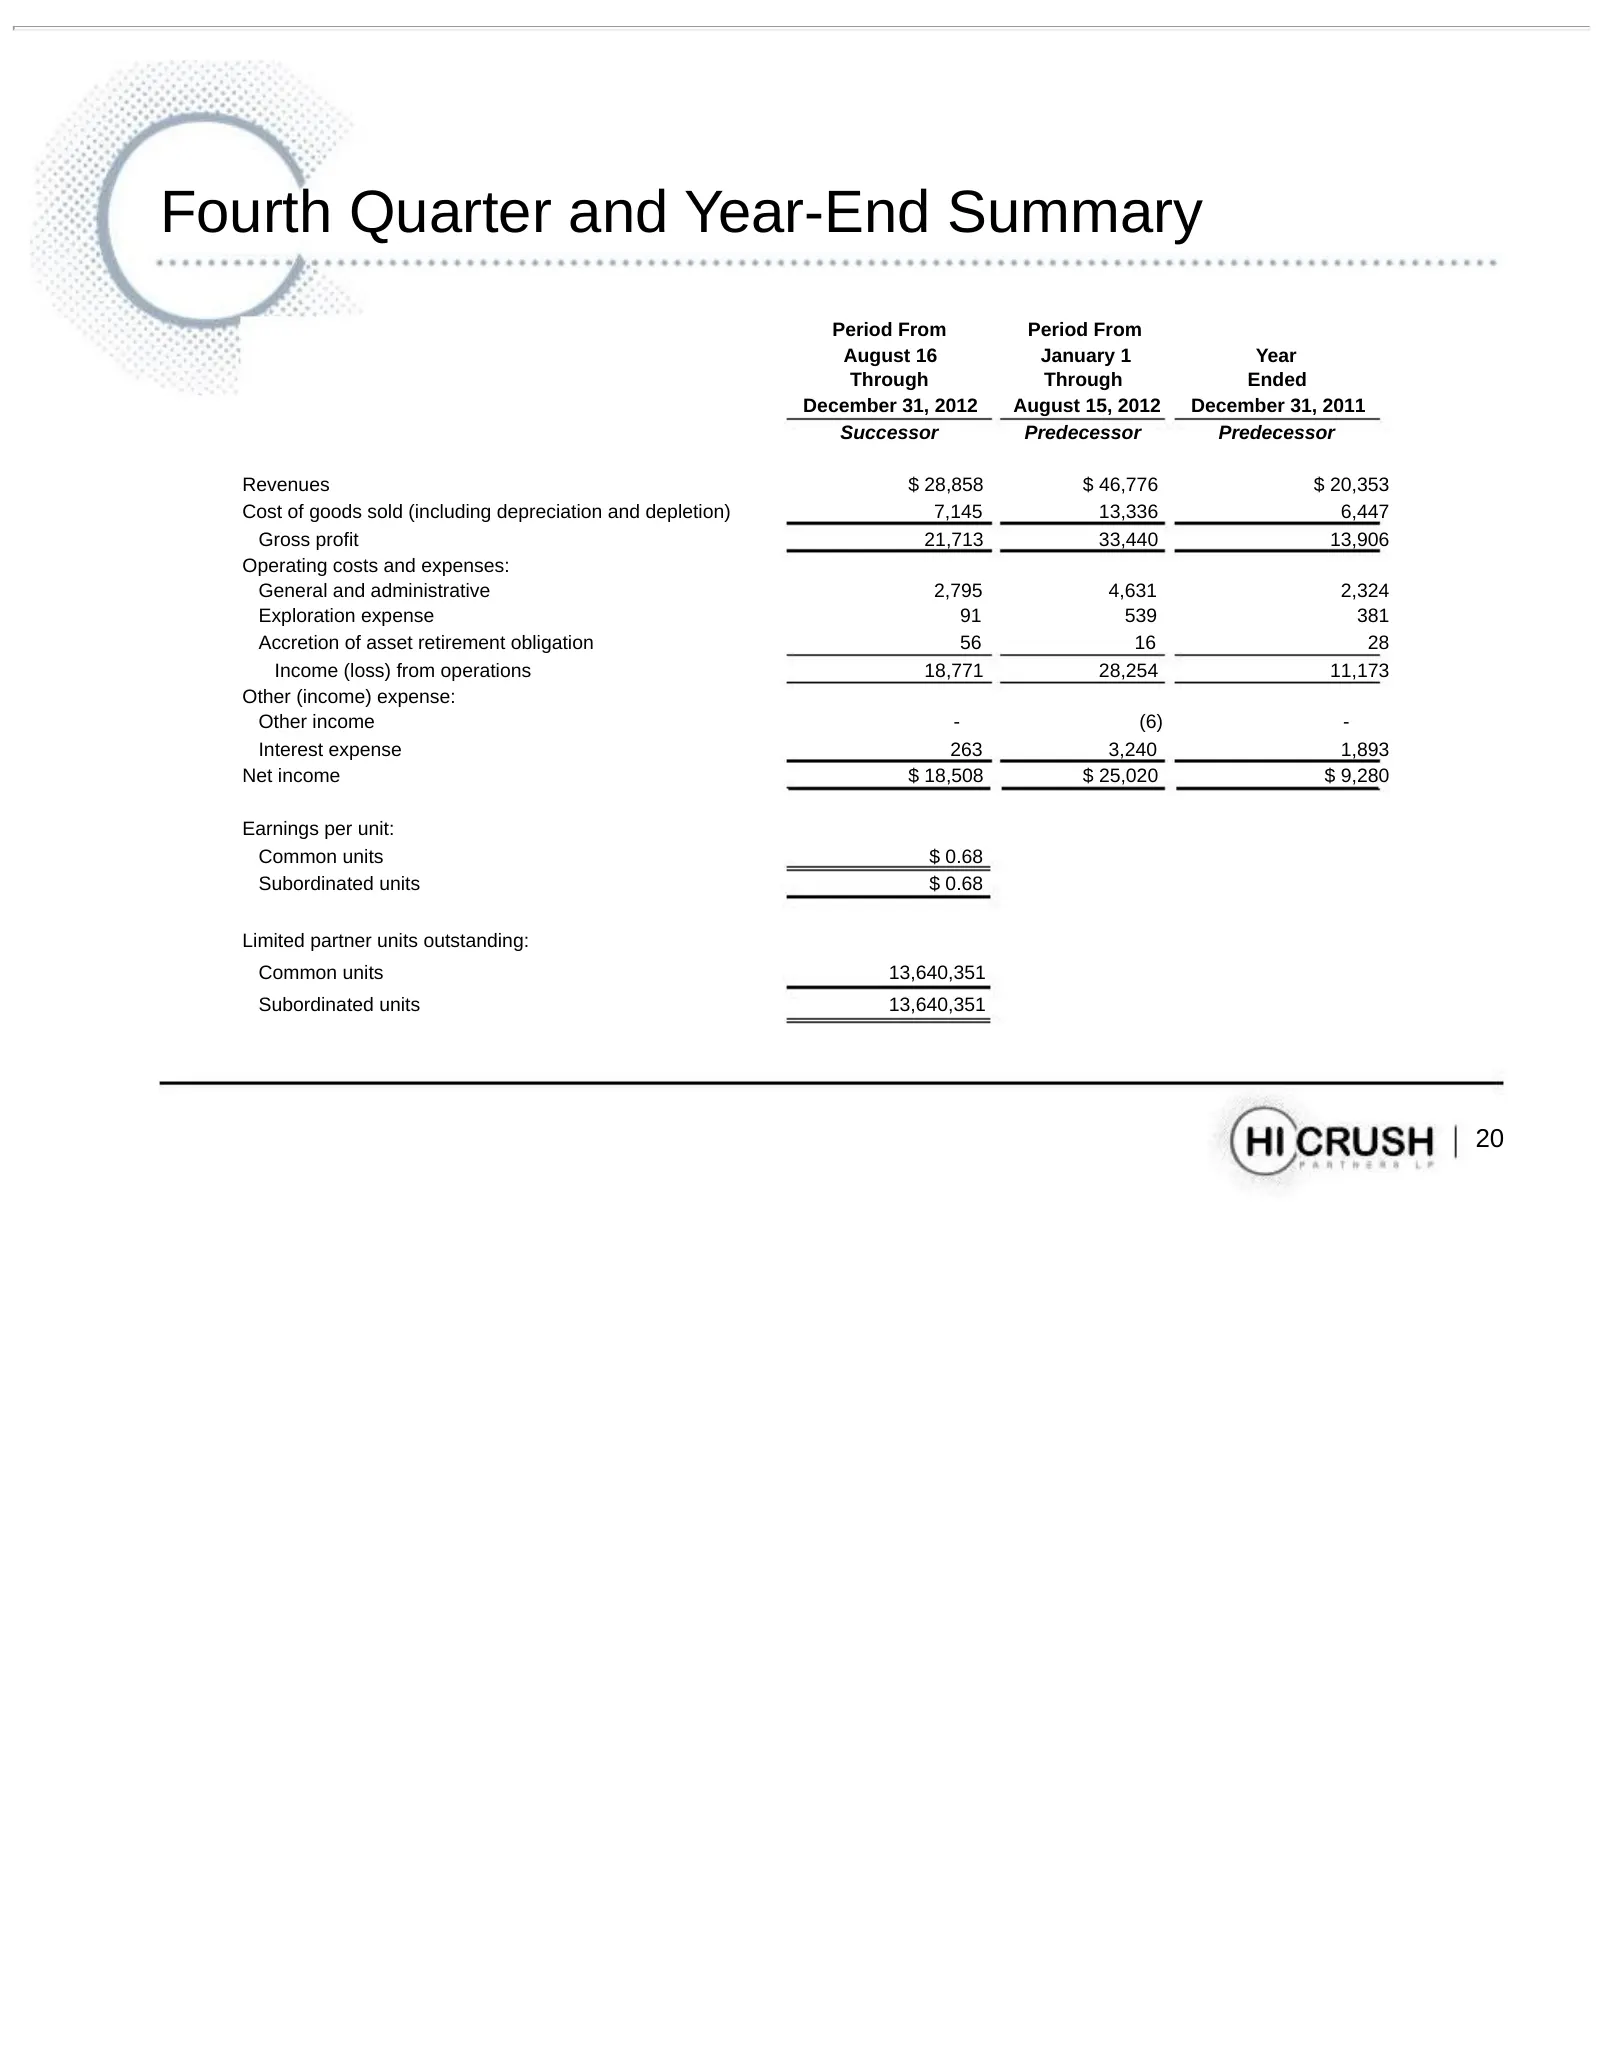
Fourth Quarter and Year-End Summary Period From Period From August 16 January 1 Year Through Through Ended December 31, 2012 August 15, 2012 December 31, 2011 Successor Predecessor Predecessor Revenues $ 28,858 $ 46,776 $ 20,353 Cost of goods sold (including depreciation and depletion) 7,145 13,336
Slide 21: Fourth Quarter and Year-End Summary
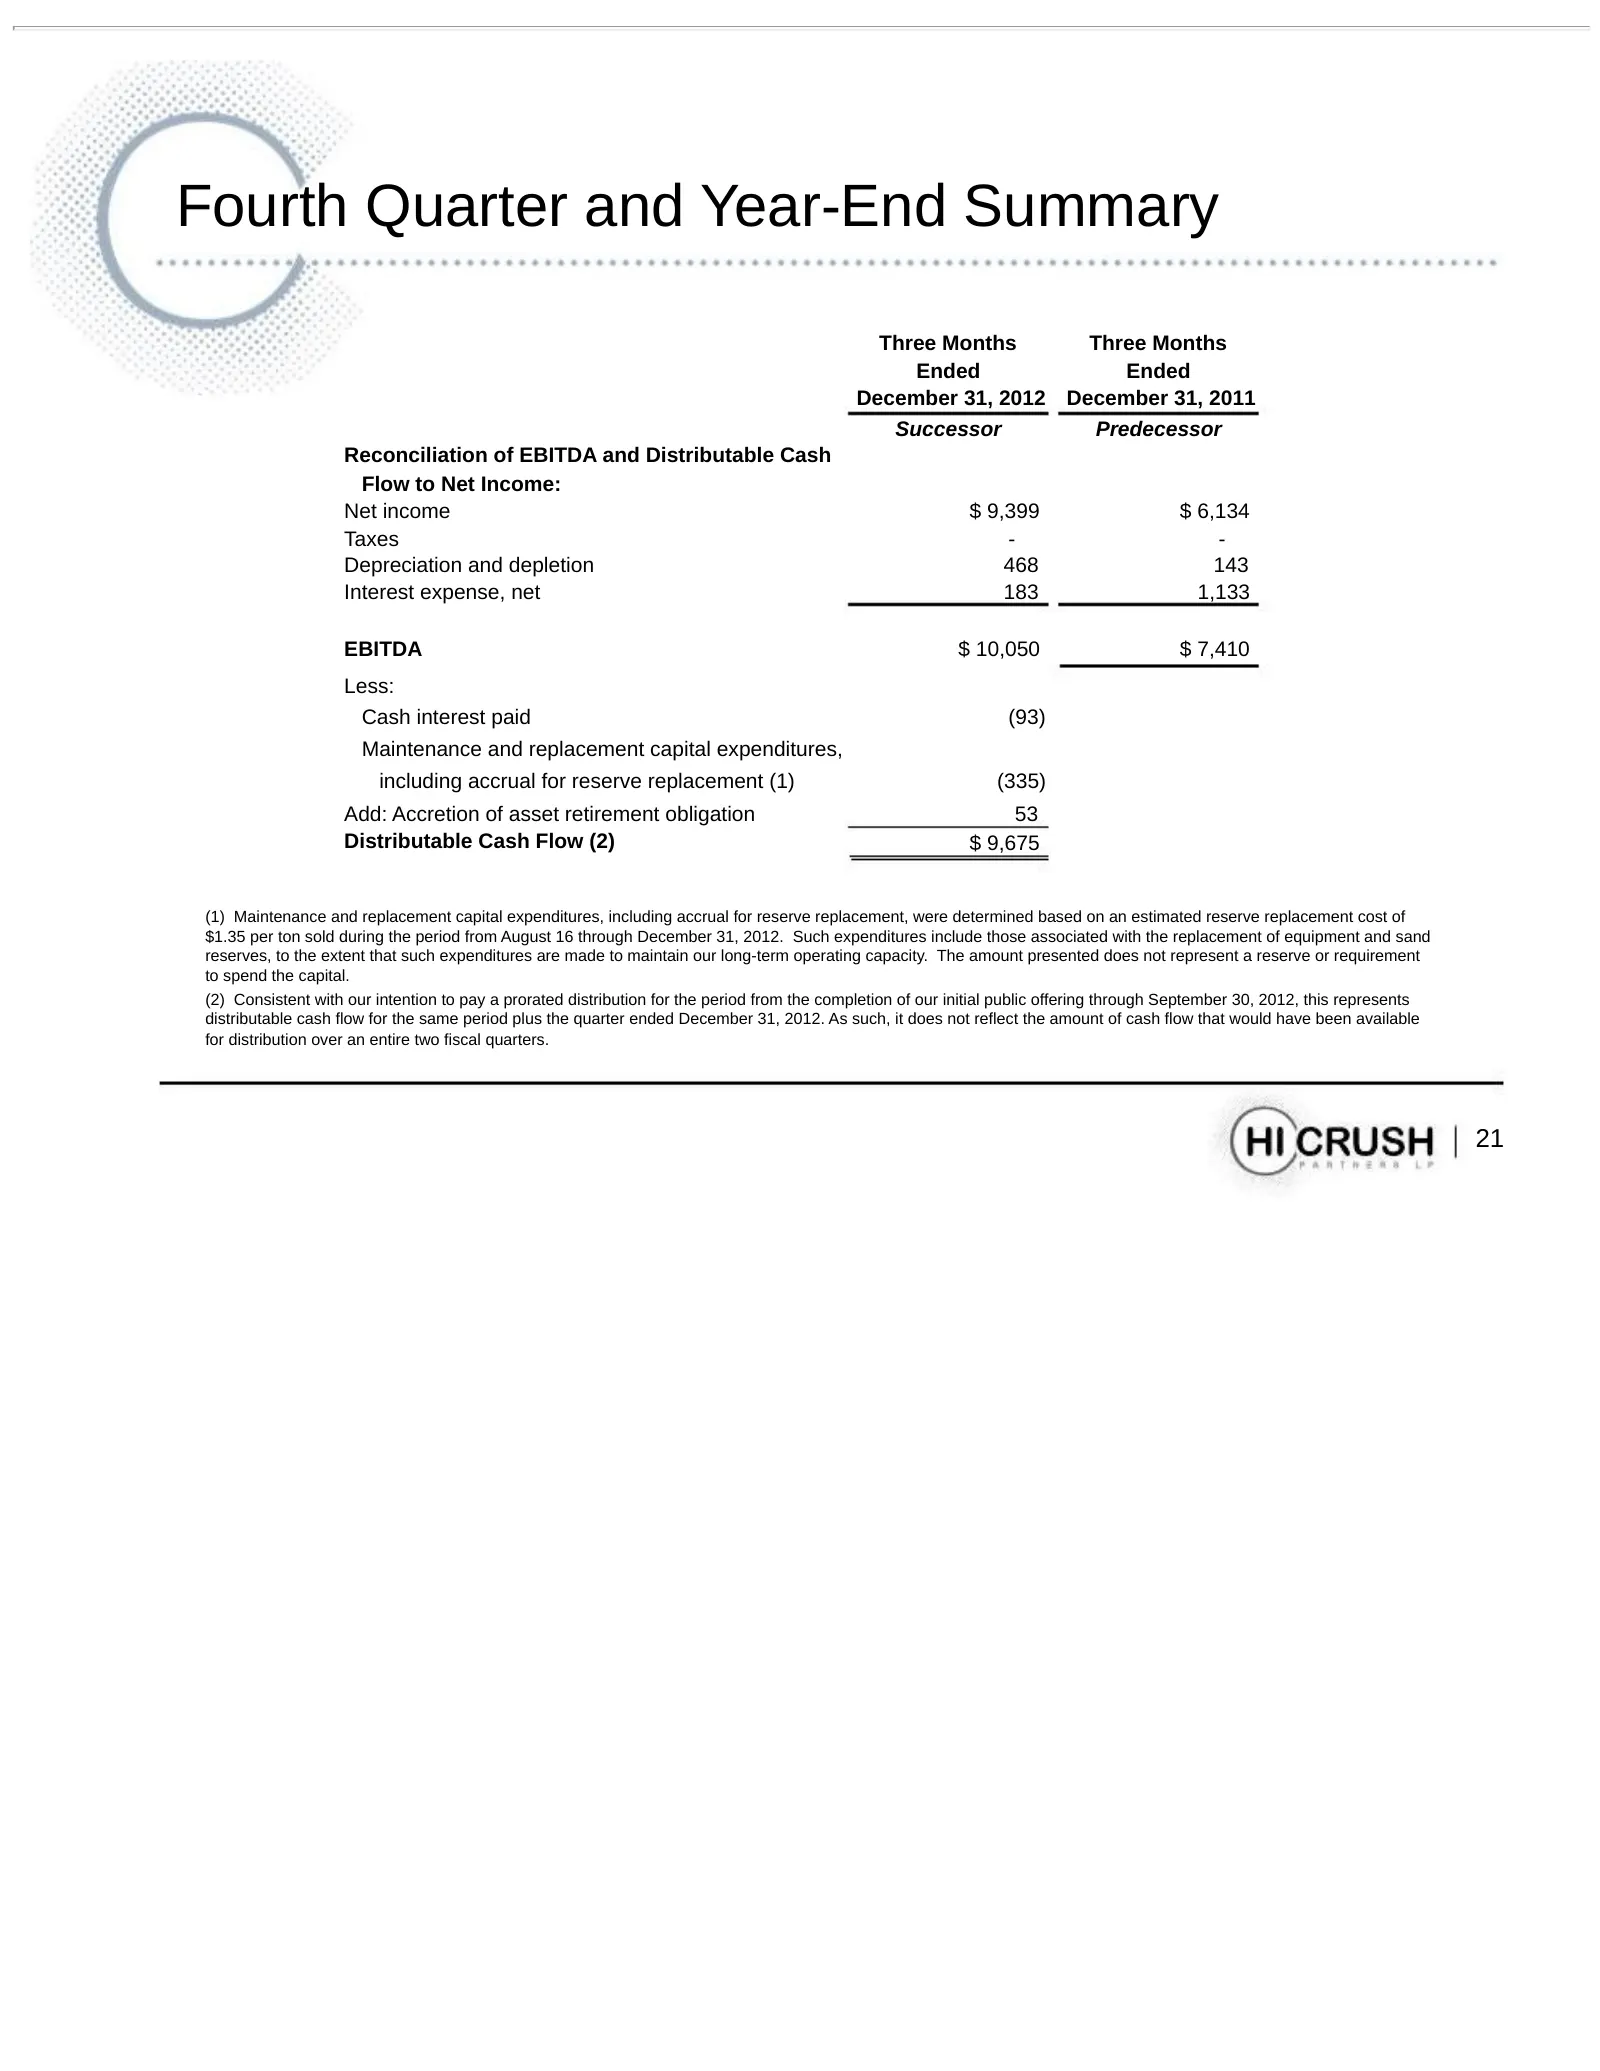
Fourth Quarter and Year-End Summary Three Months Three Months Ended Ended December 31, 2012 December 31, 2011 Successor Predecessor Reconciliation of EBITDA and Distributable Cash Flow to Net Income: Net income $ 9,399 $ 6,134 Taxes - - Depreciation and depletion 468 143 Interest expense, net 183 1,
Slide 22: Fourth Quarter and Year-End Summary
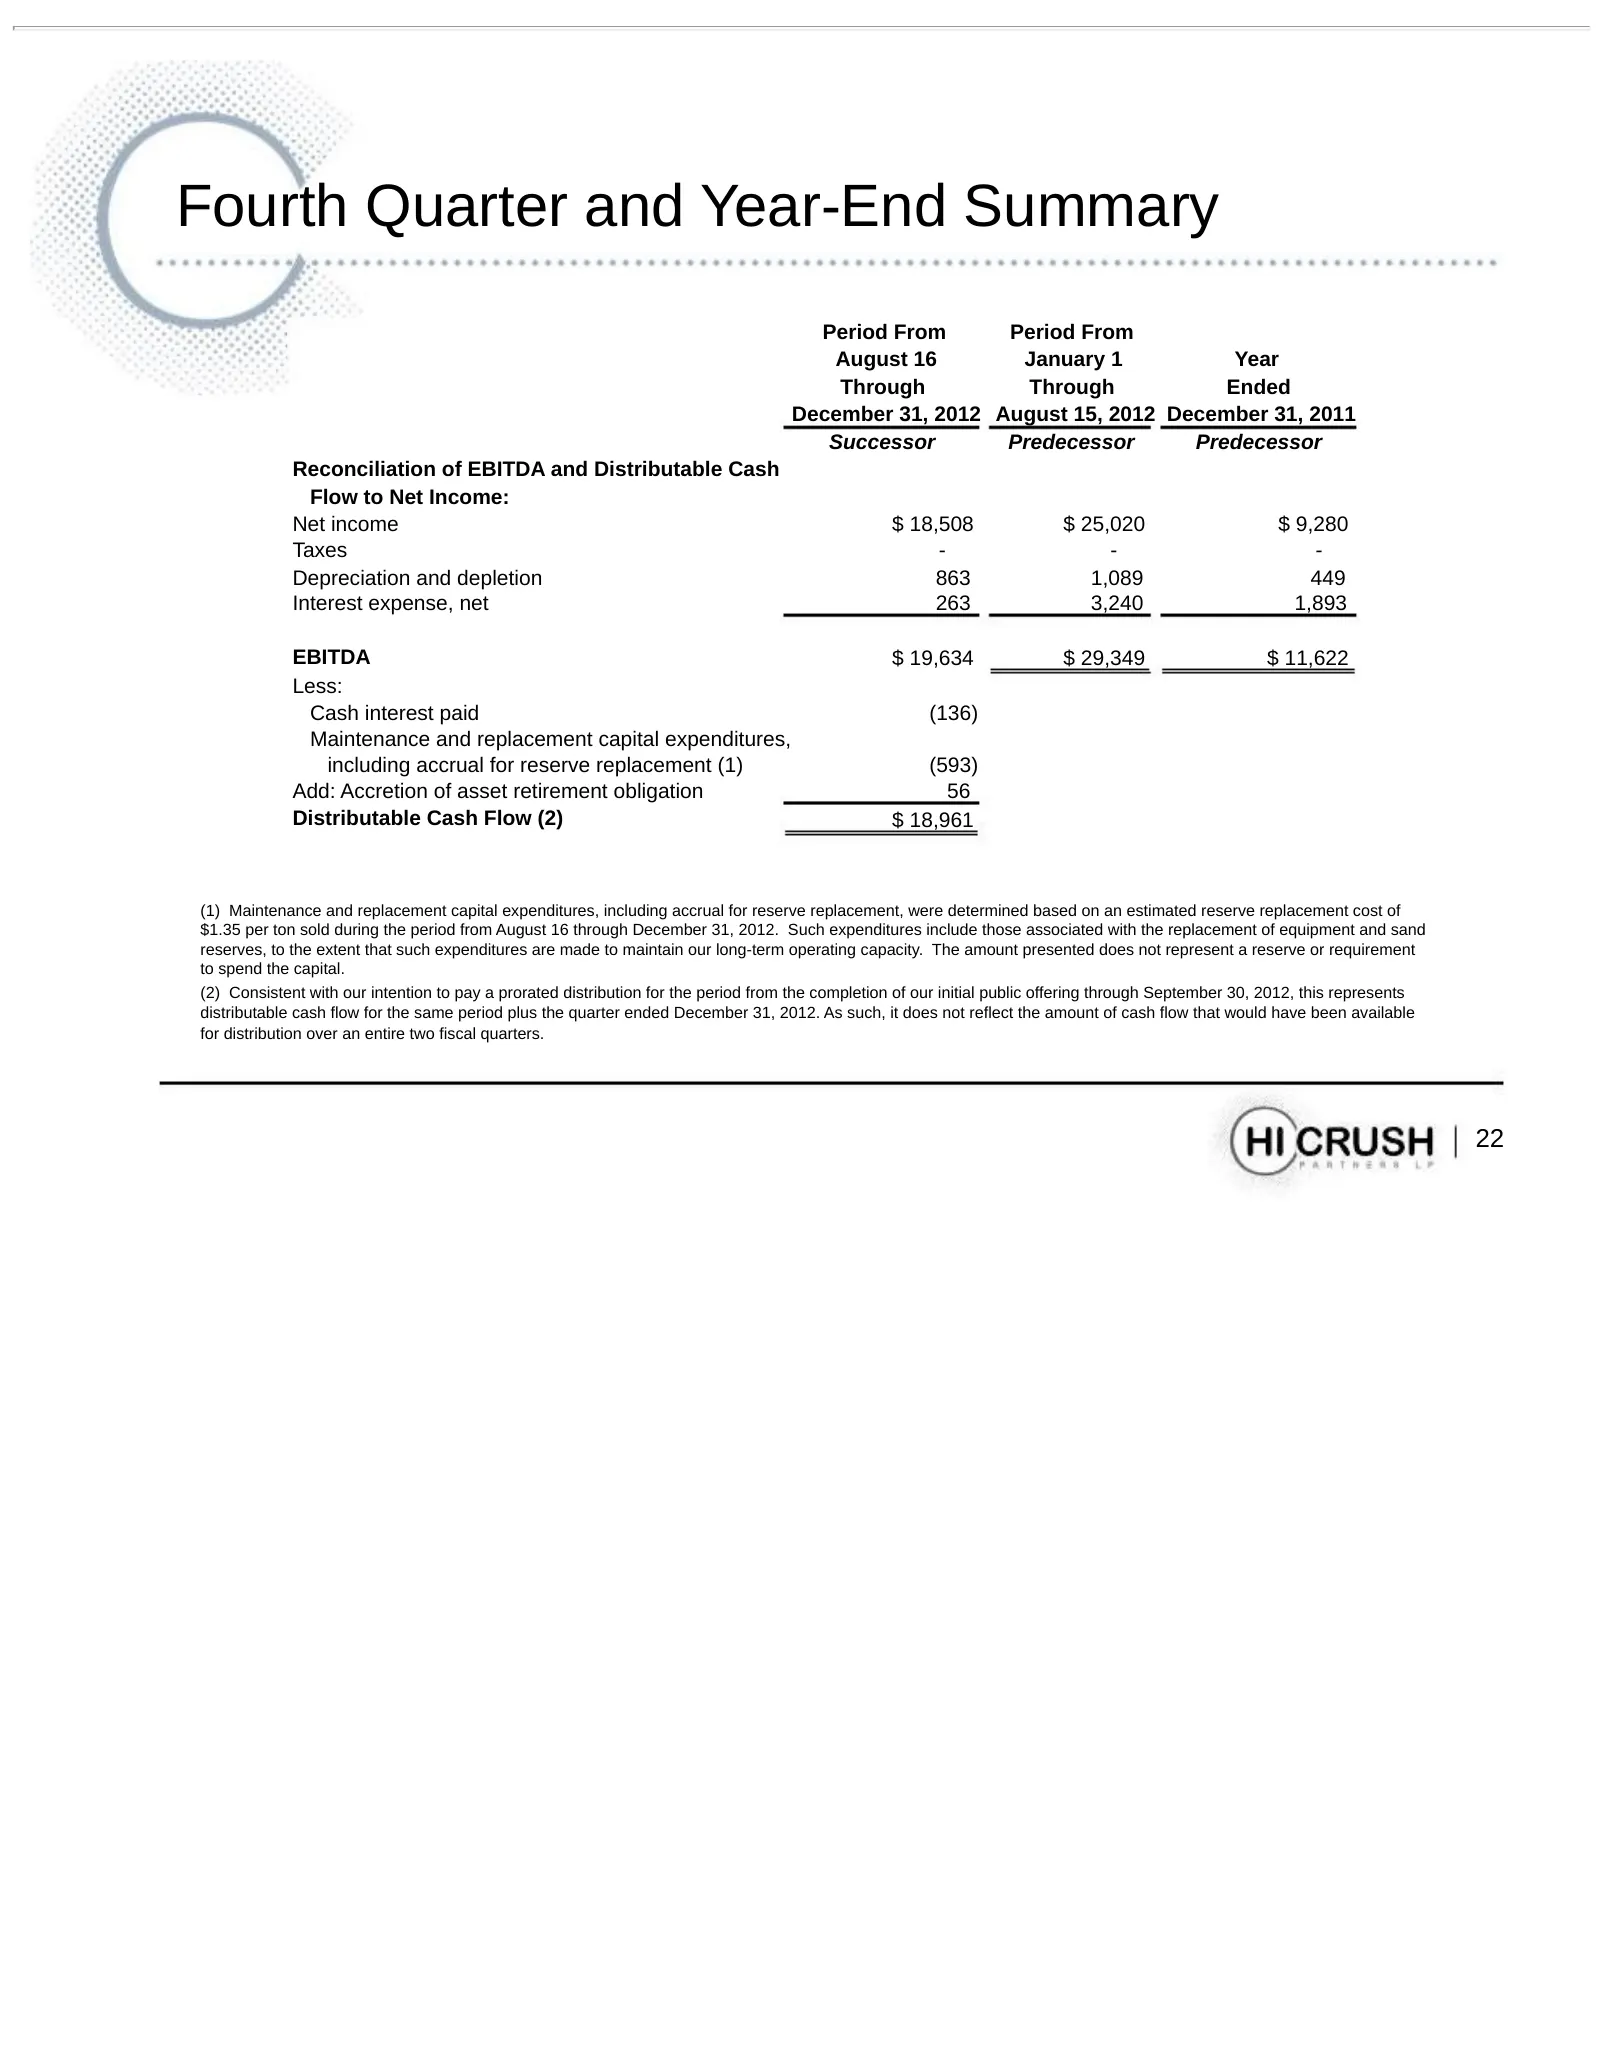
Fourth Quarter and Year-End Summary Period From Period From August 16 January 1 Year Through Through Ended December 31, 2012 August 15, 2012 December 31, 2011 Successor Predecessor Predecessor Reconciliation of EBITDA and Distributable Cash Flow to Net Income: Net income $ 18,508 $ 25,020 $ 9,280 Ta
Slide 23: Production Costs per Ton Sold
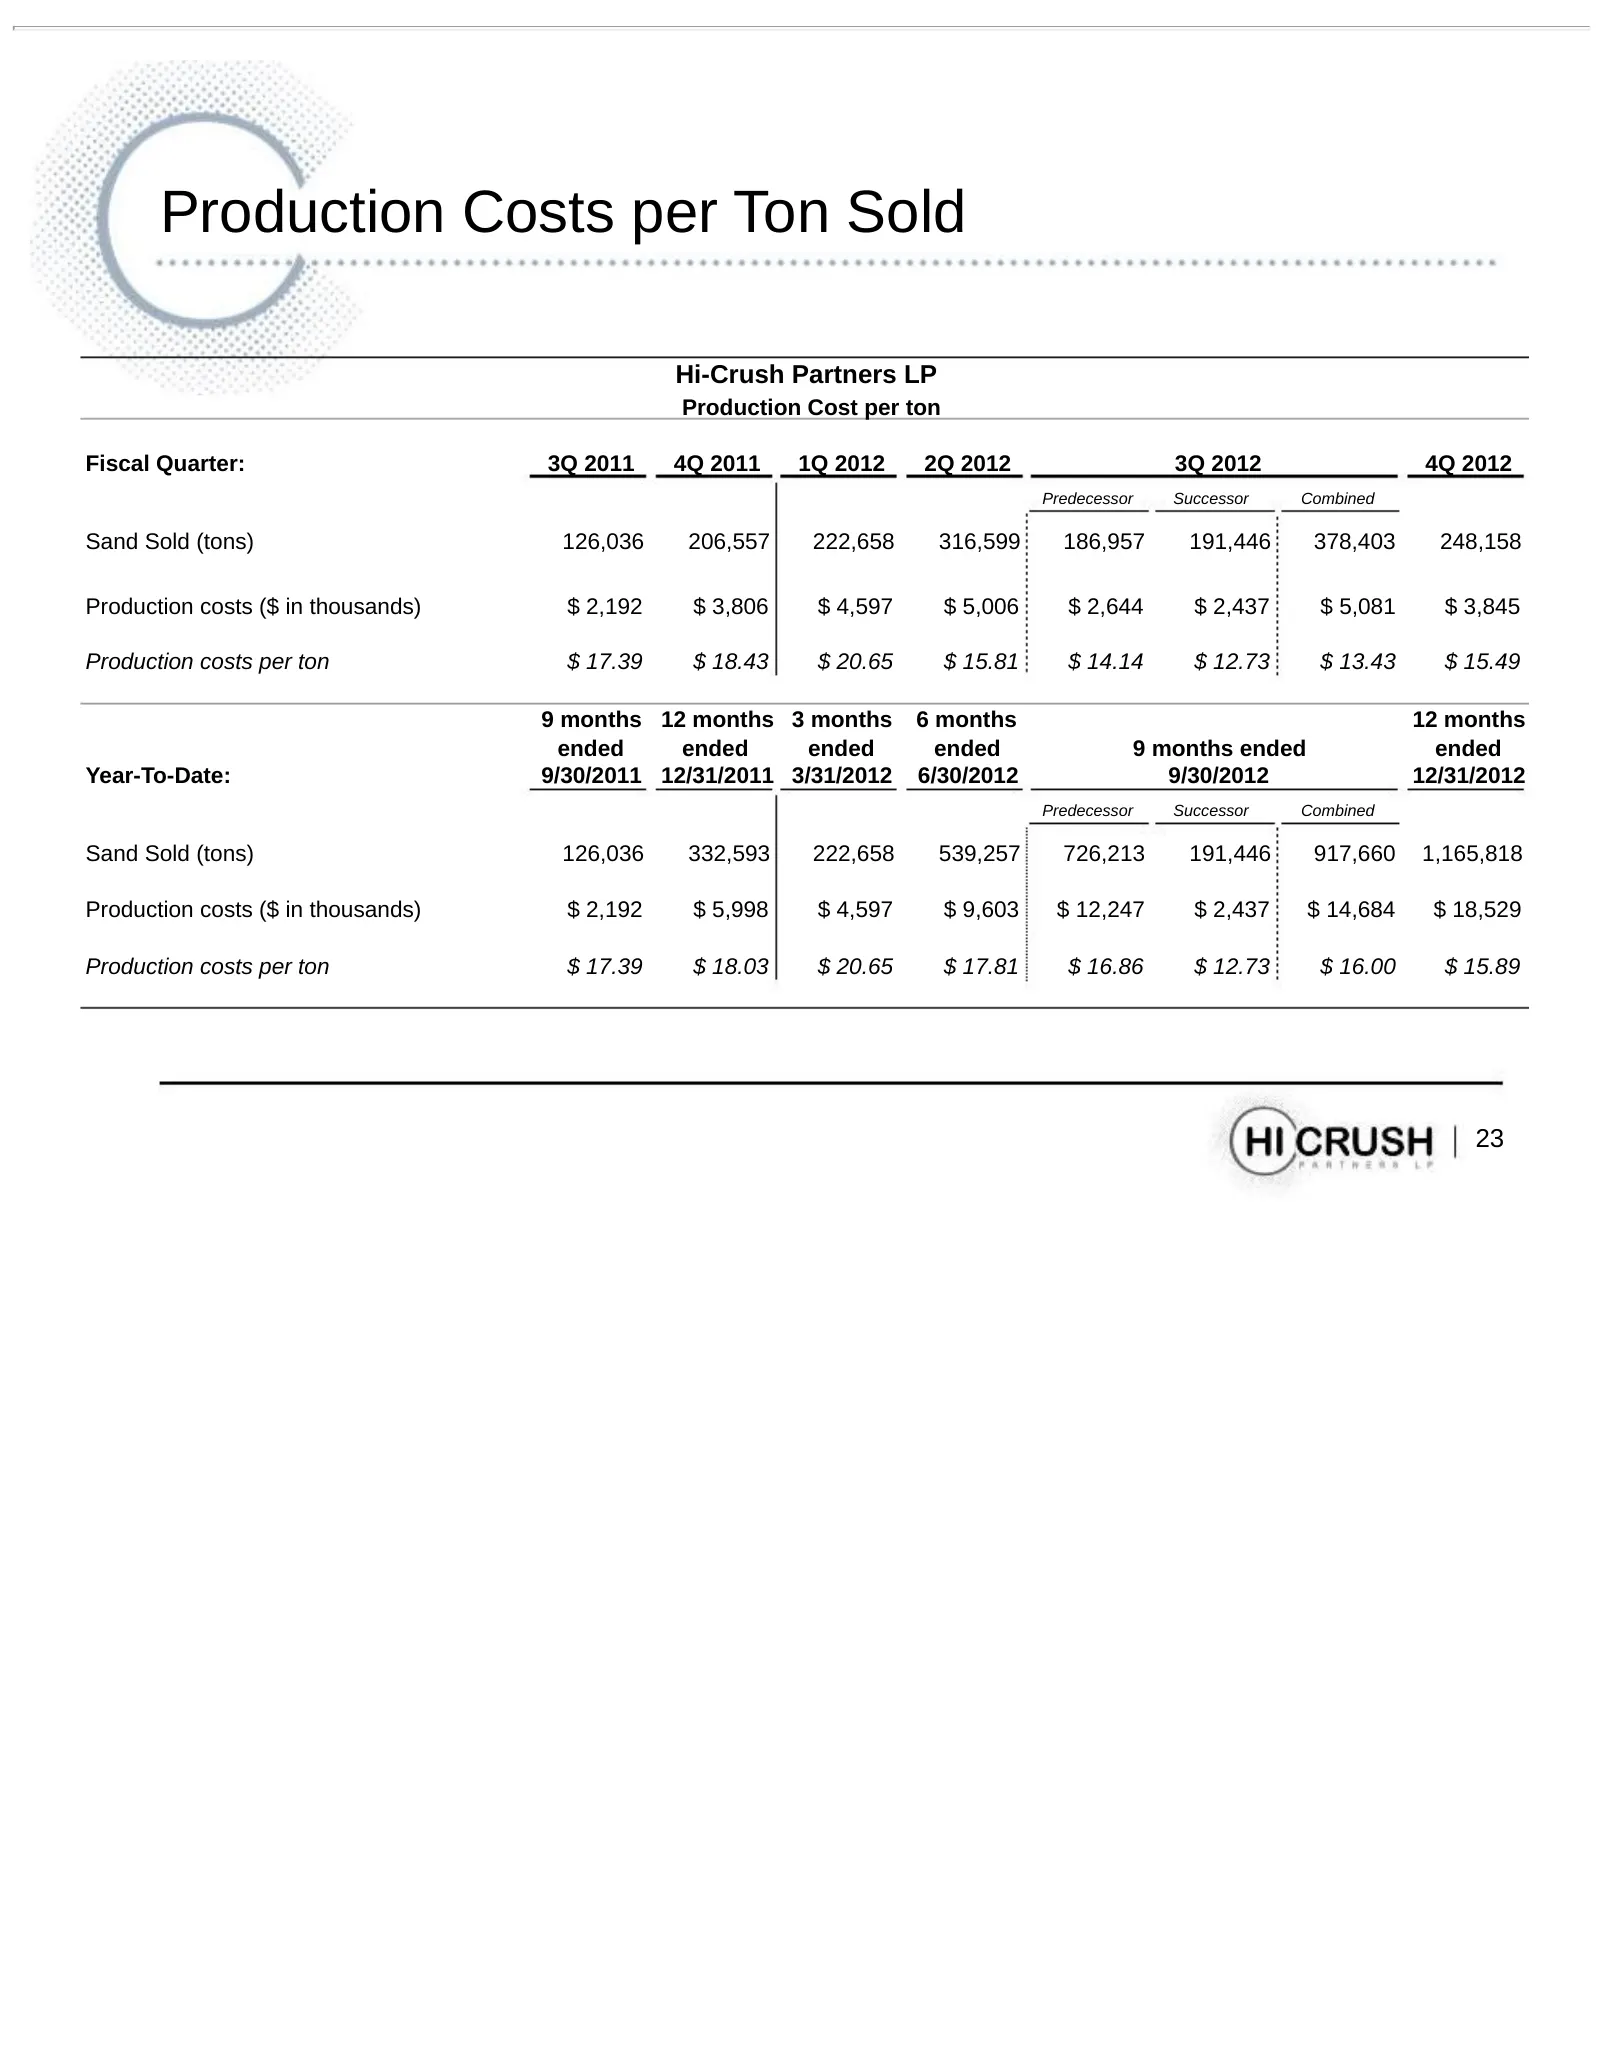
Production Costs per Ton Sold Hi-Crush Partners LP Production Cost per ton Fiscal Quarter: 3Q 2011 4Q 2011 1Q 2012 2Q 2012 3Q 2012 4Q 2012 Predecessor Successor Combined Sand Sold (tons) 126,036 206,557 222,658 316,599 186,957 191,446 378,403 248,158 Production costs ($ in thousands) $ 2,192 $ 3,806
Slide 24: Production Costs – Non-GAAP Reconciliation
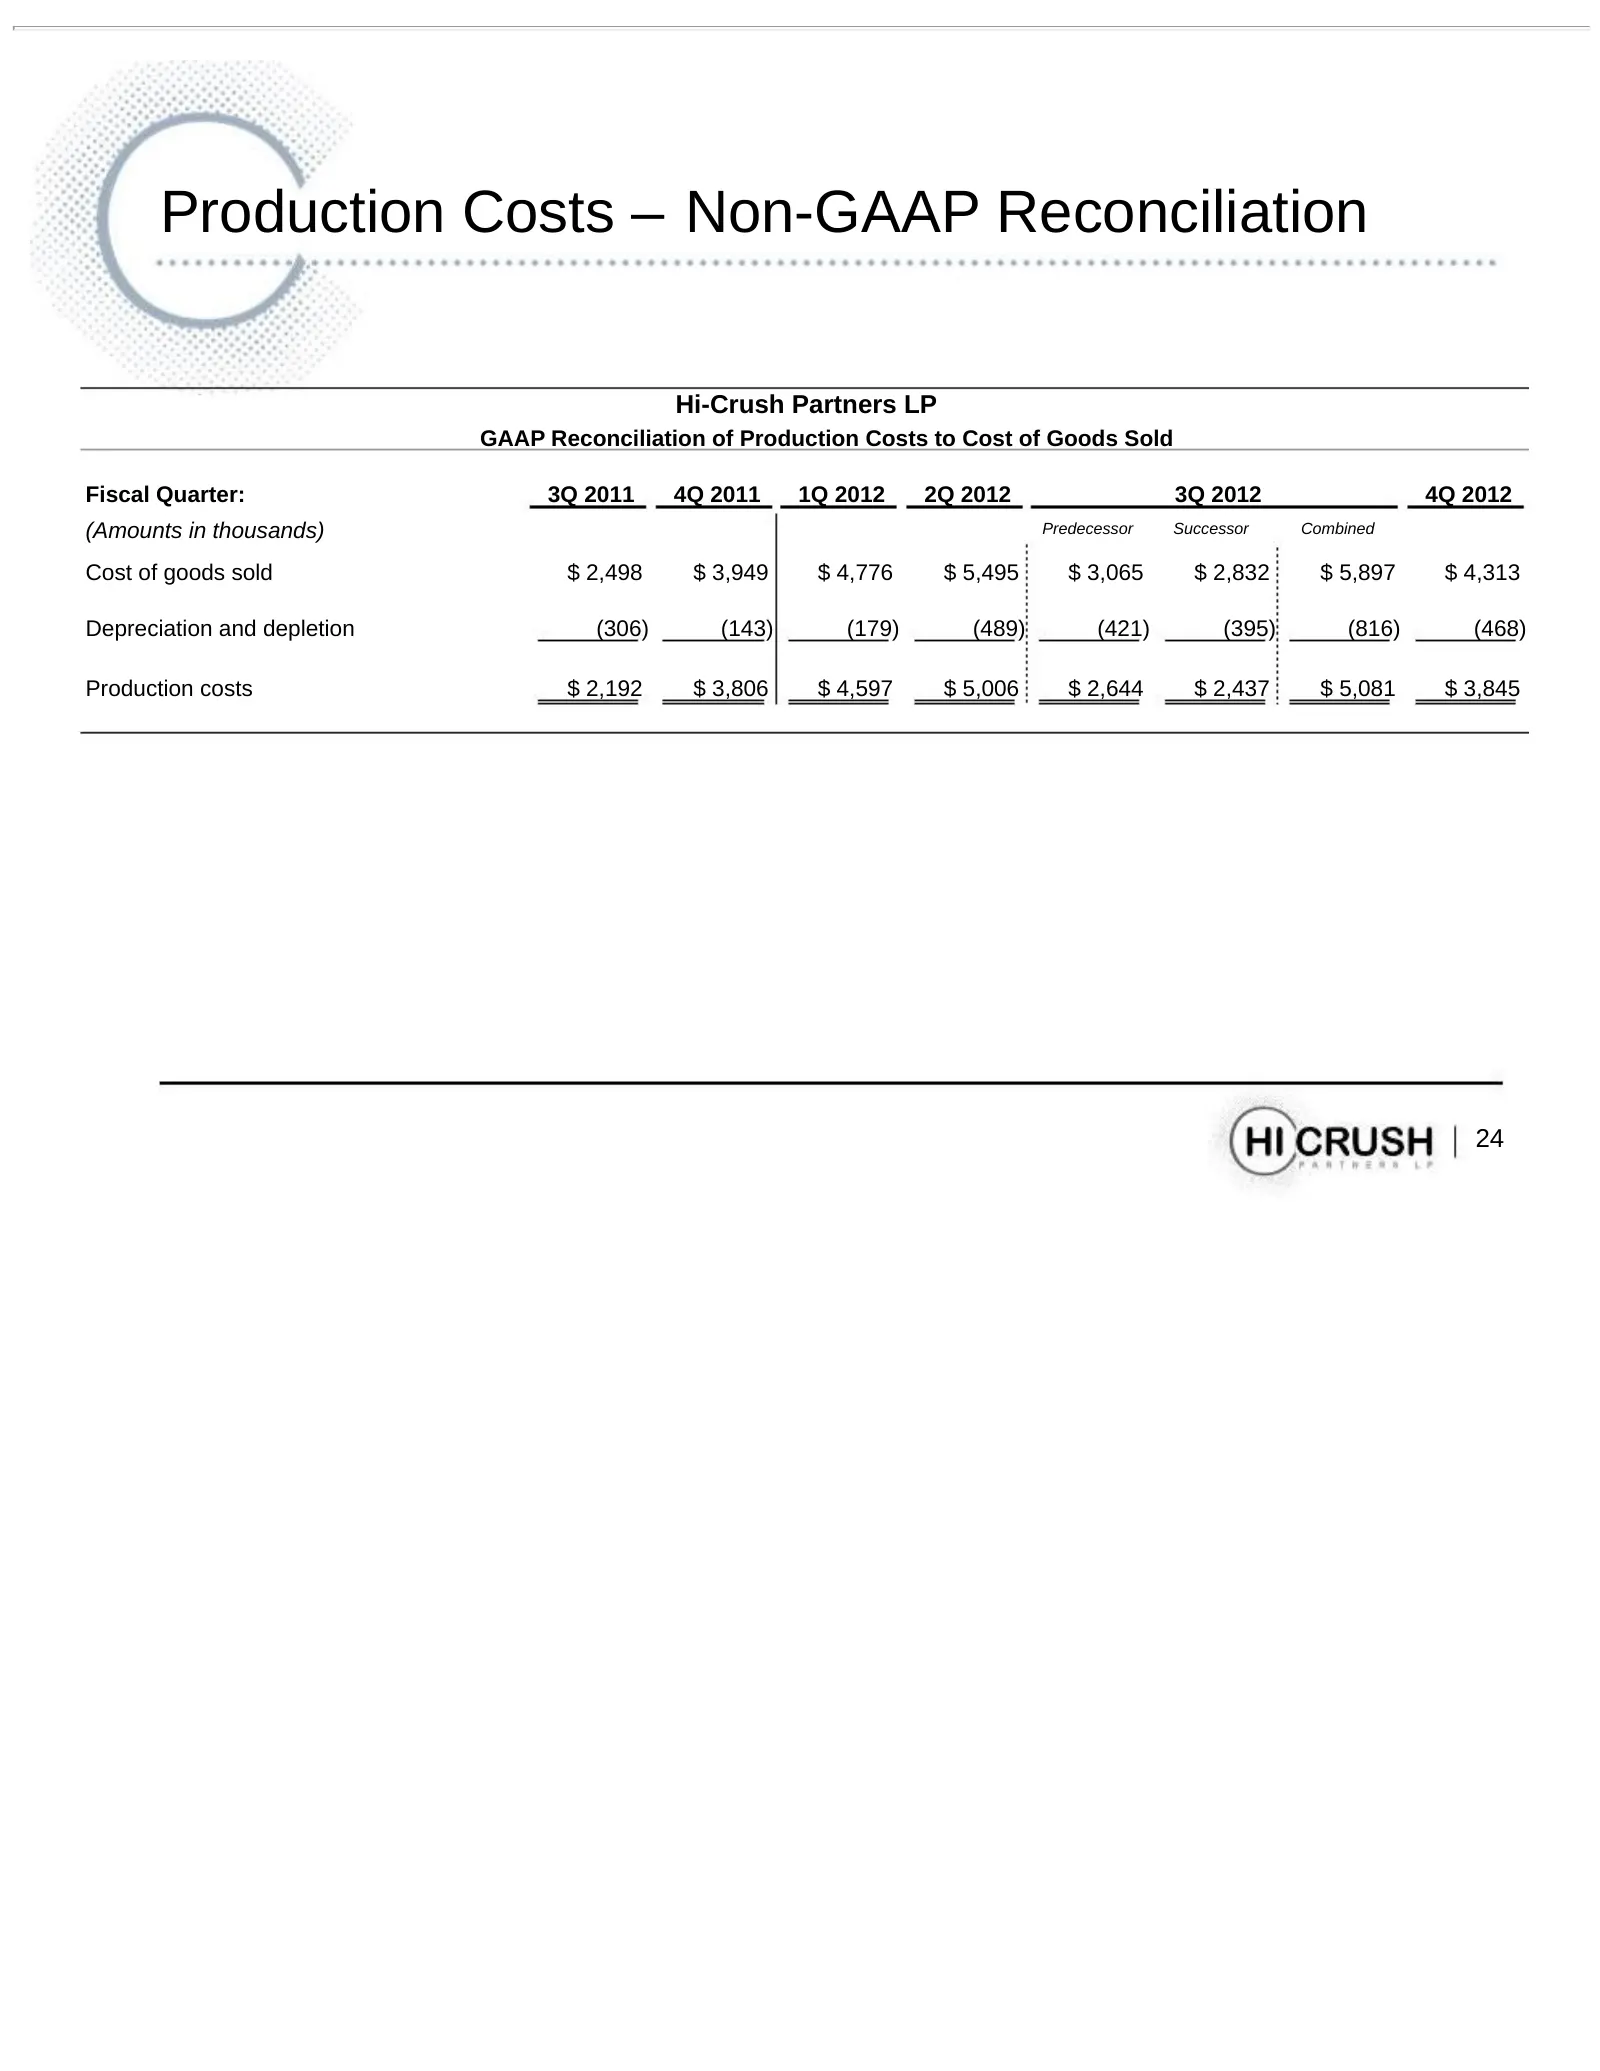
Production Costs – Non-GAAP Reconciliation Hi-Crush Partners LP GAAP Reconciliation of Production Costs to Cost of Goods Sold Fiscal Quarter: 3Q 2011 4Q 2011 1Q 2012 2Q 2012 3Q 2012 4Q 2012 (Amounts in thousands) Predecessor Successor Combined Cost of goods sold $ 2,498 $ 3,949 $ 4,776 $ 5,495 $ 3,0
Source: SEC EDGAR · 8-K filed Feb 1, 2013
More decks from Hi-Crush Partners LP
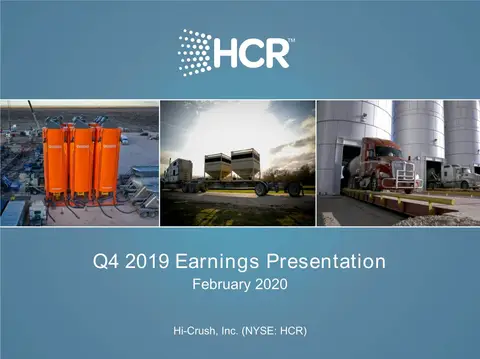 Q4 2019 Earnings Presentation21 slides · Feb 19, 2020
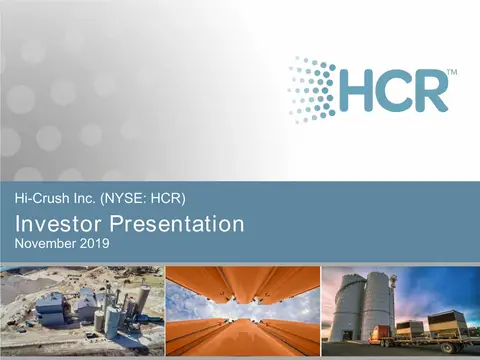 Q3 2019 Earnings Presentation19 slides · Nov 5, 2019
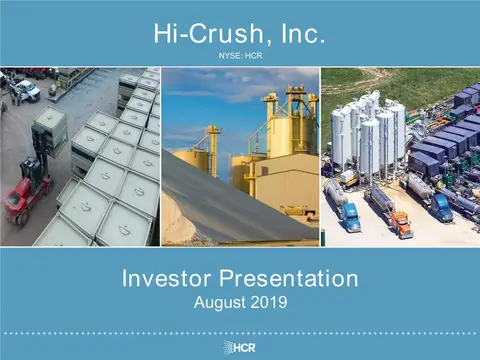 Q2 2019 Earnings Presentation25 slides · Aug 7, 2019
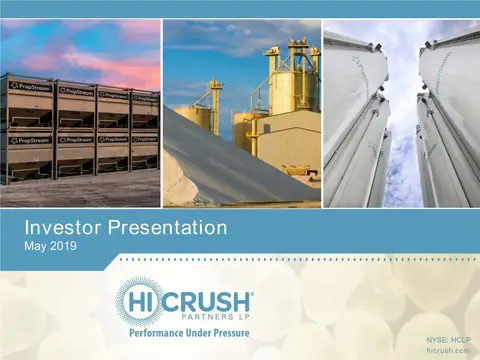 Q1 2019 Earnings Presentation21 slides · May 7, 2019
 Q4 2018 Earnings Presentation29 slides · Feb 5, 2019
 Investor Presentation (January 2019)21 slides · Jan 7, 2019