Kimball International — Q1 FY2020 Earnings Presentation
21 slides from Kimball International's earnings presentation, Nov 4, 2019
Slide 1: Q1 FY20 Earnings and Strategy Update
Exhibit 99.2 Q1 FY20 Earnings and Strategy Update November 5, 2019
Slide 2: Safe Harbor Statement
Certain statements contained within this release are considered forward- Safe Harbor looking under the Private Securities Litigation Reform Act of 1995 and are subject to risks and uncertainties including, but not limited to, the risk Statement that any projections or guidance, including revenues, m
Slide 3: Kimball International Snapshot
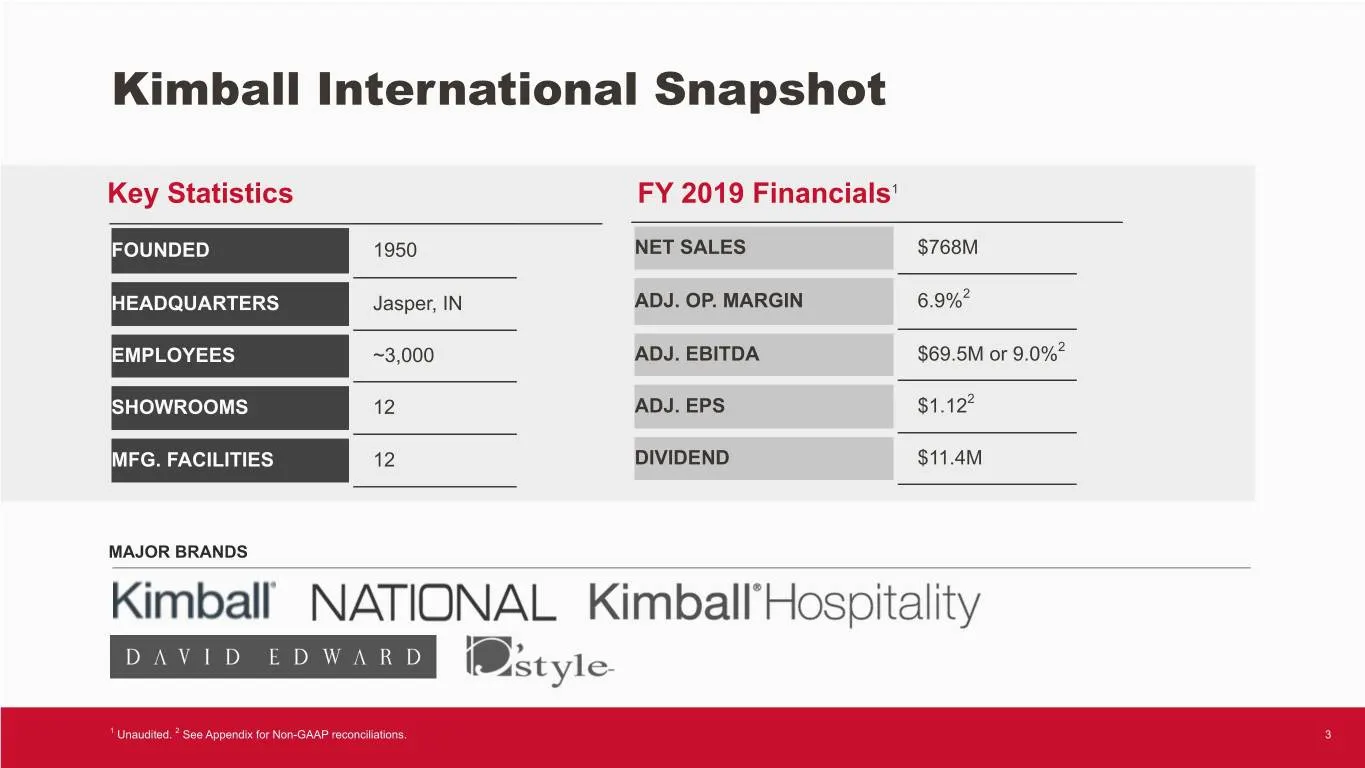
Kimball International Snapshot Key Statistics FY 2019 Financials1 FOUNDED 1950 NET SALES $768M 2 HEADQUARTERS Jasper, IN ADJ. OP. MARGIN 6.9% EMPLOYEES ~3,000 ADJ. EBITDA $69.5M or 9.0%2 SHOWROOMS 12 ADJ. EPS $1.122 MFG. FACILITIES 12 DIVIDEND $11.4M MAJOR BRANDS 1 Unaudited. 2 See Appendix for Non-
Slide 4: Q1 FY20 Highlights
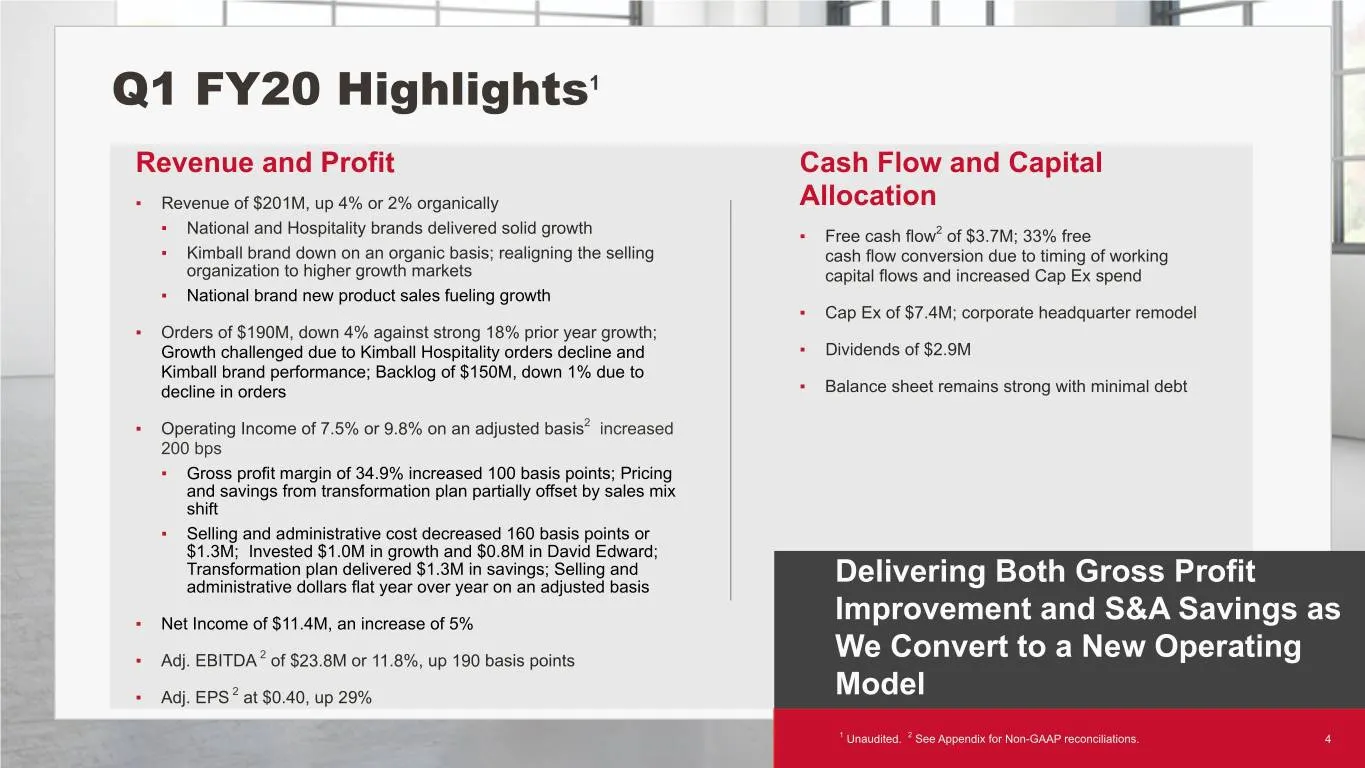
Q1 FY20 Highlights1 Revenue and Profit Cash Flow and Capital ▪ Revenue of $201M, up 4% or 2% organically Allocation ▪ National and Hospitality brands delivered solid growth ▪ Free cash flow2 of $3.7M; 33% free ▪ Kimball brand down on an organic basis; realigning the selling cash flow conversion due
Slide 5: US Furniture Leading Indicators
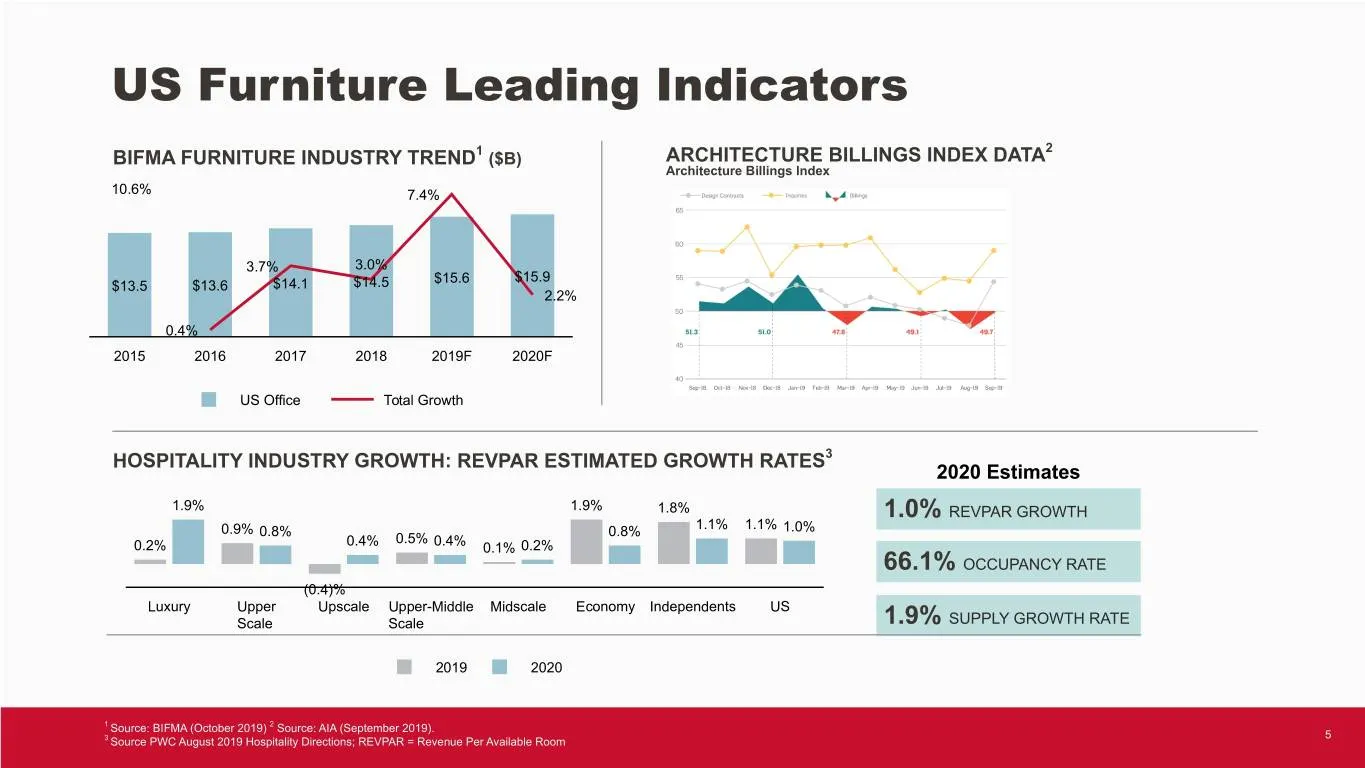
US Furniture Leading Indicators 2 BIFMA FURNITURE INDUSTRY TREND1 ($B) ARCHITECTURE BILLINGS INDEX DATA Architecture Billings Index 10.6% 7.4% 3.7% 3.0% $15.6 $15.9 $13.5 $13.6 $14.1 $14.5 2.2% 0.4% 2015 2016 2017 2018 2019F 2020F US Office Total Growth HOSPITALITY INDUSTRY GROWTH: REVPAR ESTIMATED
Slide 6: Kimball International Connect Deployment
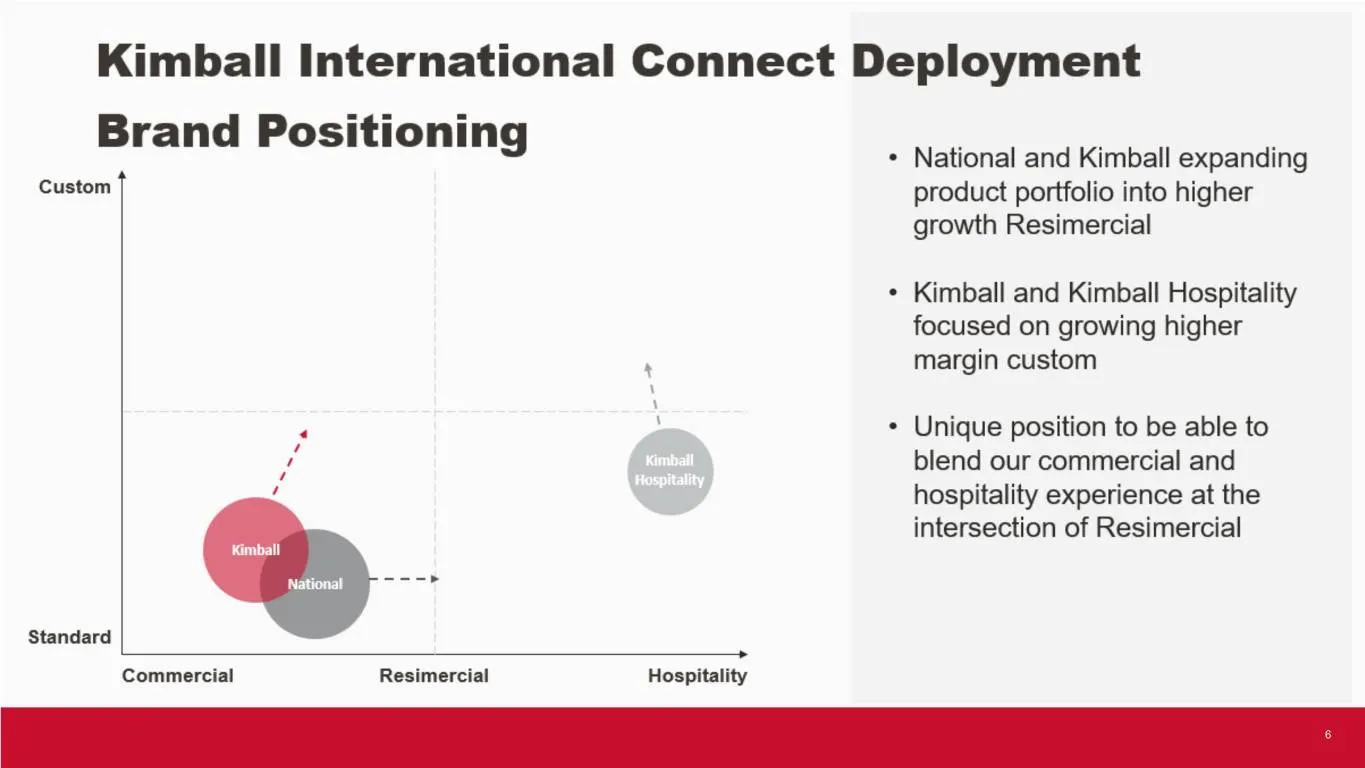
Kimball International Connect Deployment Brand Positioning * National and Kimball expanding Custom f product portfolio into higher growth Resimercial + Kimball and Kimball Hospitality focused on growing higher R margin custom + Unique position to be able to blend our commercial and hospitality exper
Slide 7: Four Strategic Imperatives Create The Foundation For Our Success
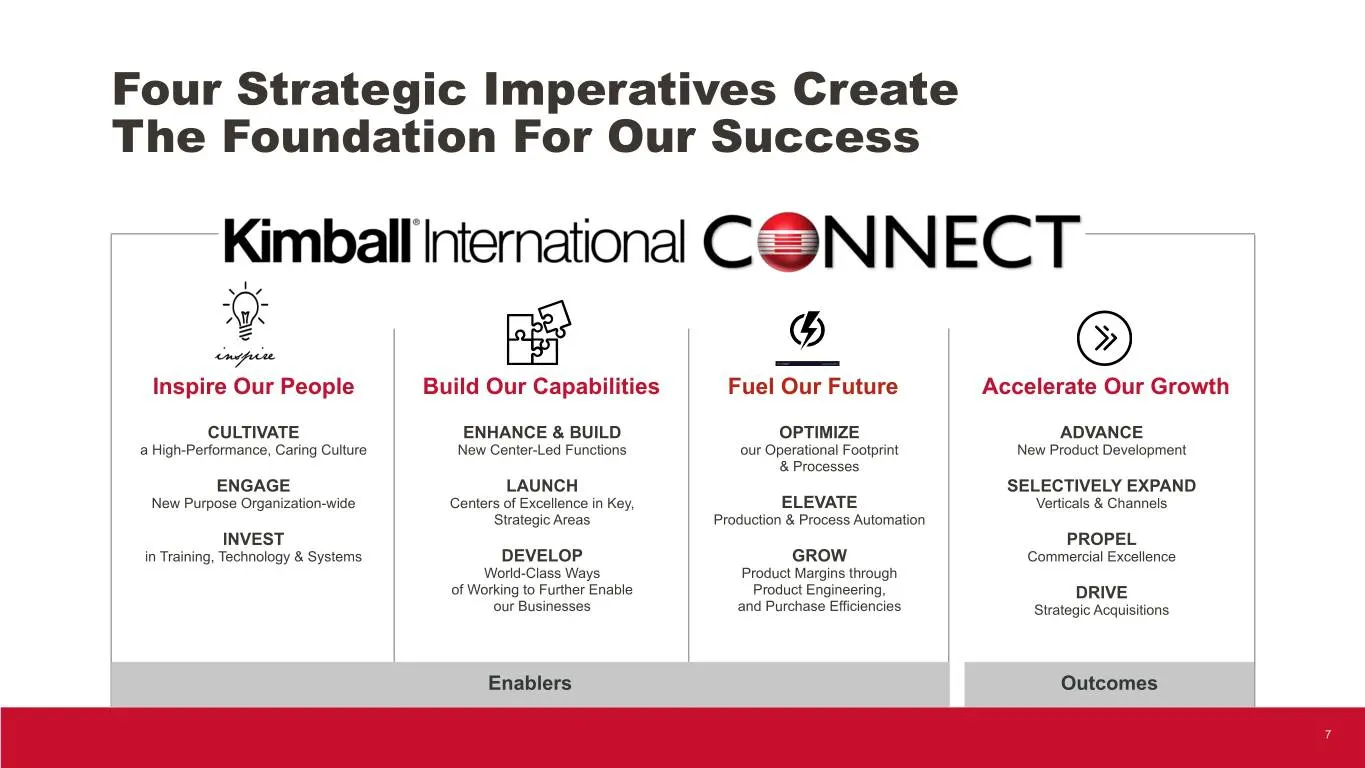
Four Strategic Imperatives Create The Foundation For Our Success Inspire Our People Build Our Capabilities Fuel Our Future Accelerate Our Growth CULTIVATE ENHANCE & BUILD OPTIMIZE ADVANCE a High-Performance, Caring Culture New Center-Led Functions our Operational Footprint New Product Development &
Slide 8: Transformation Plan Highlights
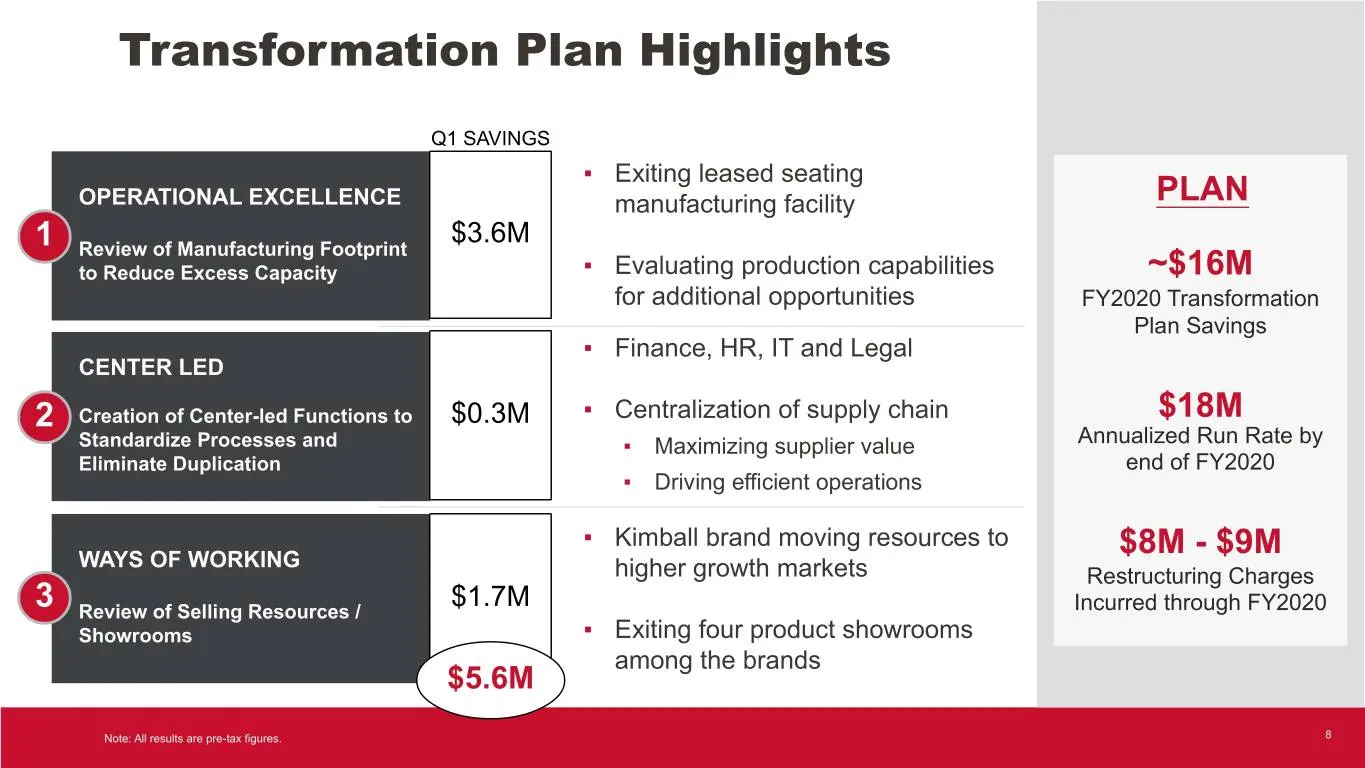
Transformation Plan Highlights Q1 SAVINGS ▪ Exiting leased seating OPERATIONAL EXCELLENCE manufacturing facility PLAN $3.6M 1 Review of Manufacturing Footprint to Reduce Excess Capacity ▪ Evaluating production capabilities ~$16M for additional opportunities FY2020 Transformation Plan Savings ▪ Finan
Slide 9: Quarterly Financial Performance
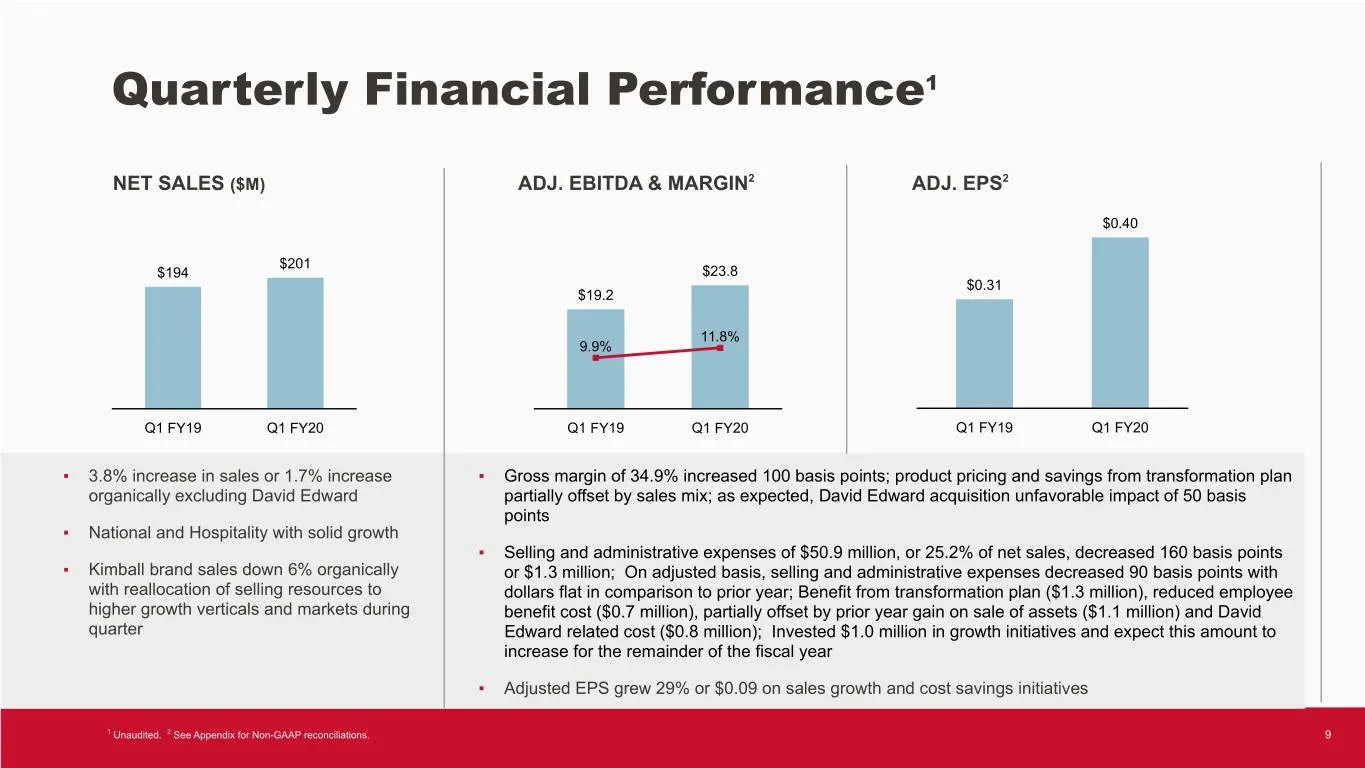
Quarterly Financial Performance1 NET SALES ($M) ADJ. EBITDA & MARGIN2 ADJ. EPS2 $0.40 $201 $194 $23.8 $0.31 $19.2 11.8% 9.9% Q1 FY19 Q1 FY20 Q1 FY19 Q1 FY20 Q1 FY19 Q1 FY20 ▪ 3.8% increase in sales or 1.7% increase ▪ Gross margin of 34.9% increased 100 basis points; product pricing and savings from
Slide 10: Quarterly Financial Performance
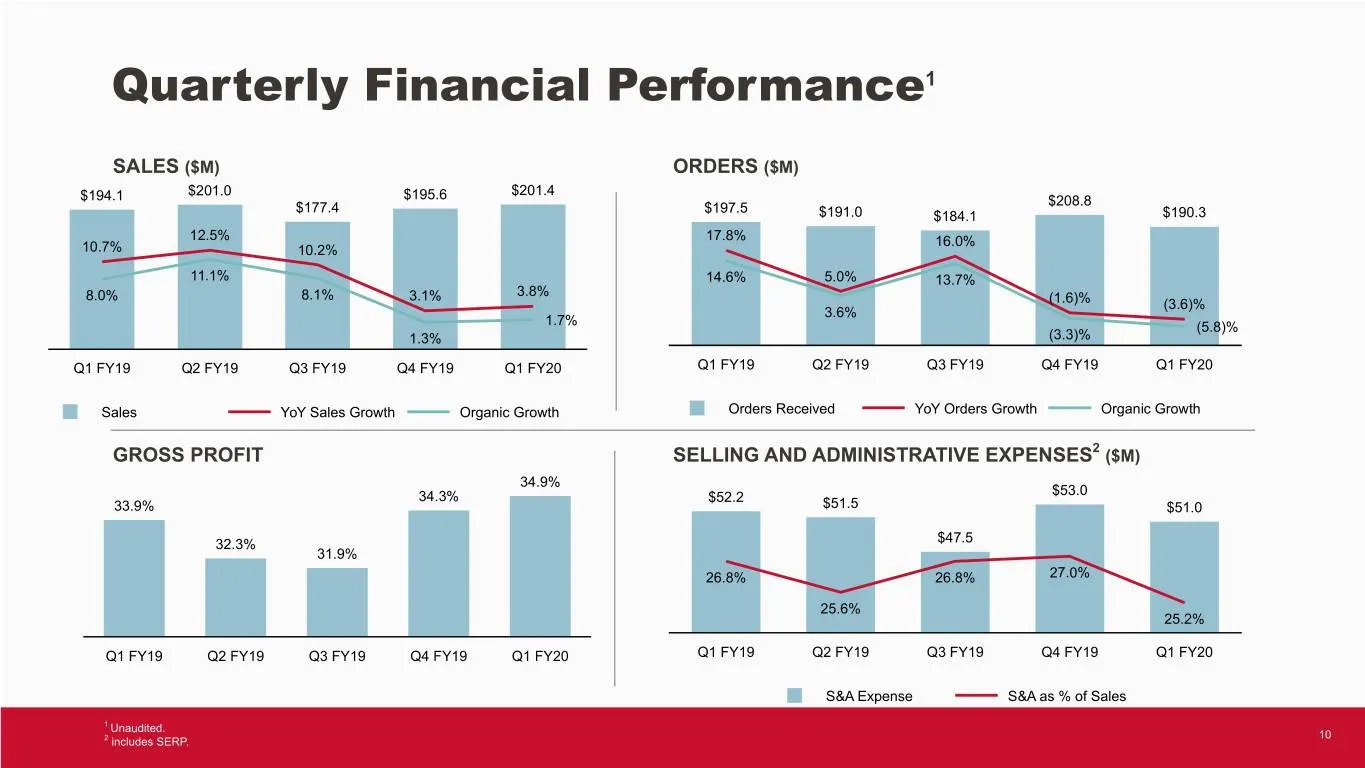
Quarterly Financial Performance1 SALES ($M) ORDERS ($M) $194.1 $201.0 $195.6 $201.4 $177.4 $197.5 $208.8 $191.0 $184.1 $190.3 12.5% 17.8% 16.0% 10.7% 10.2% 11.1% 14.6% 5.0% 13.7% 8.0% 8.1% 3.1% 3.8% (1.6)% (3.6)% 3.6% 1.7% (5.8)% 1.3% (3.3)% Q1 FY19 Q2 FY19 Q3 FY19 Q4 FY19 Q1 FY20 Q1 FY19 Q2 FY19 Q3
Slide 11: New Products Overview
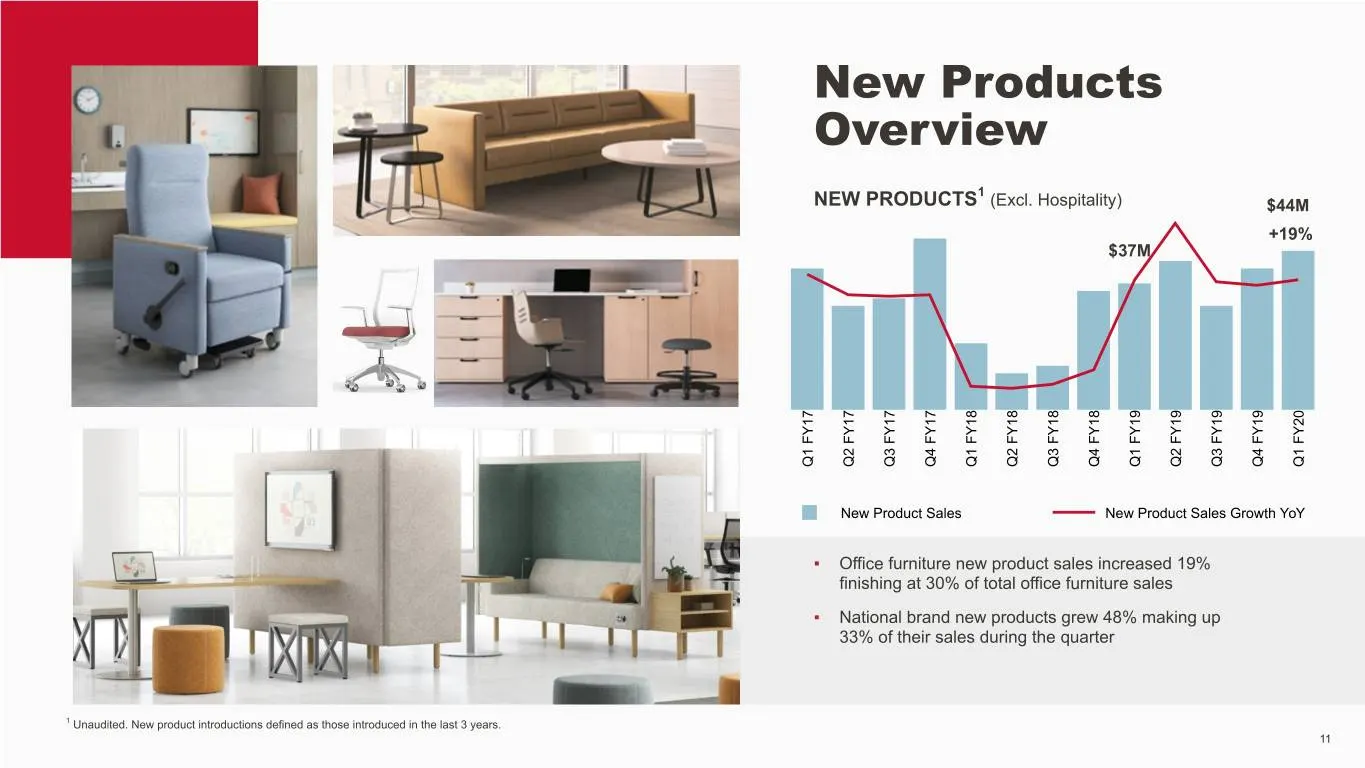
New Products Overview 1 NEW PRODUCTS (Excl. Hospitality) $44M +19% $37M 7 7 7 7 8 8 8 8 9 9 9 9 0 1 1 1 1 1 1 1 1 1 1 1 1 2 Y Y Y Y Y Y Y Y Y Y Y Y Y F F F F F F F F F F F F F 1 2 3 4 1 2 3 4 1 2 3 4 1 Q Q Q Q Q Q Q Q Q Q Q Q Q New Product Sales New Product Sales Growth YoY ▪ Office furniture new pr
Slide 12: Sales by Vertical
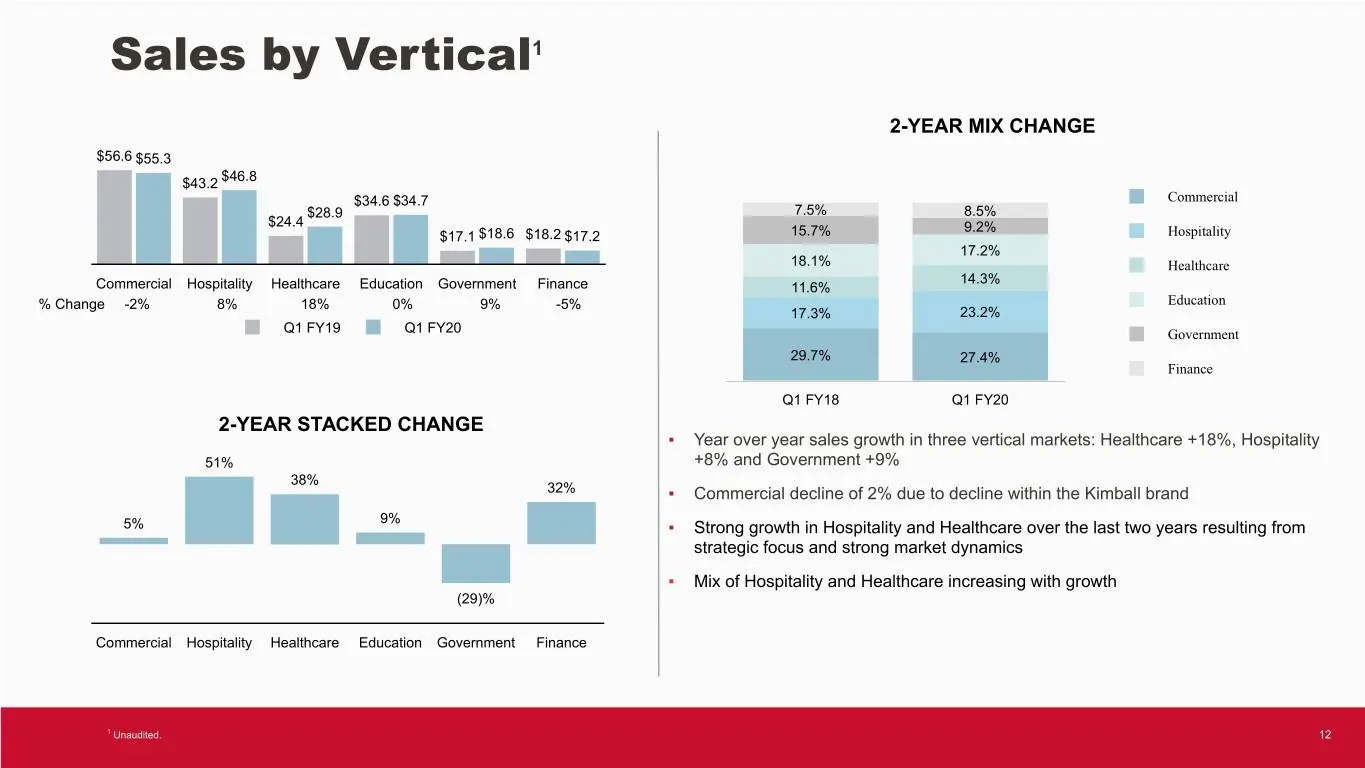
Sales by Vertical1 2-YEAR MIX CHANGE $56.6 $55.3 $46.8 $43.2 $34.6 $34.7 Commercial $28.9 7.5% 8.5% $24.4 9.2% $17.1 $18.6 $18.2 $17.2 15.7% Hospitality 17.2% 18.1% Healthcare 14.3% Commercial Hospitality Healthcare Education Government Finance 11.6% % Change -2% 8% 18% 0% 9% -5% Education 17.3% 23.
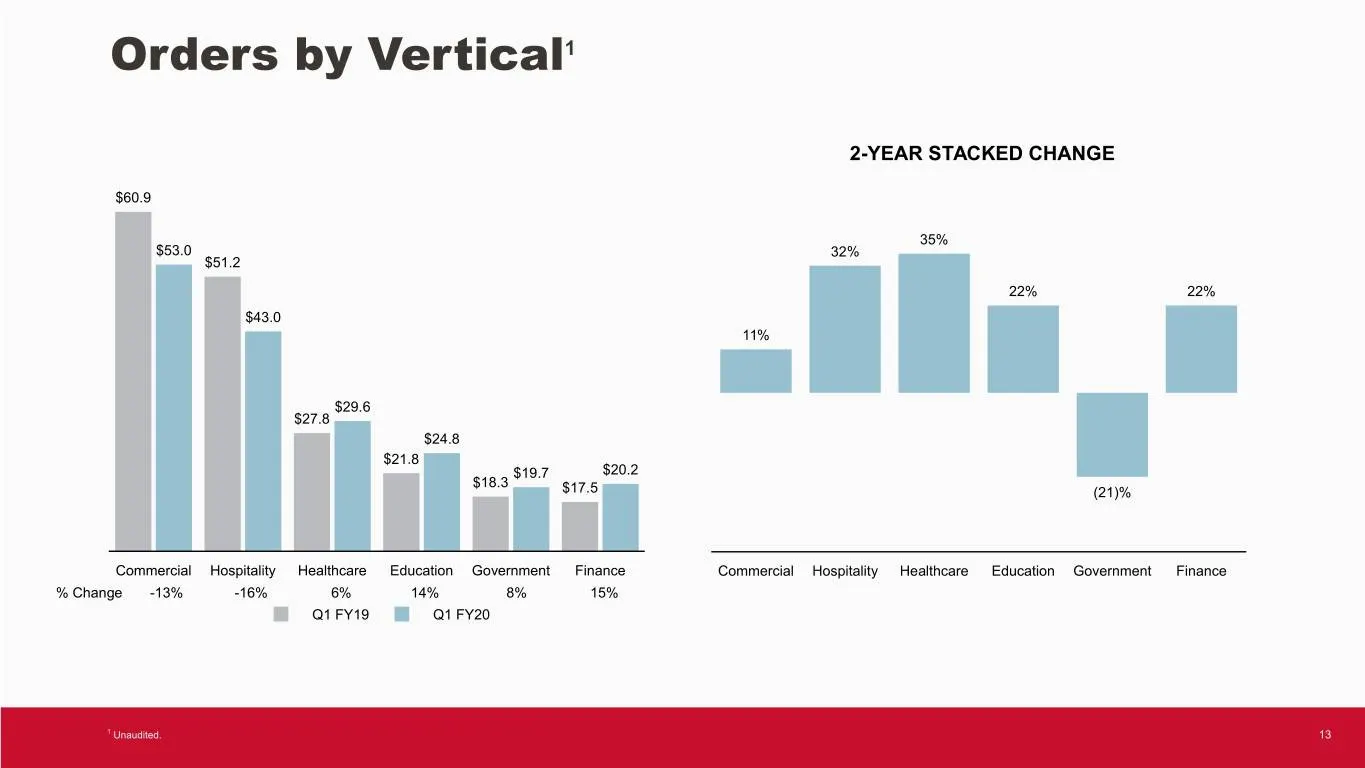
Slide 13: Orders by Vertical
Orders by Vertical1 2-YEAR STACKED CHANGE $60.9 35% $53.0 32% $51.2 22% 22% $43.0 11% $29.6 $27.8 $24.8 $21.8 $19.7 $20.2 $18.3 $17.5 (21)% Commercial Hospitality Healthcare Education Government Finance Commercial Hospitality Healthcare Education Government Finance % Change -13% -16% 6% 14% 8% 15% Q
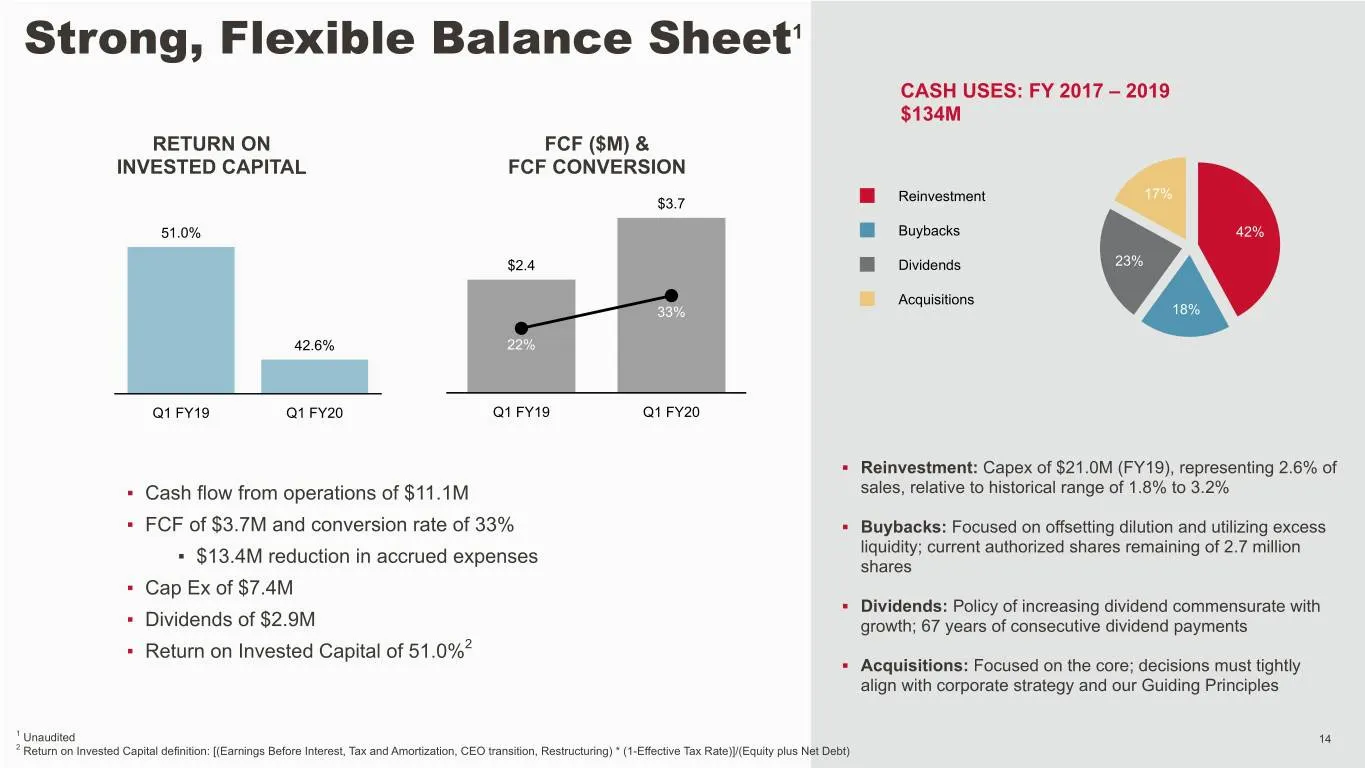
Slide 14: Strong, Flexible Balance Sheet
Strong, Flexible Balance Sheet1 CASH USES: FY 2017 – 2019 $134M RETURN ON FCF ($M) & INVESTED CAPITAL FCF CONVERSION Reinvestment 17% $3.7 51.0% Buybacks 42% $2.4 Dividends 23% Acquisitions 33% 18% 42.6% 22% Q1 FY19 Q1 FY20 Q1 FY19 Q1 FY20 ▪ Reinvestment: Capex of $21.0M (FY19), representing 2.6% of
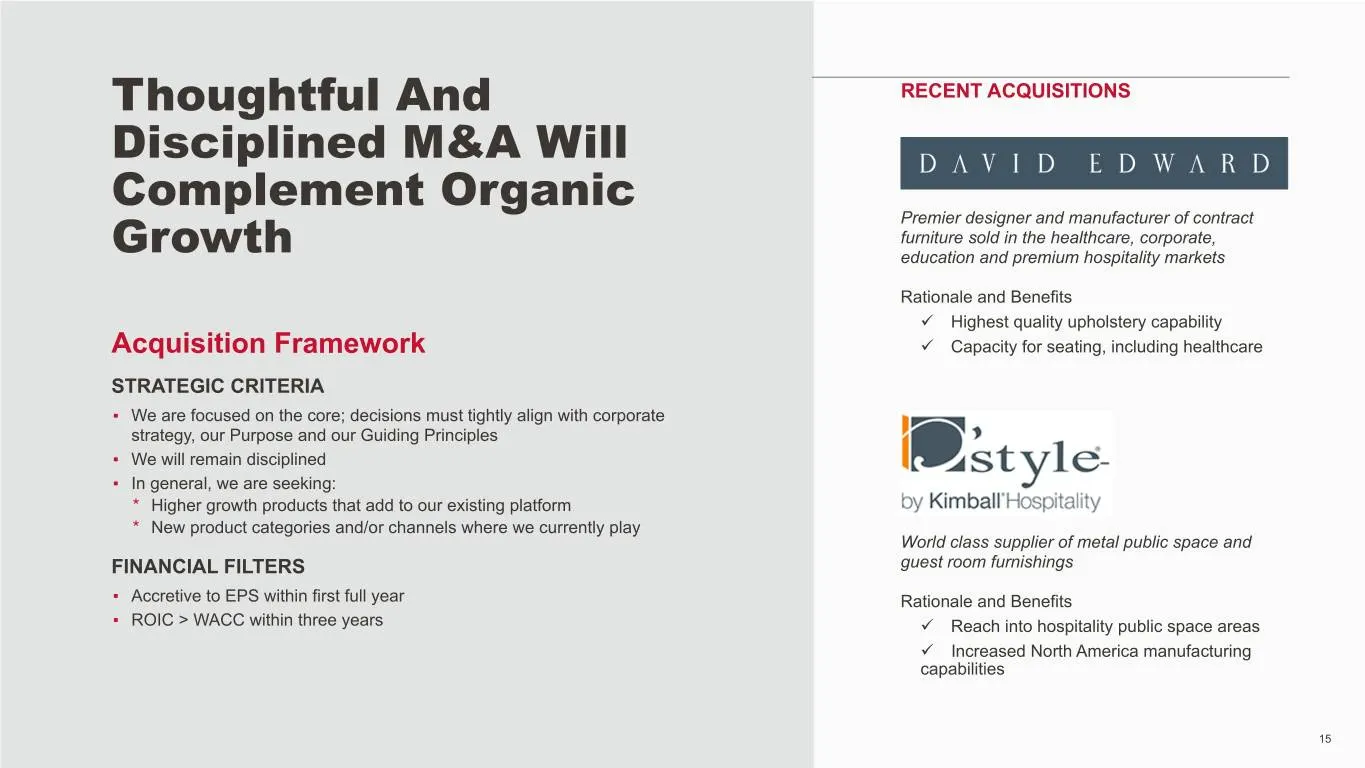
Slide 15: Thoughtful And Disciplined M&A Will Complement Organic Growth
Thoughtful And RECENT ACQUISITIONS Disciplined M&A Will Complement Organic Premier designer and manufacturer of contract furniture sold in the healthcare, corporate, Growth education and premium hospitality markets Rationale and Benefits ü Highest quality upholstery capability Acquisition Framework
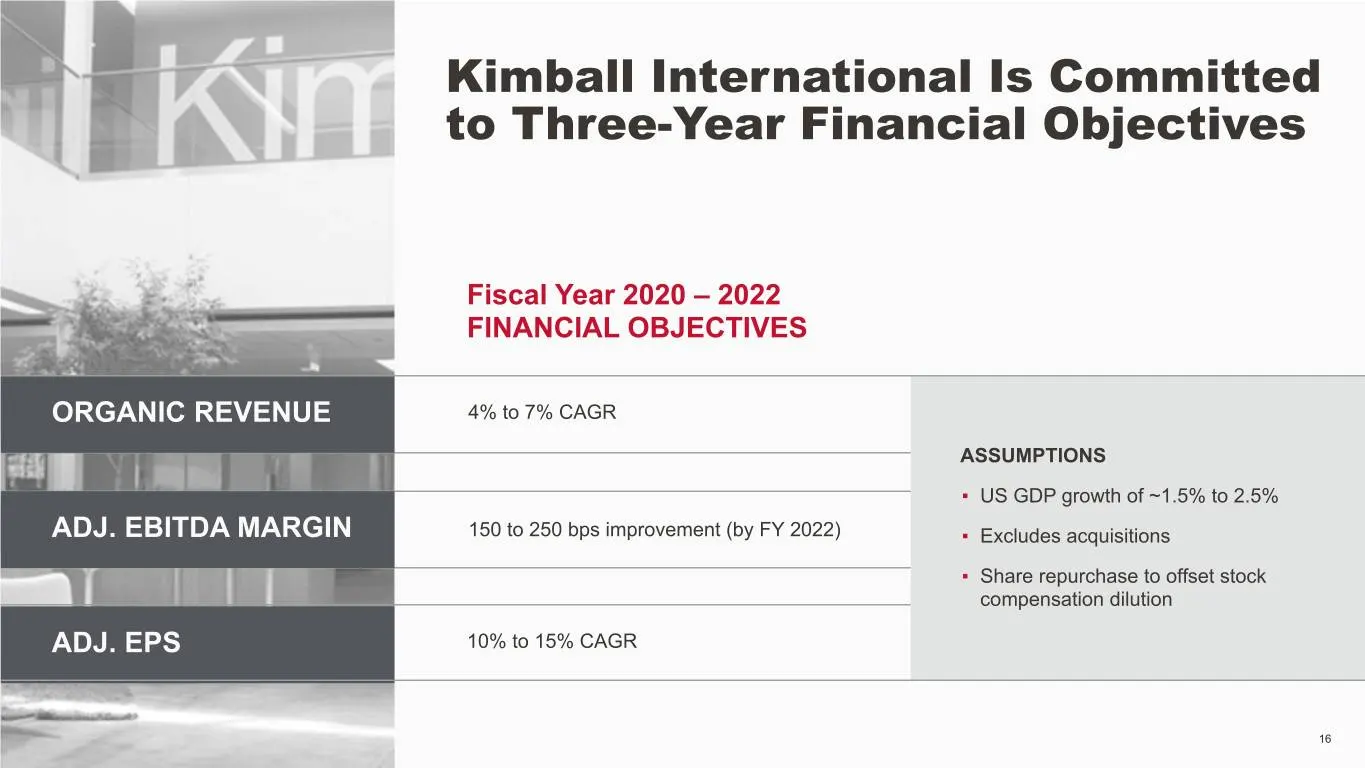
Slide 16: Three-Year Financial Objectives Fiscal Year 2020-2022
Kimball International Is Committed to Three-Year Financial Objectives Fiscal Year 2020 – 2022 FINANCIAL OBJECTIVES ORGANIC REVENUE 4% to 7% CAGR ASSUMPTIONS ▪ US GDP growth of ~1.5% to 2.5% ADJ. EBITDA MARGIN 150 to 250 bps improvement (by FY 2022) ▪ Excludes acquisitions ▪ Share repurchase to offse
Slide 17: FY20 EBITDA Growth Bridge
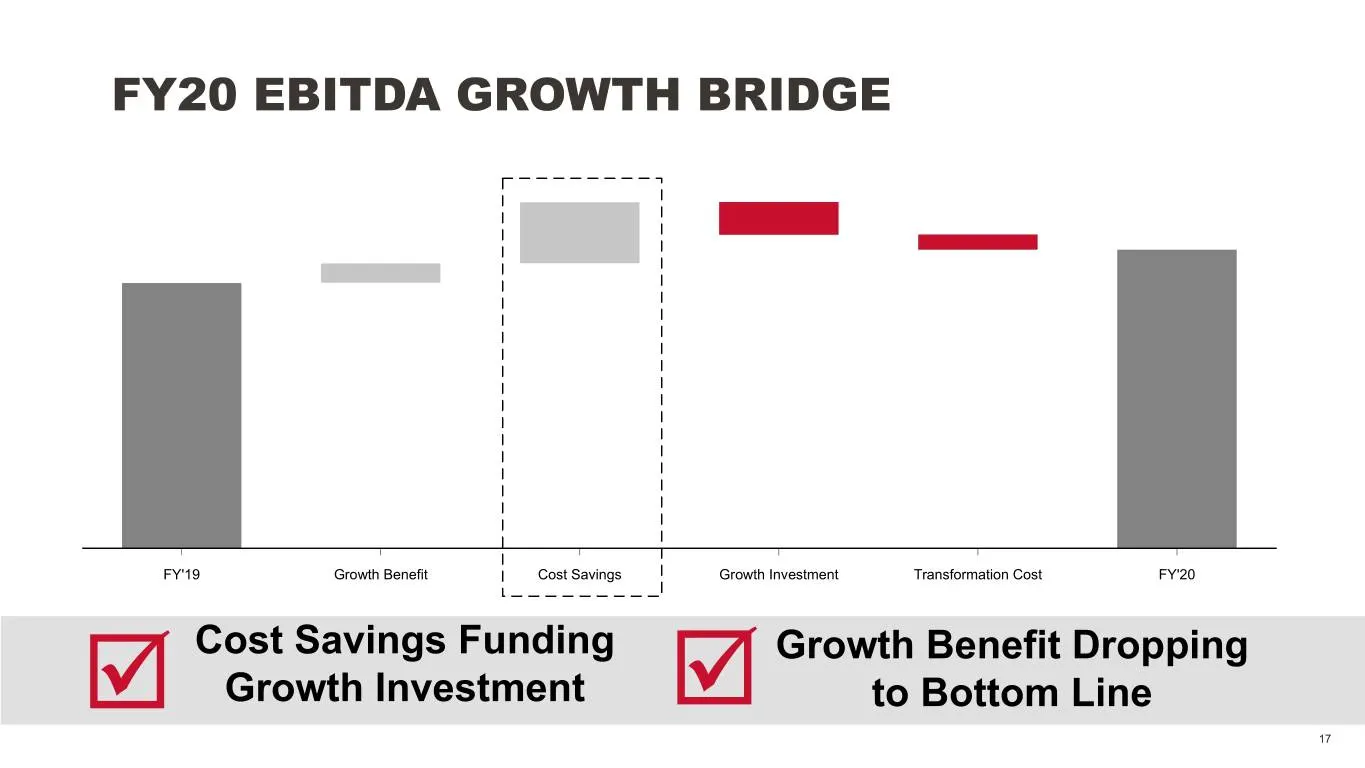
FY20 EBITDA GROWTH BRIDGE FY'19 Growth Benefit Cost Savings Growth Investment Transformation Cost FY'20 þ Cost Savings Funding þ Growth Benefit Dropping Growth Investment to Bottom Line 17
Slide 18: We Are On a Journey to Excellence - Invest With Us
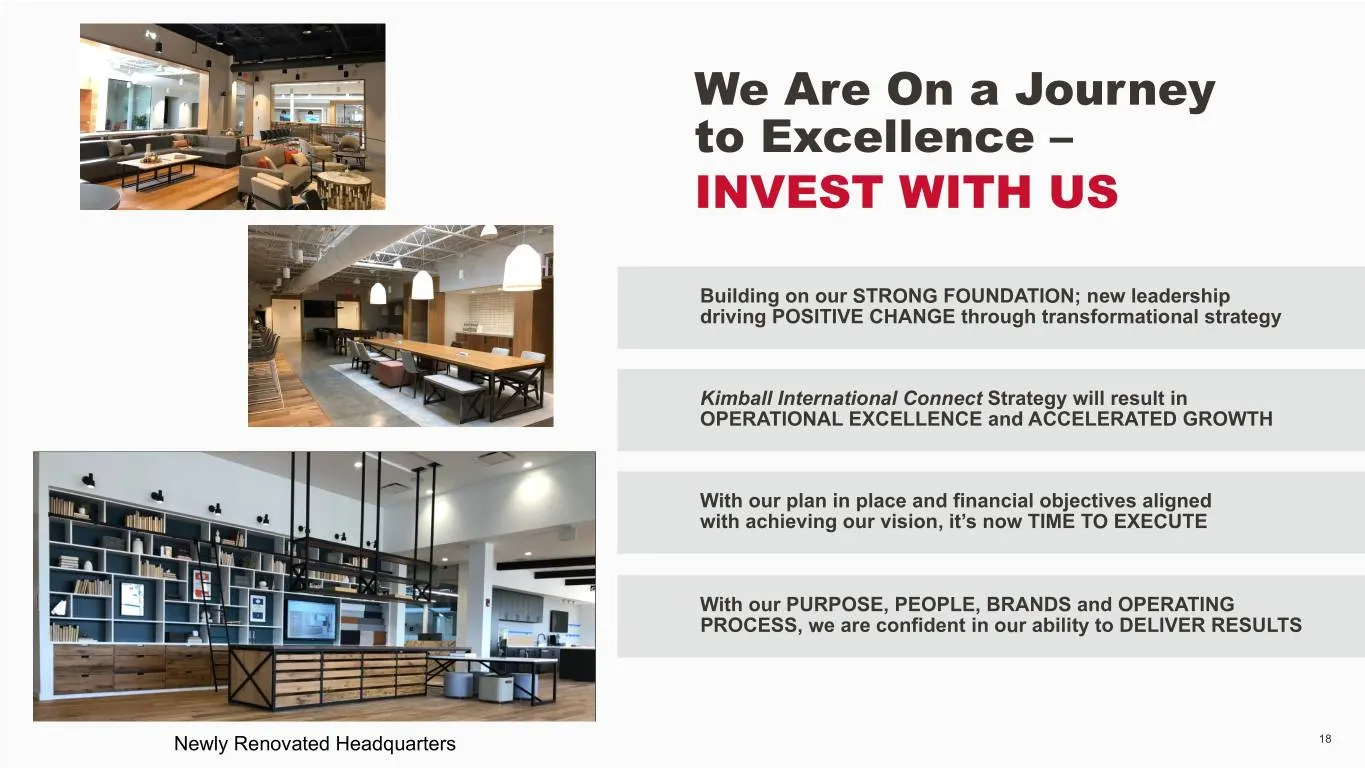
We Are On a Journey to Excellence – INVEST WITH US Building on our STRONG FOUNDATION; new leadership driving POSITIVE CHANGE through transformational strategy Kimball International Connect Strategy will result in OPERATIONAL EXCELLENCE and ACCELERATED GROWTH With our plan in place and financial obje
Slide 19: Appendix
Appendix 19
Slide 20: Non-GAAP Reconciliation
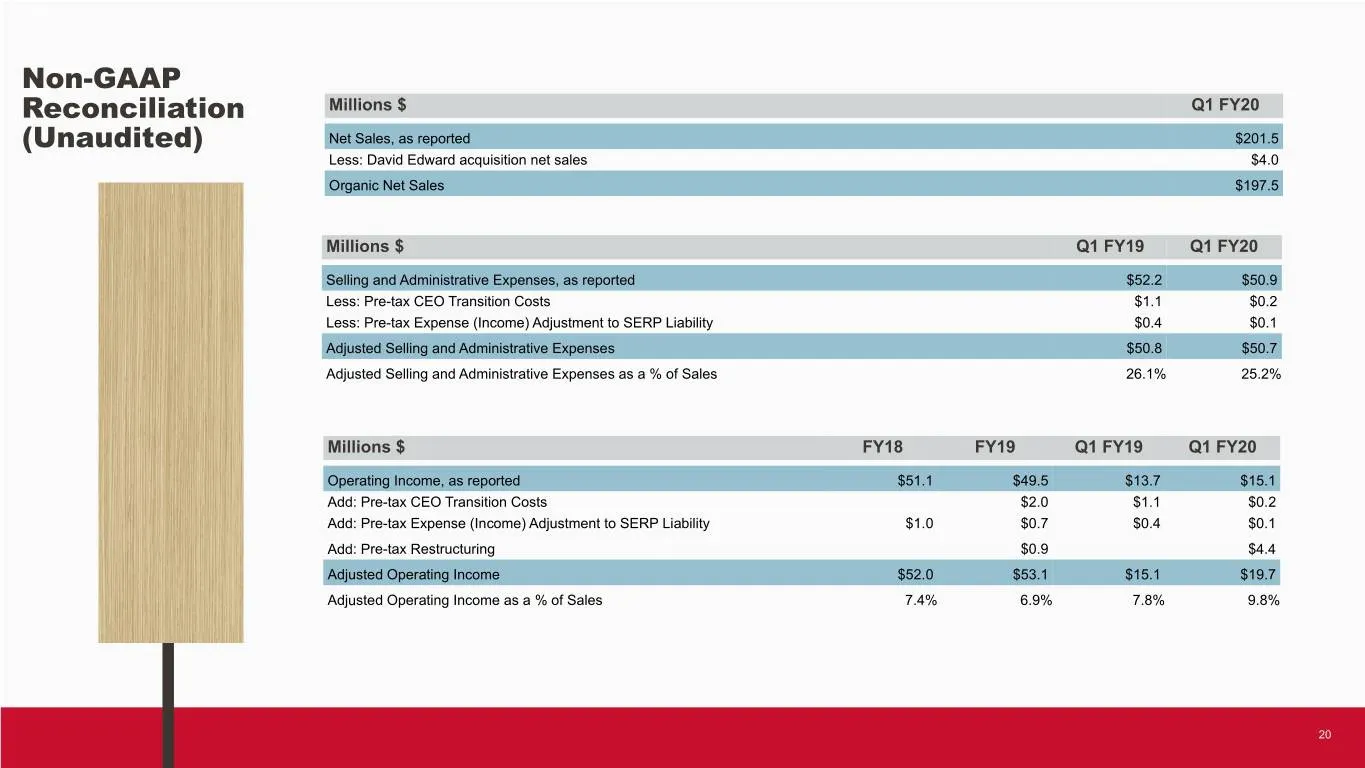
Non-GAAP Reconciliation Millions $ Q1 FY20 (Unaudited) Net Sales, as reported $201.5 Less: David Edward acquisition net sales $4.0 Organic Net Sales $197.5 Millions $ Q1 FY19 Q1 FY20 Selling and Administrative Expenses, as reported $52.2 $50.9 Less: Pre-tax CEO Transition Costs $1.1 $0.2 Less: Pre-t
Slide 21: Non-GAAP Reconciliation
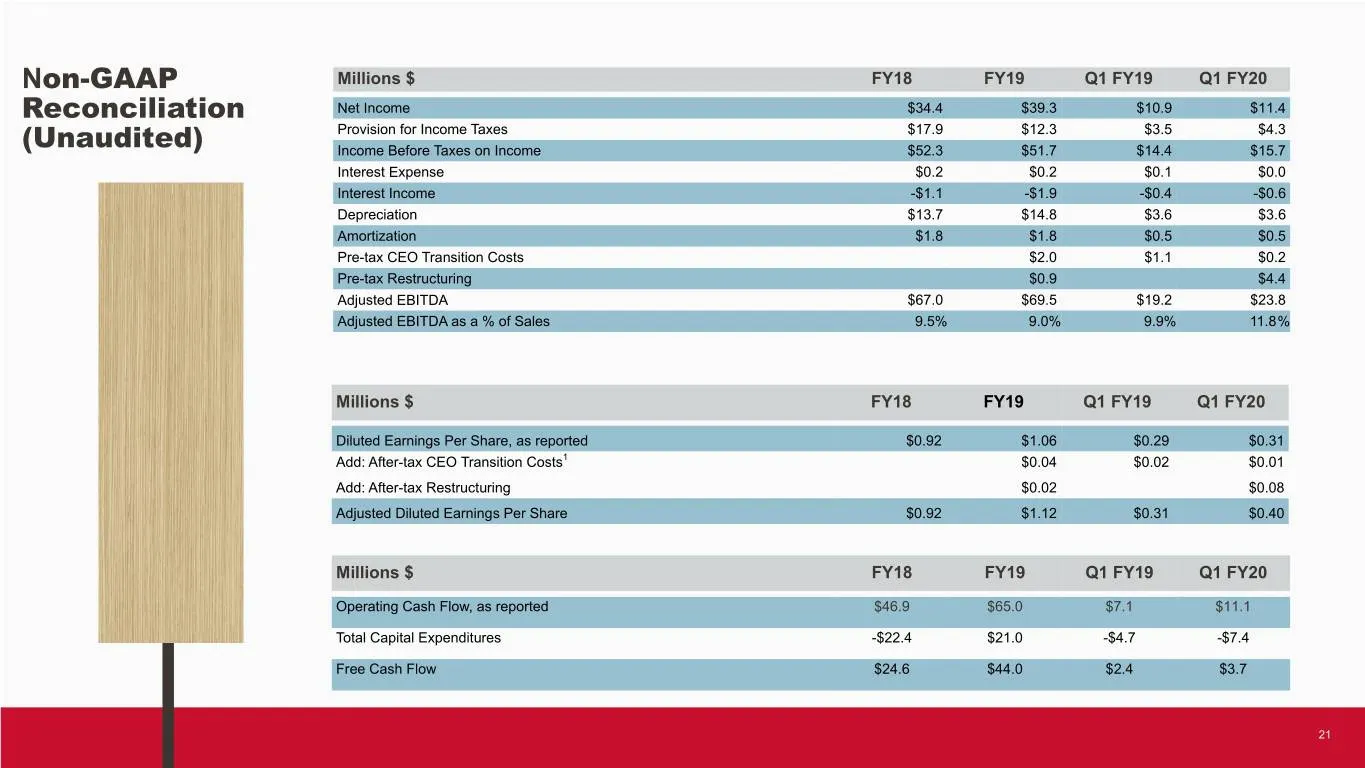
Non-GAAP Millions $ FY18 FY19 Q1 FY19 Q1 FY20 Reconciliation Net Income $34.4 $39.3 $10.9 $11.4 Provision for Income Taxes $17.9 $12.3 $3.5 $4.3 (Unaudited) Income Before Taxes on Income $52.3 $51.7 $14.4 $15.7 Interest Expense $0.2 $0.2 $0.1 $0.0 Interest Income -$1.1 -$1.9 -$0.4 -$0.6 Depreciation
Source: SEC EDGAR · 8-K filed Nov 4, 2019
More decks from Kimball International Inc
 Merger or Acquisition (May 2023)30 slides · May 23, 2023
 Merger or Acquisition (March 2023)15 slides · Mar 8, 2023
 Q2 FY2023 Earnings Presentation16 slides · Feb 2, 2023
 Q1 FY2023 Earnings Presentation17 slides · Nov 3, 2022
 Q4 FY2022 Earnings Presentation18 slides · Aug 4, 2022
 Q3 FY2022 Earnings Presentation17 slides · May 3, 2022