U.S. Concrete — Stephens, Inc. Investor Meetings (August 2008)
39 slides from U.S. Concrete's conference presentation, Aug 20, 2008
Slide 1: Stephens, Inc. Investor Meetings
Stephens, Inc. Investor Meetings August 20 - 21, 2008
Slide 2: Forward-Looking Statement
US concrete | Forward-Looking Statement Certain statements provided in this presentation, including those that express a belief, expectation or intention and those that are not of historical fact, are "forward-looking statements" within the meaning of Section 274 of the Securities Act of 1933 and Se
Slide 3: Company Overview
Company Overview
Slide 4: Top Producer of ready-mixed concrete in the U.S.
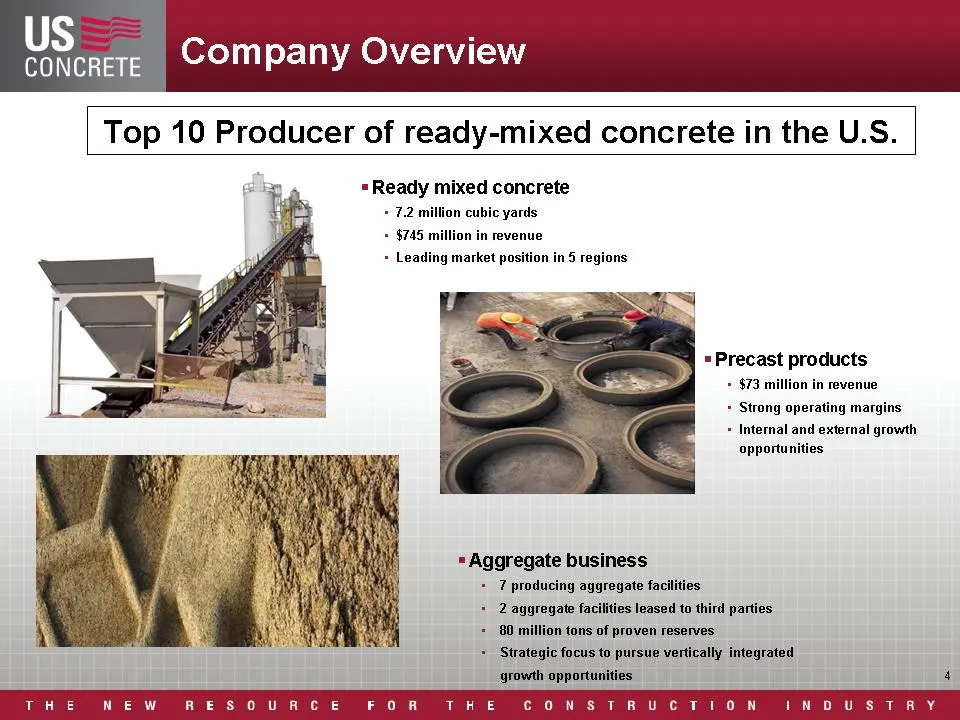
Top 10 Producer of ready-mixed concrete in the U.S. = Ready mixed concrete + 7.2 million cubic yards + $745 + Leading market position in 5 regions ion in revenue = 4 "Precast products j + $73 million in revenue + Strong operating margins + Internal and external growth opportunities . fagrenale busin
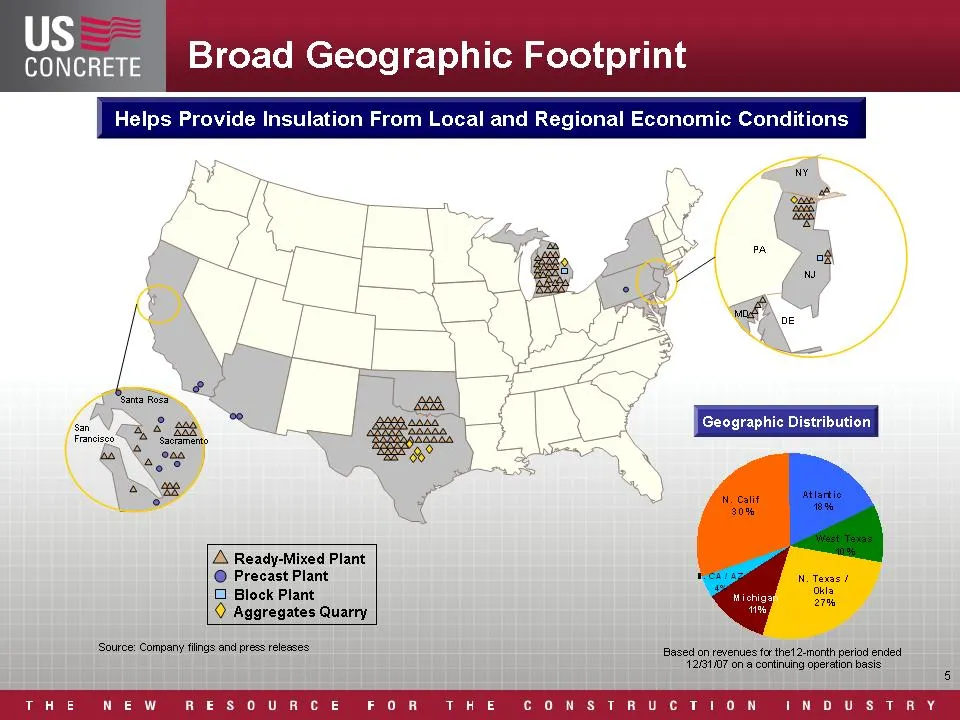
Slide 5: Broad Geographic Footprint
US concrete Broad Geographic Footprint Helps Provide Insulat J Ready-Mixed Plant © Precast Plant N. Temas / Block Plant ae © Aggregates Quarry ‘Source: Company ings enc! press releases: Based on revenues for thet 2:month perio ended 1261007 0 neration basis THE NEW RESOURCE FOR THE ONSTRUCTION INDUS
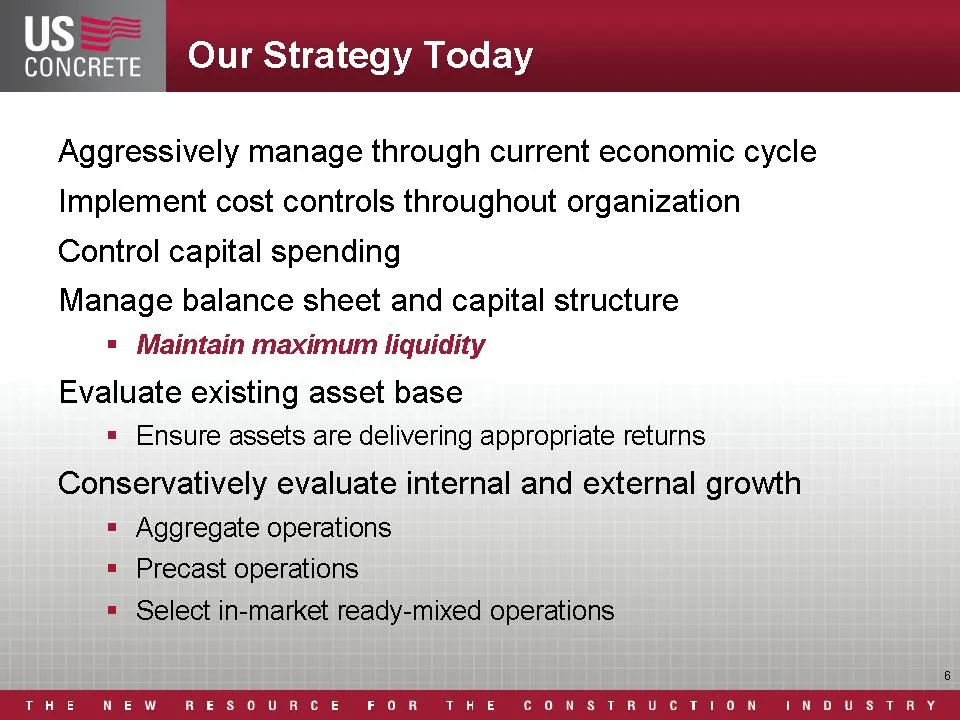
Slide 6: Our Strategy Today
US. Our Strategy Today Aggressively manage through current economic cycle Implement cost controls throughout organization Control capital spending Manage balance sheet and capital structure = Maintain maximum liquidity Evaluate existing asset base = Ensure assets are delivering appropriate returns C
Slide 7: Industry Overview
Industry Overview
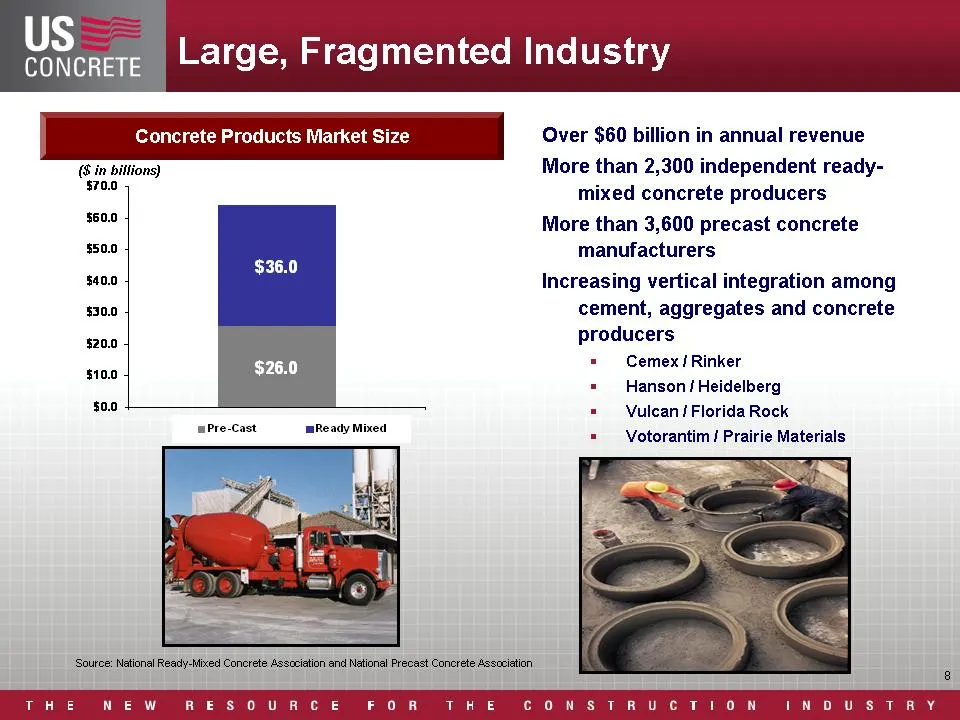
Slide 8: Concrete Products Market Over $60 billion in annual revenue
Concrete Products Market Over $60 billion in annual revenue (8 in biffions) More than 2,300 independent ready- S700 mixed concrete producers abo. More than 3,600 precast concrete 3500 manufacturers $40.0 Increasing vertical integration among $30.0 cement, aggregates and concrete s200 producers = Cem
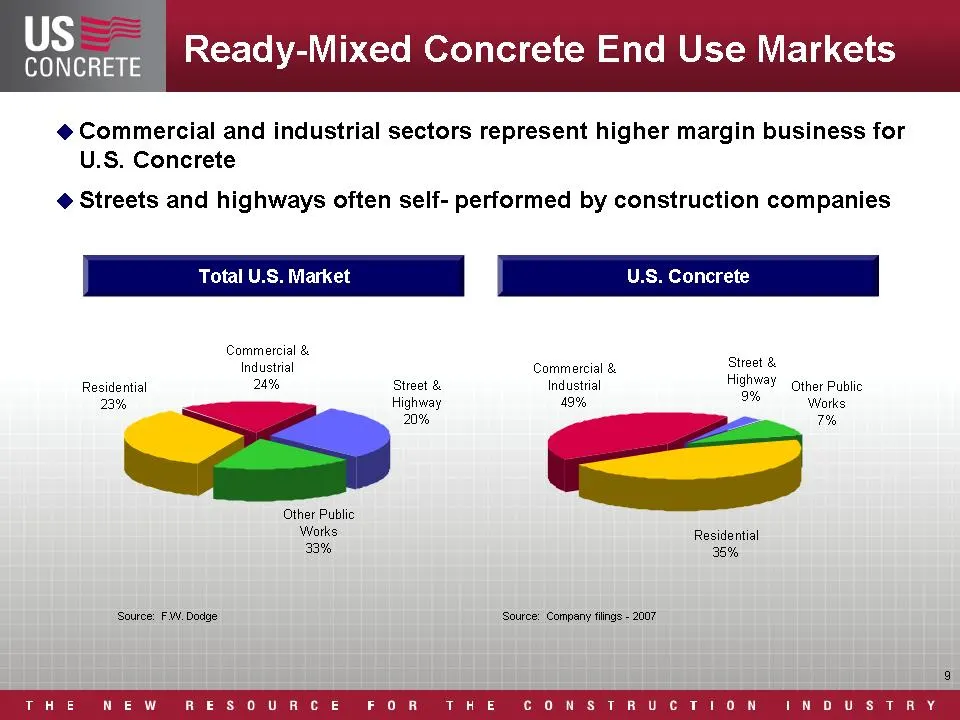
Slide 9: Ready-Mixed Concrete End Use Markets
US CONCRETE Ready-Mixed Concrete End Use Markets @ Commercial and industrial sectors represent higher margin business for U.S. Concrete @ Streets and highways often self- performed by construction companies Commercial & Industrial Residential 24% Street & 23% Highway 20% Other Public Works 33% Sourc
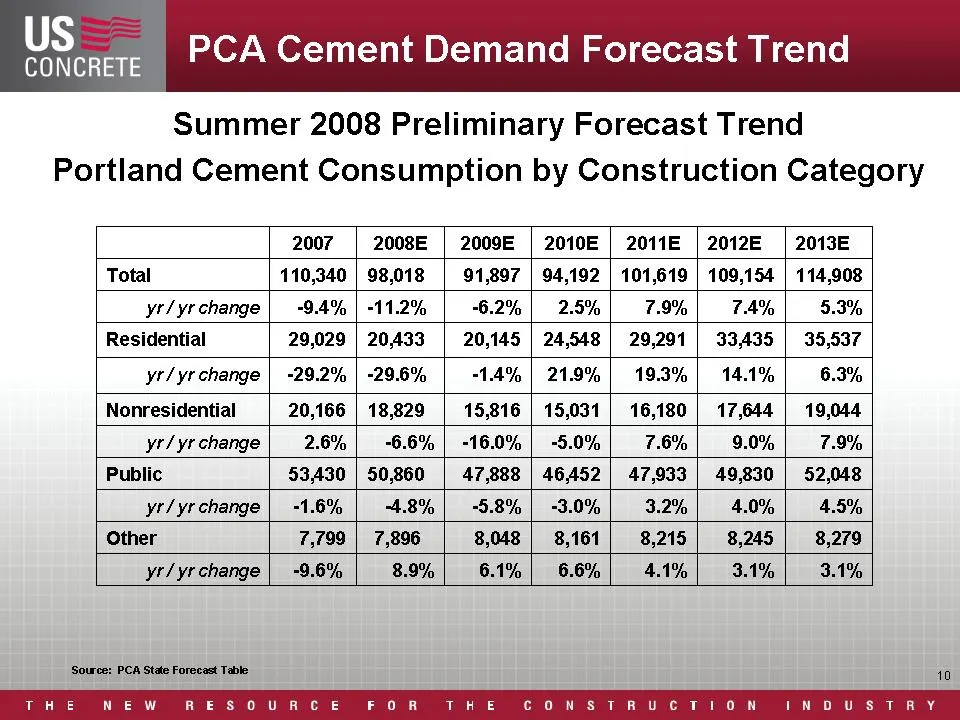
Slide 10: PCA Cement Demand Forecast Trend
U US. | PCA Cement Demand Forecast Trend Summer 2008 Preliminary Forecast Trend Portland Cement Consumption by Construction Category 2007 2008E | 2009E | 2010E | 2011E | 2012E | 2013E Total 110,340 | 98,018 | 91,897 | 94,192 | 101,619 | 109,154 | 114,908 yr/yrchange | -94% | -11.2% 6.2% | 2.5% 7.9%
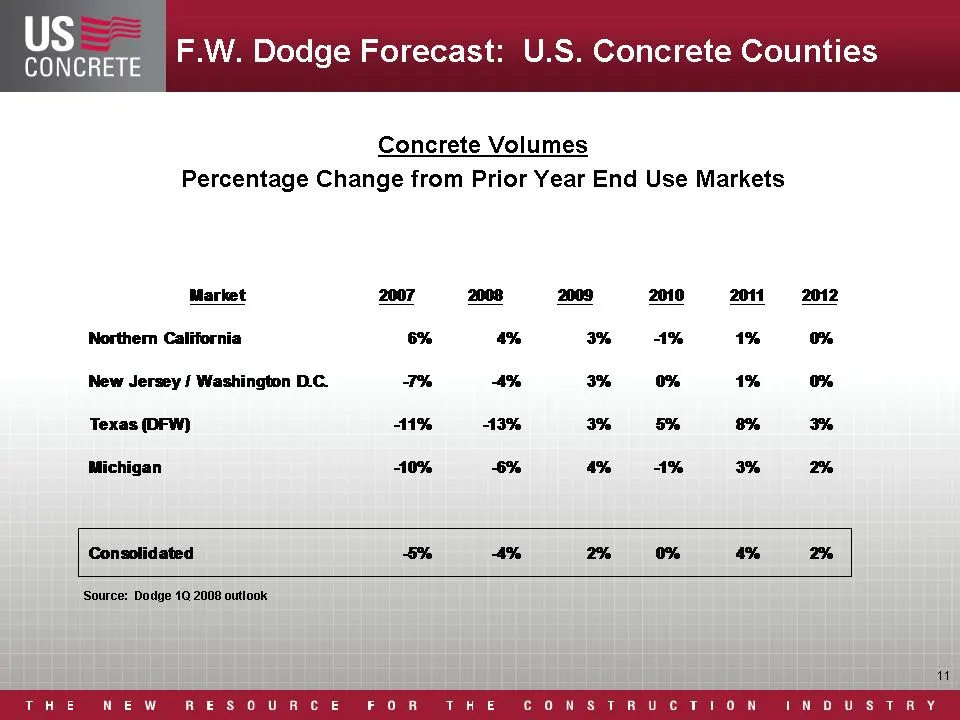
Slide 11: F.W. Dodge Forecast: U.S. Concrete Counties
US F.W. Dodge Forecast: U.S. Concrete Counties CONCRETE Concrete Volumes Percentage Change from Prior Year End Use Markets Market 2007 2008 2009 2010 2011 2012 Northem California 6% 4% Ko A% 1% ~% New Jersey { Washington DC. T% 4% am om 1% ~% Texas (DFW) 1% A3% Ko a % ms Michigan 10% 4% 4% A% Ki P27
Slide 12: Company End Use Markets
Company End Use Markets
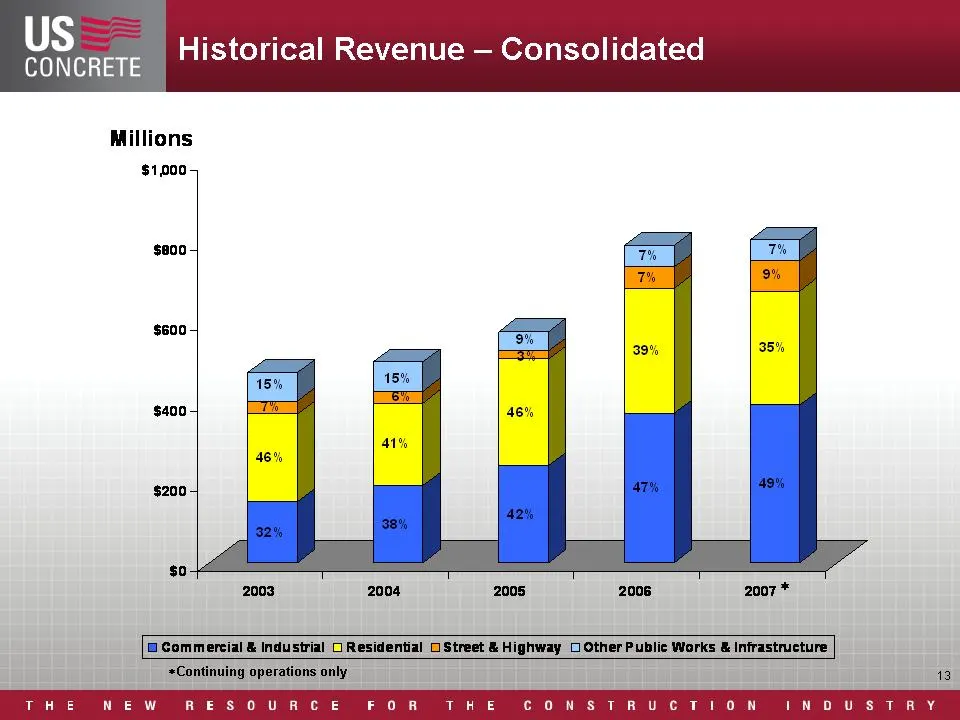
Slide 13: Historical Revenue — Consolidated
NCRETE Historical Revenue — Consolidated Millions $1p00- $400 $200 2003 2004 2005 2008 2007 * Commercial & industrial C Residential 0 Street & Highway Other Public Works & Infrastructure Continuing operations only 13 THE NEW RESOURCE FOR THE CONSTRUCTION INDUSTRY
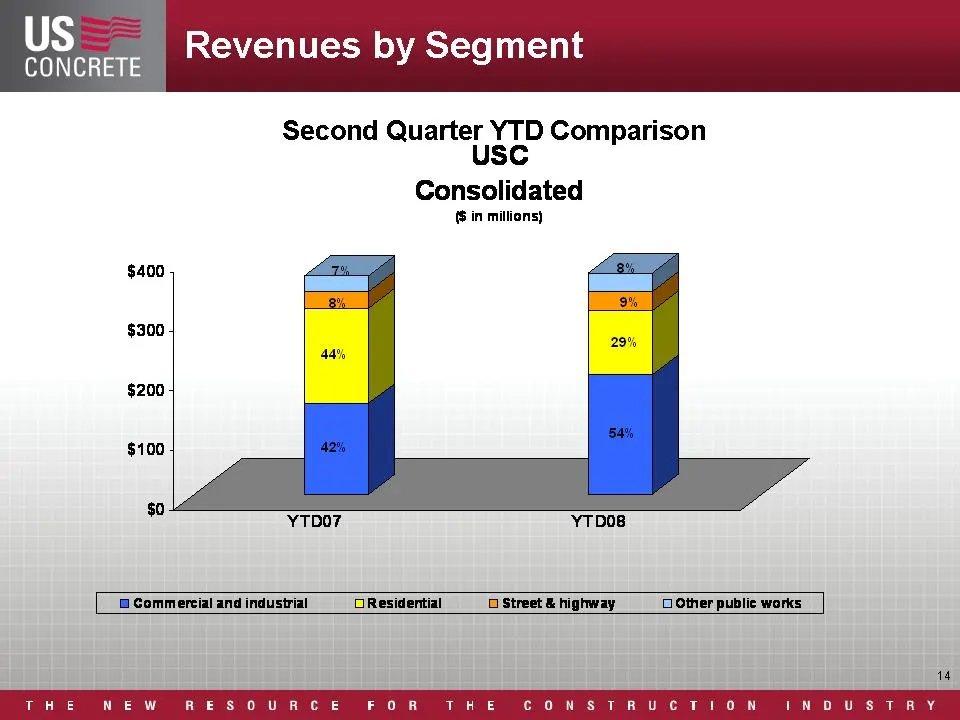
Slide 14: Revenues by Segment
US Revenues by Segment CONCRETE Second Quarter YTD Comparison usc Consolidated {$ in millions) $400 $300 $200 $100 $0 @ Gommercial and industrial OResidential Street & highway Other public works 14 THE NEW RESOURCE FOR THE CONSTRUCTION INDUSTRY
Slide 15: Growth Initiatives
Growth Initiatives
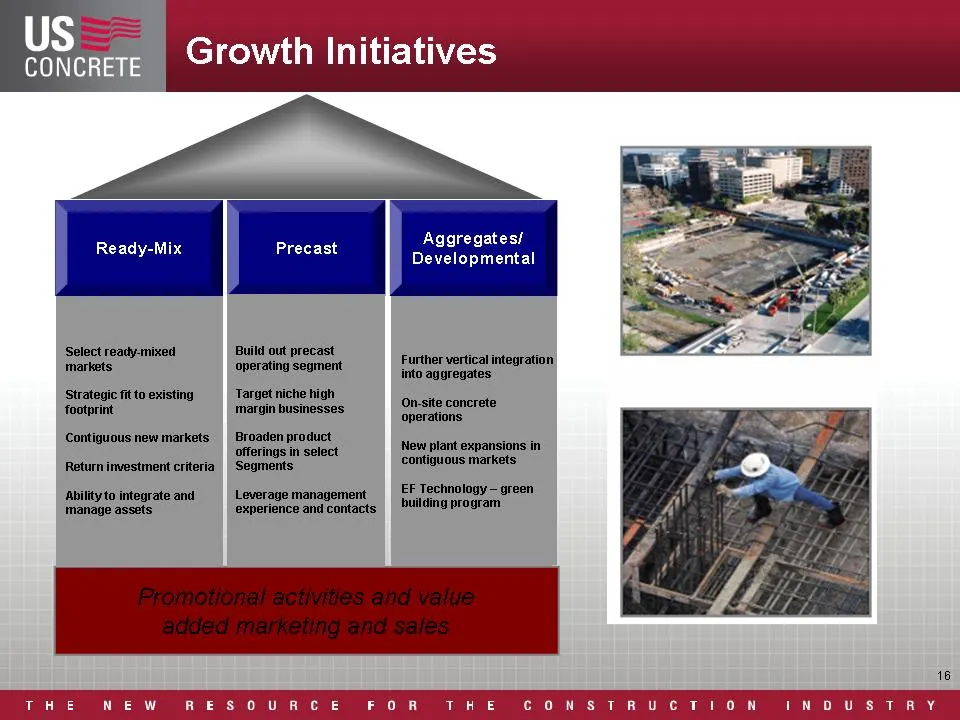
Slide 16: Growth Initiatives
US rae concrete Crowth Initiatives ll Aggregates/ Ready-Mix Precast Developmental EW RESOURCE FOR THE CONSTRUCTION INDUSTRY
Slide 17
Slide 18: CONCRETE
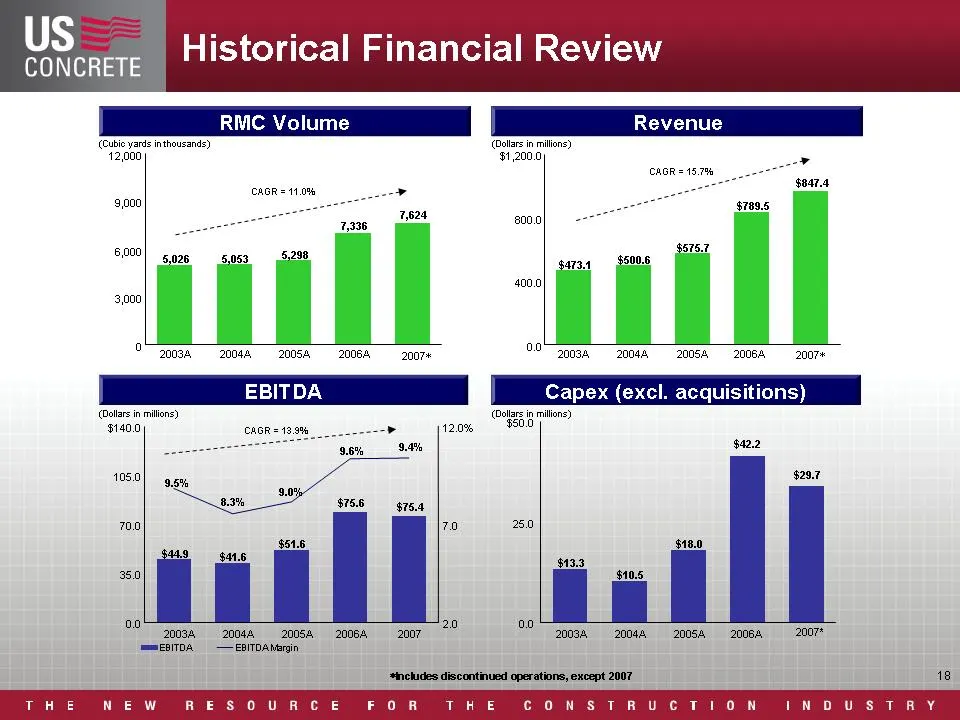
CONCRETE (Cubio yards inthousands) (ota in rilions) 12,000 1 2000) AOR = 11.0% 9,00 ona 6,000 4000 3,000 0 oo 2006 20044 20054 20084 2007 20034 20084 20054 206A 2007+ EBITDA Capex (excl. acquis! (Gat inion) asa mire) 1400 12.0% 1080 700 70 250 350 20 00 200e4 20044 2005 20084-2007 20084 20044 200542
Slide 19: Second Quarter 2008 Update
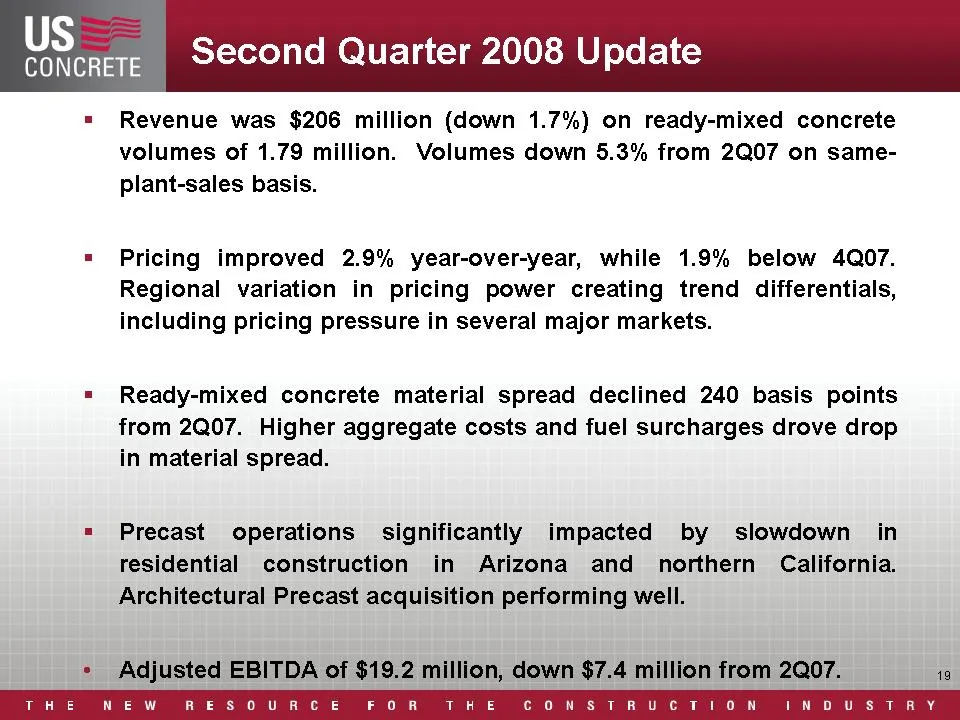
US. Second Quarter 2008 Update = Revenue was $206 million (down 1.7%) on ready-mixed concrete volumes of 1.79 million. Volumes down 5.3% from 2Q07 on same- plant-sales basis. = Pricing improved 2.9% year-over-year, while 1.9% below 4Q07. Regional variation in pricing power creating trend differentia
Slide 20: Second Quarter 2008 Update
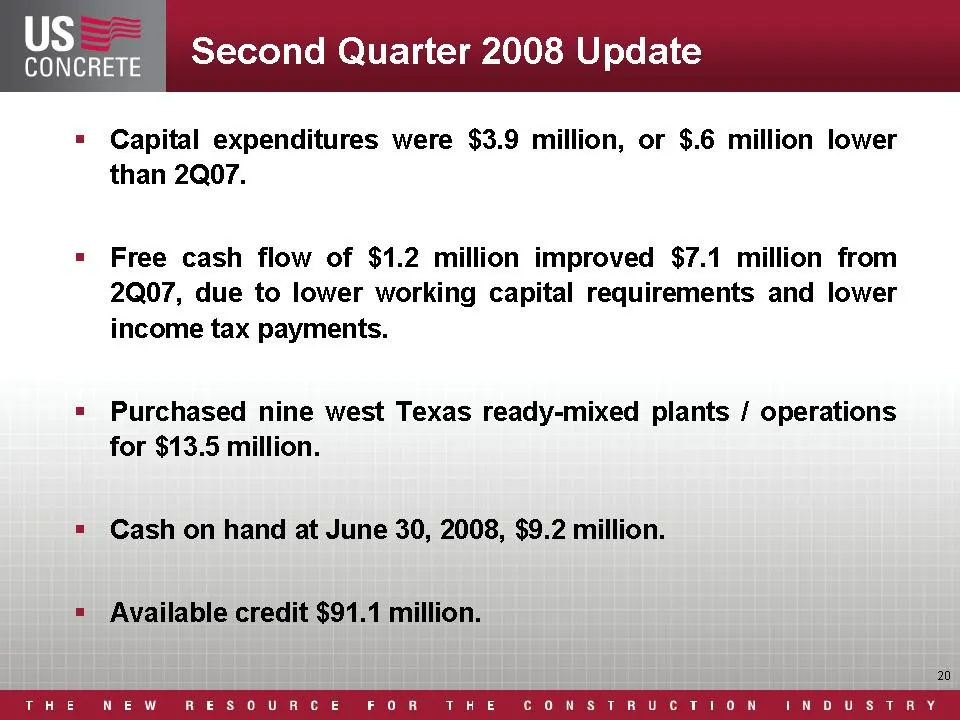
US. Second Quarter 2008 Update = Capital expenditures were $3.9 million, or $.6 million lower than 2Q07. = Free cash flow of $1.2 million improved $7.1 million from 2Q07, due to lower working capital requirements and lower income tax payments. = Purchased nine west Texas ready-mixed plants / operati
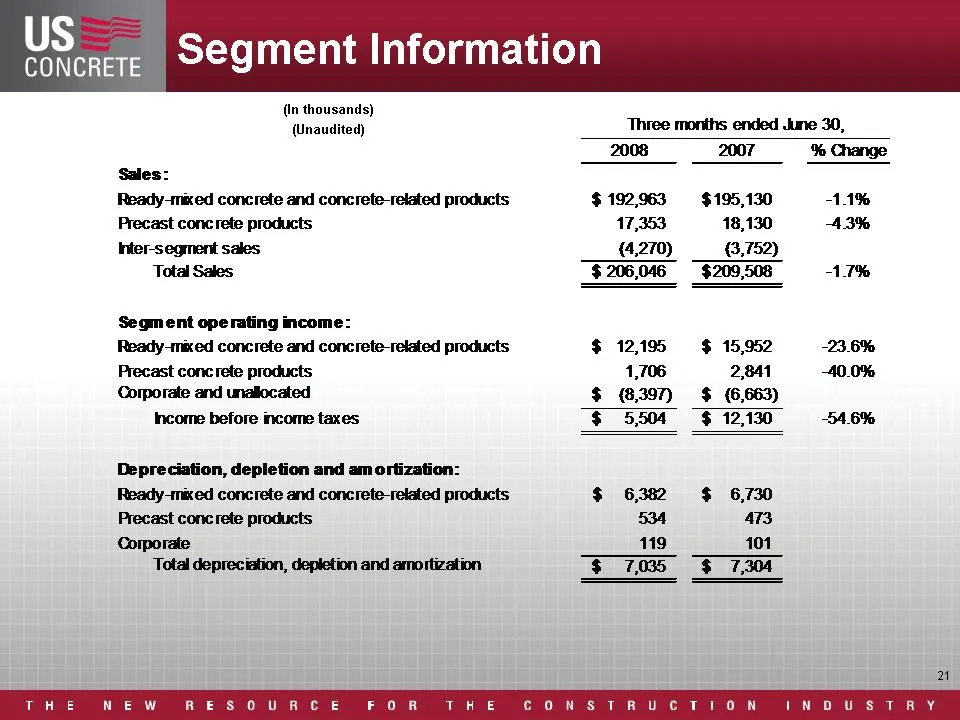
Slide 21: Segment Information
U CONCRETE (in thousands) (Unaudited) Sales: Ready-mied concrete and concrete-related products Precast concrete products Inter- segment sales Total Sales Segment operating income: Ready-mixed concrete and concrete-related products Precast concrete products Corporate and unallocated Income before inc
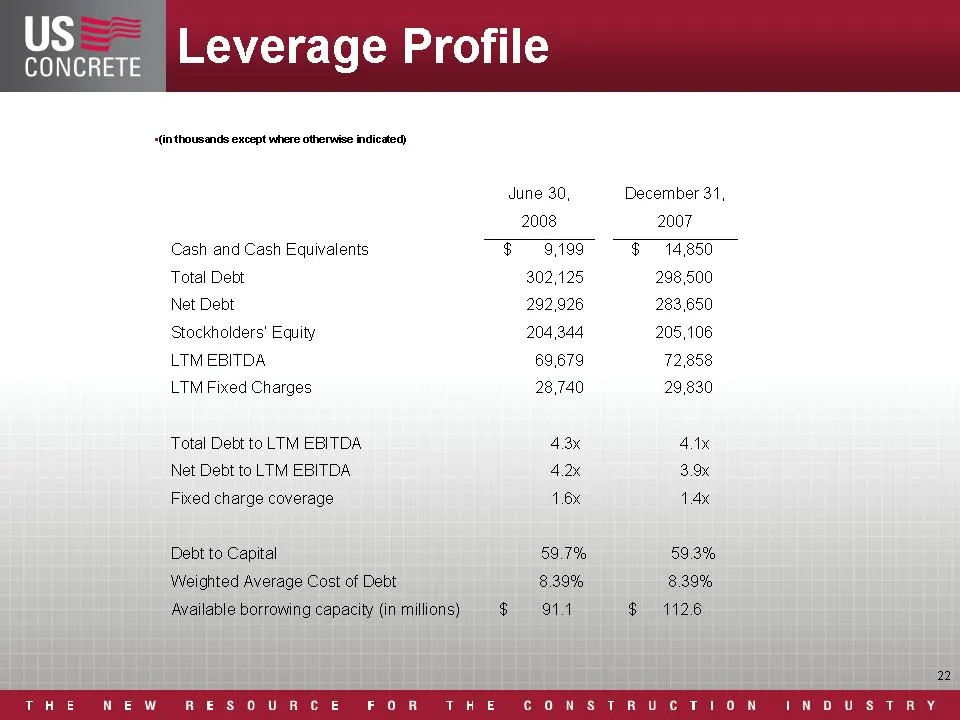
Slide 22: Leverage Profile
Leverage Profile “(in thousands except where otherwise indicated) Ew June 30, December 31, 2008 2007 Cash and Cash Equivalents “¢$ 9799 ~ § 14850 Total Debt 302,125 298,500 Net Debt 292,926 283,650 Stockholders’ Equity 204,344 205,106 LTM EBITDA 69,679 72,858 LTM Fixed Charges 28,740 29,830 Total De
Slide 23: 3Q08 Outlook
3Q08 Outlook
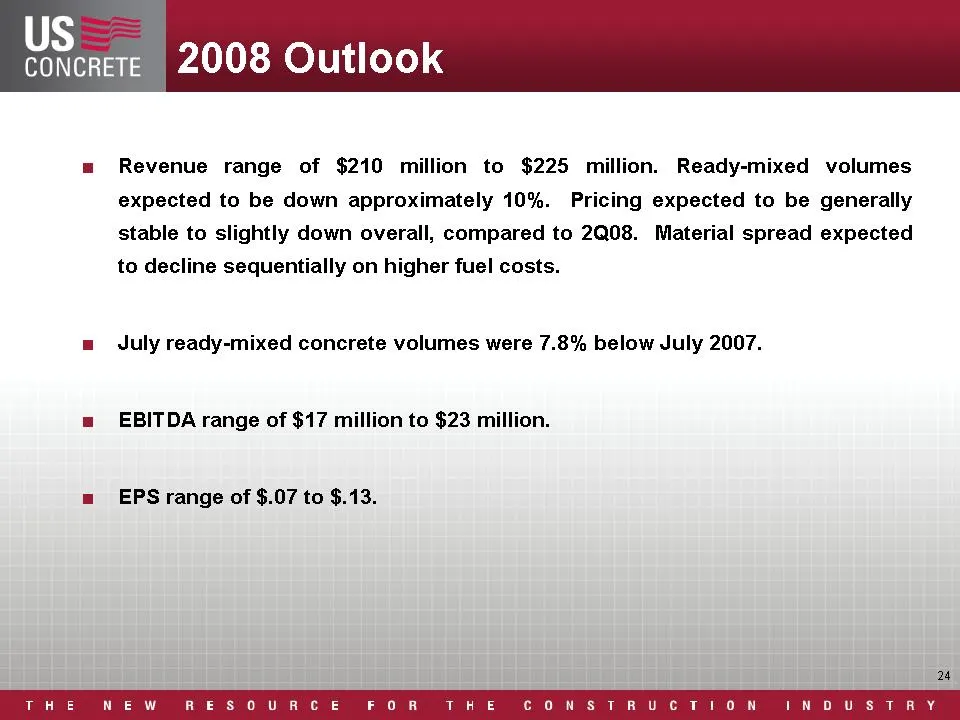
Slide 24: 2008 Outlook
US concrete 2008 Outlook m Revenue range of $210 million to $225 million. Ready-mixed volumes expected to be down approximately 10%. Pricing expected to be generally stable to slightly down overall, compared to 2Q08. Material spread expected to decline sequentially on higher fuel costs. a July ready
Slide 25: Managing Through Cycle Downturn
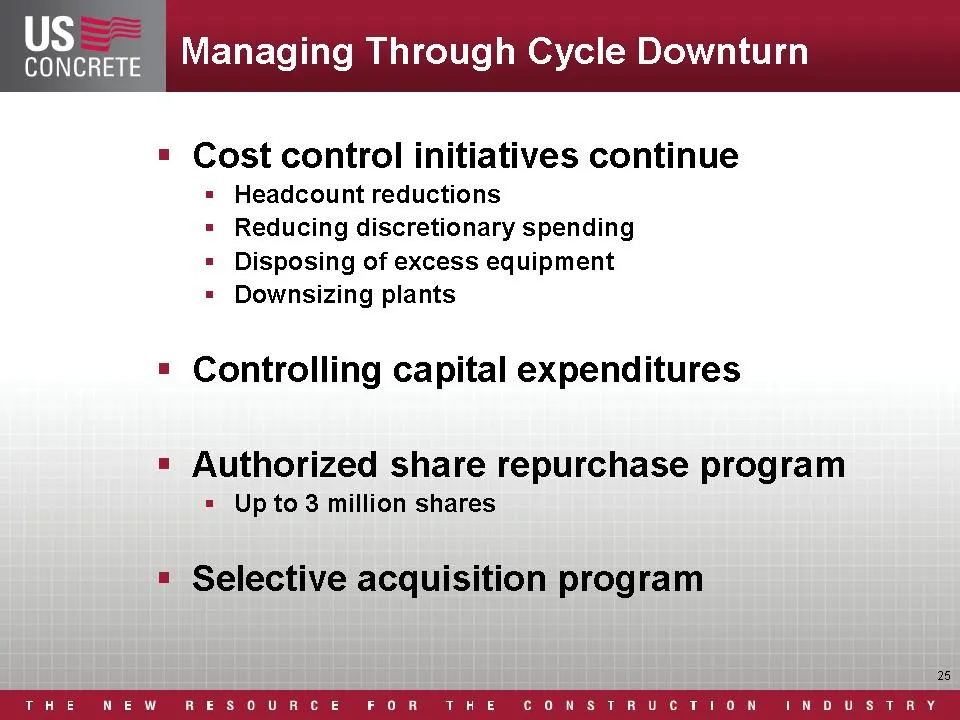
US. Managing Through Cycle Downturn « Cost control initiatives continue = Headcount reductions = Reducing discretionary spending = Disposing of excess equipment = Downsizing plants = Controlling capital expenditures = Authorized share repurchase program = Upto 3 million shares = Selective acquisitio
Slide 26: Key Company Strength
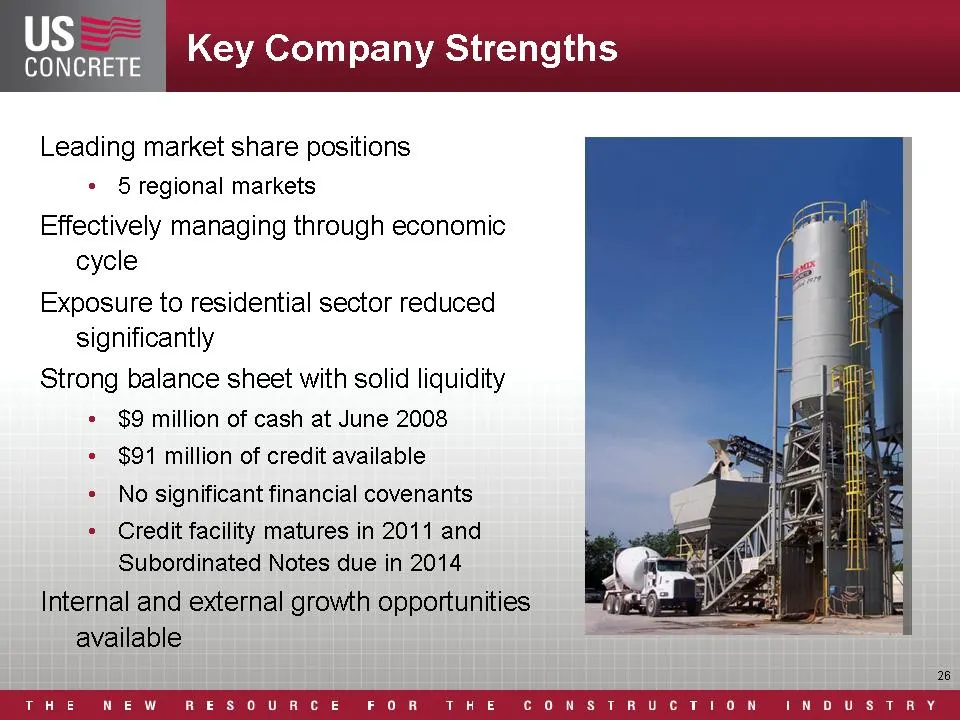
Key Company Strength Leading market share positions « 5 regional markets Effectively managing through economic cycle Exposure to residential sector reduced significantly Strong balance sheet with solid liquidity ¢ $9 million of cash at June 2008 ¢ $91 million of credit available « No significant fin
Slide 27: APPENDIX
APPENDIX End Use Markets By Major Region
Slide 28: Revenues by Segment: DFW Market
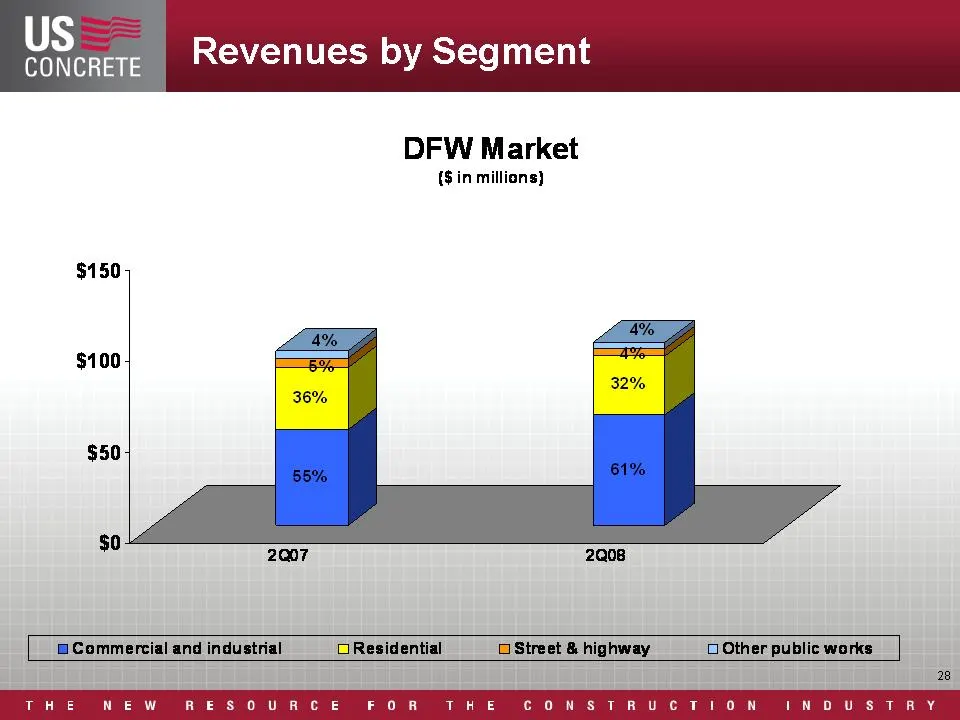
US concrete Revenues by Segment DFW Market (Sin millions) $150 $100 $50 $0 2007 2Q08 @ Commercial and industrial OResidential OStreet & highway O Other public works 28 THE NEW RESOURCE FOR THE CONSTRUCTION INDUSTRY
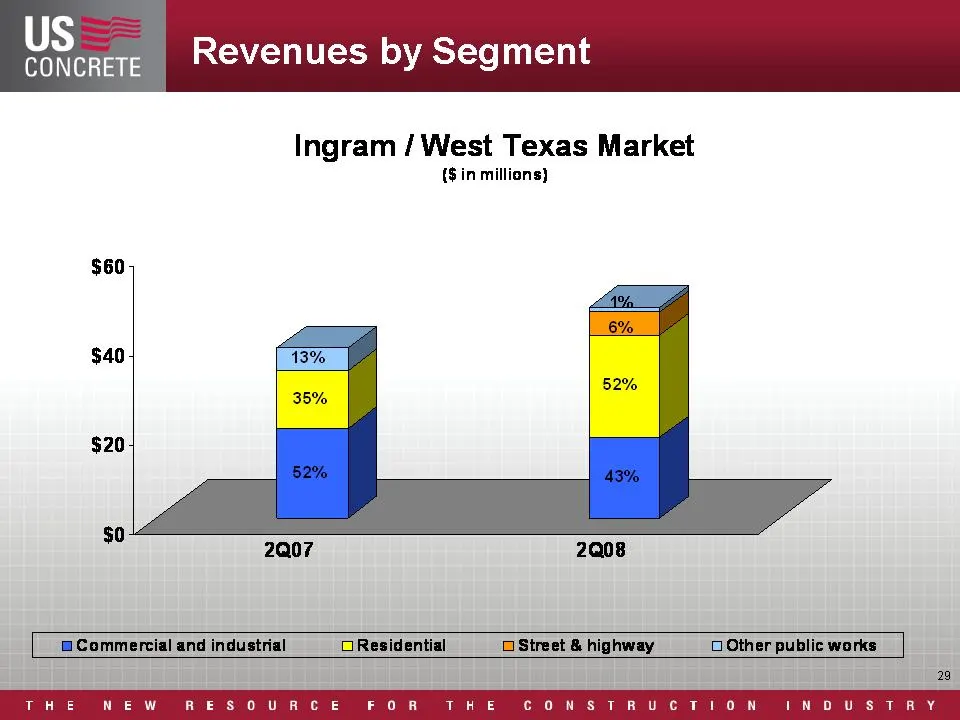
Slide 29: Revenues by Segment: Ingram / West Texas Market
US. Revenues by Segment Ingram / West Texas Market ($in millions) @ Commercial and industrial OResidential O Street & highway O Other public works 29 THE NEW RESOURCE FOR THE CONSTRUCTION INDUSTRY
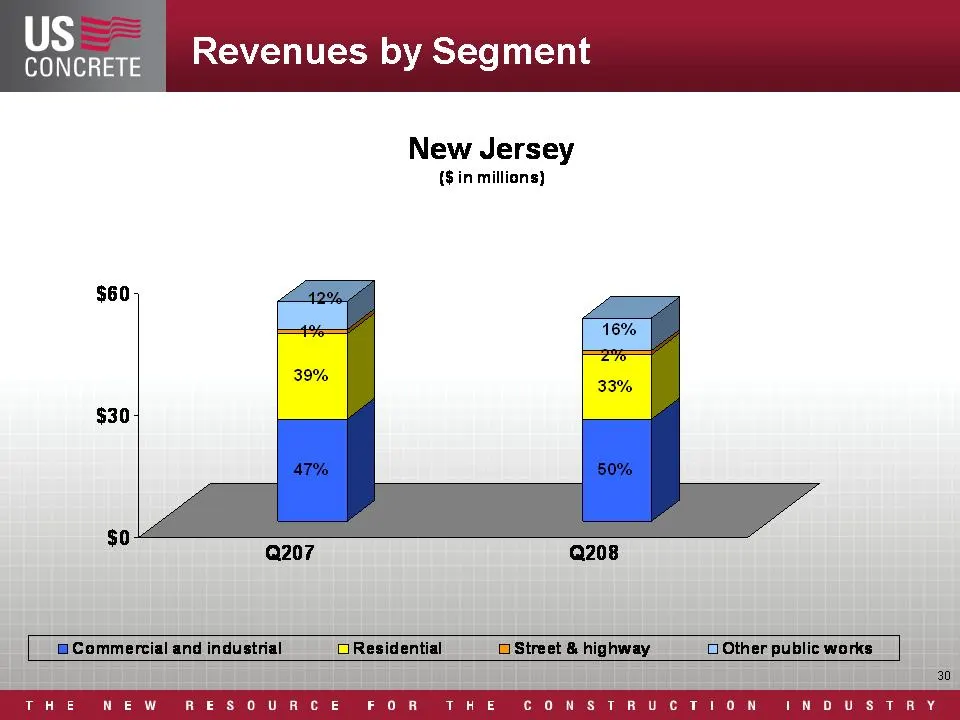
Slide 30: Revenues by Segment: New Jersey
US concrete Revenues by Segment New Jersey (Sin millions) $60 $30 $0 Q207 Q208 @ Commercial and industrial OResidential OStreet & highway O Other public works 30 THE NEW RESOURCE FOR THE CONSTRUCTION INDUSTRY
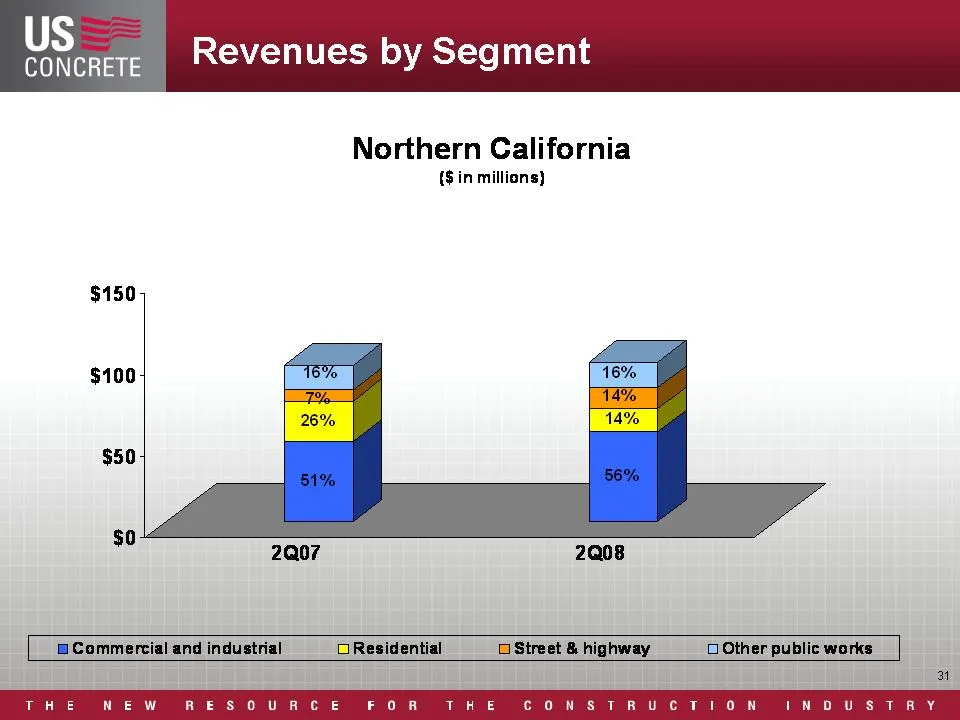
Slide 31: Revenues by Segment: Northern California
US concrete Revenues by Segment Northern California (Sin millions) @ Commercial and industrial OResidential OStreet & highway O Other public works El THE NEW RESOURCE FOR THE CONSTRUCTION INDUSTRY
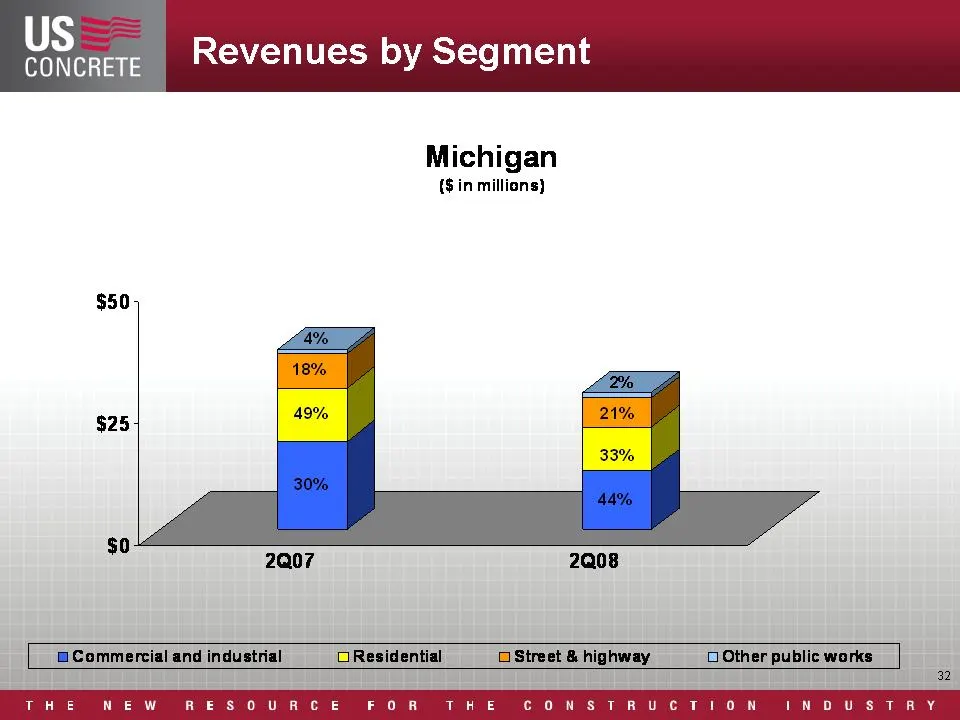
Slide 32: Revenues by Segment: Michigan
US concrete Revenues by Segment Michigan (Sin millions) @ Commercial and industrial OResidential OStreet & highway O Other public works 2 THE NEW RESOURCE FOR THE CONSTRUCTION INDUSTRY
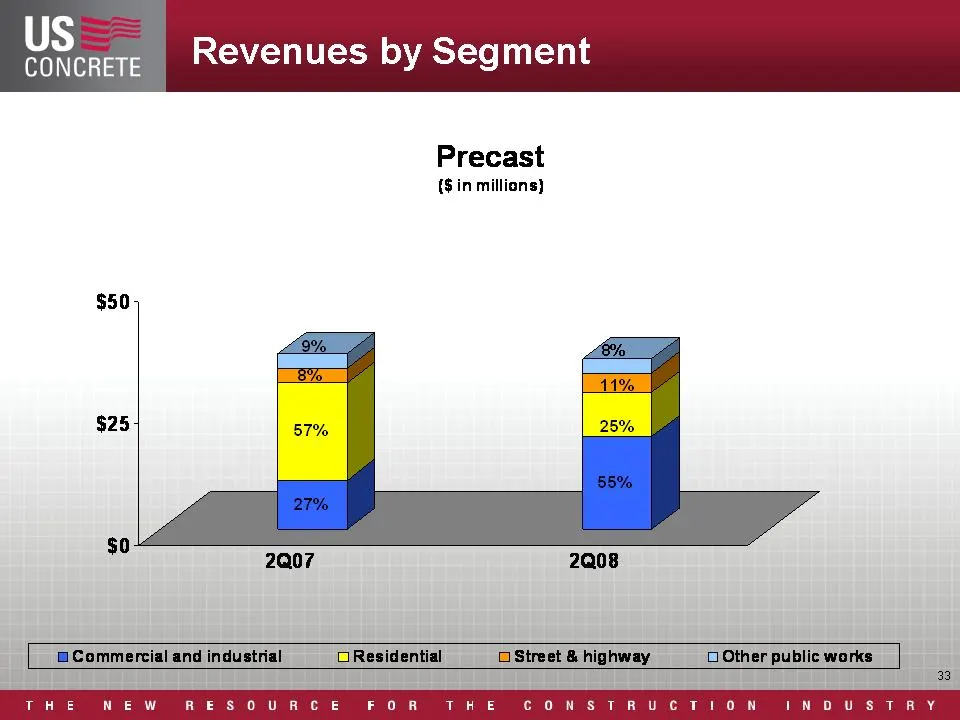
Slide 33: Revenues by Segment: Precast
US concrete Revenues by Segment Precast (Sin millions) @ Commercial and industrial OResidential OStreet & highway O Other public works 33 THE NEW RESOURCE FOR THE CONSTRUCTION INDUSTRY
Slide 34: Stephens, Inc. Investor Meetings
Stephens, Inc. Investor Meetings August 20-21, 2008
Slide 35: Disclosure of Non-GAAP Financial Measures
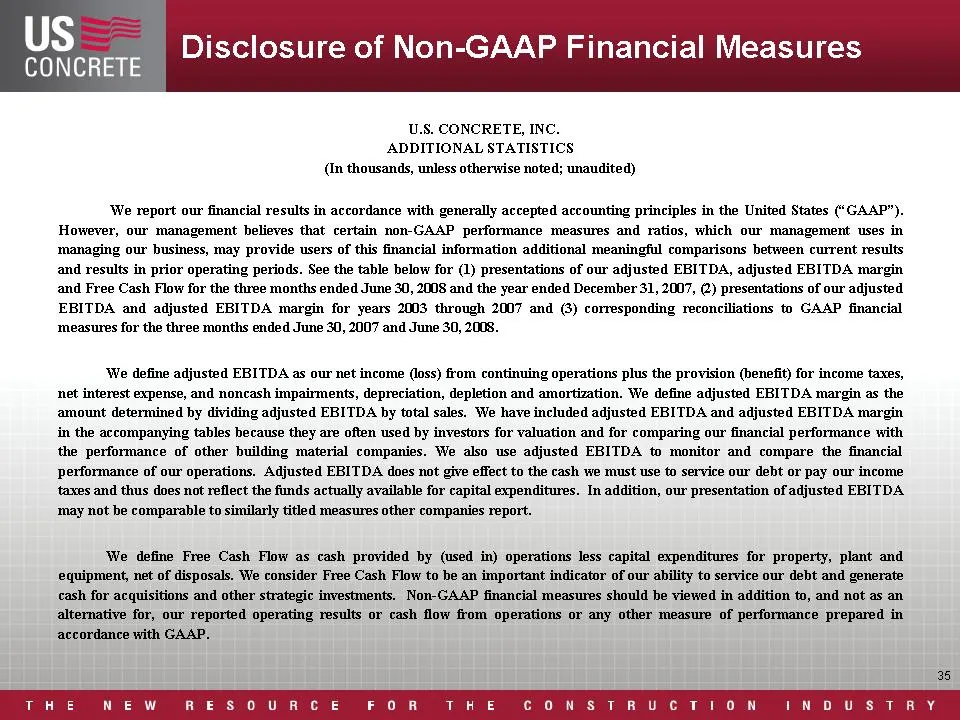
So “GAAP Financi CONGEER Disclosure of Non-GAAP Financial Measures U.S. CONCRETE, INC. ADDITIONAL STATISTICS (In thousands, unless otherwise noted; unaudited) ‘We report our financial results in accordance with generally accepted accounting principles in the United States ("GAAP"). However, our mana
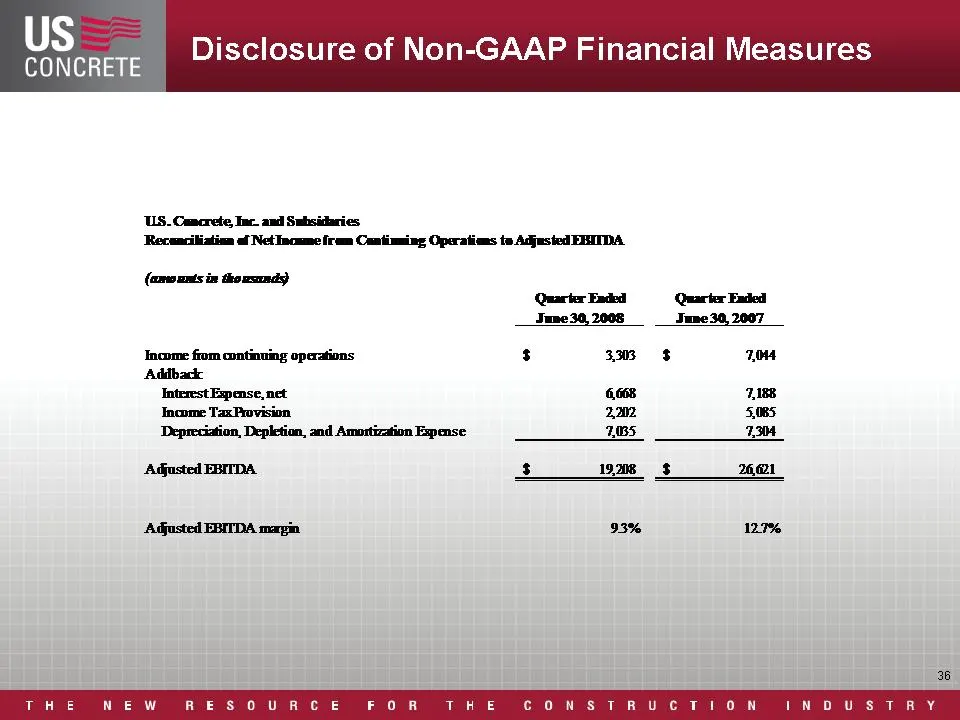
Slide 36: Reconciliation of Net Income to Adjusted EBITDA
US=eml i — CONCRETE Disclosure of Non-GAAP Financial Measures US. Cancrete, Inc. and Subsidaries ‘Recenciliation of Net Inoue fram Cantiming Operations te Adjusted EEIIDA (amounts in tho mums) (Quarter Ended (Quarier Exiled June 30, 2008 June 30, 2007 Income fom continuing operations 3 355 8 704 Add
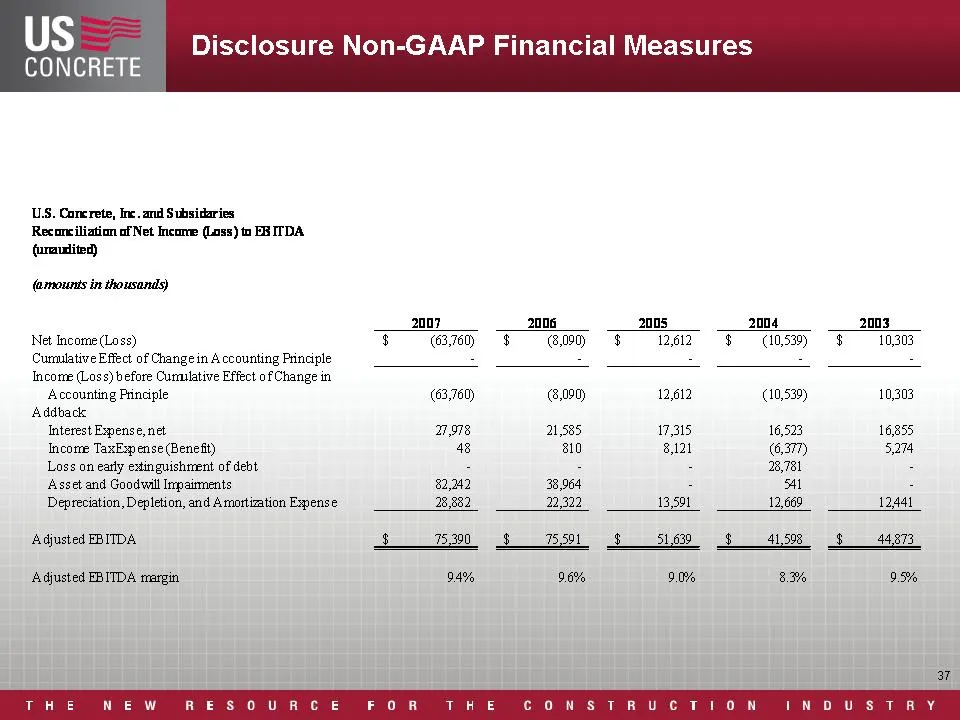
Slide 37: Reconciliation of Net Income (Loss) to EBITDA
S CONCRETE US. Concrete, Inc. and Subsidaries Reconciliation of Net Income (Loss) tu EBITDA. (urauited) (mounts in thousands) Net Income (Lass) Cumnlative Effect of Change in A ccounting Principle Income (Loss) before Cumblative Effect of Change in Accounting Principle Addback Interest Expense, net
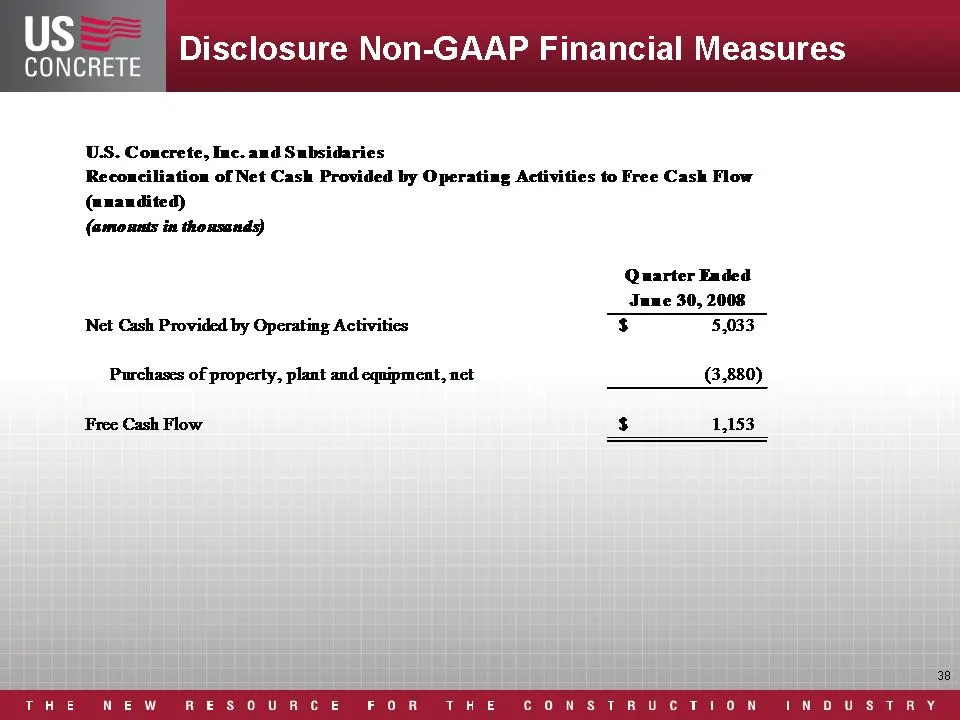
Slide 38: Reconciliation of Operating Cash Flow to Free Cash Flow
US ene CONCRETE Disclosure Non-GAAP Financial Measures US. Concrete, Inc. and Subsidaries Reconciliation of Net Cash Provided by Operating Activities to Free Cash Flow (auandited) (amounts in thonsands) Quarter Ended Tune 30, 2008 Net Cash Provided by Operating Activities $ 5,033 Purchases of proper
Slide 39: Stephens, Inc. Investor Meetings
Stephens, Inc. Investor Meetings August 20-21, 2008
Source: SEC EDGAR · 8-K filed Aug 20, 2008
More decks from U.S. Concrete Inc
 ESG Presentation (April 2021)31 slides · Apr 1, 2021
 Investor Presentation (March 2021)36 slides · Mar 23, 2021
 Investor Presentation (November 2020)36 slides · Nov 12, 2020
 Investor Presentation (June 2020)22 slides · Jun 3, 2020
 Investor Presentation (March 2019)16 slides · Mar 22, 2019
 Investor Presentation (November 2018)17 slides · Nov 5, 2018