Ascena Retail — 15th Annual ICR XChange Conference 2013
50 slides from Ascena Retail's conference presentation, Jan 23, 2013
Slide 1: 15th Annual ICR XChange Conference
15 th Annual ICR XChange Conference January 16, 2013 David Jaffe President & CEO

Slide 2: Video
Video
Slide 3: Forward Looking Statements
Forward Looking Statements This presentation contains forward - looking statements within the meaning of the Private Securities Litigation Reform Act of 1995 . Forward - looking statements involve known and unknown risks and uncertainties, which may cause our actual results in future periods to diff
Slide 4: Our Vision and Mission
Our Vision “Serve our shareholders and create value by becoming a family of leading retail concepts with $10 billion in sales and top tier profitability.” Our Mission “Making people feel good about themselves.” 4
Slide 5: Investor Highlights
Investor Highlights 5 • Diversified portfolio • Significant growth opportunities • Shared Services leverages overhead & drives synergies • Strong Balance Sheet & Cash Flow • Future opportunities
Slide 6: CHRS Transaction Overview
CHRS Transaction Overview • Reasonable valuation • Conservative financing • Plan for each division • Valuable assets 6
Slide 7: CHRS Transaction Benefits
CHRS Transaction Benefits • Two niche brands • Transfer Fashion Bug sales • Overhead reduction • Synergies • Best practices • Talent acquisition & retention 7
Slide 8: Coming Together
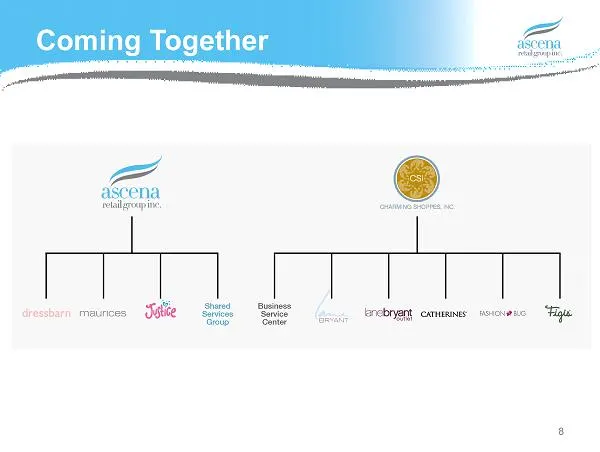
Coming Together 8
Slide 9: Coming Together
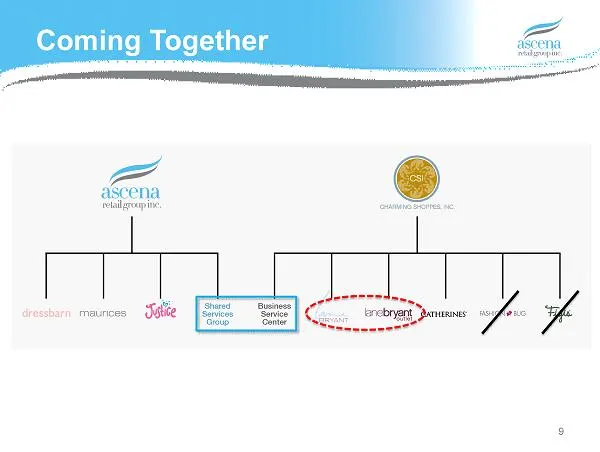
Coming Together 9
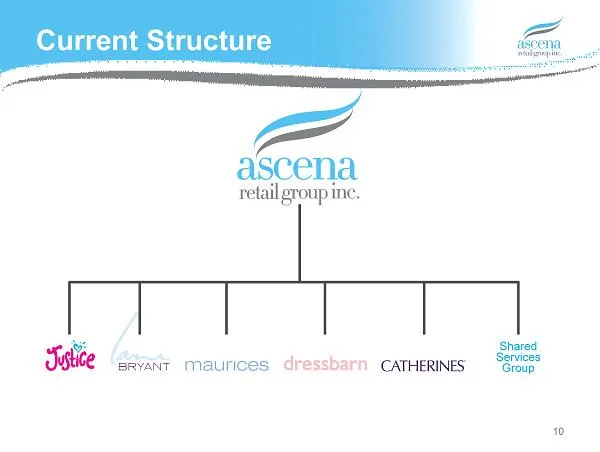
Slide 10: Current Structure Shared Services Group
Current Structure 10 Shared Services Group
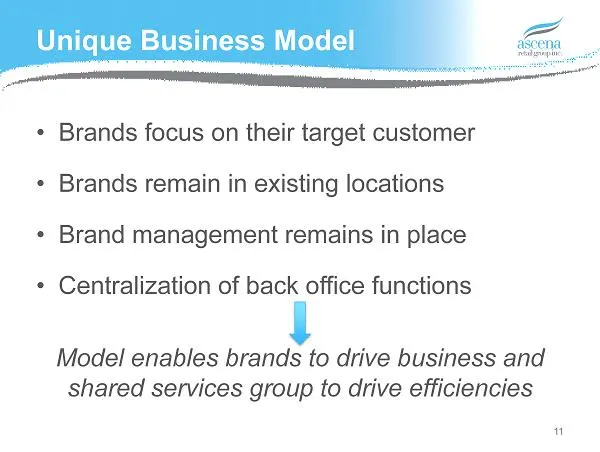
Slide 11: Unique Business Model
Unique Business Model • Brands focus on their target customer • Brands remain in existing locations • Brand management remains in place • Centralization of back office functions Model enables brands to drive business and shared services group to drive efficiencies 11
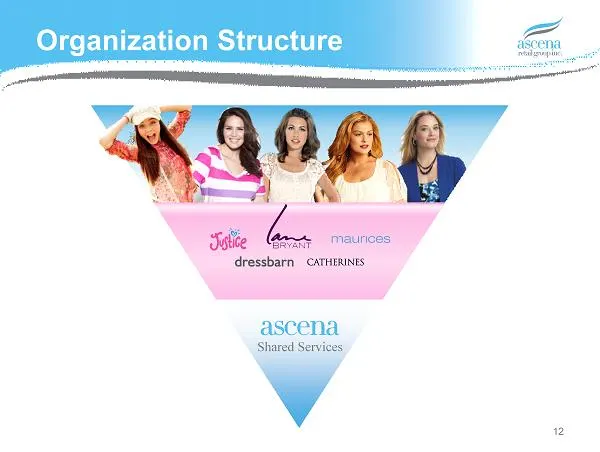
Slide 12: Shared Services Organization Structure
Shared Services Organization Structure 12
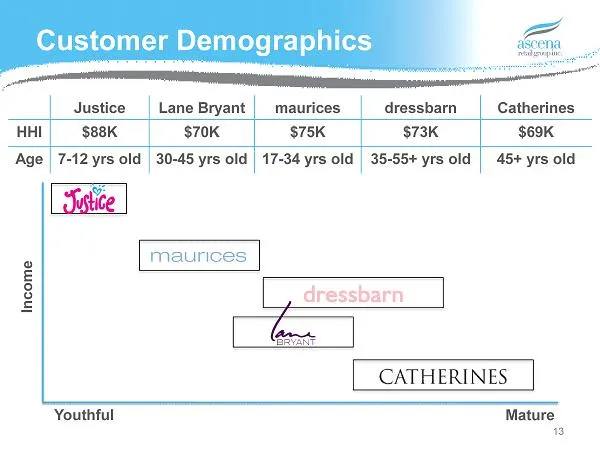
Slide 13: Customer Demographics
Justice Lane Bryant maurices dressbarn Catherines HHI $88K $70K $75K $73K $69K Age 7 - 12 yrs old 30 - 45 yrs old 17 - 34 yrs old 35 - 55+ yrs old 45+ yrs old Customer Demographics 13 Youthful Mature Income
Slide 14: Justice: Our Mission
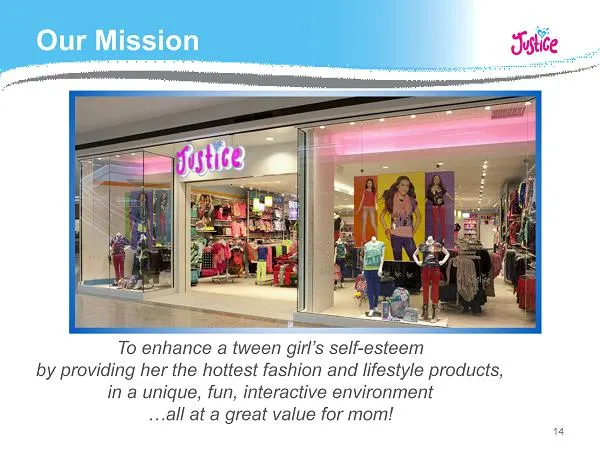
Our Mission 14 To enhance a tween girl’s self - esteem by providing her the hottest fashion and lifestyle products, in a unique, fun, interactive environment …all at a great value for mom!
Slide 15: Locations
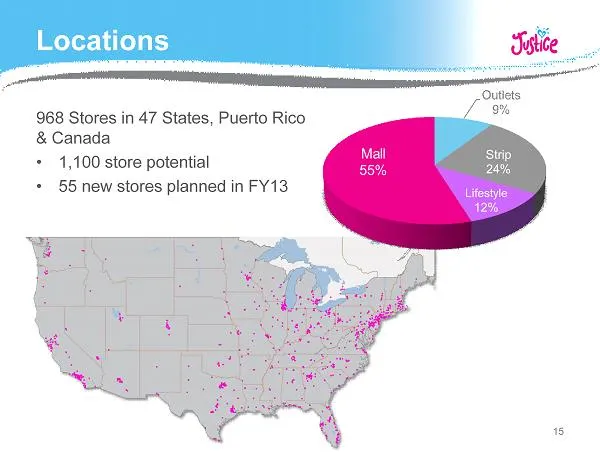
Locations 968 Stores in 47 States, Puerto Rico & Canada • 1,100 store potential • 55 new stores planned in FY13 15
Slide 16: Market Share
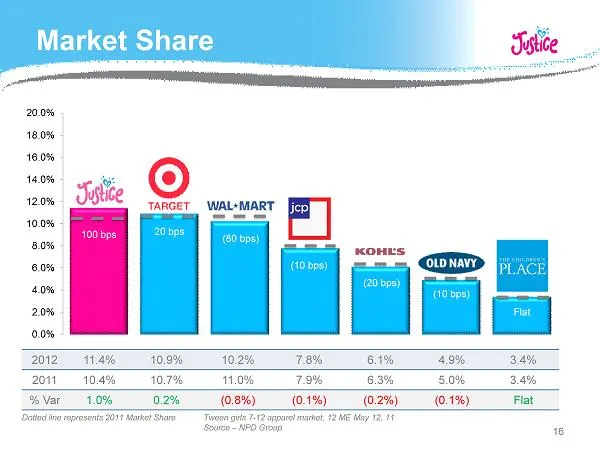
Market Share 16 Tween girls 7 - 12 apparel market, 12 ME May 12, 11 Source – NPD Group Dotted line represents 2011 Market Share 2012 11.4% 10.9% 10.2% 7.8% 6.1% 4.9% 3.4% 2011 10.4% 10.7% 11.0% 7.9% 6.3% 5.0% 3.4% % Var 1.0% 0.2% (0.8%) (0.1%) (0.2%) (0.1%) Flat 100 bps 20 bps (80 bps) (10 bps) (20
Slide 17: FY13 Strategic Initiatives
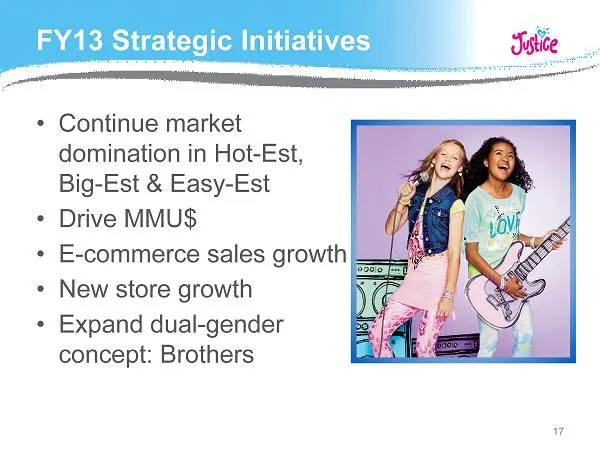
FY13 Strategic Initiatives • Continue market domination in Hot - Est, Big - Est & Easy - Est • Drive MMU$ • E - commerce sales growth • New store growth • Expand dual - gender concept: Brothers 17
Slide 18: Growth Drivers
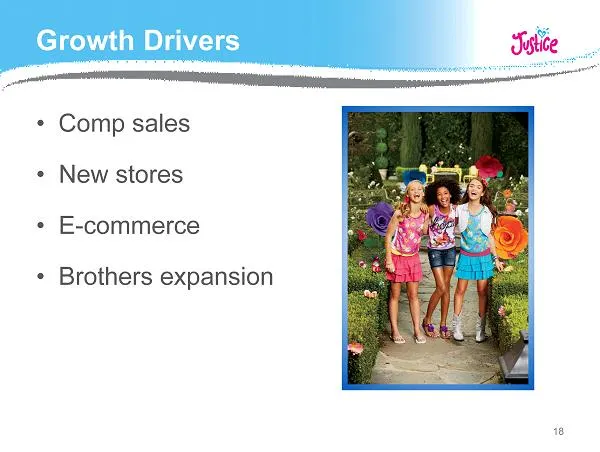
Growth Drivers • Comp sales • New stores • E - commerce • Brothers expansion 18
Slide 19: Lane Bryant: Our Mission
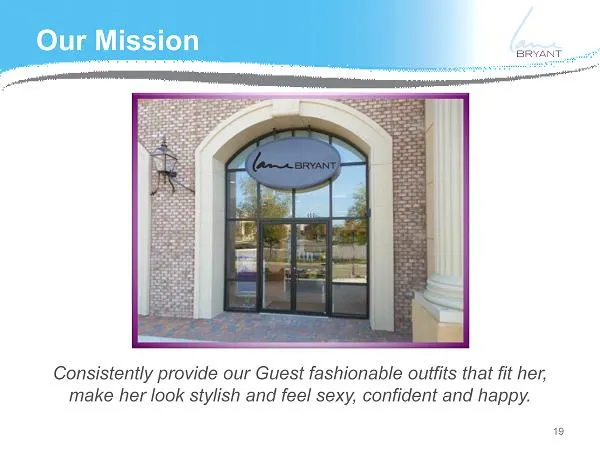
Our Mission 19 Consistently provide our Guest fashionable outfits that fit her, make her look stylish and feel sexy, confident and happy.
Slide 20: Locations
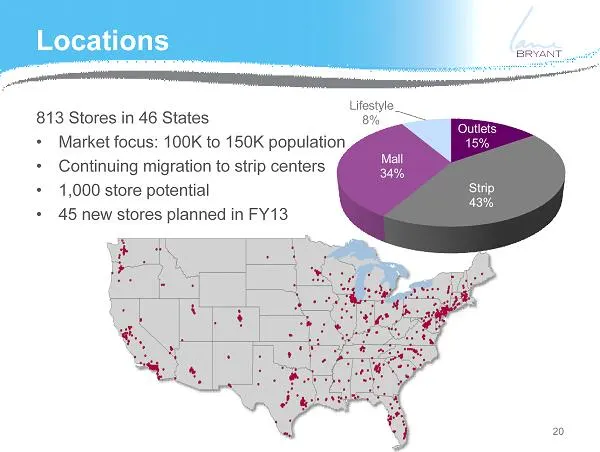
Locations 20 813 Stores in 46 States • Market focus: 100K to 150K population • Continuing migration to strip centers • 1,000 store potential • 45 new stores planned in FY13
Slide 21: Market Share
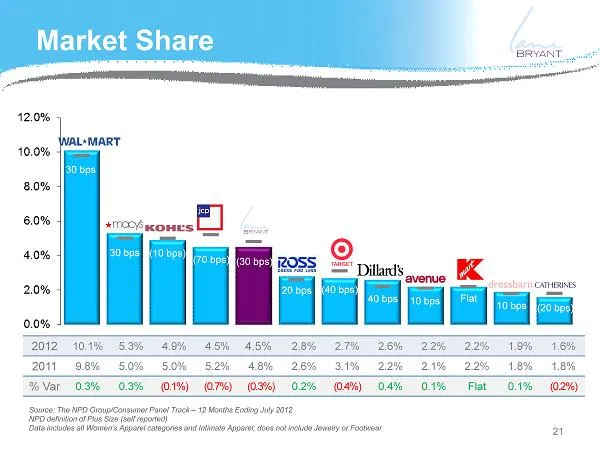
Market Share Source: The NPD Group/Consumer Panel Track – 12 Months Ending July 2012 NPD definition of Plus Size (self reported) Data includes all Women’s Apparel categories and Intimate Apparel; does not include Jewelry or Footwear 30 bps 30 bps (10 bps) (70 bps) (30 bps) 20 bps (40 bps) 40 bps 10
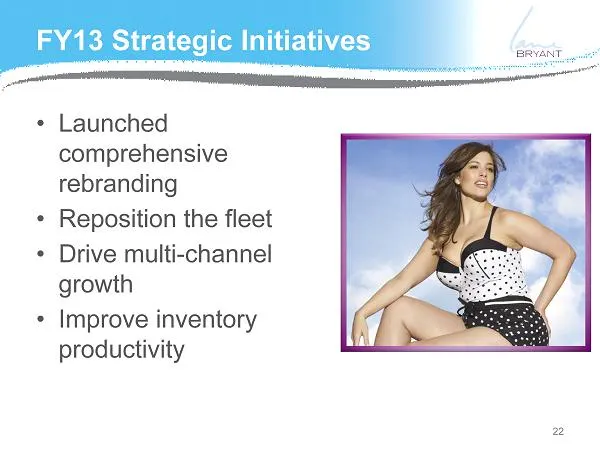
Slide 22: FY13 Strategic Initiatives
FY13 Strategic Initiatives • Launched comprehensive rebranding • Reposition the fleet • Drive multi - channel growth • Improve inventory productivity 22
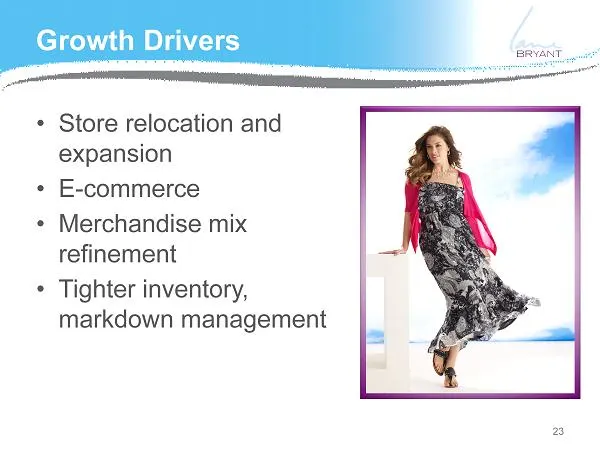
Slide 23: Growth Drivers
Growth Drivers • Store relocation and expansion • E - commerce • Merchandise mix refinement • Tighter inventory, markdown management 23
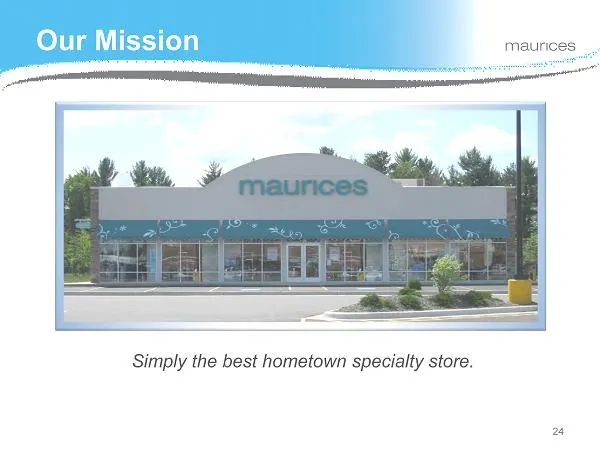
Slide 24: maurices: Our Mission
Simply the best hometown specialty store. 24 Our Mission
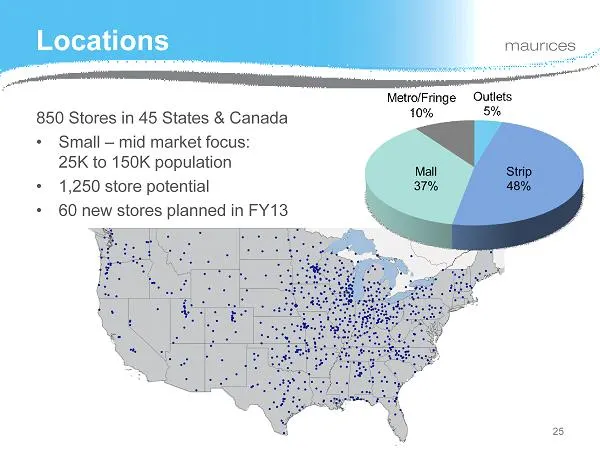
Slide 25: Locations
Locations 850 Stores in 45 States & Canada • Small – mid market focus: 25K to 150K population • 1,250 store potential • 60 new stores planned in FY13 25
Slide 26: FY13 Strategic Initiatives
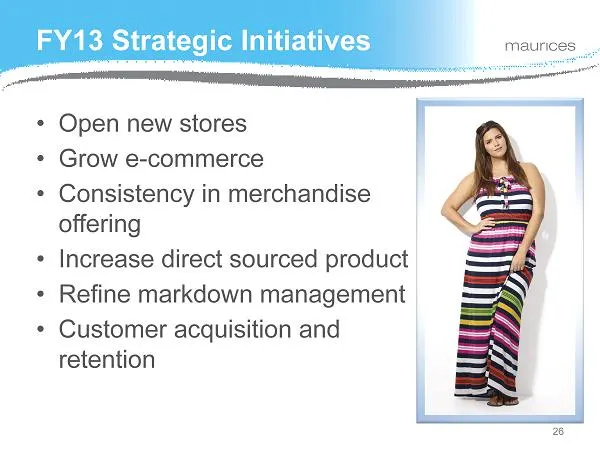
FY13 Strategic Initiatives • Open new stores • Grow e - commerce • Consistency in merchandise offering • Increase direct sourced product • Refine markdown management • Customer acquisition and retention 26
Slide 27: Growth Drivers
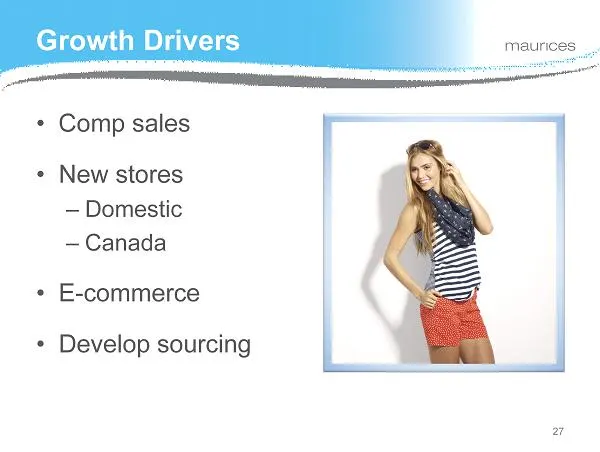
Growth Drivers • Comp sales • New stores – Domestic – Canada • E - commerce • Develop sourcing 27
Slide 28: dressbarn: Our Mission
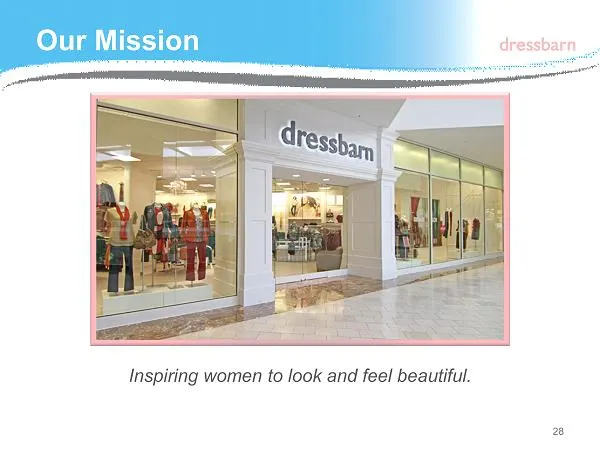
Our Mission 28 28 Inspiring women to look and feel beautiful.
Slide 29: Locations
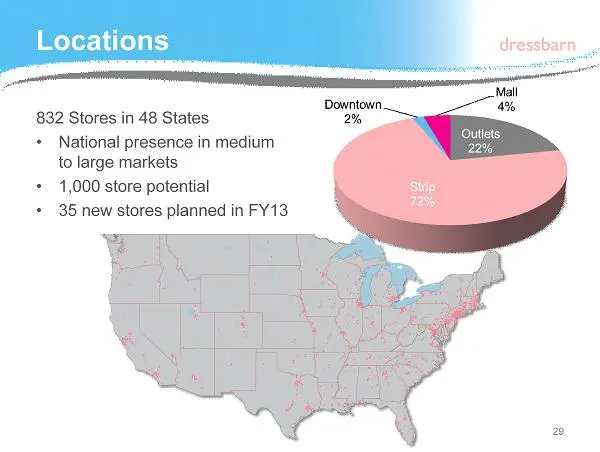
Locations 832 Stores in 48 States • National presence in medium to large markets • 1,000 store potential • 35 new stores planned in FY13 29
Slide 30: FY13 Strategic Initiatives
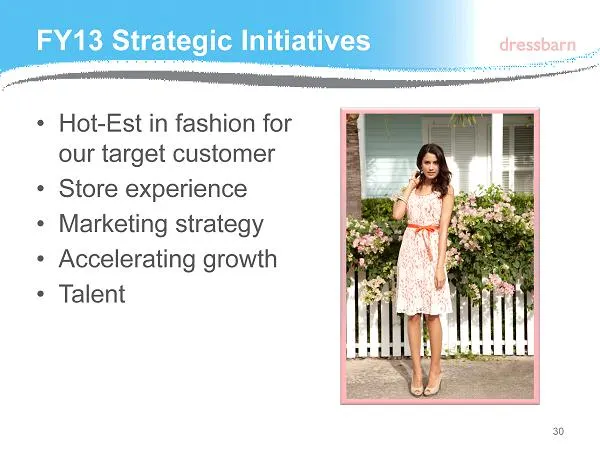
FY13 Strategic Initiatives • Hot - Est in fashion for our target customer • Store experience • Marketing strategy • Accelerating growth • Talent 30
Slide 31: Growth Drivers
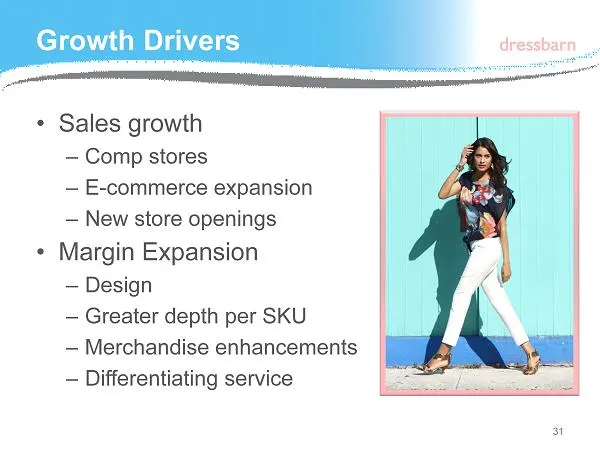
Growth Drivers • Sales growth – Comp stores – E - commerce expansion – New store openings • Margin Expansion – Design – Greater depth per SKU – Merchandise enhancements – Differentiating service 31
Slide 32: Catherines: Our Mission
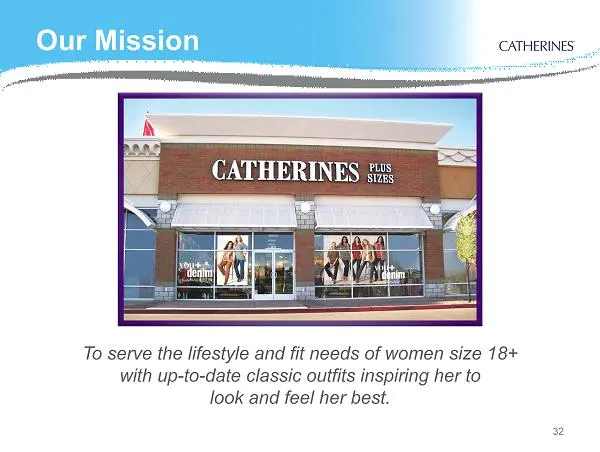
Our Mission 32 To serve the lifestyle and fit needs of women size 18+ with up - to - date classic outfits inspiring her to look and feel her best.
Slide 33: Locations
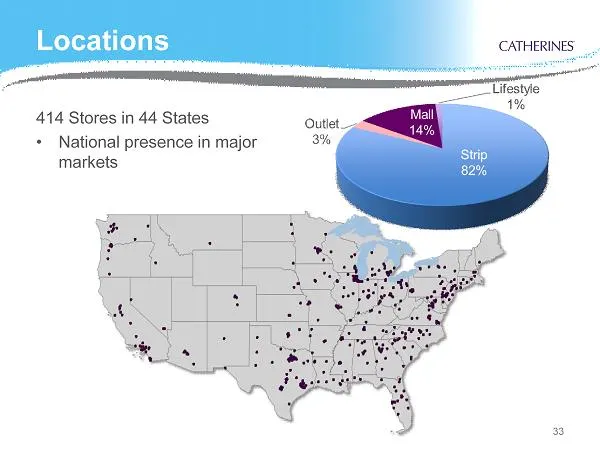
Locations 414 Stores in 44 States • National presence in major markets 33
Slide 34: Market Share
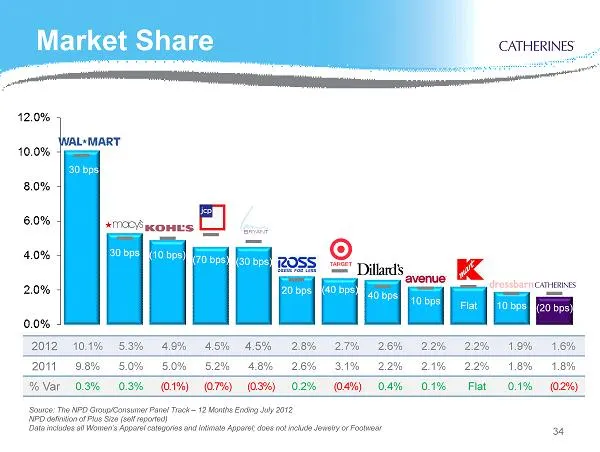
Market Share 34 Source: The NPD Group/Consumer Panel Track – 12 Months Ending July 2012 NPD definition of Plus Size (self reported) Data includes all Women’s Apparel categories and Intimate Apparel; does not include Jewelry or Footwear 30 bps 30 bps (10 bps) (70 bps) (30 bps) 20 bps (40 bps) 40 bps
Slide 35: FY13 Strategic Initiatives
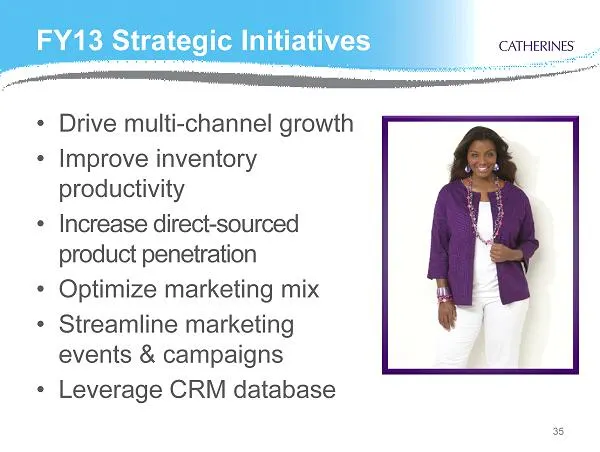
FY13 Strategic Initiatives • Drive multi - channel growth • Improve inventory productivity • Increase direct - sourced product penetration • Optimize marketing mix • Streamline marketing events & campaigns • Leverage CRM database 35
Slide 36: Growth Drivers
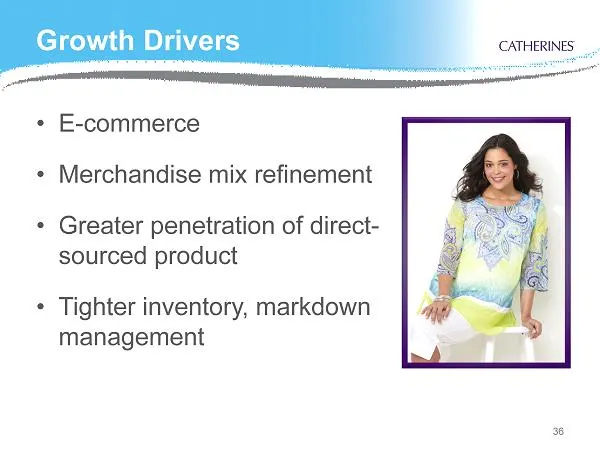
Growth Drivers • E - commerce • Merchandise mix refinement • Greater penetration of direct - sourced product • Tighter inventory, markdown management 36
Slide 37: Shared Service Capabilities
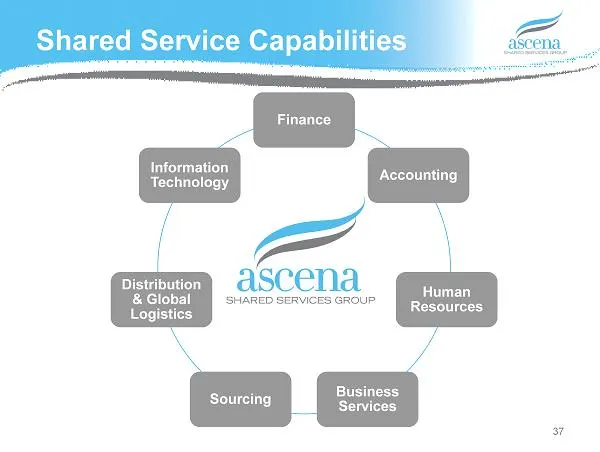
Finance Accounting Human Resources Business Services Sourcing Distribution & Global Logistics Information Technology Shared Service Capabilities 37
Slide 38: Integration Strategies
Integration Strategies • Optimize distribution centers • Transform logistics network • In - source e - commerce platform • Expand direct sourcing • Consolidate technology platforms • Optimize business processing 38
Slide 39: Corporate Overhead Reduction
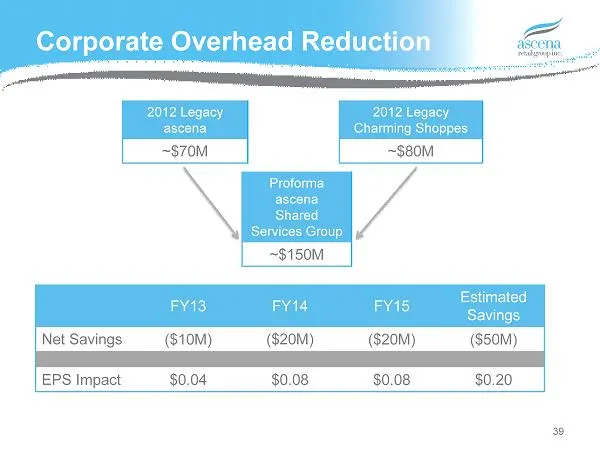
Corporate Overhead Reduction 39 FY13 FY14 FY15 Estimated Savings Net Savings ($10M) ($20M) ($20M) ($50M) EPS Impact $0.04 $0.08 $0.08 $0.20 2012 Legacy ascena ~$70M 2012 Legacy Charming Shoppes ~$80M Proforma ascena Shared Services Group ~$150M
Slide 40: Brand Synergies Potential
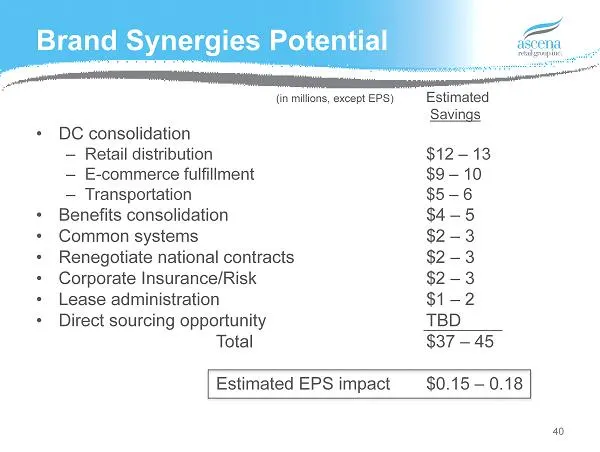
Brand Synergies Potential (in millions, except EPS) Estimated Savings • DC consolidation – Retail distribution $12 – 13 – E - commerce fulfillment $9 – 10 – Transportation $5 – 6 • Benefits consolidation $4 – 5 • Common systems $2 – 3 • Renegotiate national contracts $2 – 3 • Corporate Insurance/Ris
Slide 41: Financials
= ascena retail group inc. Financials ye Stee seve dressbarn — CATHERINES
Slide 42: Holiday Sales
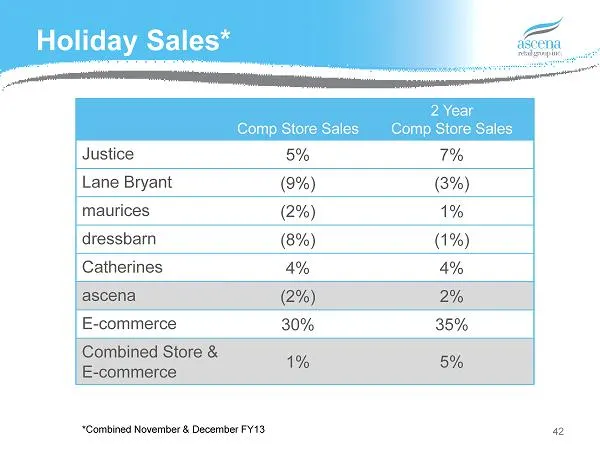
Holiday Sales* 42 Comp Store Sales 2 Year Comp Store Sales Justice 5% 7% Lane Bryant (9%) (3%) maurices (2%) 1% dressbarn (8%) (1%) Catherines 4% 4% ascena (2%) 2% E - commerce 30% 35% Combined Store & E - commerce 1% 5% *Combined November & December FY13
Slide 43: Sales Growth ($M)
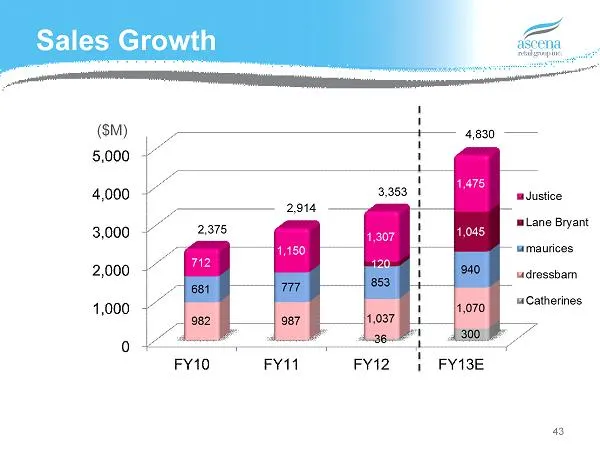
Sales Growth 43 ($M) 2,914 3,353 4,830 2,375
Slide 44: E-Commerce Growth ($M)
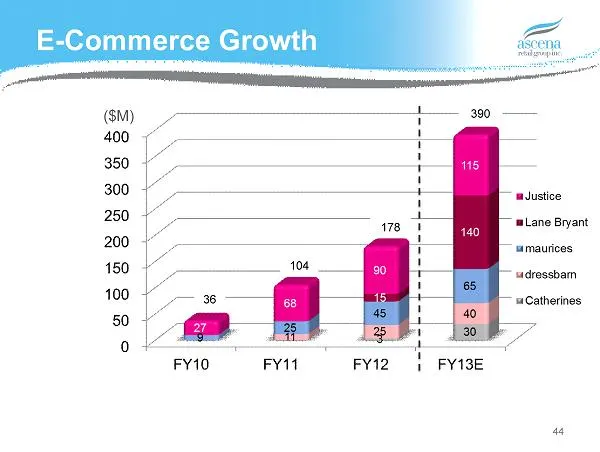
E - Commerce Growth 44 ($M) 104 178 390 36
Slide 45: Operating Income Growth
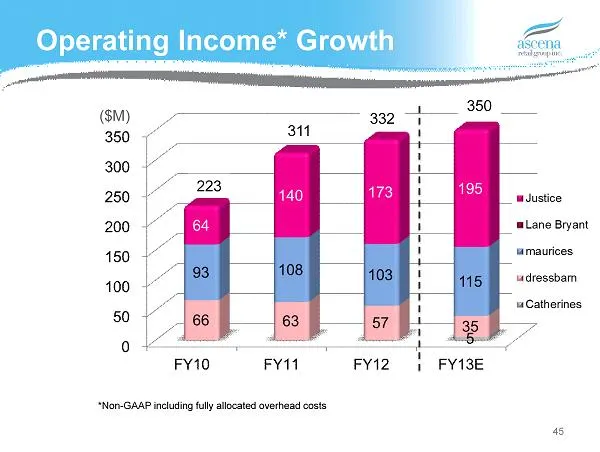
Operating Income* Growth 45 311 332 350 *Non - GAAP including fully allocated overhead costs ($M) 223
Slide 46: Annual EPS Growth
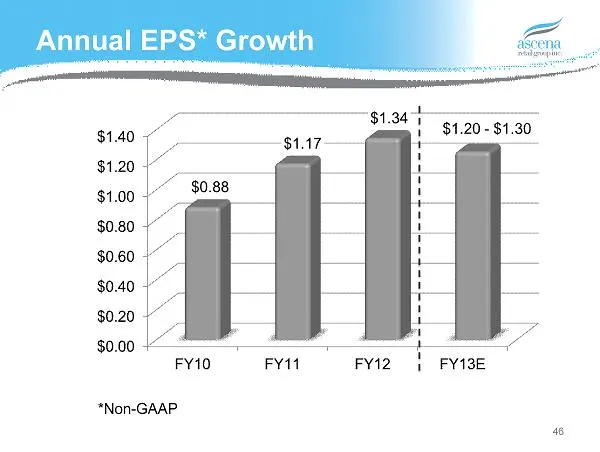
Annual EPS* Growth 46 *Non - GAAP
Slide 47: Cash Usage: Share Repurchases, CapEx, Debt Repayment
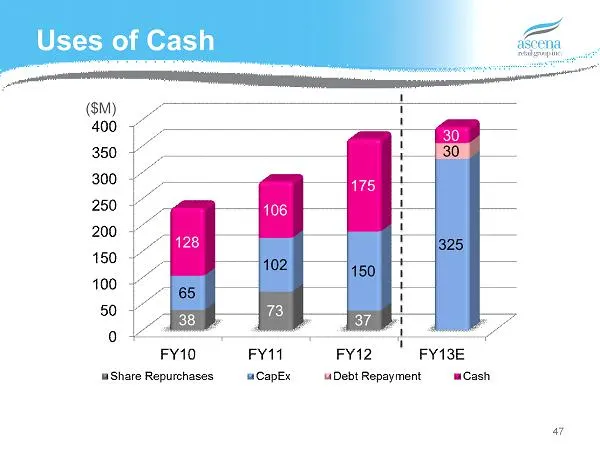
z FY10 FY11 FY12 FY13E Share Repurchases uCapEx —uDebt Repayment. Cash a7
Slide 48: Long-term Economic Model
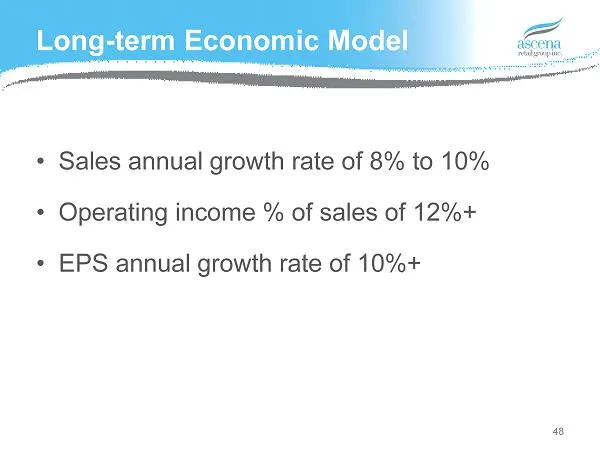
Long - term Economic Model • Sales annual growth rate of 8% to 10% • Operating income % of sales of 12%+ • EPS annual growth rate of 10%+ 48
Slide 49: Investor Highlights
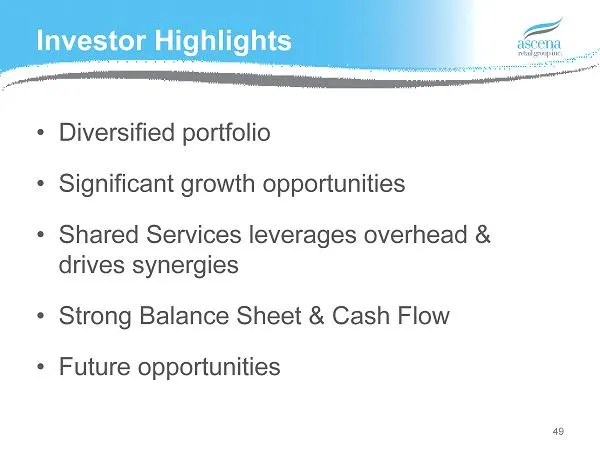
Investor Highlights 49 • Diversified portfolio • Significant growth opportunities • Shared Services leverages overhead & drives synergies • Strong Balance Sheet & Cash Flow • Future opportunities
Slide 50: ascena retail group inc.
= ascena retail group inc. ye Stee seve dressbarn — CATHERINES
Source: SEC EDGAR · 8-K filed Jan 23, 2013
More decks from Ascena Retail Group Inc
 Q2 FY2020 Earnings Presentation9 slides · Mar 9, 2020
 Q1 FY2020 Earnings Presentation9 slides · Dec 9, 2019
 Q4 FY2019 Earnings Presentation9 slides · Oct 3, 2019
 Earnings Presentation (June 2019)5 slides · Jun 10, 2019
 Q3 2019 Earnings Presentation11 slides · Jun 10, 2019
 Q2 FY2019 Earnings Presentation12 slides · Mar 14, 2019