Sanchez Energy — Investor Day (January 2017)
98 slides from Sanchez Energy's investor day presentation, Jan 23, 2017
Slide 1: SN Analyst & Investor Day
Results Driven. Manufacturing Focused. SN Analyst & Investor Day January 23, 2017 January 23, 2017 www.sanchezenergycorp.com
Slide 2: Legal Disclaimers
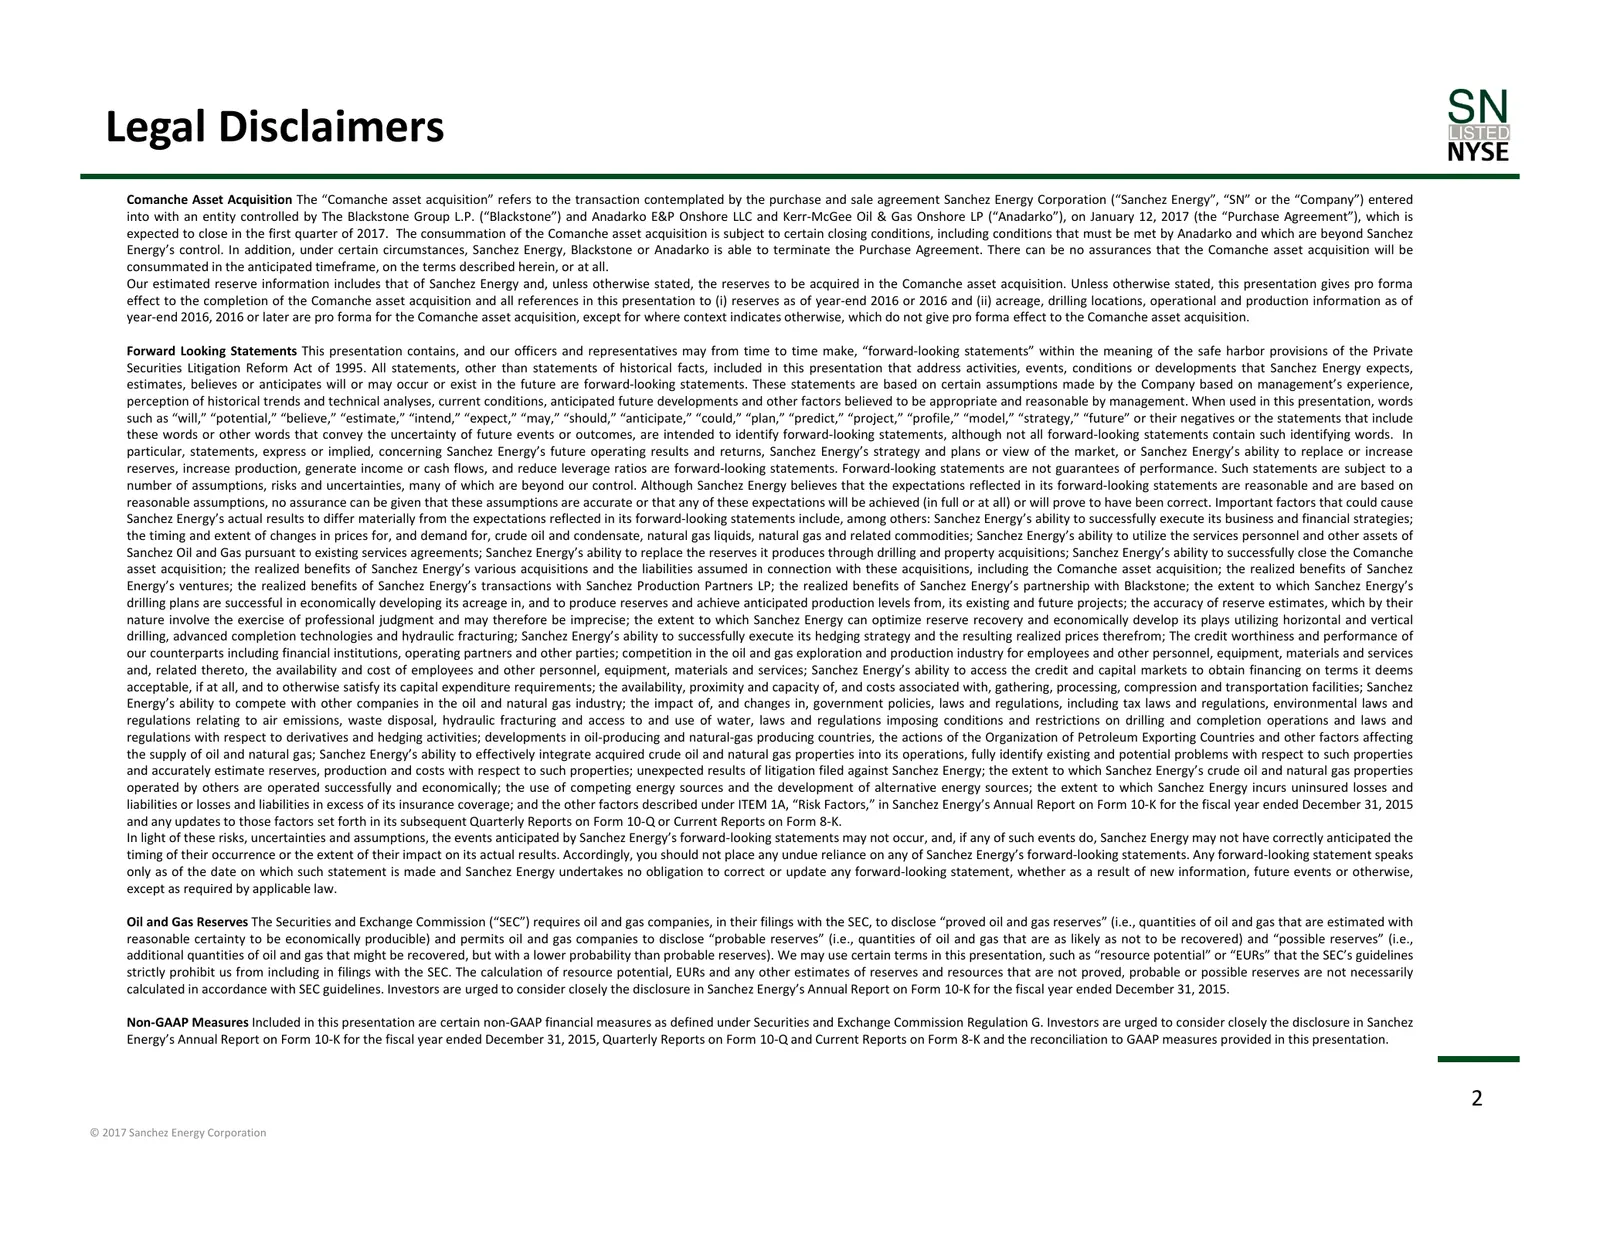
Legal Disclaimers Comanche Asset Acquisition The “Comanche asset acquisition” refers to the transaction contemplated by the purchase and sale agreement Sanchez Energy Corporation (“Sanchez Energy”, “SN” or the “Company”) entered into with an entity controlled by The Blackstone Group L.P. (“Blackston
Slide 3: 2017 Analyst Day Agenda
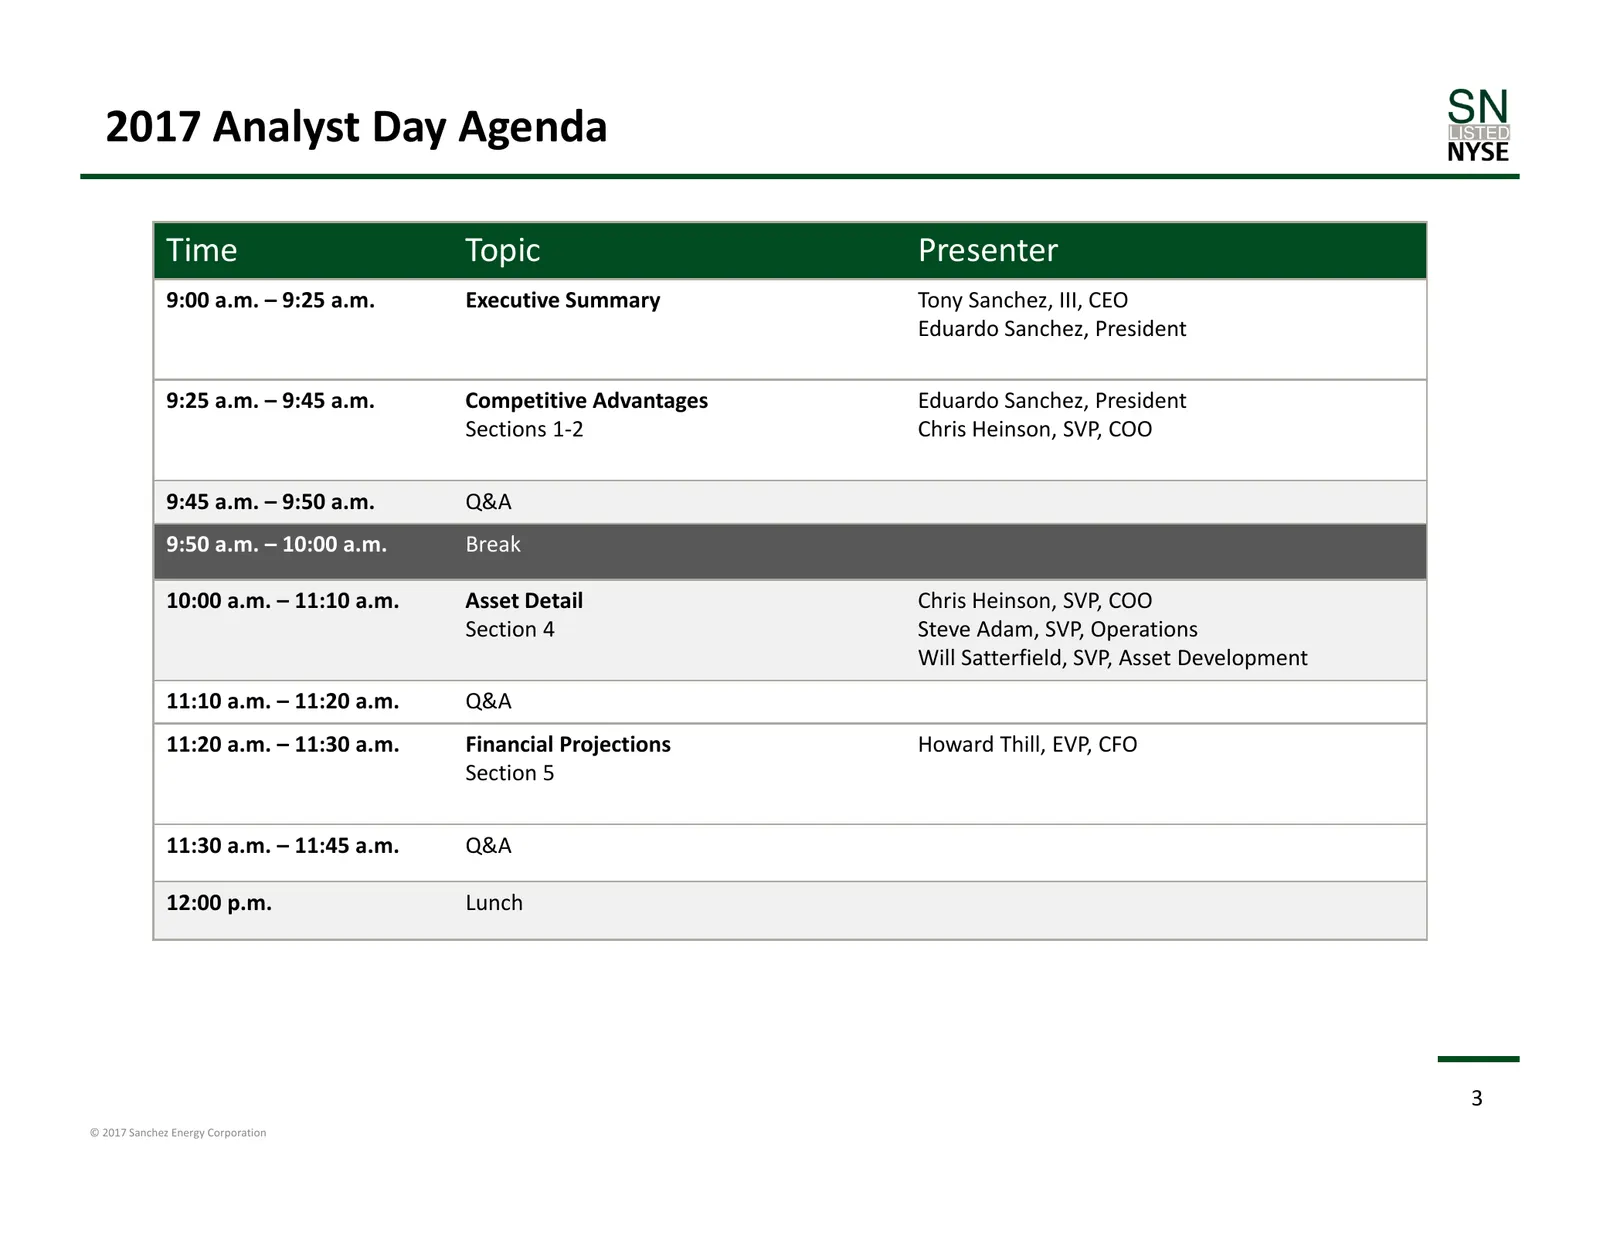
2017 Analyst Day Agenda Time Topic Presenter 9:00 a.m. – 9:25 a.m. Executive Summary Tony Sanchez, III, CEO Eduardo Sanchez, President 9:25 a.m. – 9:45 a.m. Competitive Advantages Eduardo Sanchez, President Sections 1‐2 Chris Heinson, SVP, COO 9:45 a.m. – 9:50 a.m. Q&A 9:50 a.m. – 10:00 a.m. Break 1
Slide 4: Sanchez Energy: Transformation in 2016
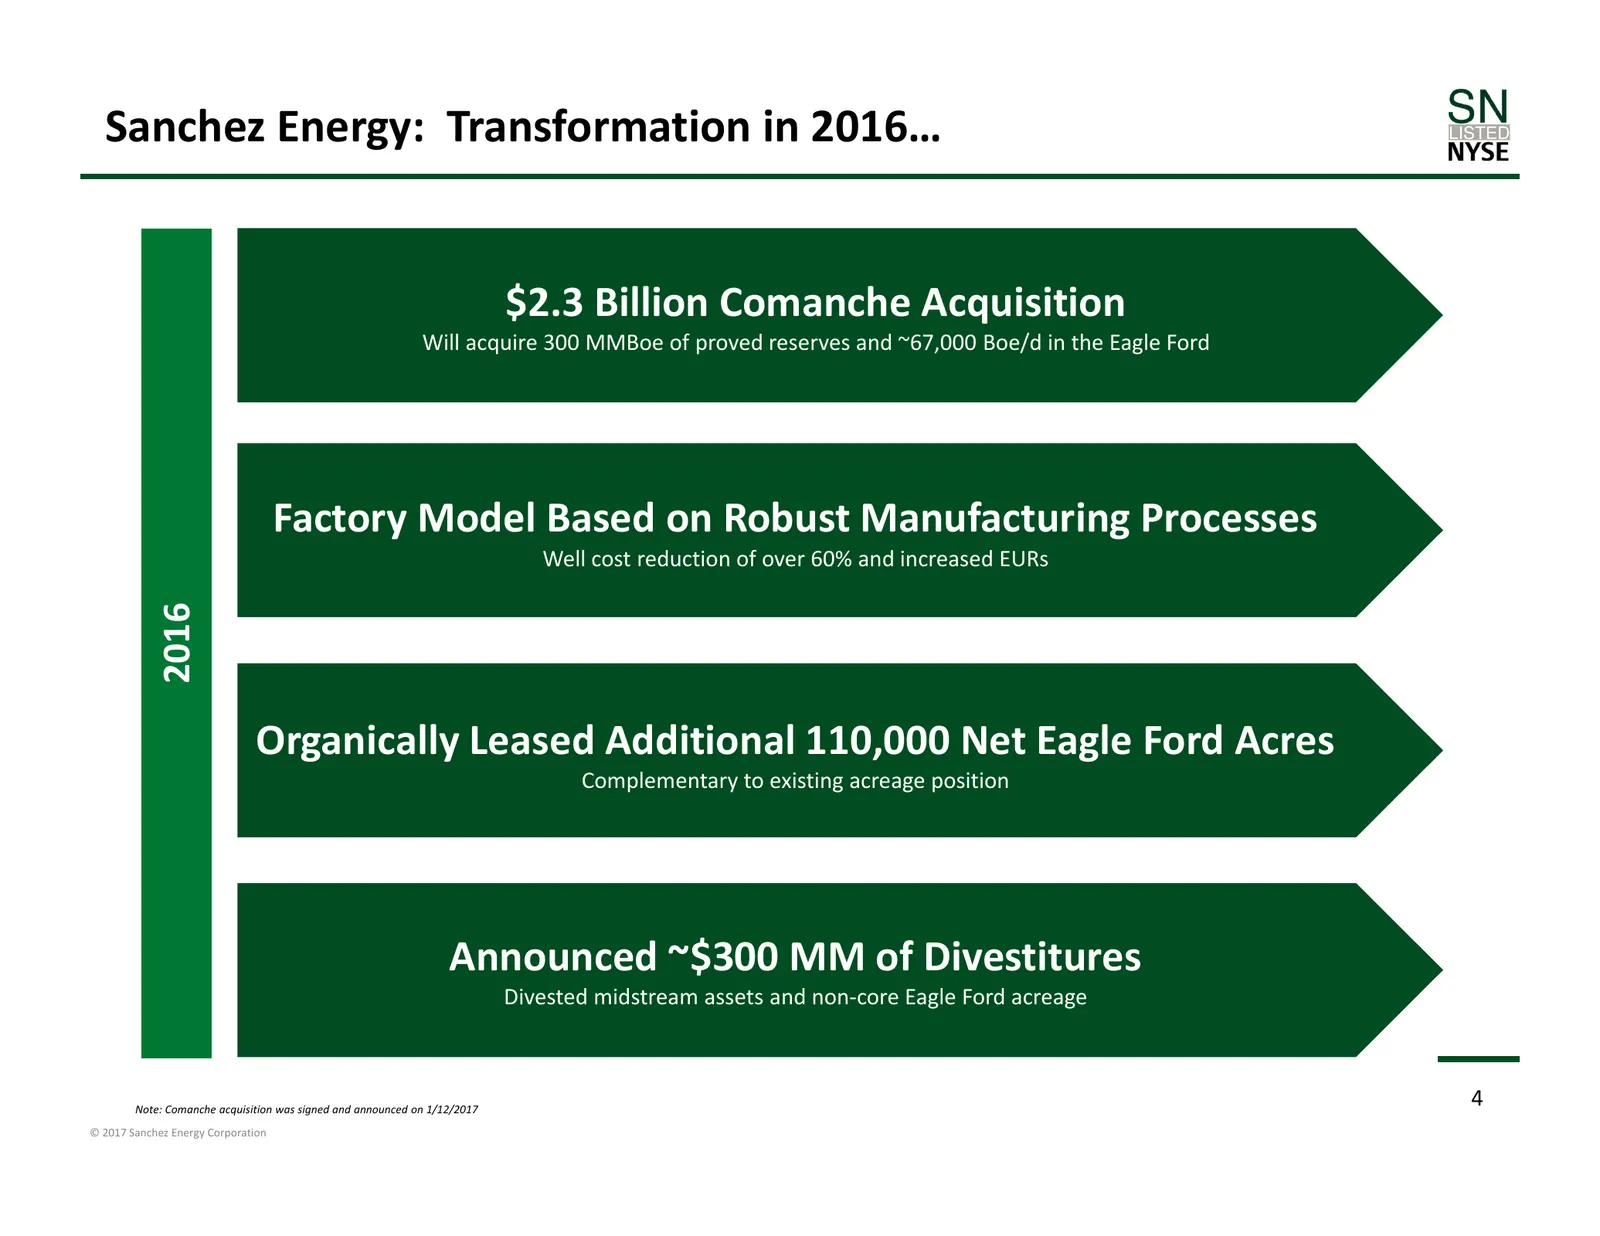
Sanchez Energy: Transformation in 2016… $2.3 Billion Comanche Acquisition Will acquire 300 MMBoe of proved reserves and ~67,000 Boe/d in the Eagle Ford Along with Blackstone, agreed to acquire Anadarko’s Eagle Ford acreage Factory Model Based on Robust Manufacturing Processes Well cost reduction of
Slide 5: Leads to Creation of Shareholder Value
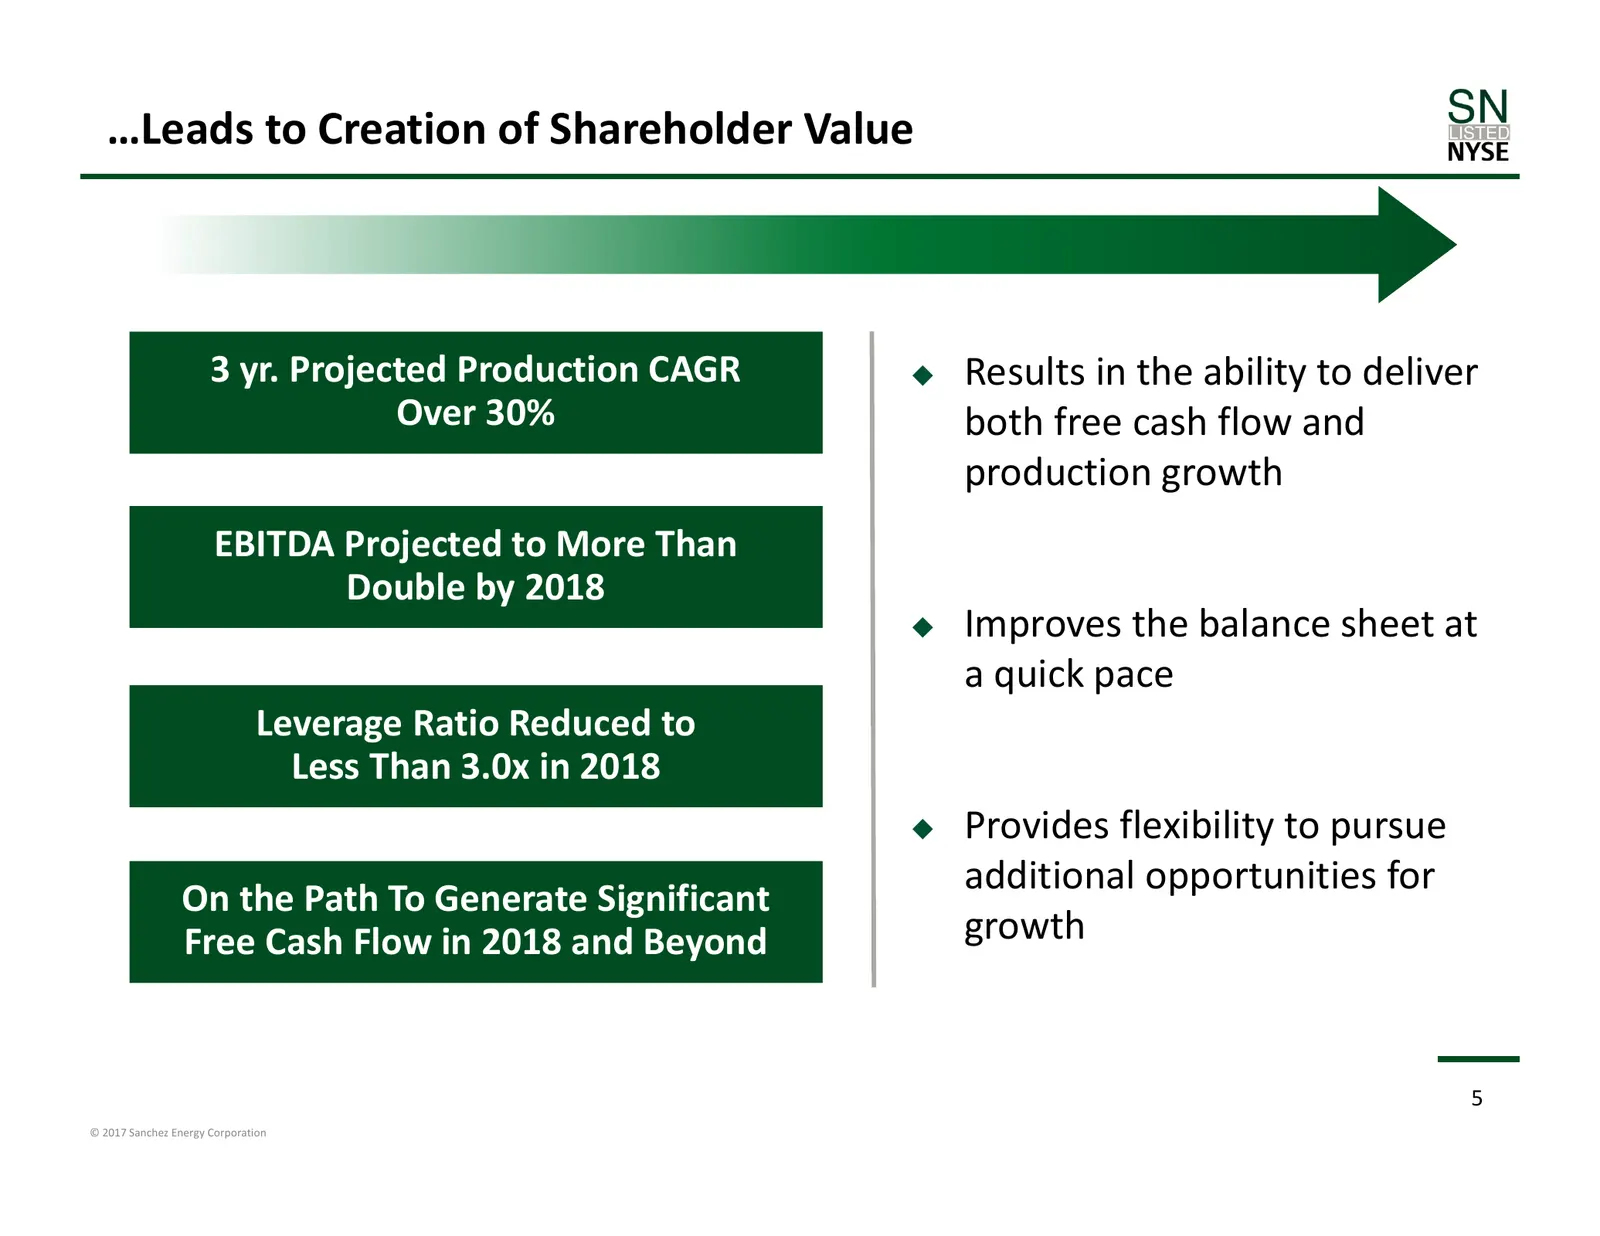
…Leads to Creation of Shareholder Value 3 yr. Projected Production CAGR Results in the ability to deliver Over 30% both free cash flow and production growth EBITDA Projected to More Than Double by 2018 Improves the balance sheet at a quick pace Leverage Ratio Reduced to Less Than 3.0x in 2018
Slide 6: Eagle Ford Shale – Focusing on Western Part of the Play
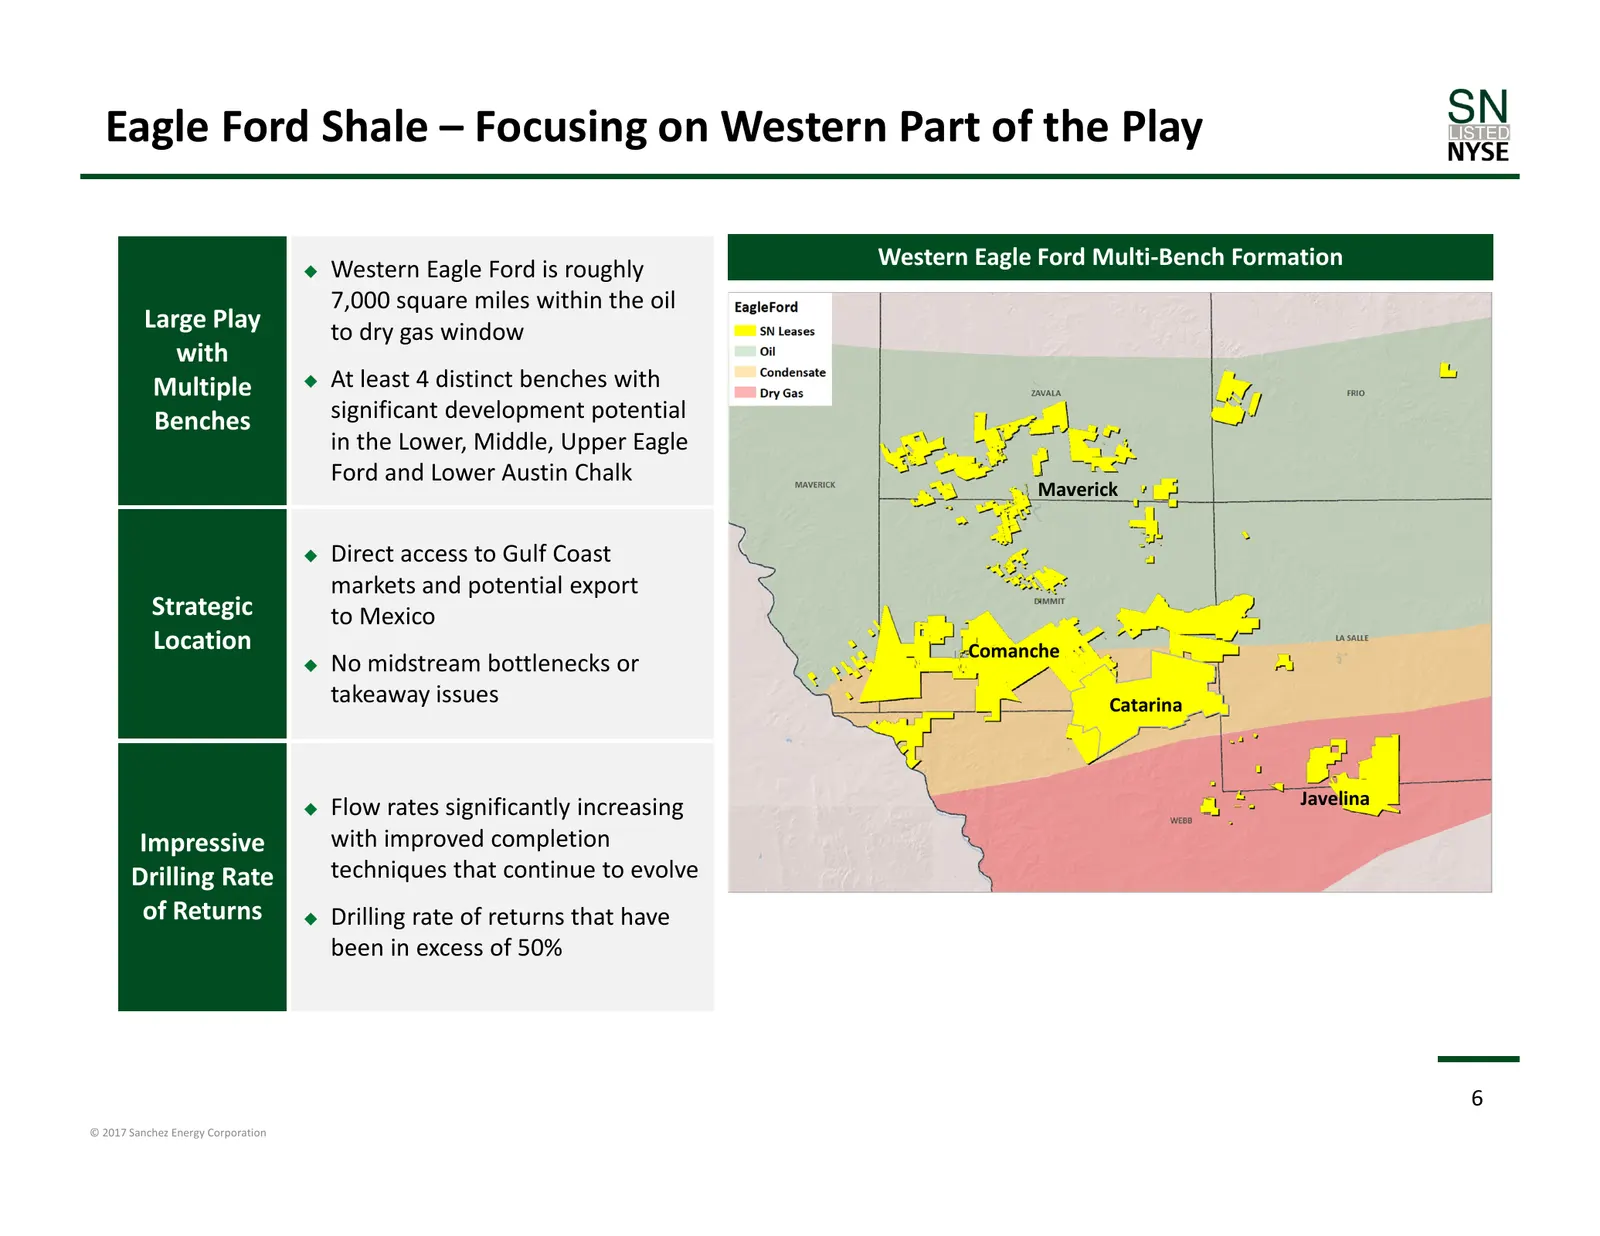
Eagle Ford Shale – Focusing on Western Part of the Play Western Eagle Ford is roughly Western Eagle Ford Multi‐Bench Formation 7,000 square miles within the oil Large Play to dry gas window with Multiple At least 4 distinct benches with Benches significant development potential in the Lower, Mid
Slide 7: Sanchez Energy – Building Asset Base in 2016
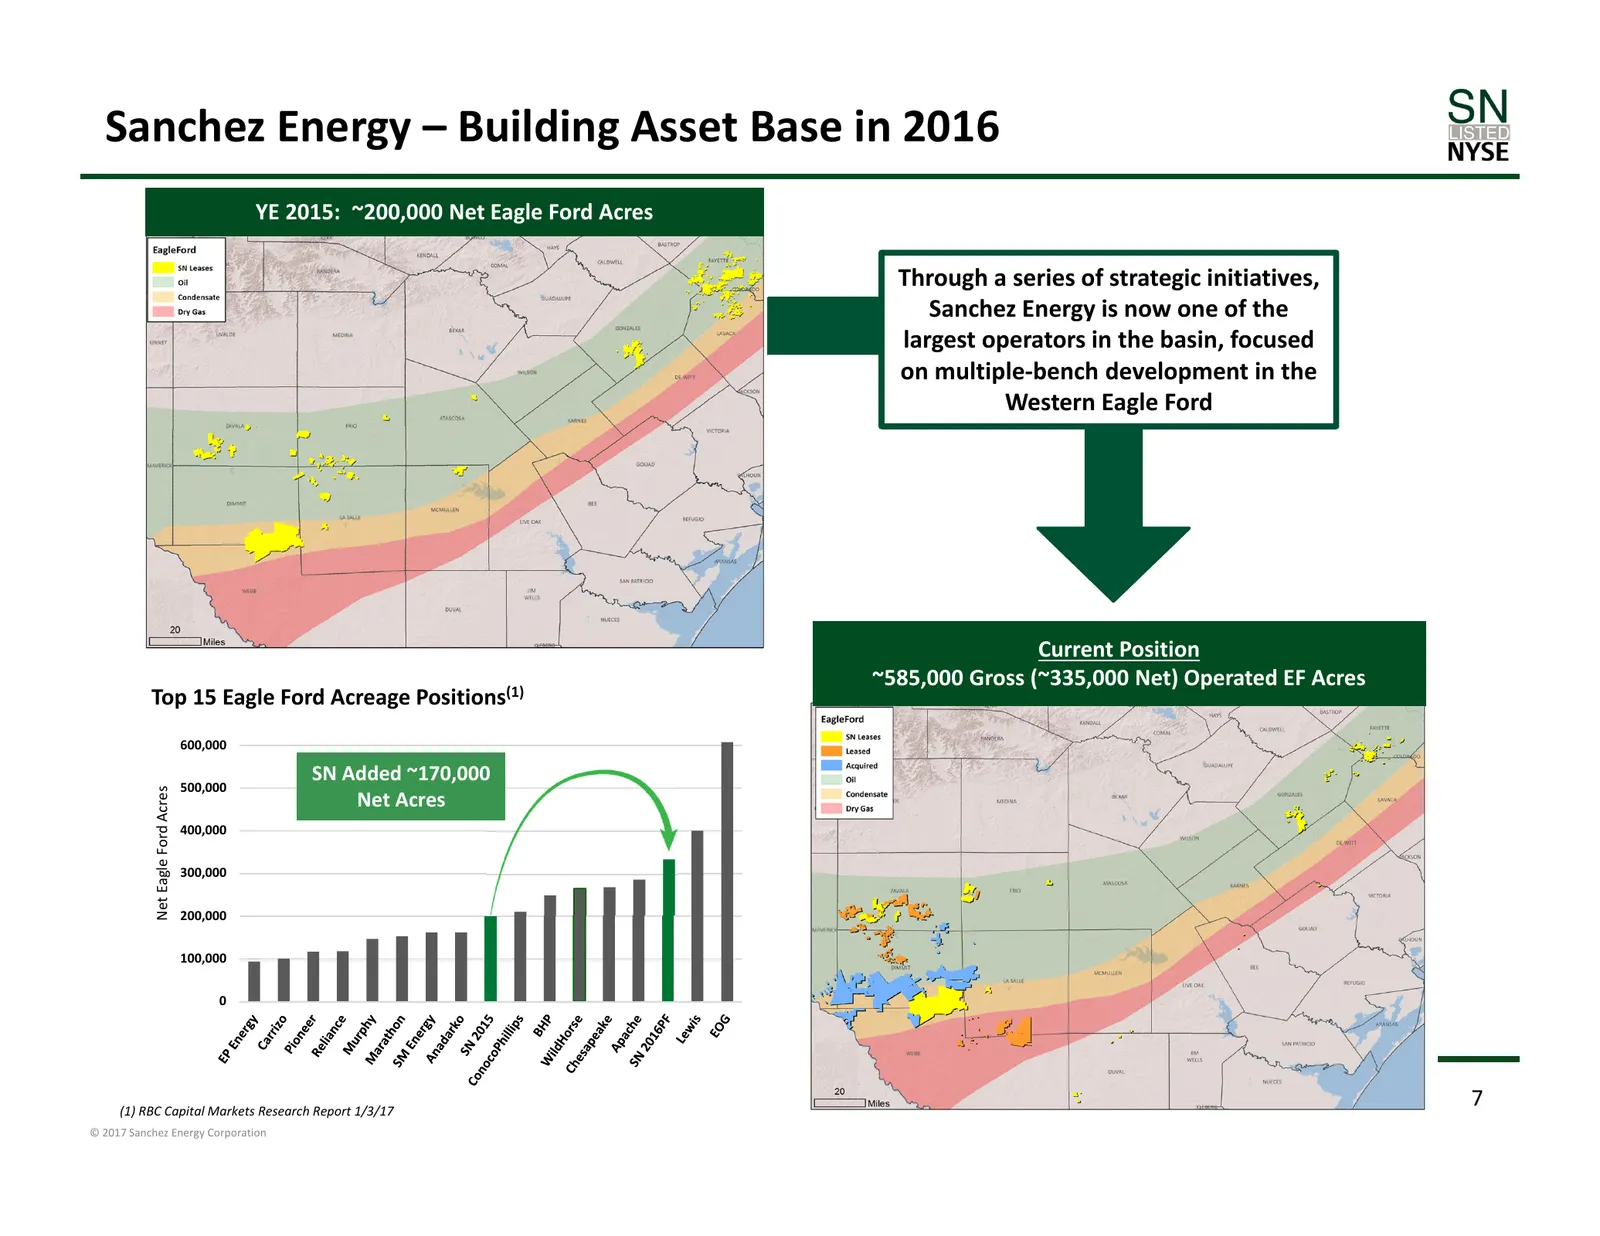
Sanchez Energy – Building Asset Base in 2016 YE 2015: ~200,000 Net Eagle Ford Acres Through a series of strategic initiatives, Sanchez Energy is now one of the largest operators in the basin, focused on multiple‐bench development in the Western Eagle Ford Current Position ~585,000 Gross (~335,000 Ne
Slide 8: Comanche Acquisition Compliments Strength of Asset Base
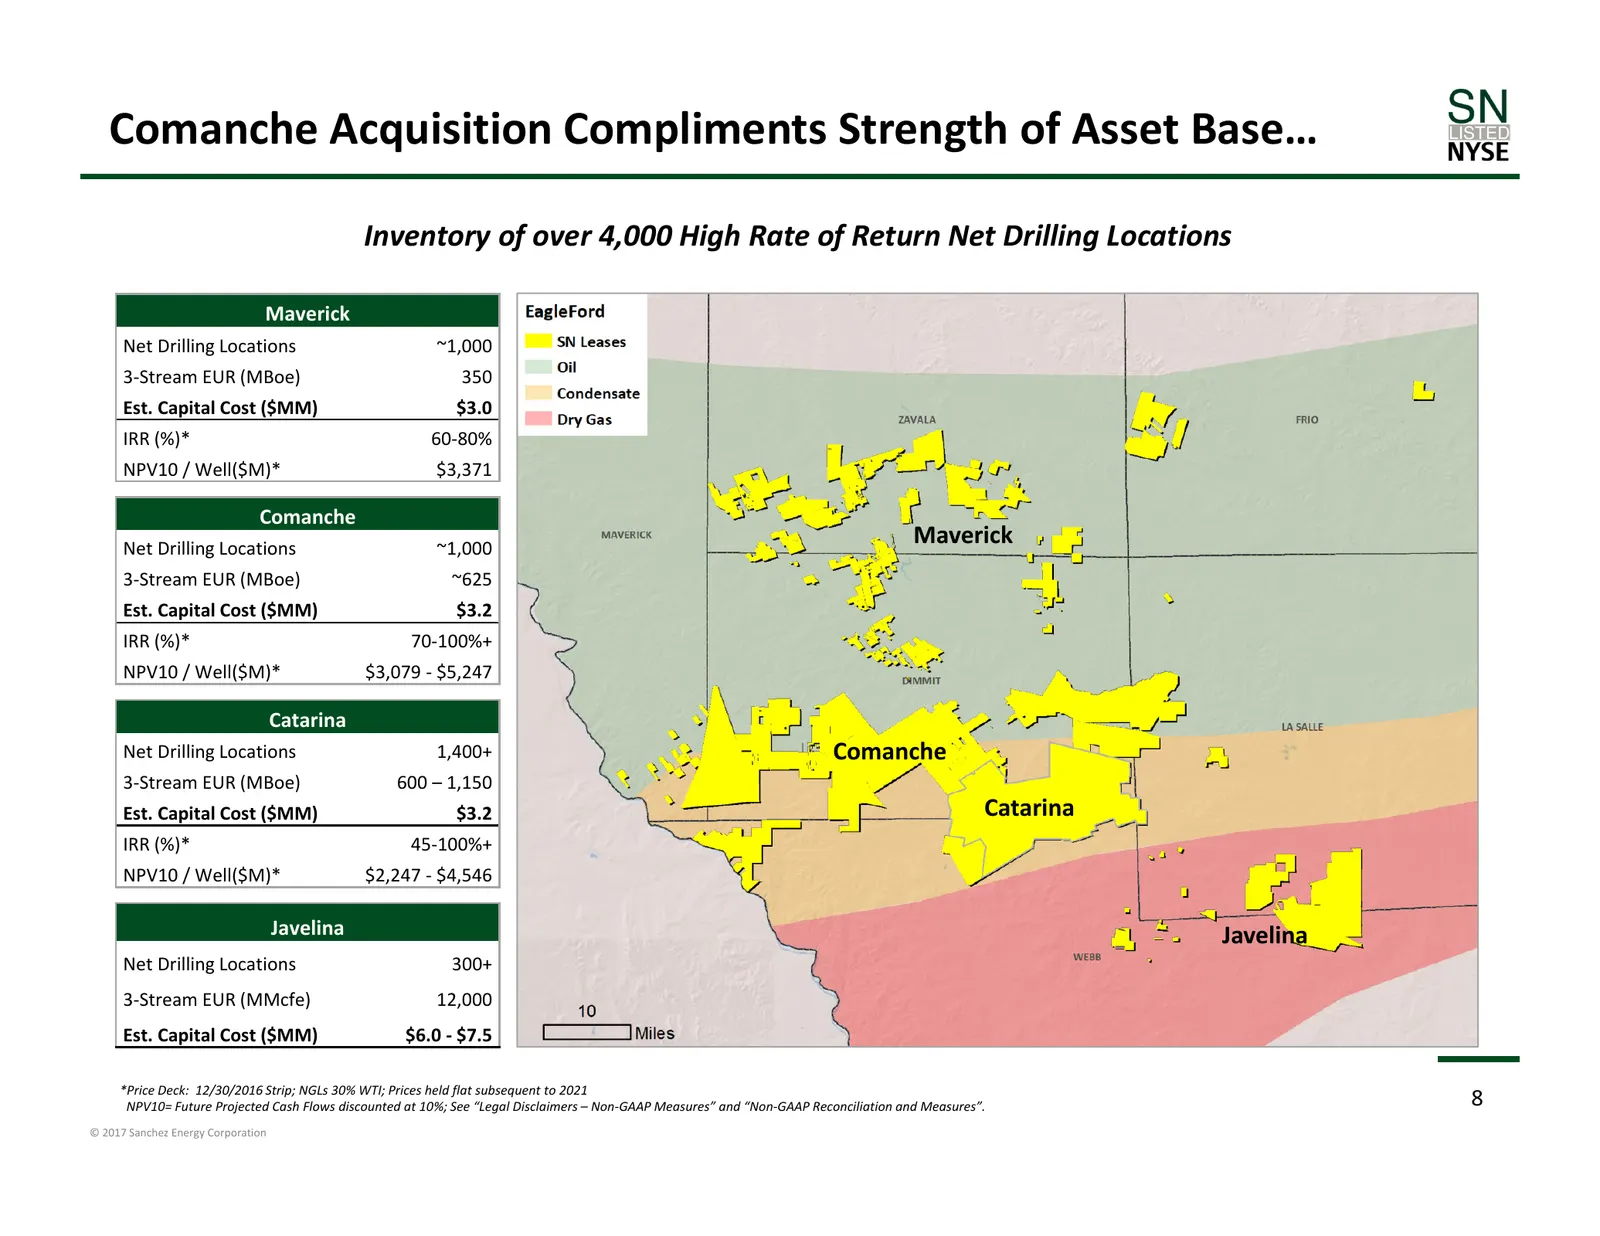
Comanche Acquisition Compliments Strength of Asset Base… Inventory of over 4,000 High Rate of Return Net Drilling Locations Maverick Net Drilling Locations ~1,000 3‐Stream EUR (MBoe) 350 Est. Capital Cost ($MM) $3.0 IRR (%)* 60‐80% NPV10 / Well($M)* $3,371 Comanche Net Drilling Locations ~1,000 Mave
Slide 9: And Drives Strong Net Asset Value
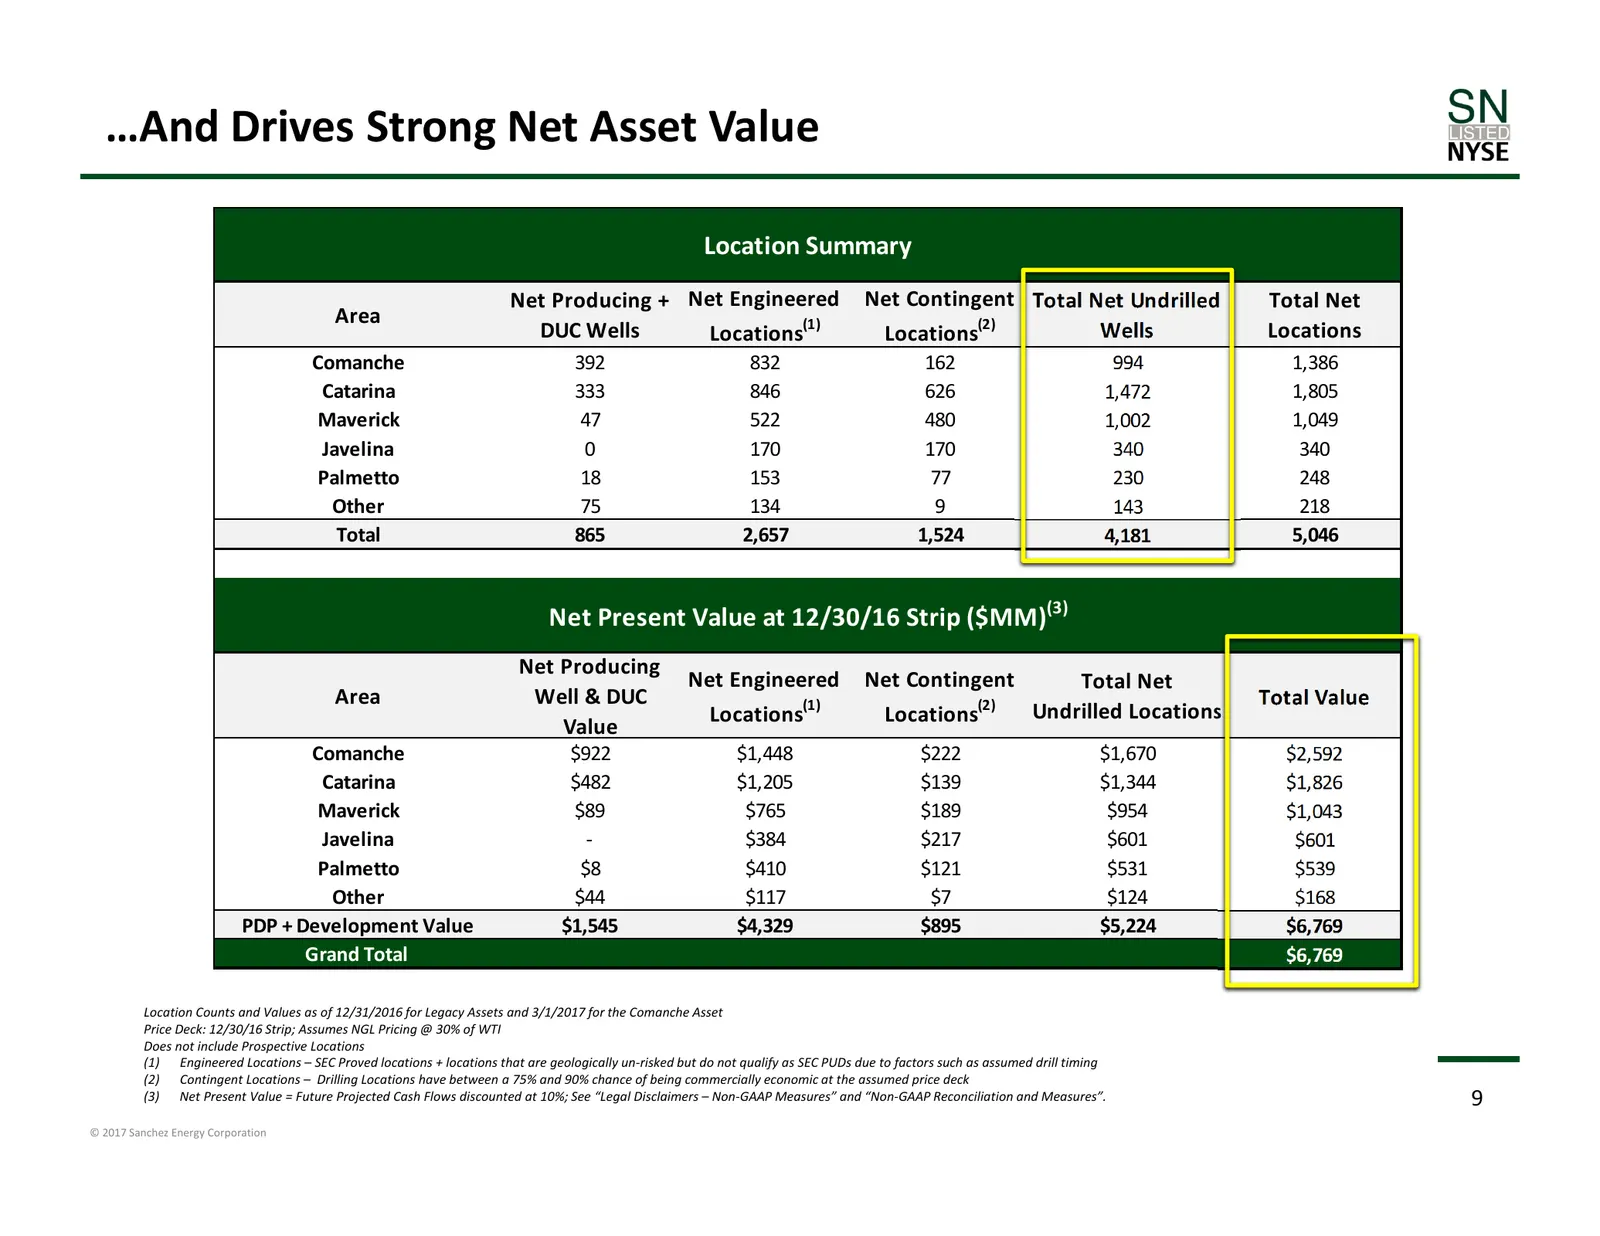
…And Drives Strong Net Asset Value Location Summary Net Producing + Net Engineered Net Contingent Total Net Undrilled Total Net Area DUC Wells Locations(1) Locations(2) Wells Locations Comanche 392 832 162 994 1,386 Catarina 333 846 626 1,472 1,805 Maverick 47 522 480 1,002 1,049 Javelina 0 170 170
Slide 10: Sanchez Energy Transformation Snapshot
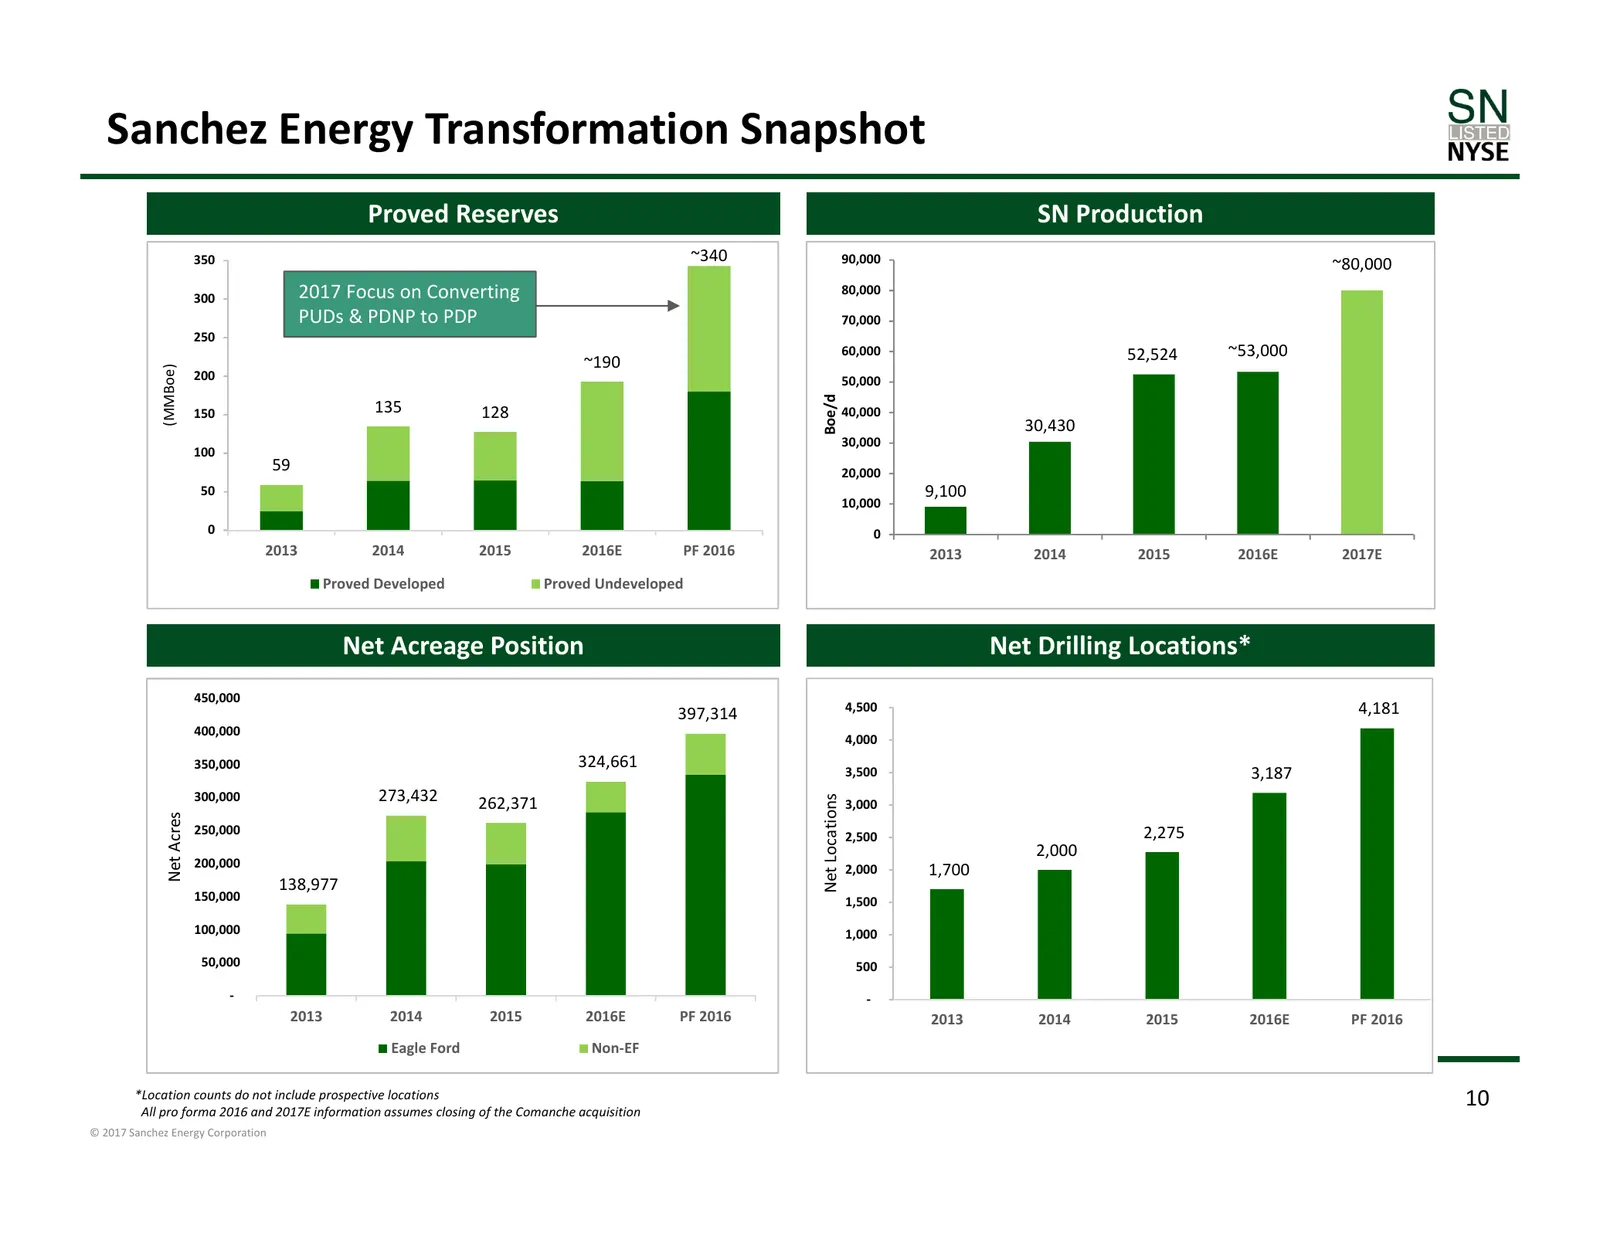
Sanchez Energy Transformation Snapshot Proved Reserves SN Production 350 ~340 90,000 ~80,000 300 2017 Focus on Converting 80,000 PUDs & PDNP to PDP 70,000 250 60,000 52,524 ~53,000 ~190 (MMBoe) 200 50,000 Boe/d 150 135 128 40,000 30,430 30,000 100 59 20,000 50 9,100 10,000 0 0 2013 2014 2015 2016E P
Slide 11: Comanche Acquisition Adjacent to SN's Core Acreage
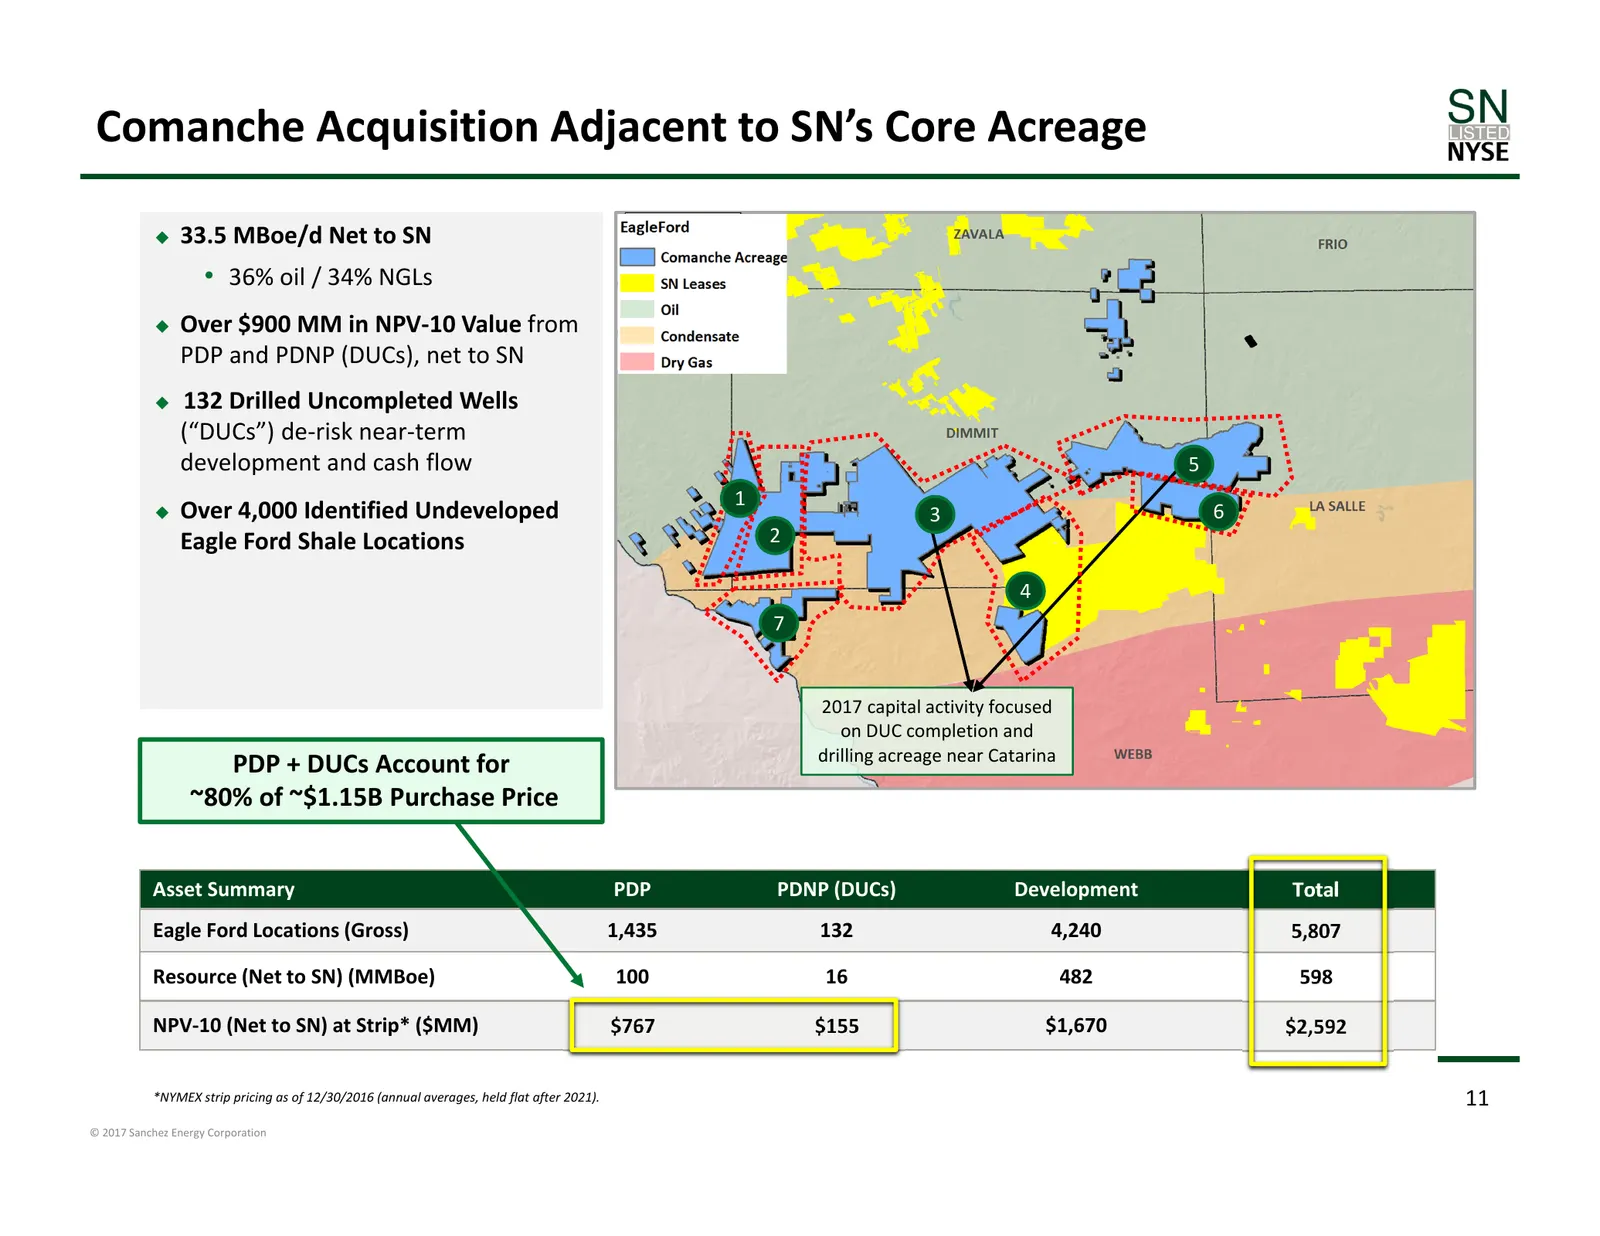
Comanche Acquisition Adjacent to SN’s Core Acreage 33.5 MBoe/d Net to SN • 36% oil / 34% NGLs Over $900 MM in NPV‐10 Value from PDP and PDNP (DUCs), net to SN 132 Drilled Uncompleted Wells (“DUCs”) de‐risk near‐term development and cash flow 5 1 Over 4,000 Identified Undeveloped 3 6 Eagle Fo
Slide 12: Strategic Joint Venture Facilitates Comanche Acquisition
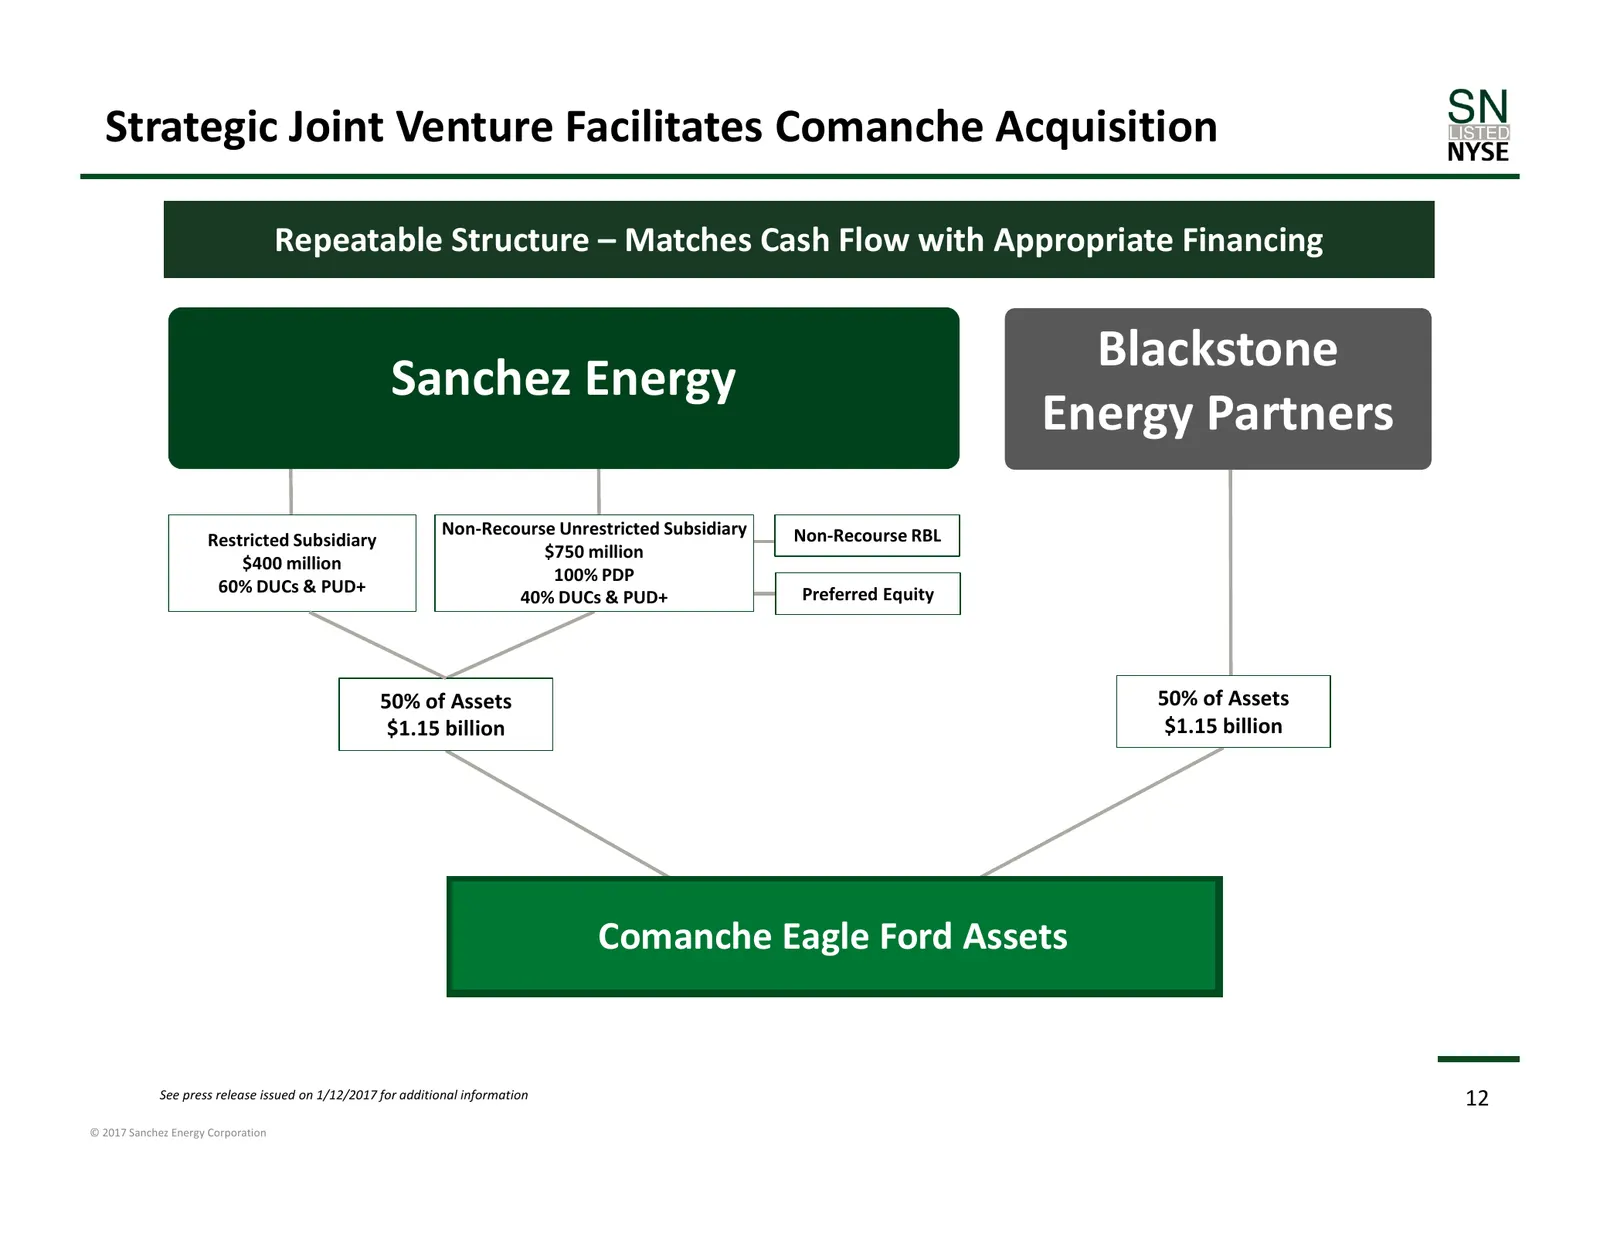
Strategic Joint Venture Facilitates Comanche Acquisition Repeatable Structure – Matches Cash Flow with Appropriate Financing Blackstone Sanchez Energy Energy Partners Non‐Recourse Unrestricted Subsidiary Non‐Recourse RBL Restricted Subsidiary $750 million $400 million 100% PDP 60% DUCs & PUD+ Prefer
Slide 13: Focus on Integration and Scalability
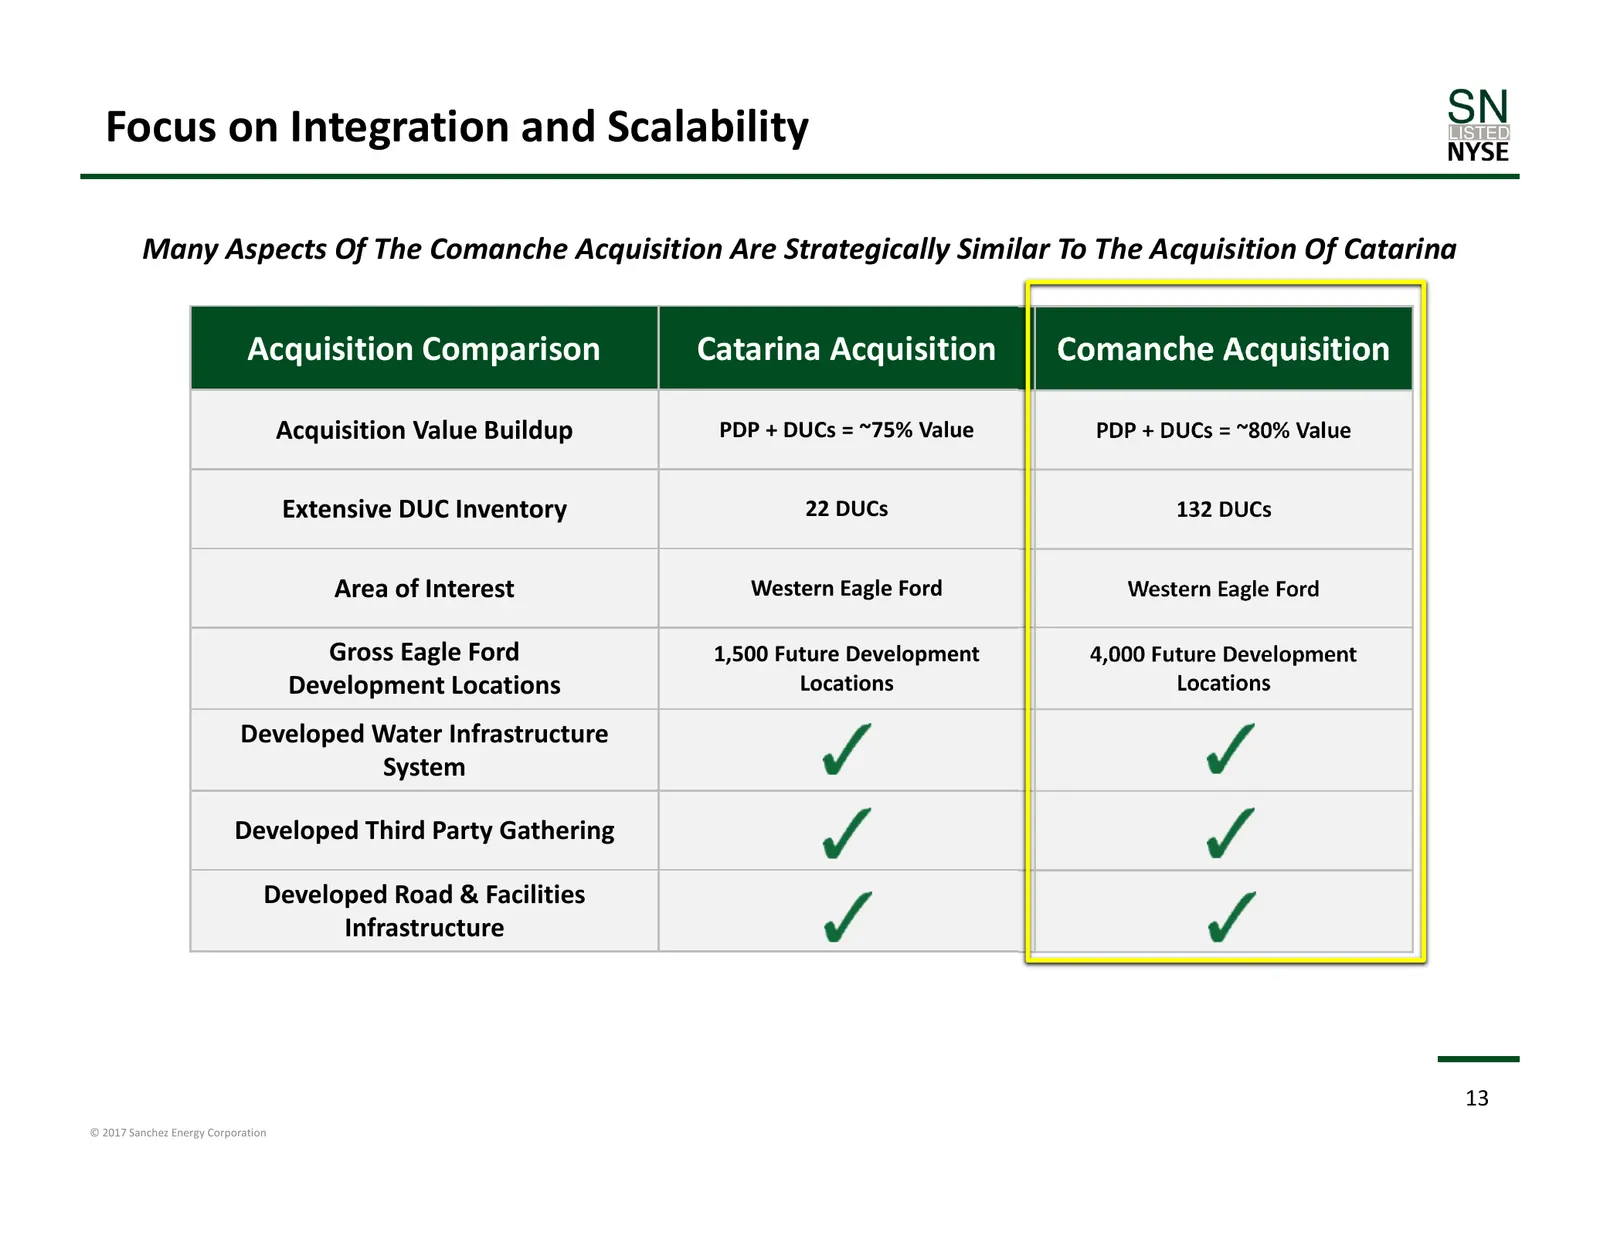
Focus on Integration and Scalability Many Aspects Of The Comanche Acquisition Are Strategically Similar To The Acquisition Of Catarina Acquisition Comparison Catarina Acquisition Comanche Acquisition Acquisition Value Buildup PDP + DUCs = ~75% Value PDP + DUCs = ~80% Value Extensive DUC Inventory 22
Slide 14: Catarina Case Study – Proven Scalability
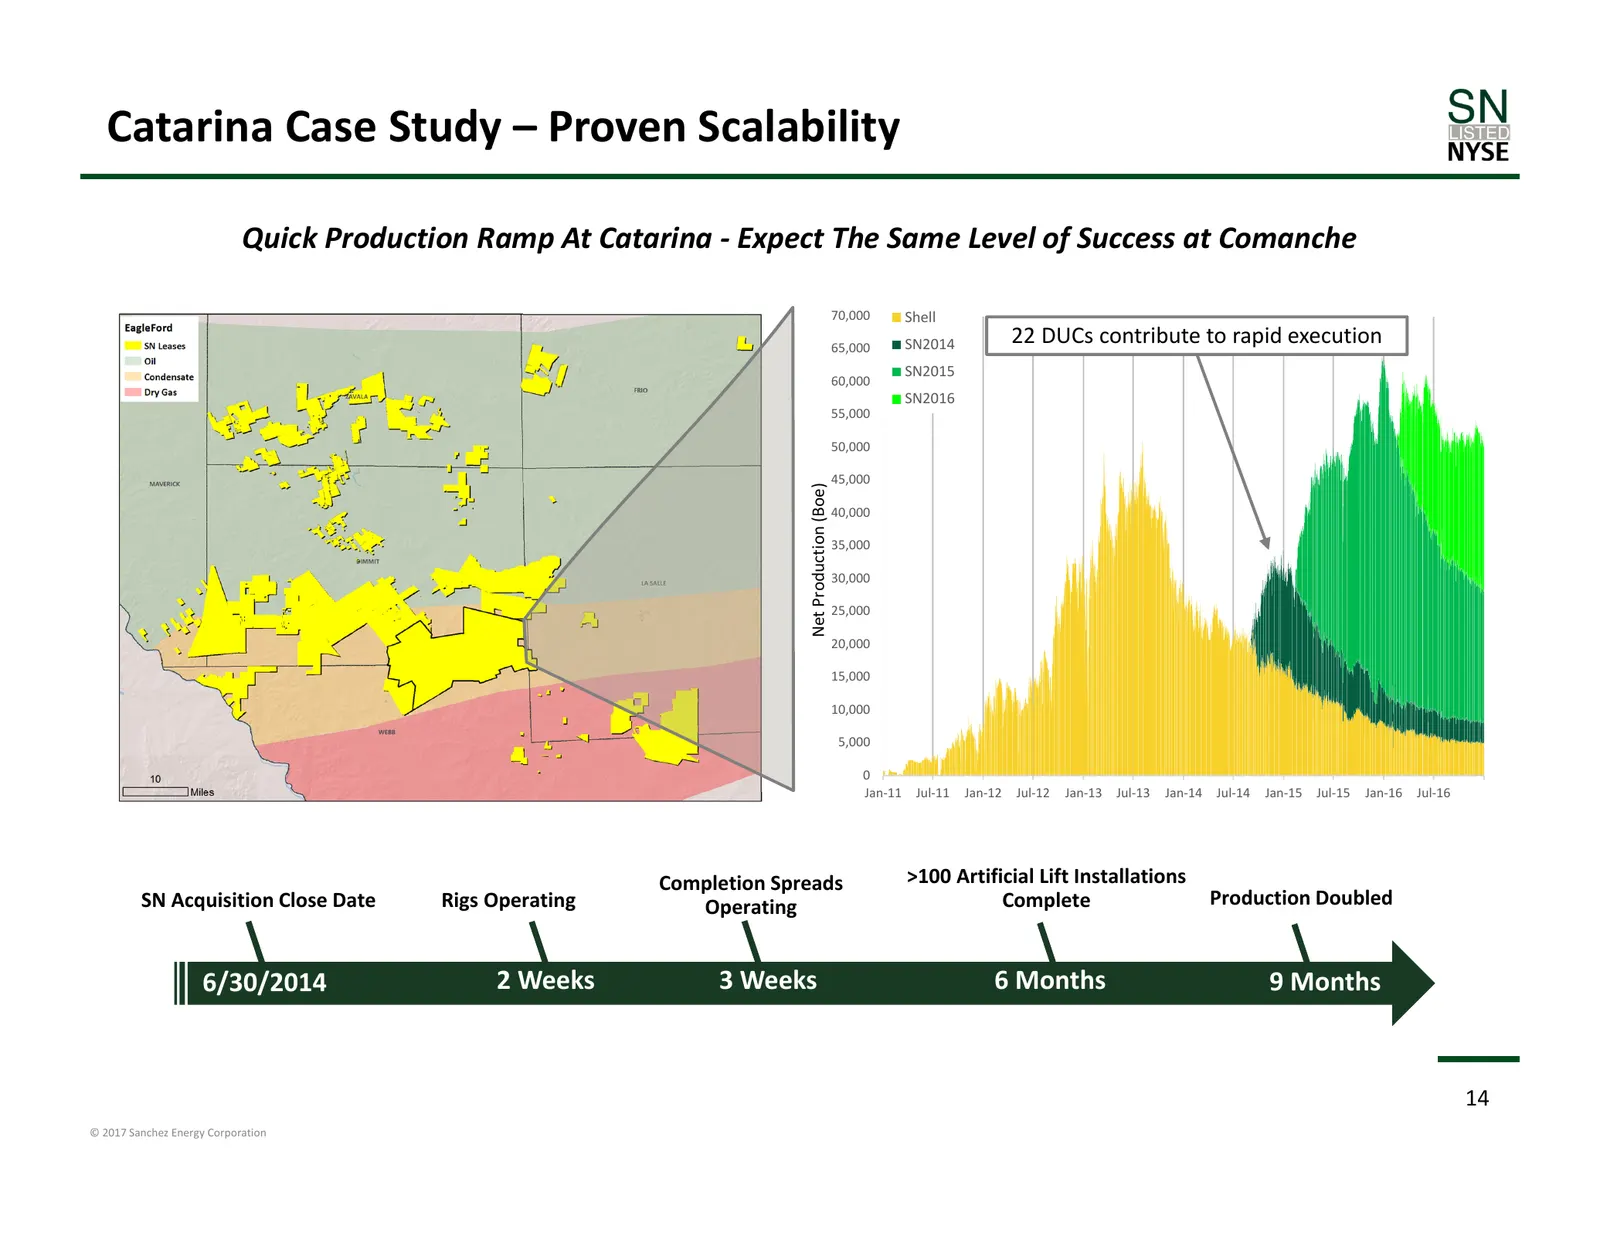
Catarina Case Study – Proven Scalability Quick Production Ramp At Catarina ‐ Expect The Same Level of Success at Comanche 70,000 Shell 65,000 SN2014 22 DUCs contribute to rapid execution SN2015 60,000 SN2016 55,000 50,000 45,000 Net Production (Boe) 40,000 35,000 30,000 25,000 20,000 15,000 10,000 5
Slide 15: 2016 Western Eagle Ford Lease Program Adds 110,000 Net Acres
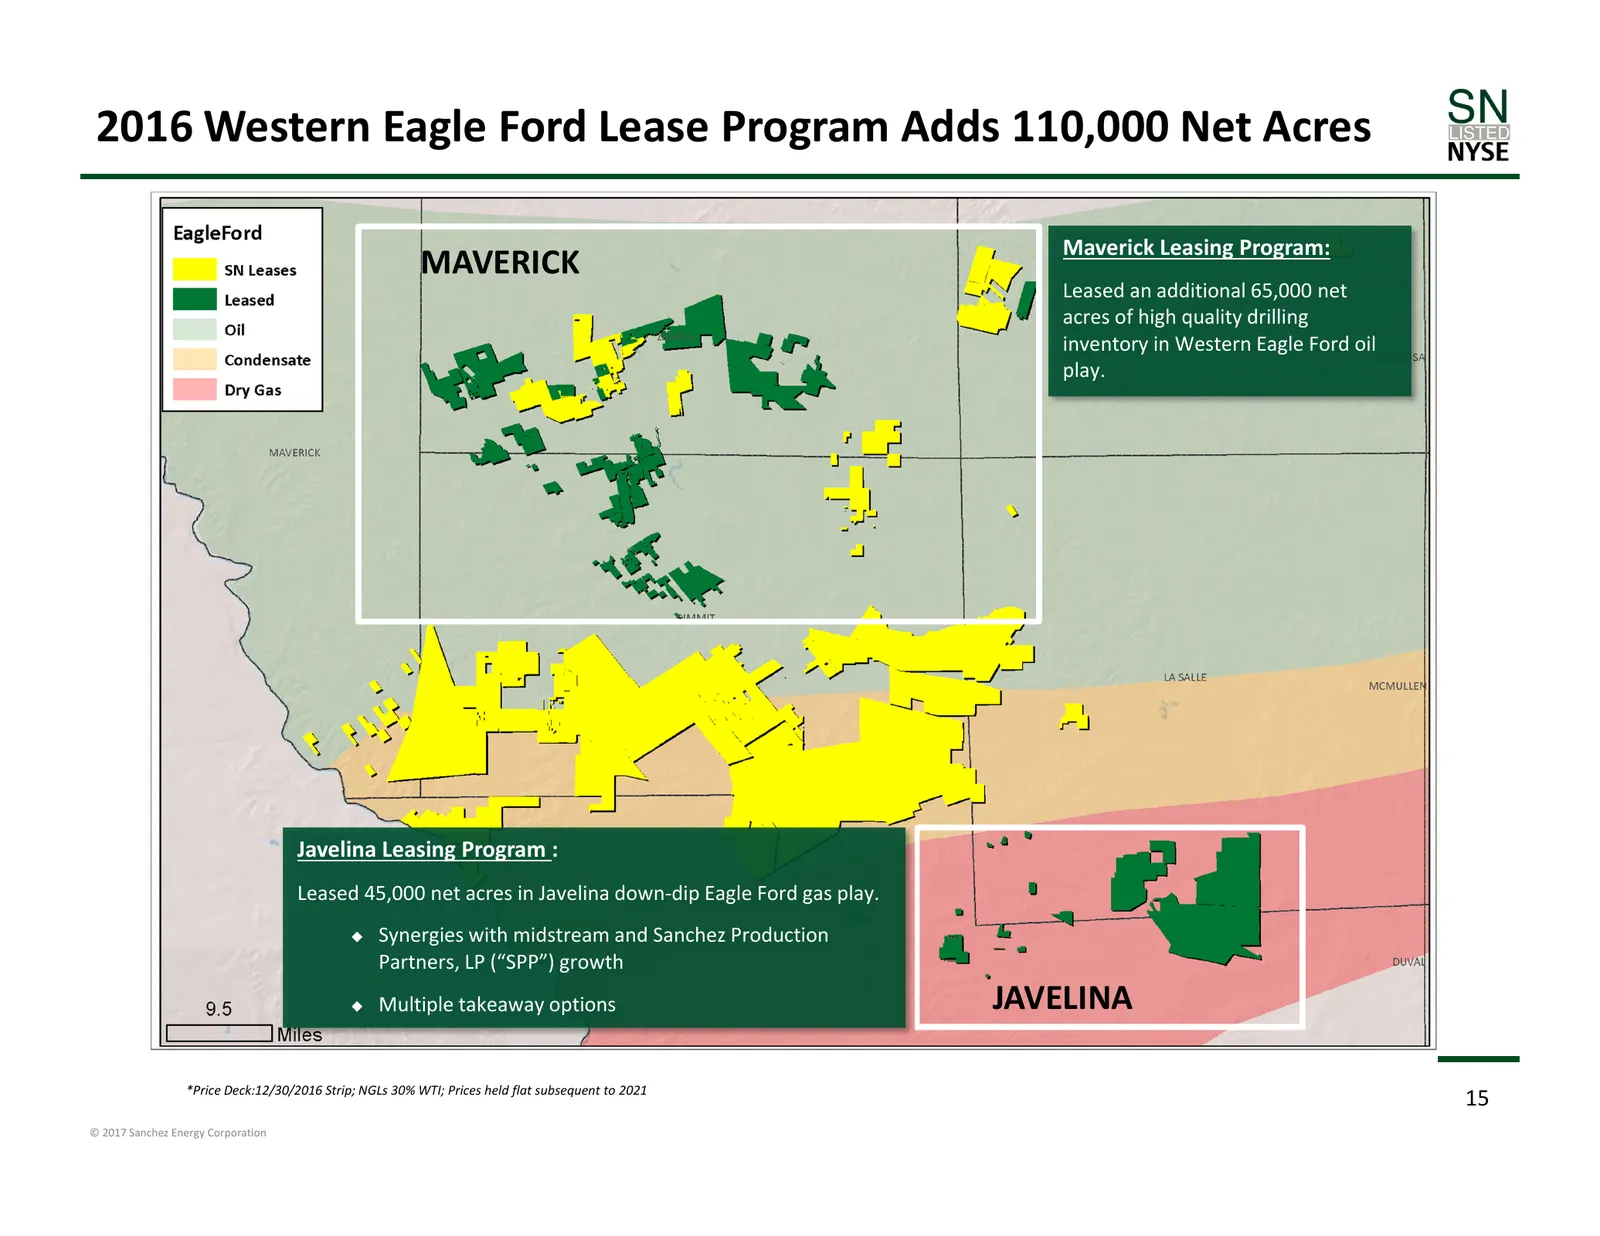
2016 Western Eagle Ford Lease Program Adds 110,000 Net Acres Maverick Leasing Program: MAVERICK Leased an additional 65,000 net acres of high quality drilling inventory in Western Eagle Ford oil play. Javelina Leasing Program : Leased 45,000 net acres in Javelina down‐dip Eagle Ford gas play. Syne
Slide 16: SPP Relationship Provides Optionality and Liquidity
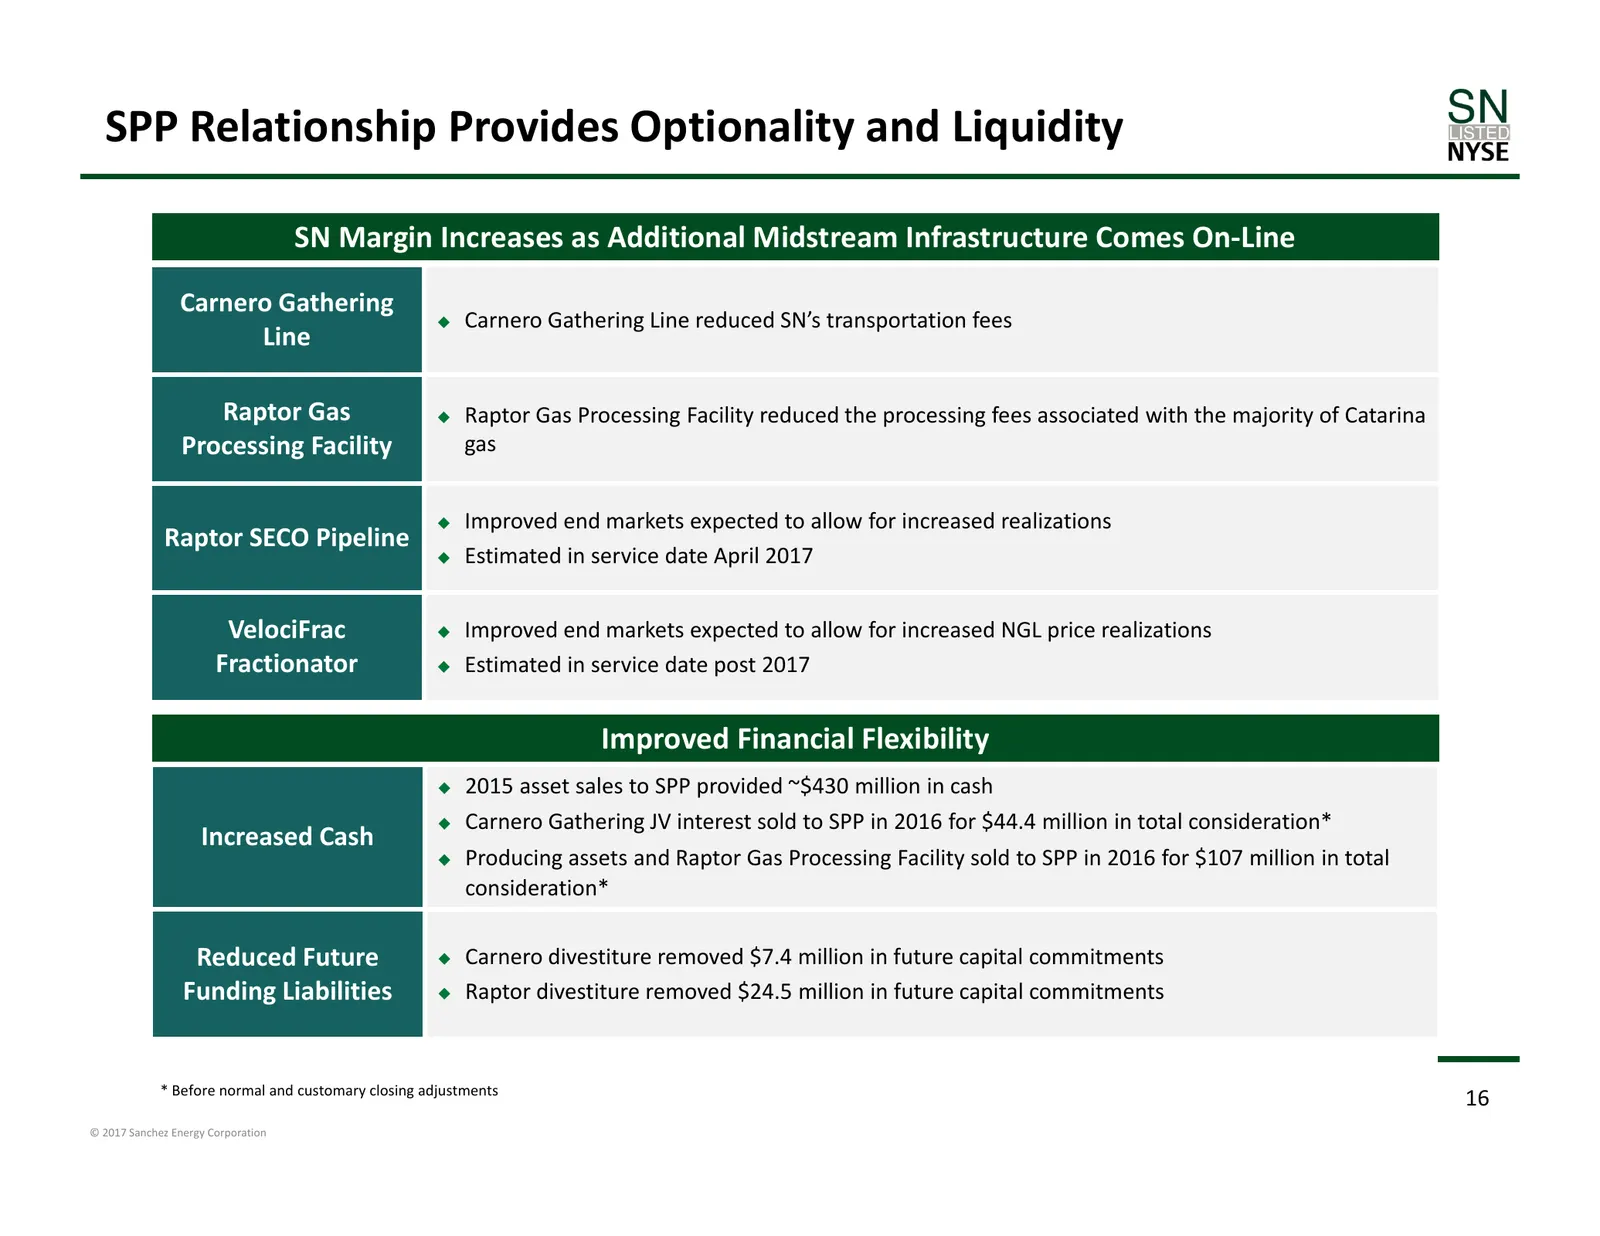
SPP Relationship Provides Optionality and Liquidity SN Margin Increases as Additional Midstream Infrastructure Comes On‐Line Carnero Gathering Carnero Gathering Line reduced SN’s transportation fees Line Raptor Gas Raptor Gas Processing Facility reduced the processing fees associated with the ma
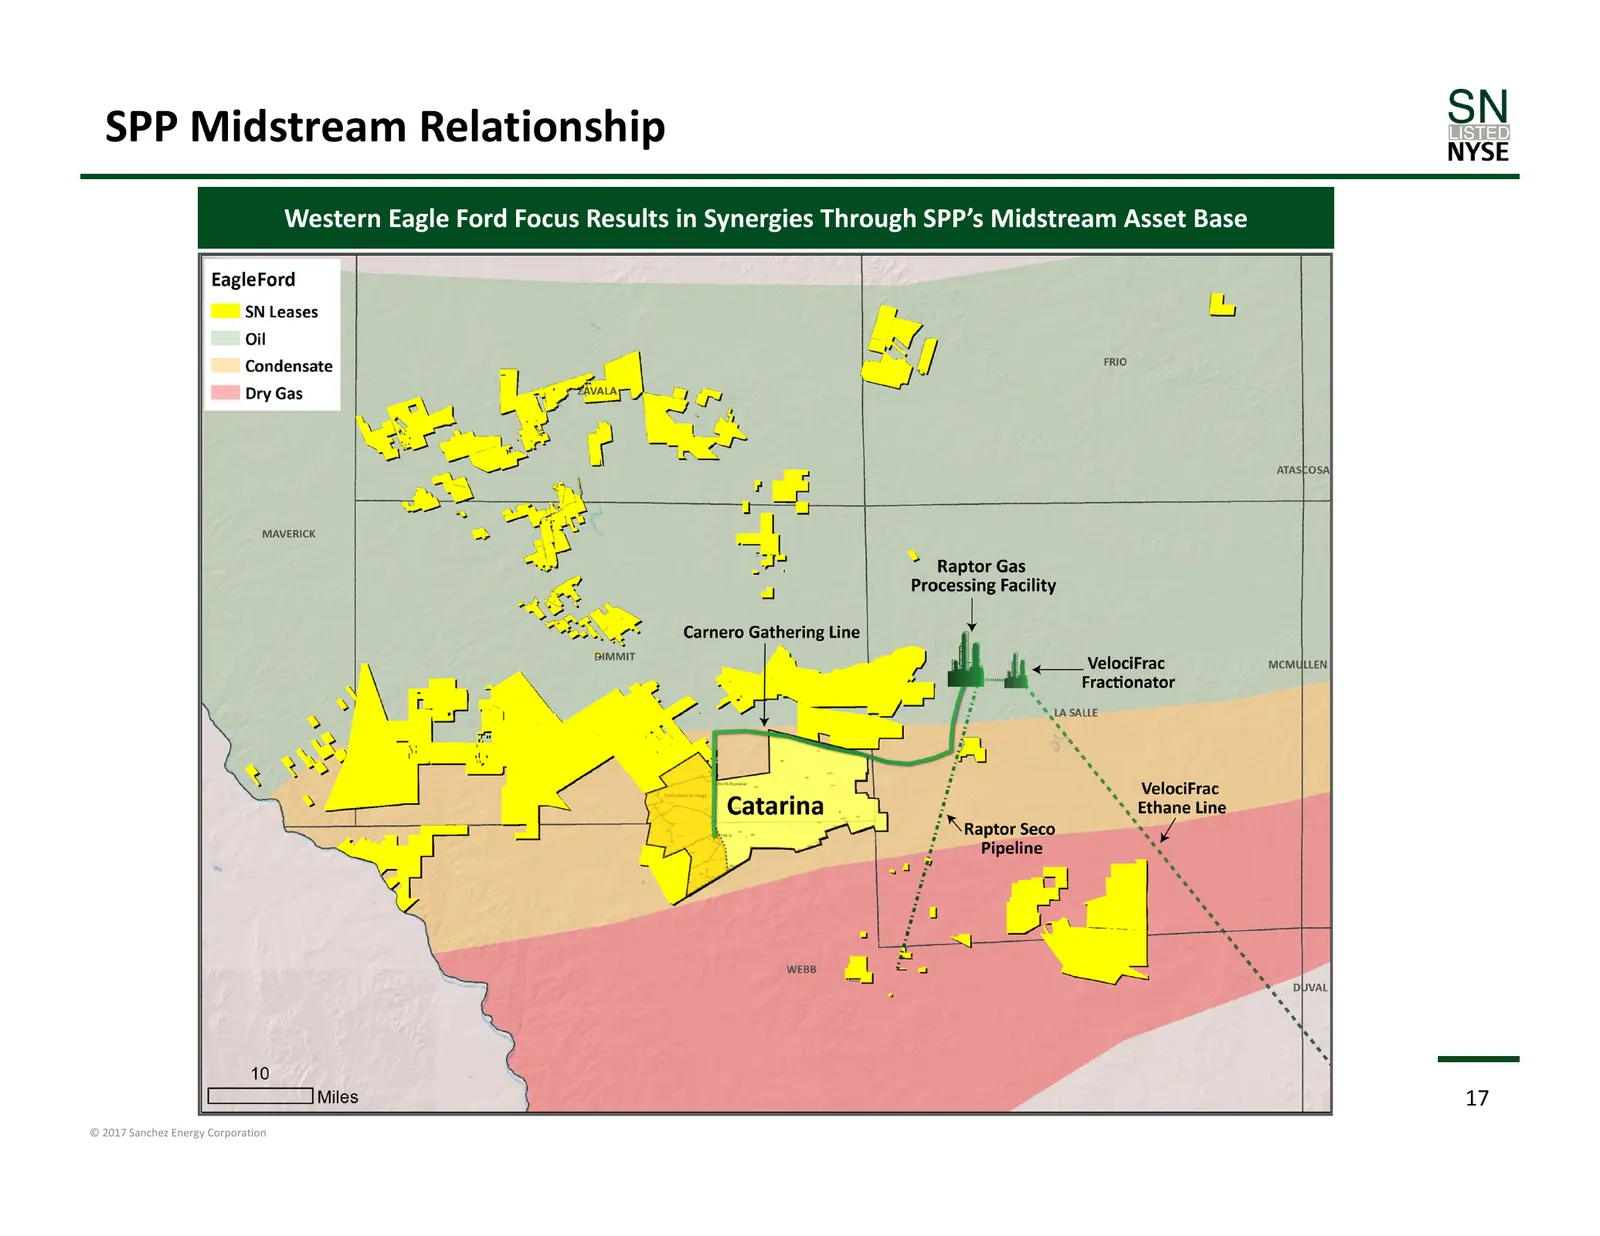
Slide 17: SPP Midstream Relationship
SPP Midstream Relationship Western Eagle Ford Focus Results in Synergies Through SPP’s Midstream Asset Base 17 © 2017 Sanchez Energy Corporation
Slide 18: Sanchez Energy: Summary Highlights
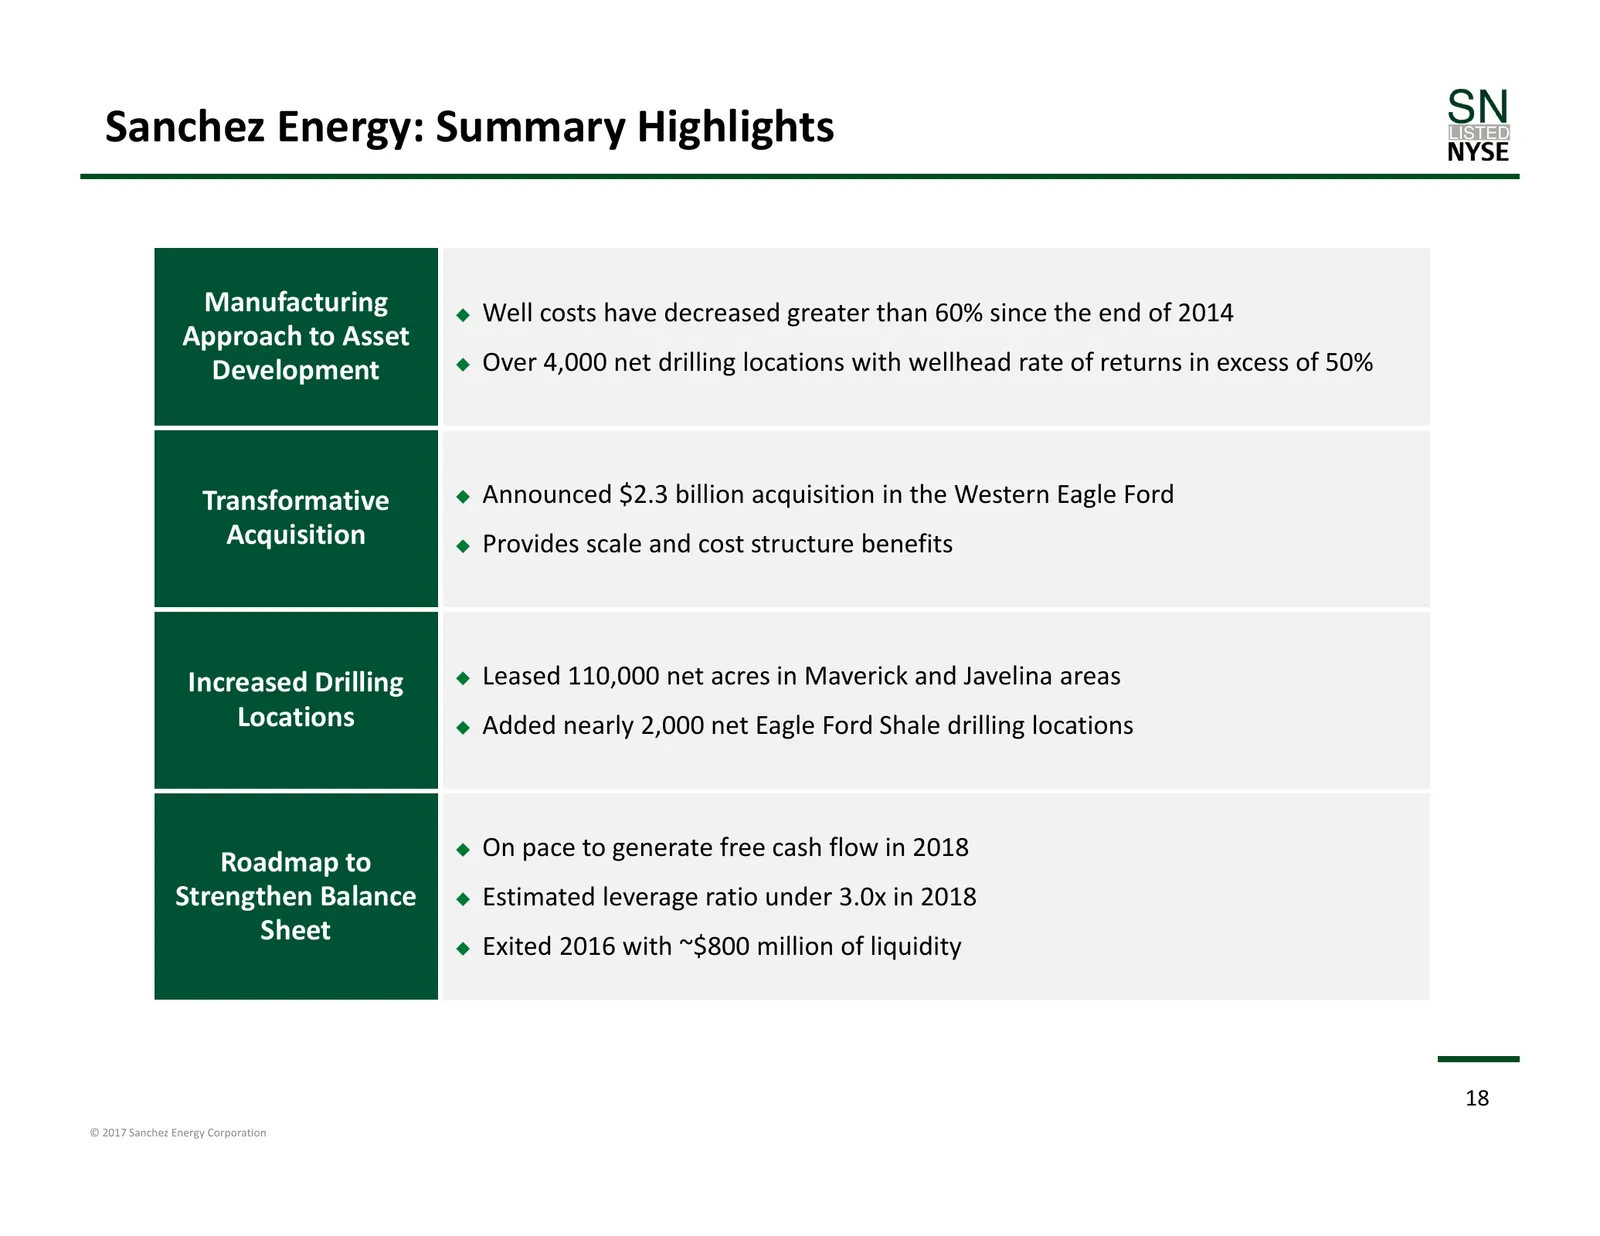
Sanchez Energy: Summary Highlights Manufacturing Well costs have decreased greater than 60% since the end of 2014 Approach to Asset Development Over 4,000 net drilling locations with wellhead rate of returns in excess of 50% Transformative Announced $2.3 billion acquisition in the Western Eagl
Slide 19: Production and Cash Flow Highlights
Production and Cash Flow Highlights 19 © 2017 Sanchez Energy Corporation
Slide 20: Sanchez Energy Positioned for Significant Growth
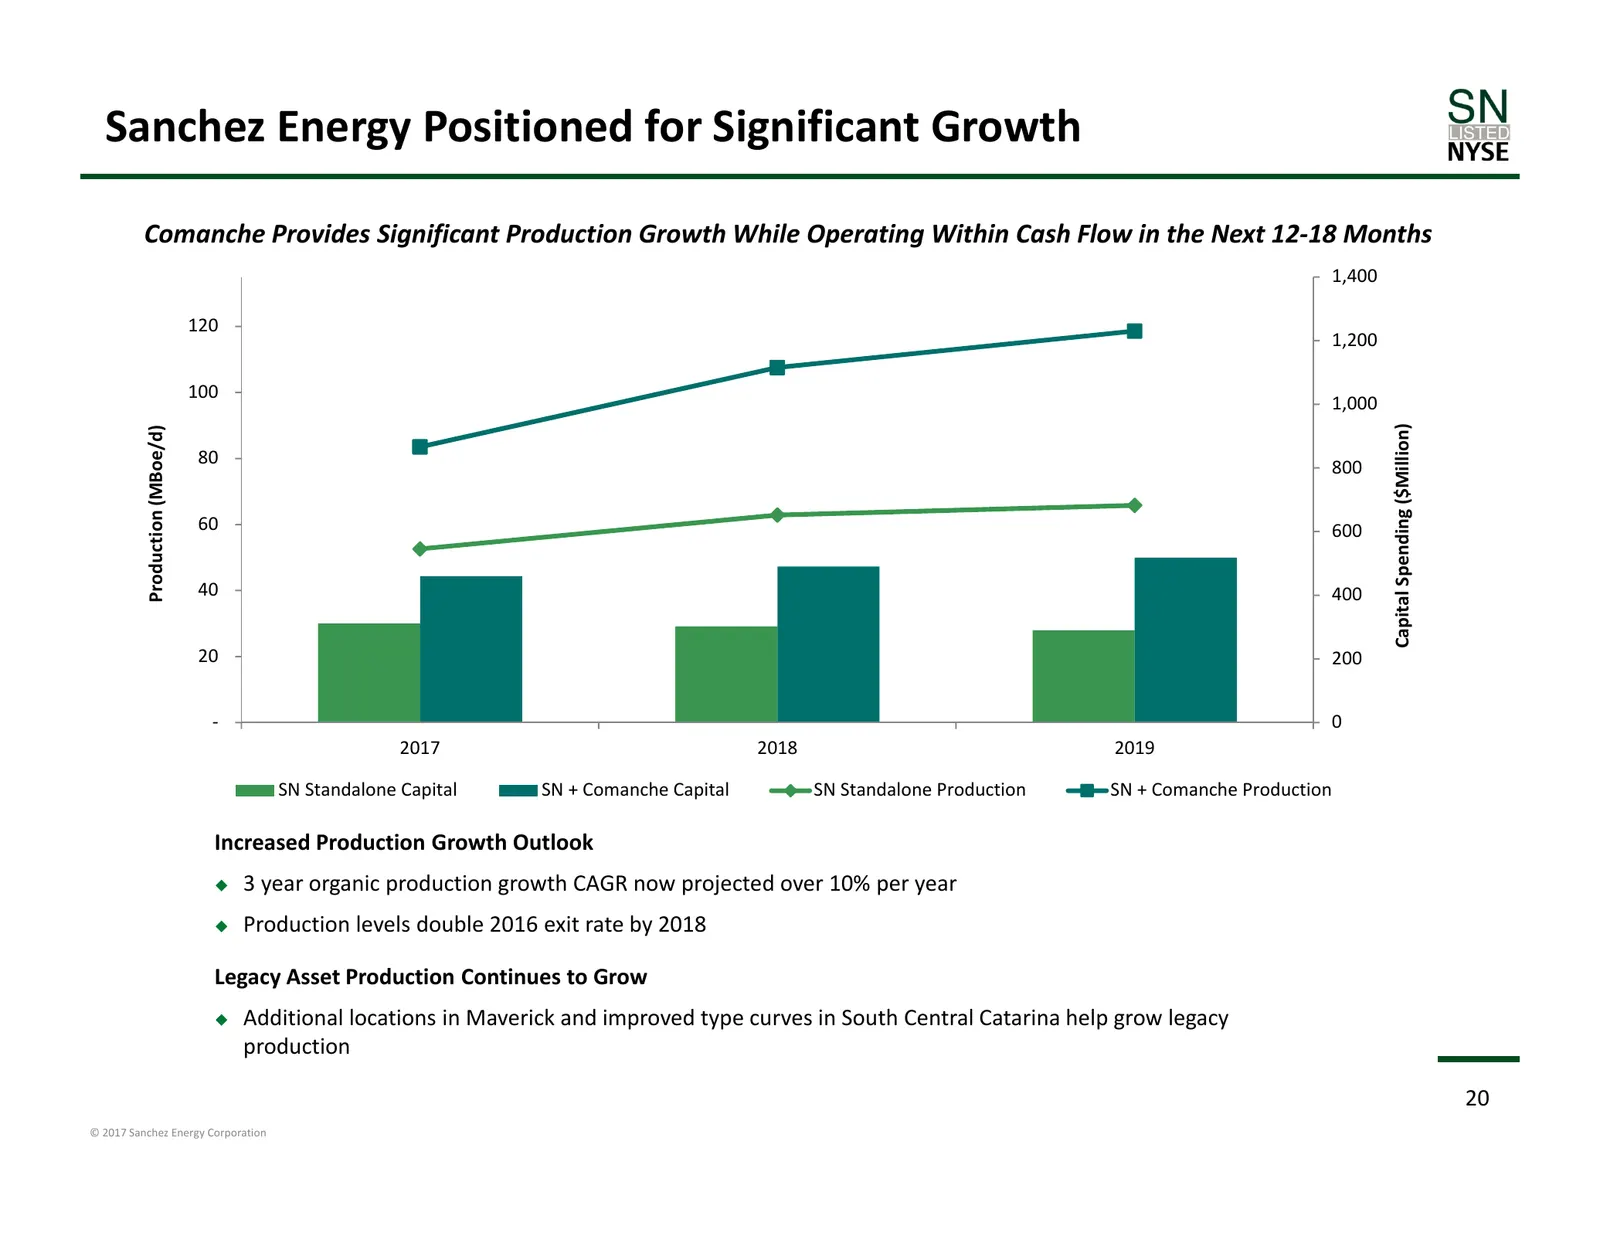
Sanchez Energy Positioned for Significant Growth Comanche Provides Significant Production Growth While Operating Within Cash Flow in the Next 12‐18 Months 1,400 120 1,200 100 1,000 Capital Spending ($Million) Production (MBoe/d) 80 800 60 600 40 400 20 200 ‐ 0 2017 2018 2019 SN Standalone Capital SN
Slide 21: 2017 Capital Guidance
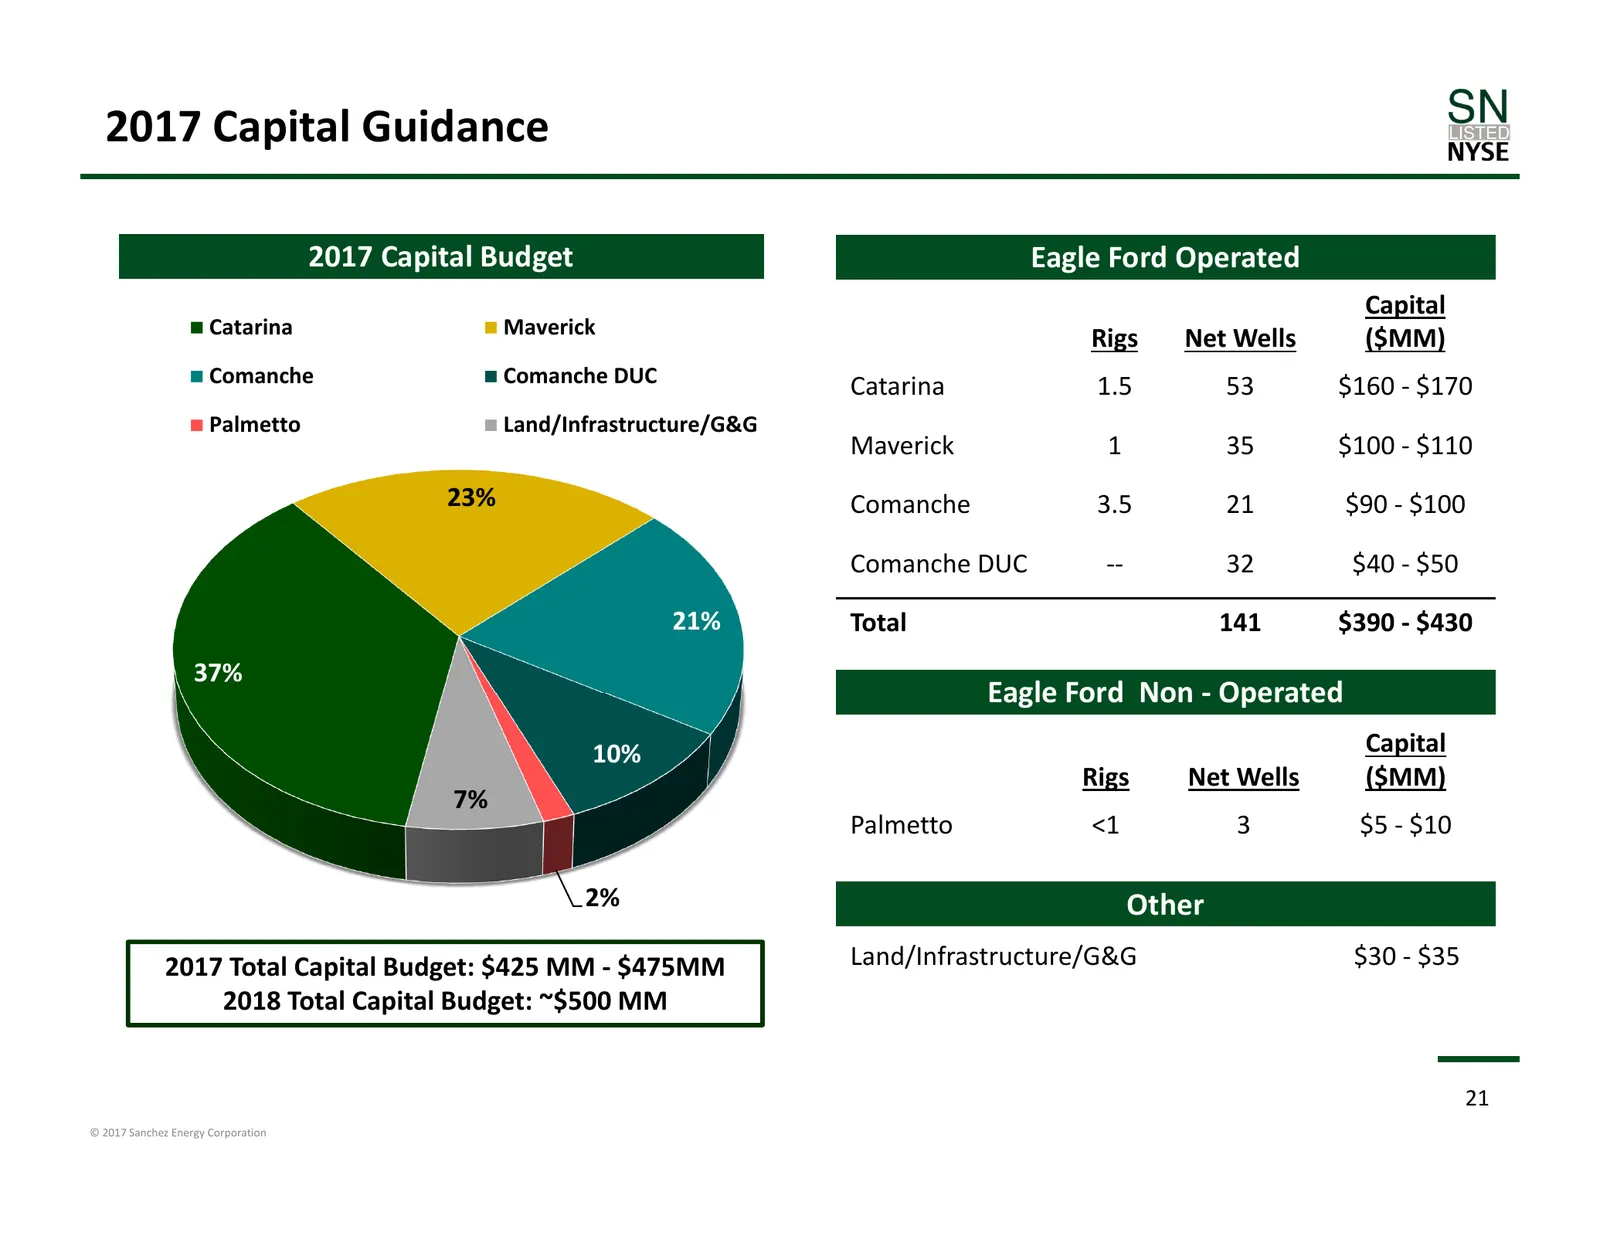
2017 Capital Guidance 2017 Capital Budget Eagle Ford Operated Capital Catarina Maverick Rigs Net Wells ($MM) Comanche Comanche DUC Catarina 1.5 53 $160 ‐ $170 Palmetto Land/Infrastructure/G&G Maverick 1 35 $100 ‐ $110 23% Comanche 3.5 21 $90 ‐ $100 Comanche DUC ‐‐ 32 $40 ‐ $50 21% Total 141 $390 ‐ $
Slide 22: Asset Base Expected to Yield Sustainable Cash Flow Growth
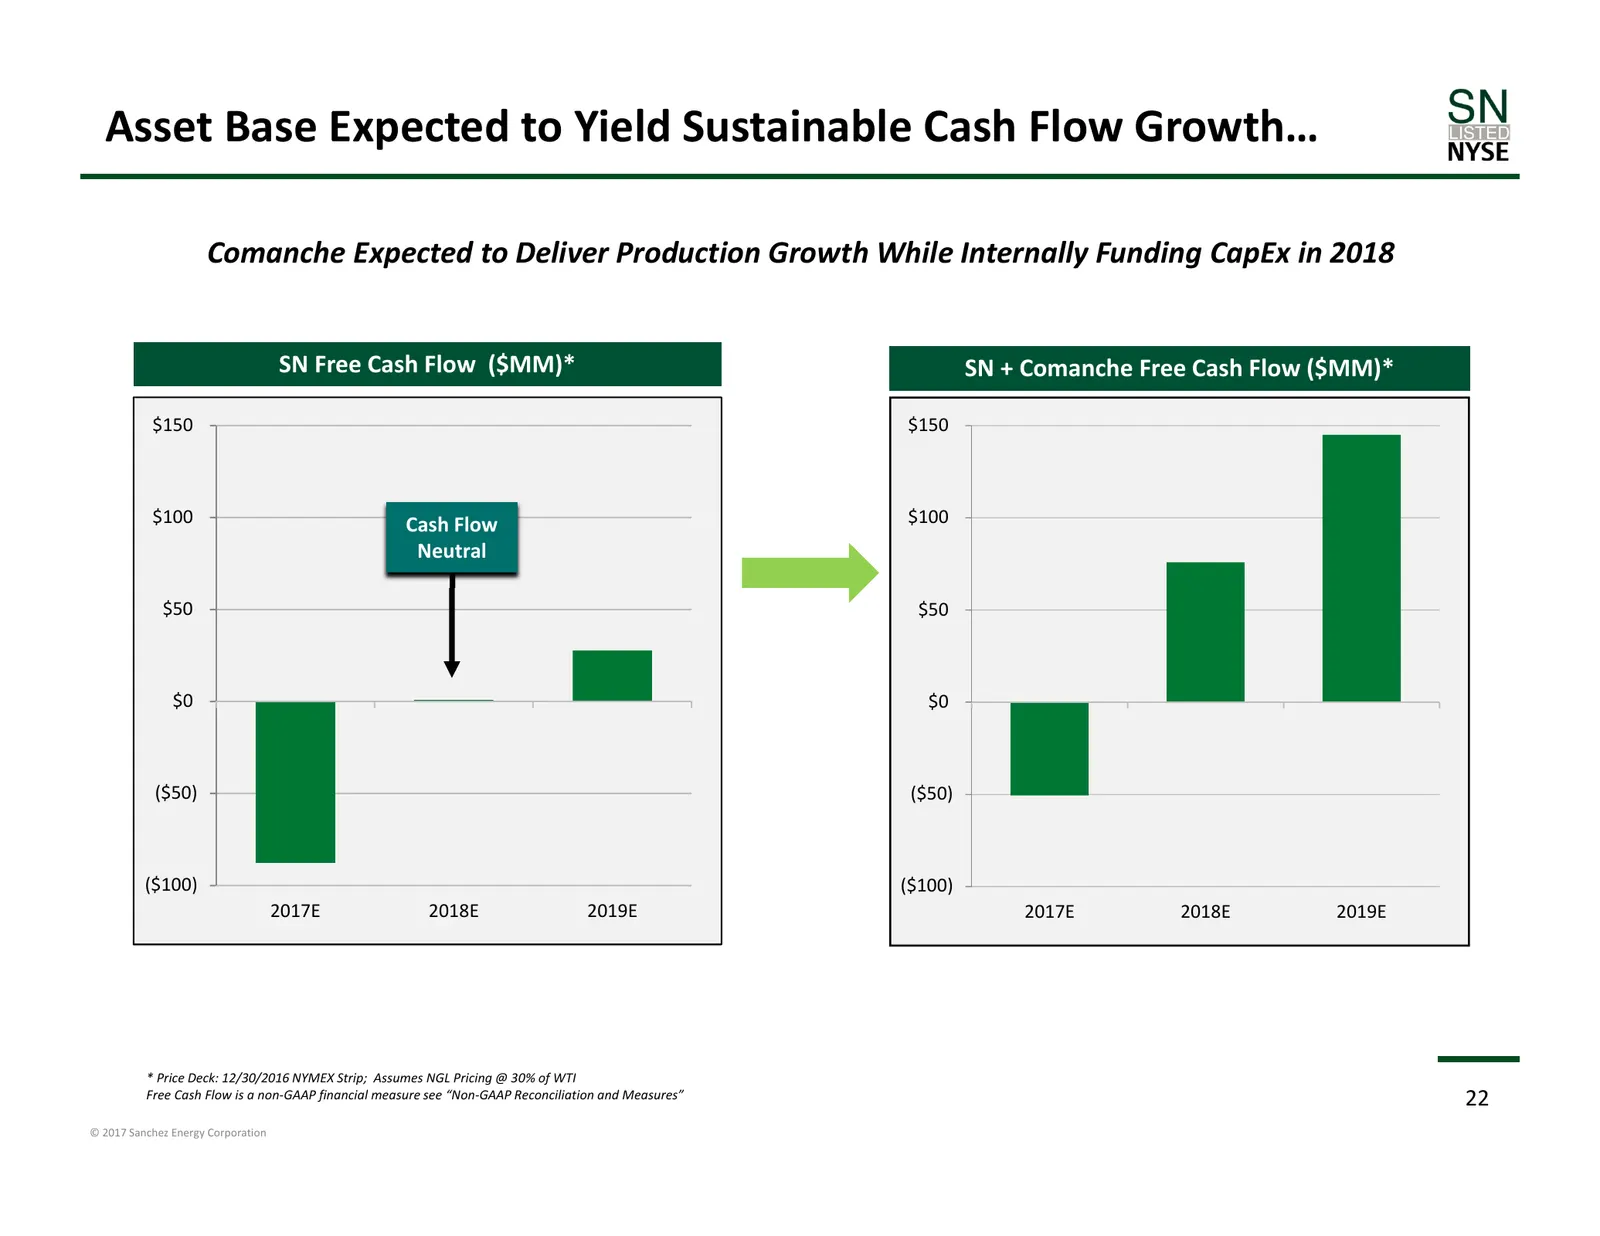
Asset Base Expected to Yield Sustainable Cash Flow Growth… Comanche Expected to Deliver Production Growth While Internally Funding CapEx in 2018 SN Free Cash Flow ($MM)* SN + Comanche Free Cash Flow ($MM)* $150 $150 $100 Cash Flow $100 Neutral $50 $50 $0 $0 ($50) ($50) ($100) ($100) 2017E 2018E 2019
Slide 23: And Strengthens the Balance Sheet
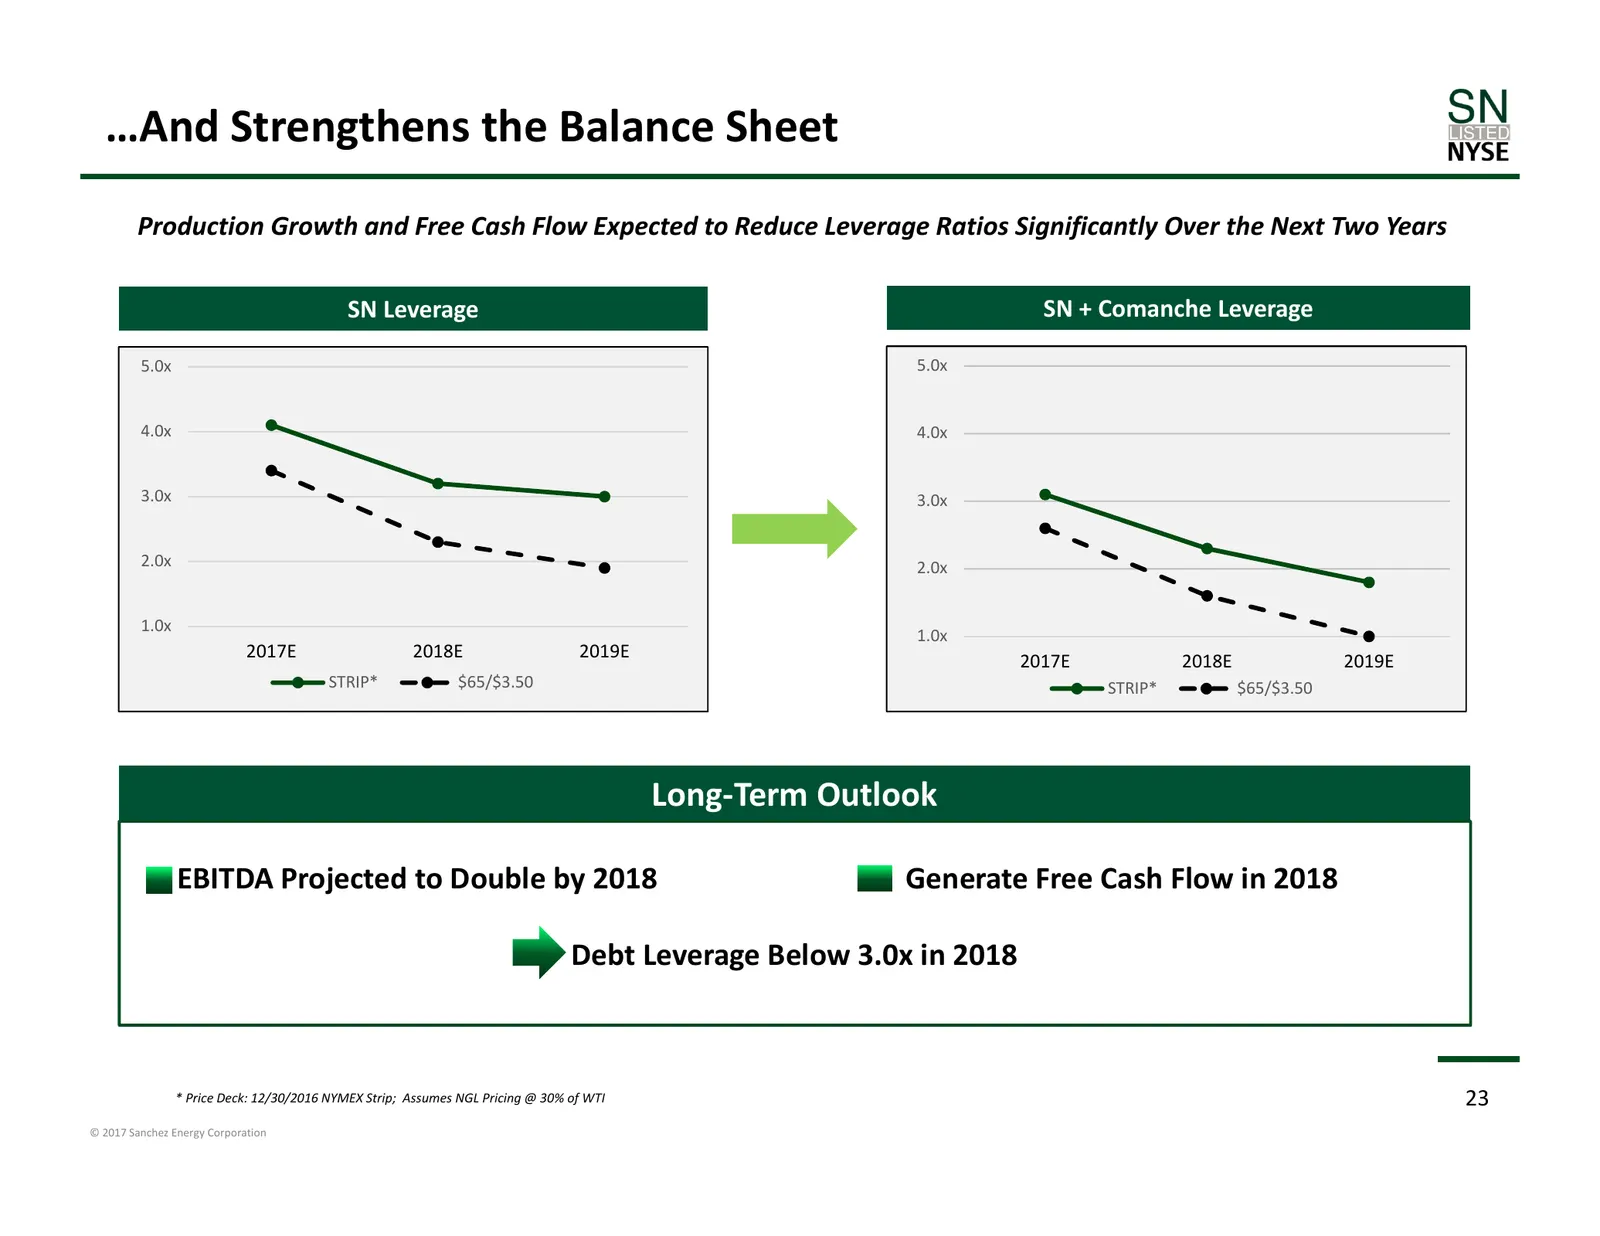
…And Strengthens the Balance Sheet Production Growth and Free Cash Flow Expected to Reduce Leverage Ratios Significantly Over the Next Two Years SN Leverage SN + Comanche Leverage 5.0x 5.0x 4.0x 4.0x 3.0x 3.0x 2.0x 2.0x 1.0x 1.0x 2017E 2018E 2019E 2017E 2018E 2019E STRIP* $65/$3.50 STRIP* $65/$3.50
Slide 24: Sanchez Energy: Competitive Advantages
Sanchez Energy: Competitive Advantages 1. Multi‐Bench Development 2. Sustainable Cost Structure Competitive Advantages Asset Detail Financial Strategy 24 © 2017 Sanchez Energy Corporation
Slide 25: 1. Multi-Bench Development
1. Multi‐Bench Development 25 © 2017 Sanchez Energy Corporation
Slide 26: Western Eagle Ford Supports Multi-Bench Development
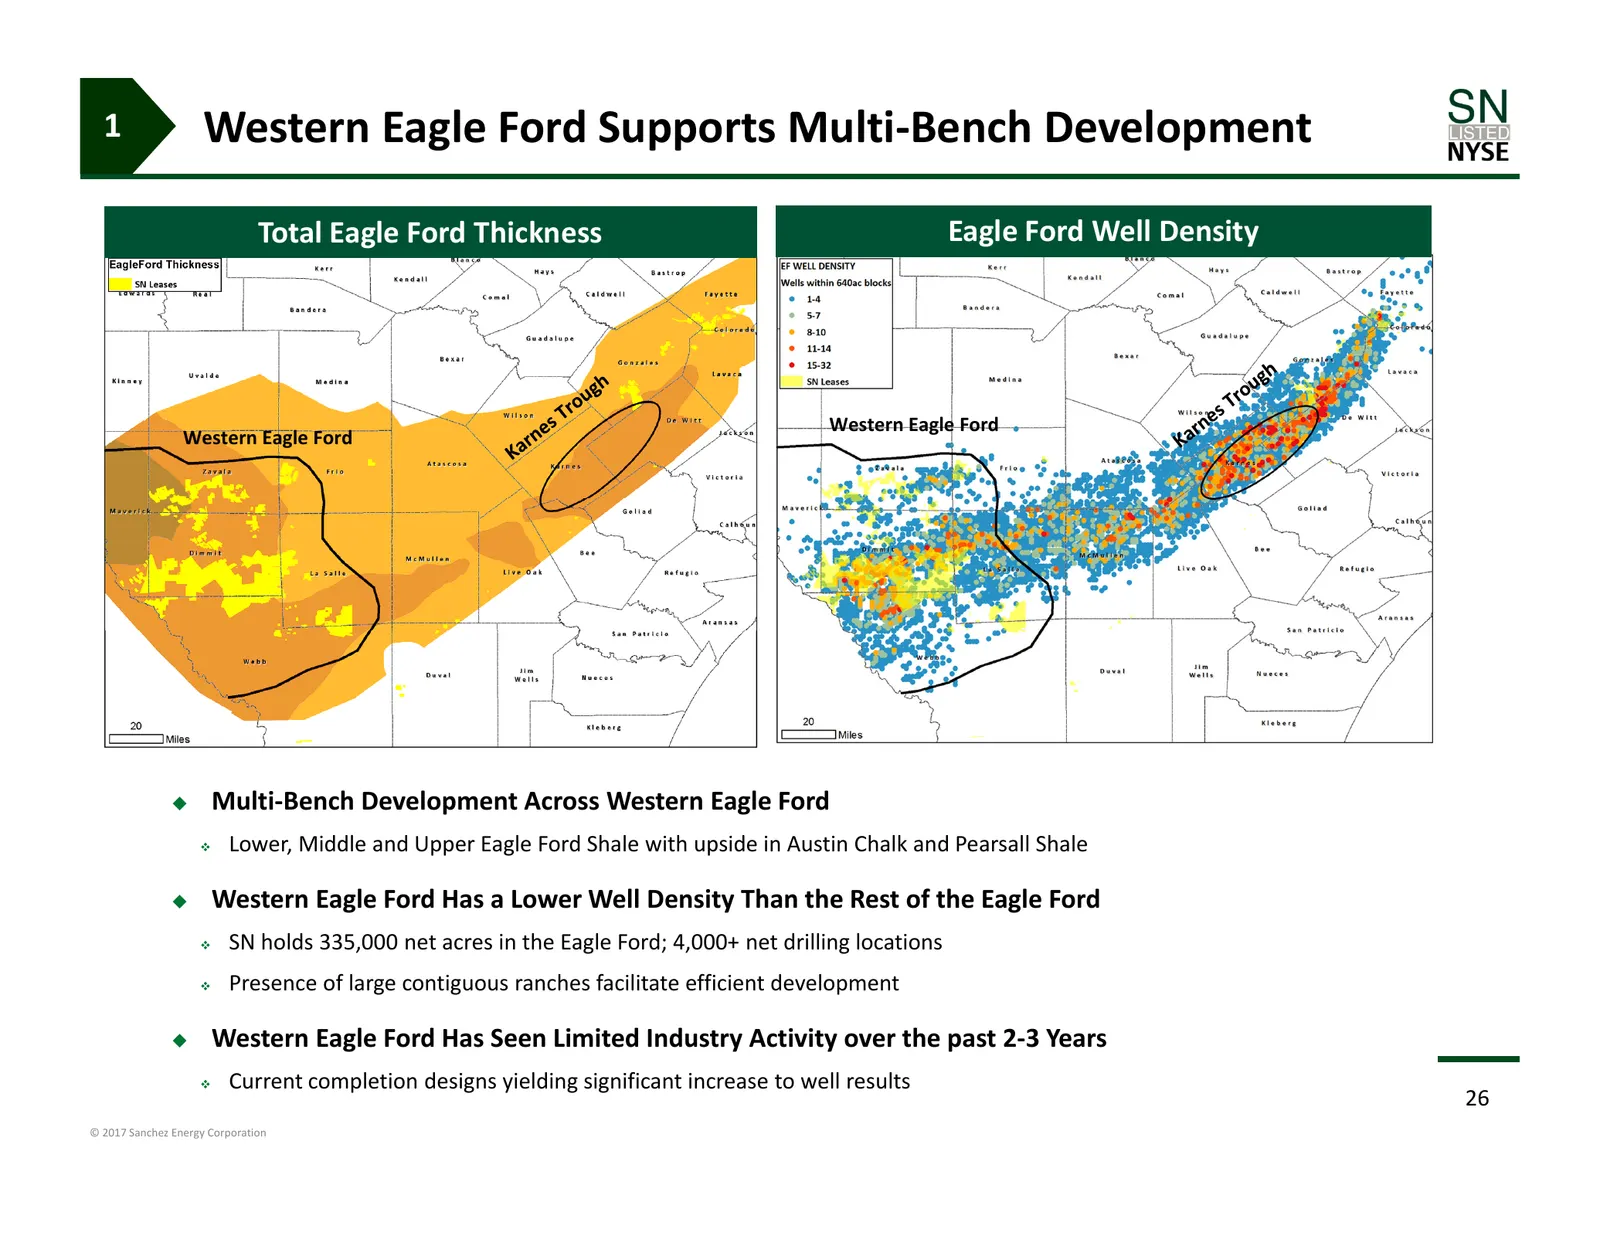
1 Western Eagle Ford Supports Multi‐Bench Development Total Eagle Ford Thickness Eagle Ford Well Density Western Eagle Ford Western Eagle Ford Multi‐Bench Development Across Western Eagle Ford Lower, Middle and Upper Eagle Ford Shale with upside in Austin Chalk and Pearsall Shale Western Eagle
Slide 27: Targeting Strategy in the Western Eagle Ford
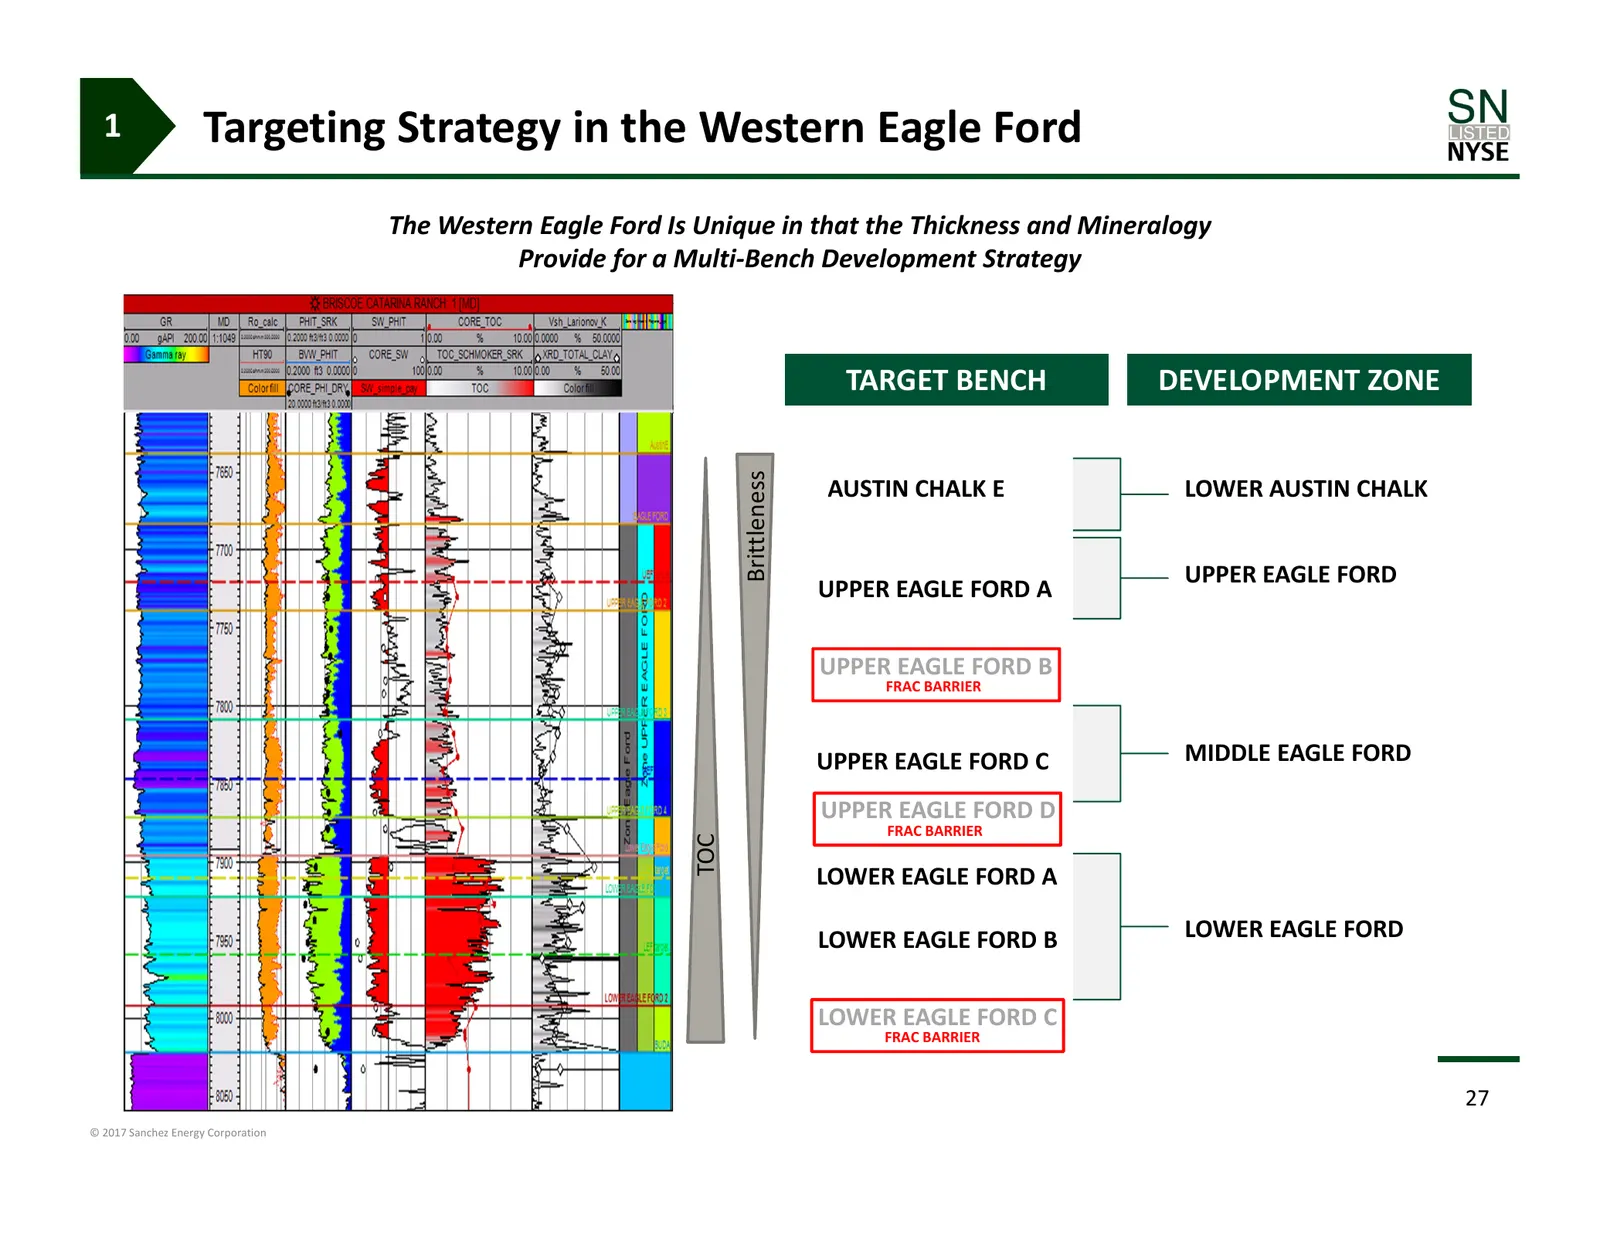
1 Targeting Strategy in the Western Eagle Ford The Western Eagle Ford Is Unique in that the Thickness and Mineralogy Provide for a Multi‐Bench Development Strategy TARGET BENCH DEVELOPMENT ZONE Brittleness AUSTIN CHALK E LOWER AUSTIN CHALK UPPER EAGLE FORD UPPER EAGLE FORD A UPPER EAGLE FORD B FRAC
Slide 28: Current Extent of Multi-Bench Development
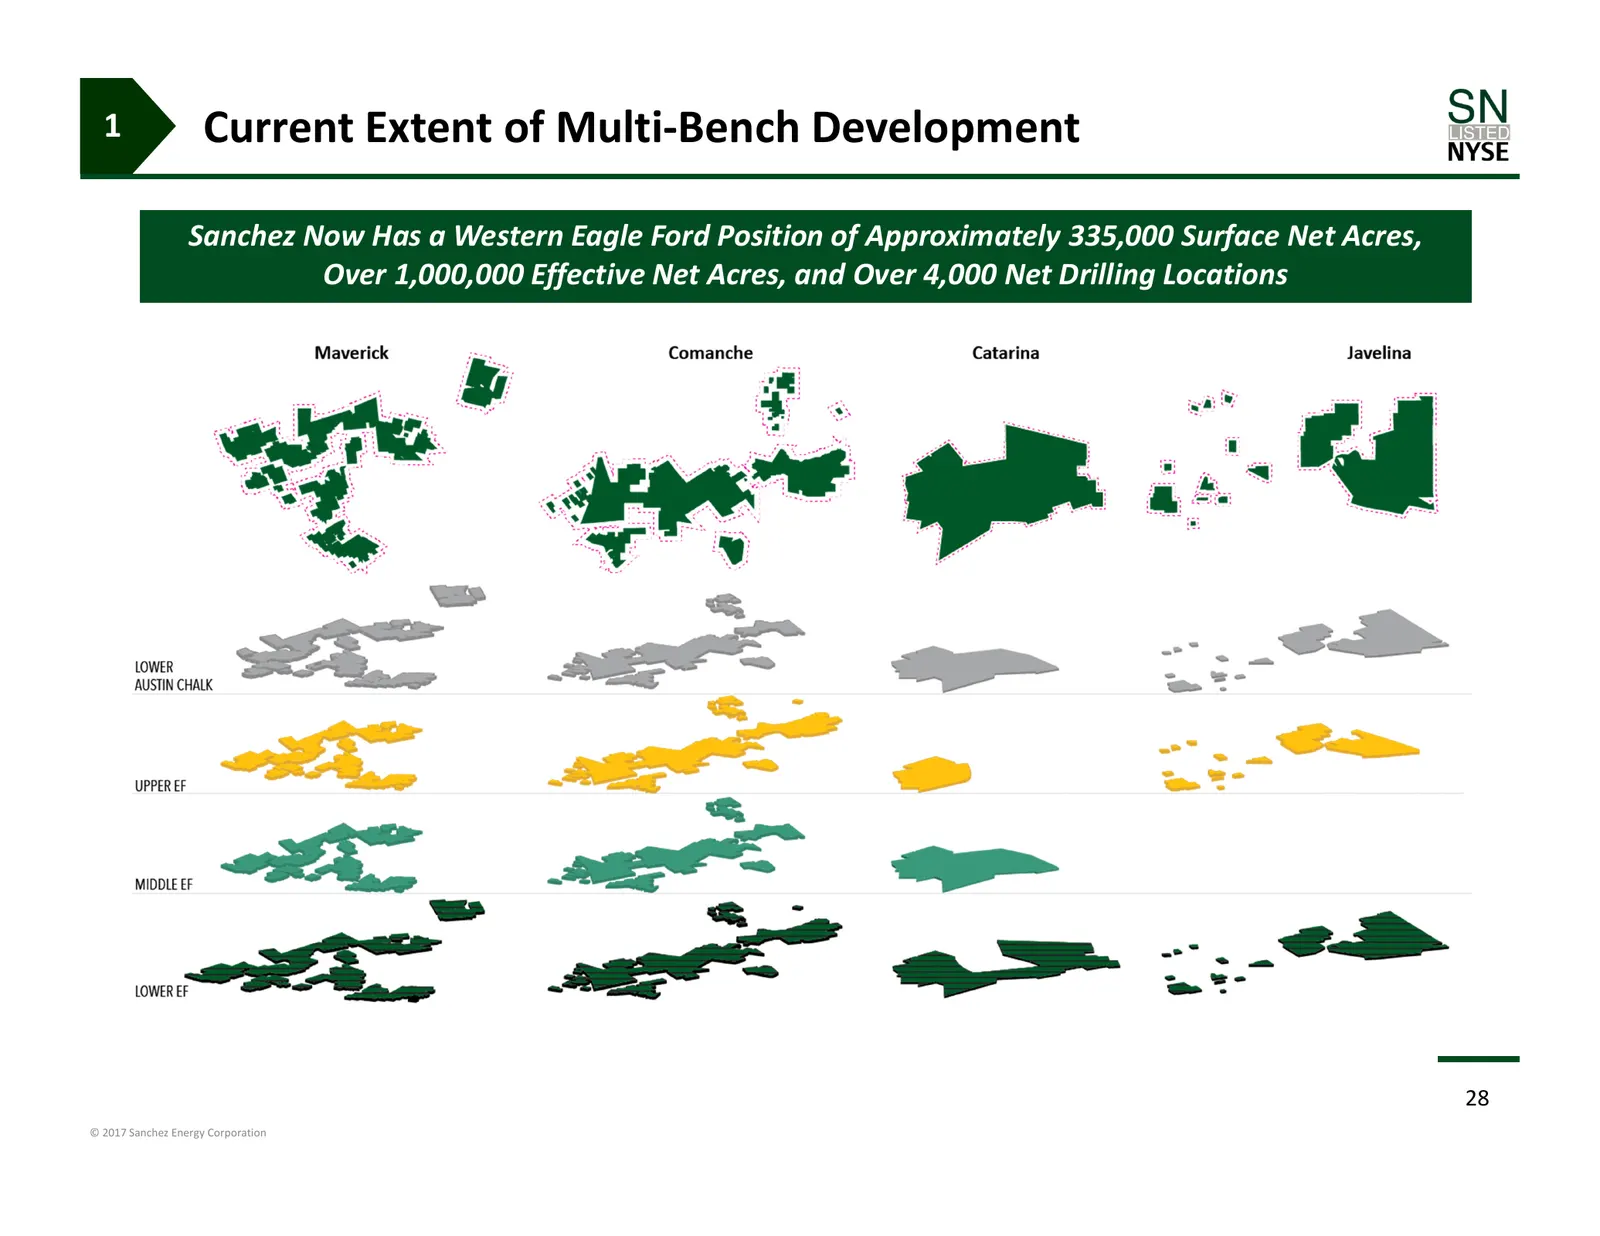
1 Current Extent of Multi‐Bench Development Sanchez Now Has a Western Eagle Ford Position of Approximately 335,000 Surface Net Acres, Over 1,000,000 Effective Net Acres, and Over 4,000 Net Drilling Locations 28 © 2017 Sanchez Energy Corporation
Slide 29: Sanchez is a Leader in Existing Multi-Bench Development
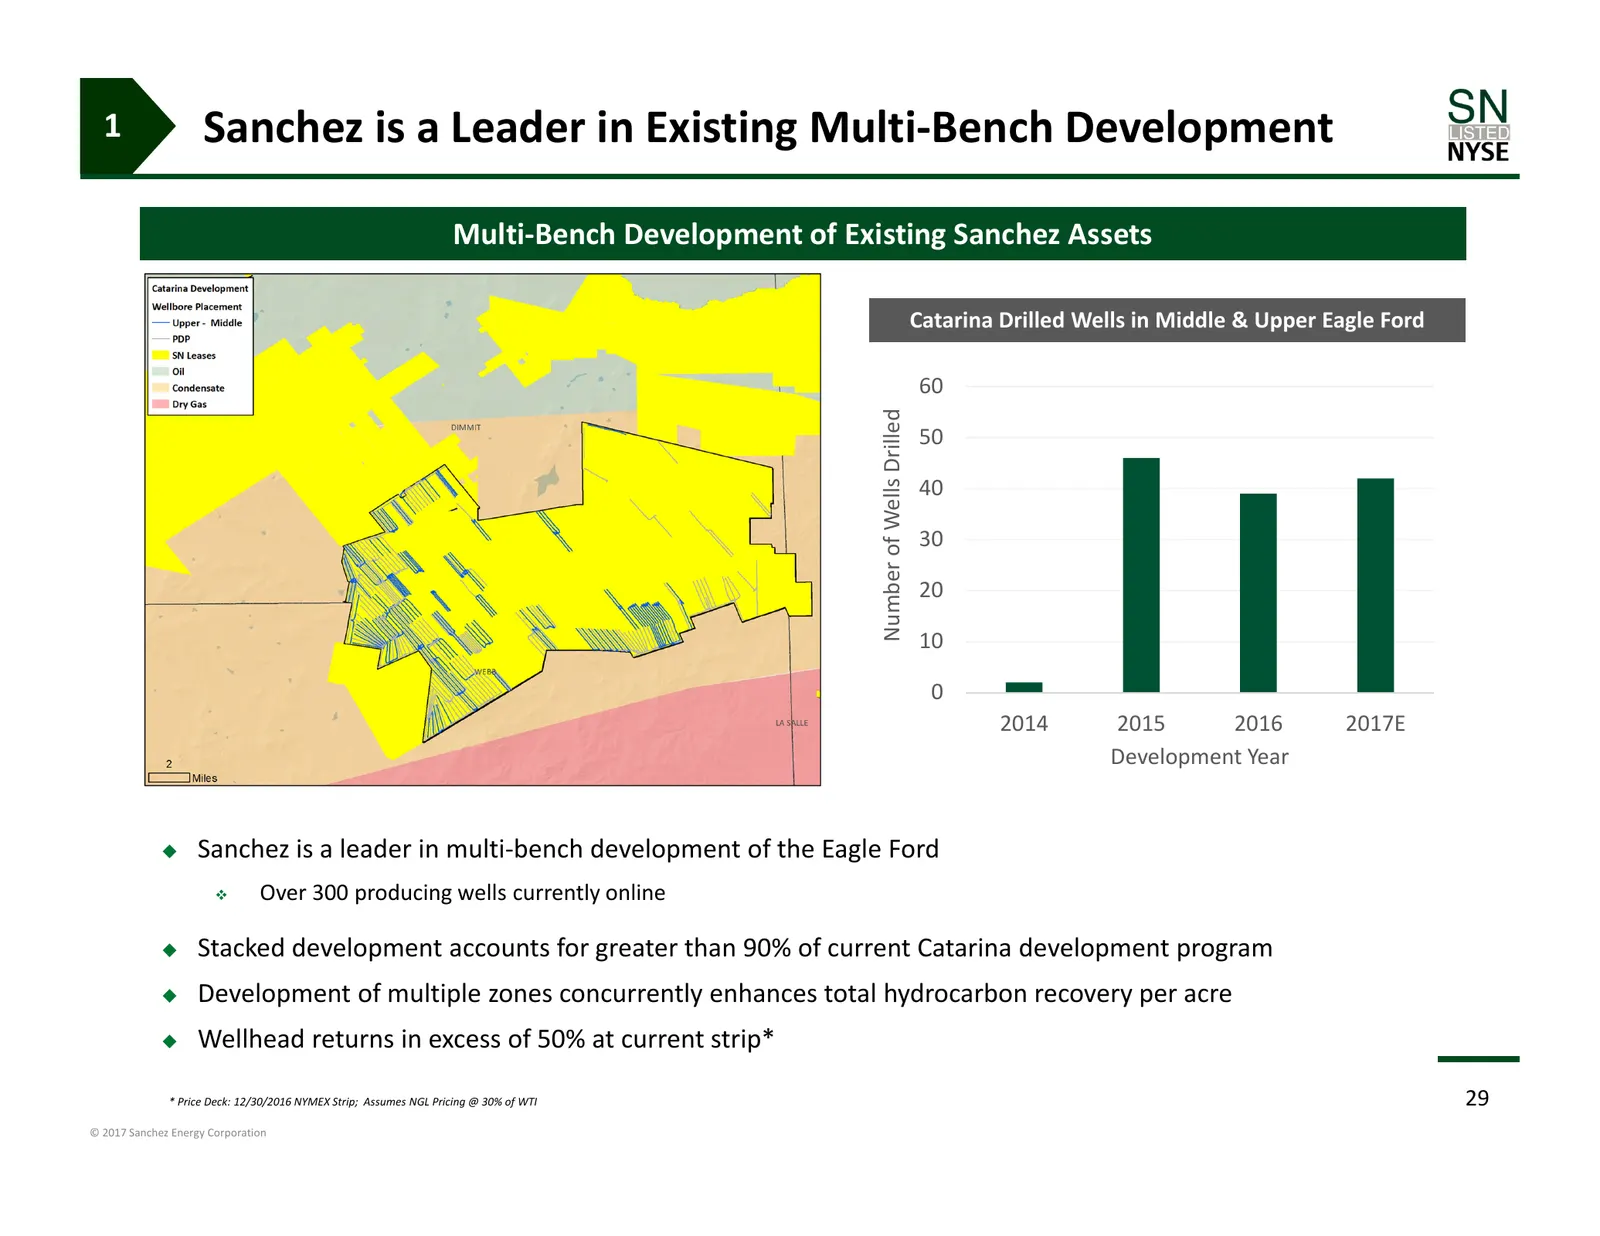
1 Sanchez is a Leader in Existing Multi‐Bench Development Multi‐Bench Development of Existing Sanchez Assets Catarina Drilled Wells in Middle & Upper Eagle Ford 60 Number of Wells Drilled 50 40 30 20 10 0 2014 2015 2016 2017E Development Year Sanchez is a leader in multi‐bench development of the E
Slide 30: Regional Extension of Stacked Targeting
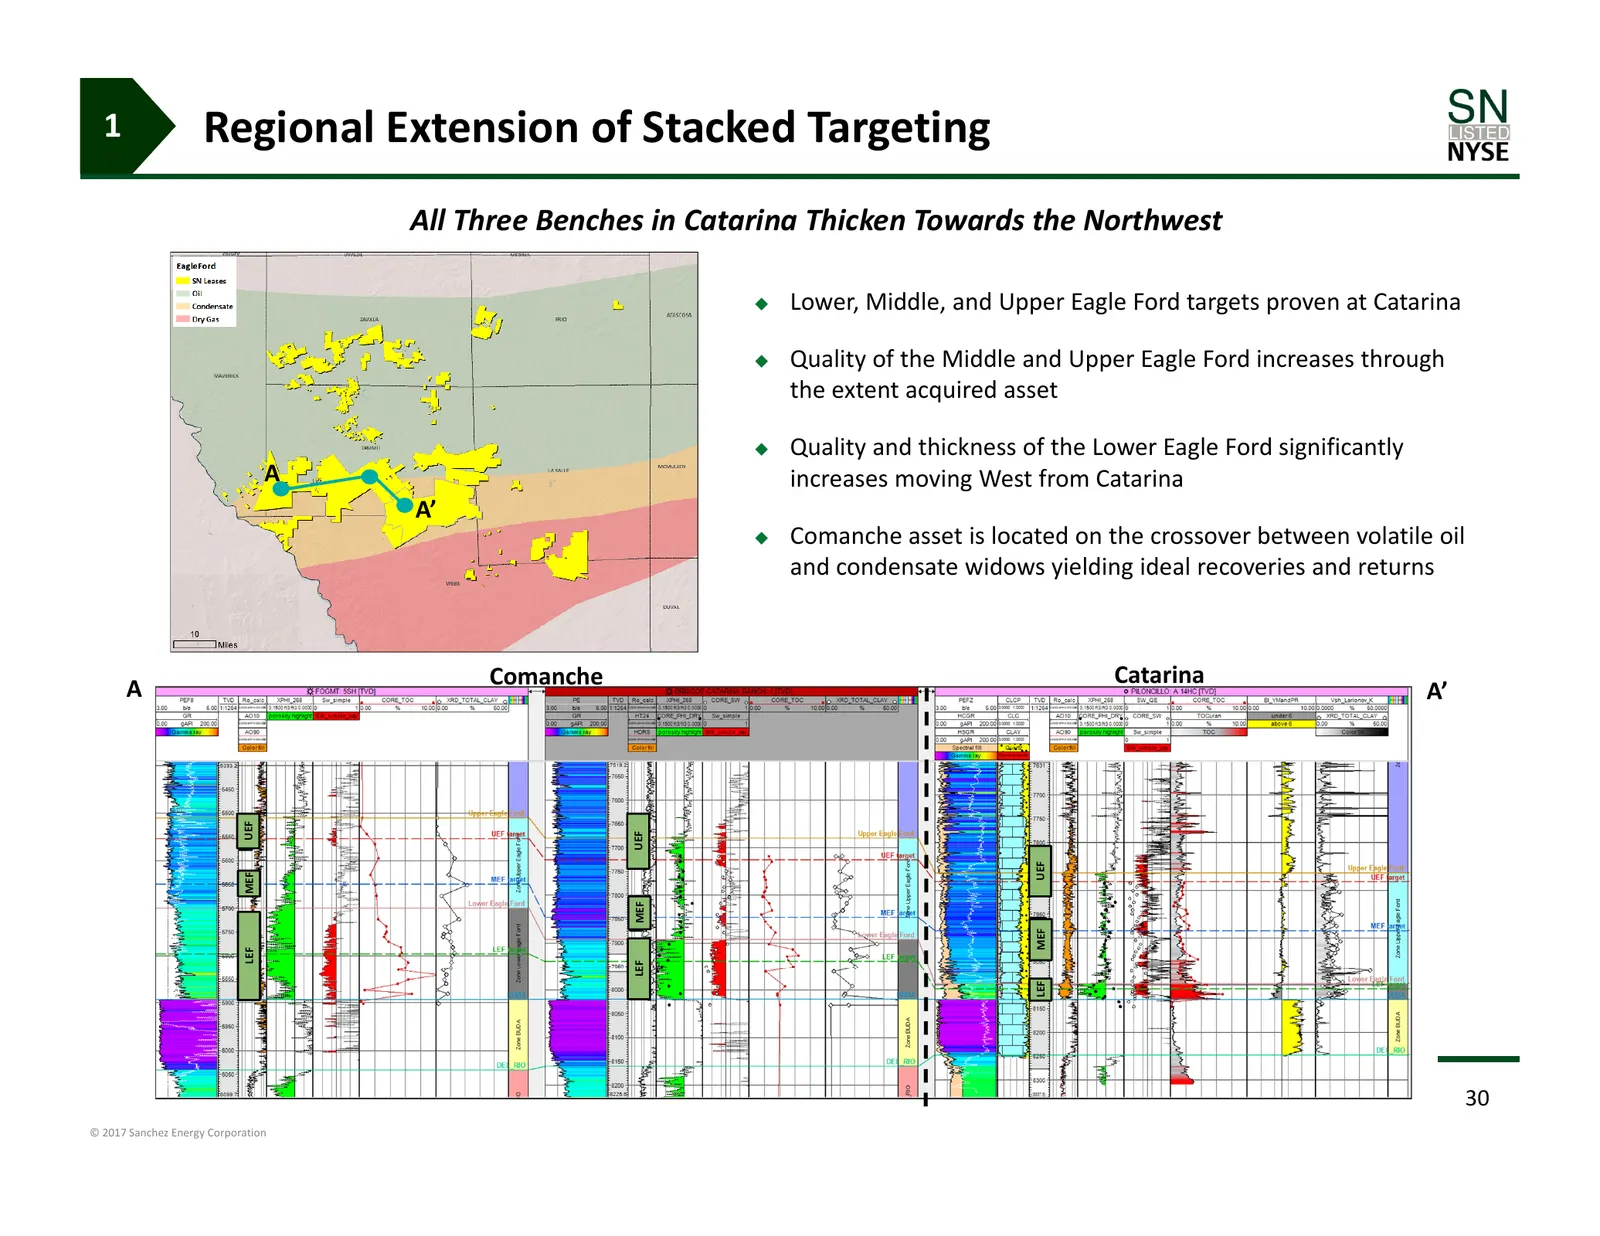
1 Regional Extension of Stacked Targeting All Three Benches in Catarina Thicken Towards the Northwest Lower, Middle, and Upper Eagle Ford targets proven at Catarina Quality of the Middle and Upper Eagle Ford increases through the extent acquired asset Quality and thickness of the Lower Eagle F
Slide 31: Drilling Inventory – Breakeven Analysis
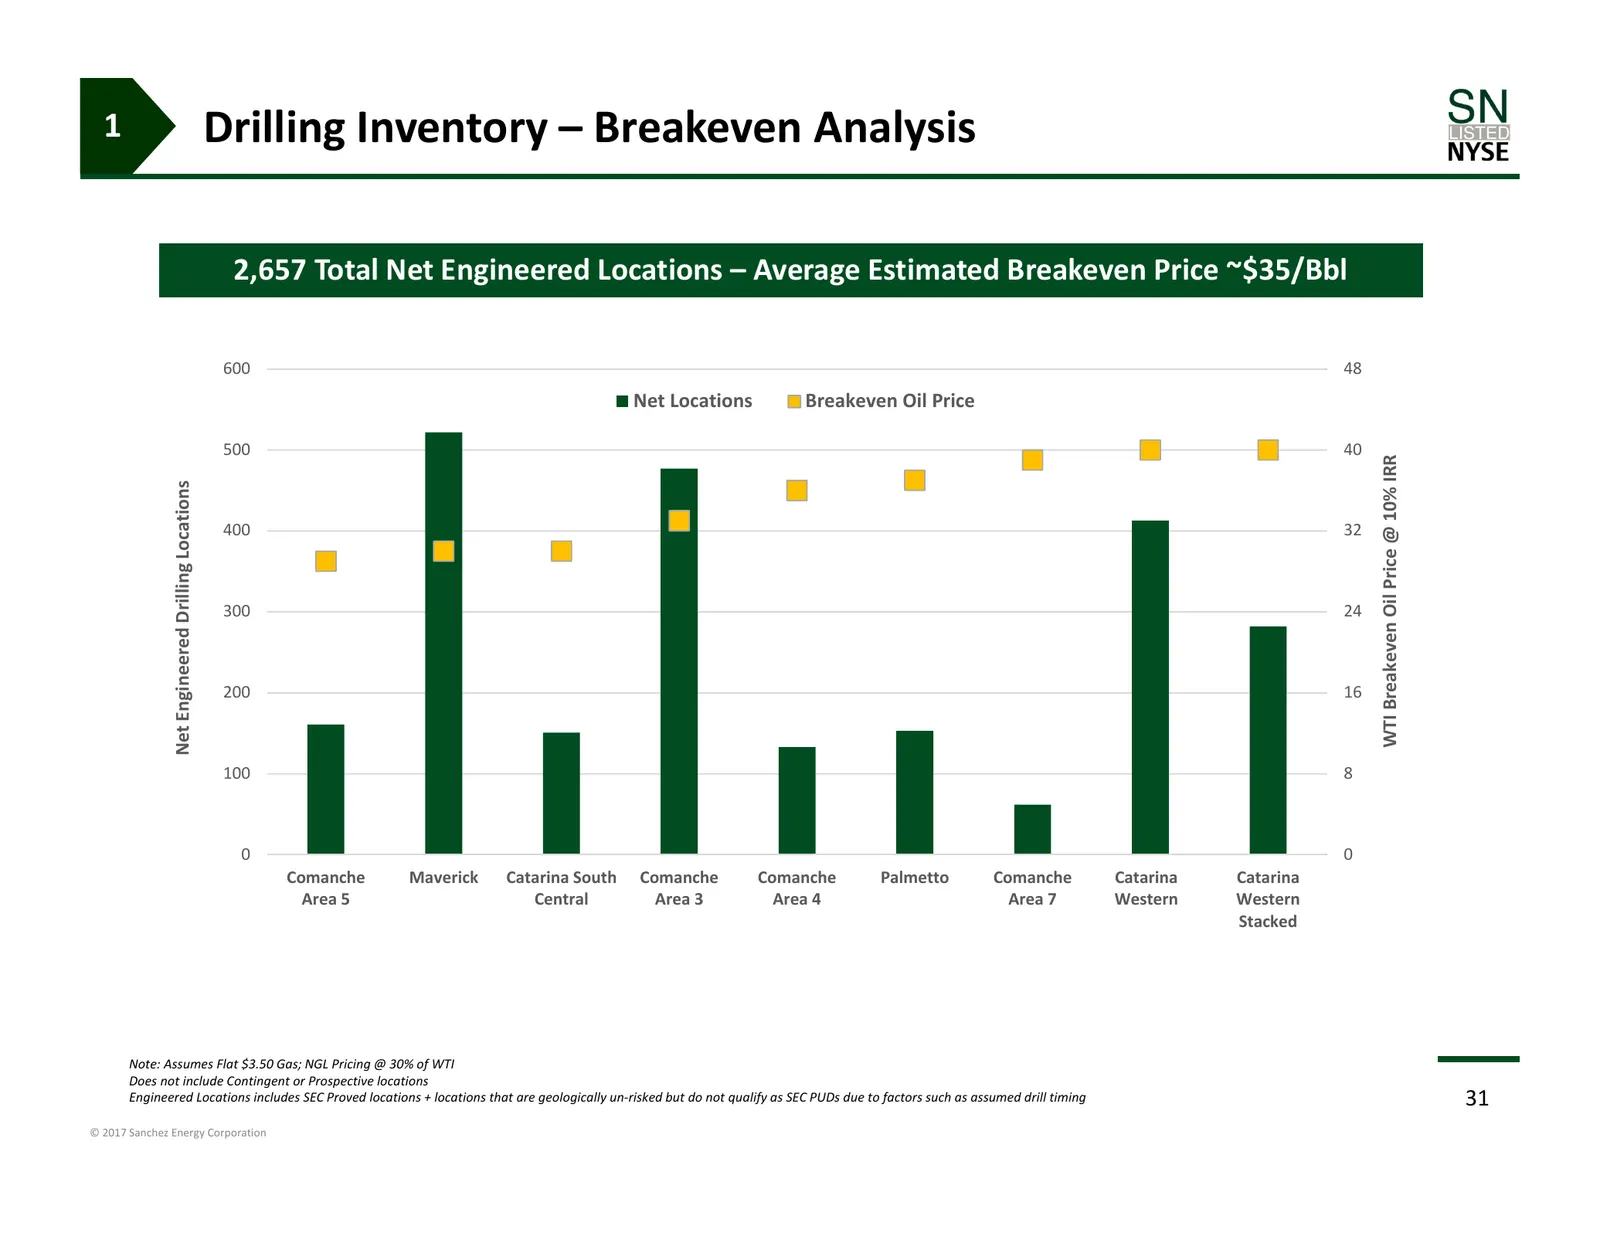
1 Drilling Inventory – Breakeven Analysis 2,657 Total Net Engineered Locations – Average Estimated Breakeven Price ~$35/Bbl 600 48 Net Locations Breakeven Oil Price 500 40 WTI Breakeven Oil Price @ 10% IRR Net Engineered Drilling Locations 400 32 300 24 200 16 100 8 0 0 Comanche Maverick Catarina So
Slide 32: 2. Sustainable Cost Structure
2. Sustainable Cost Structure 32 © 2017 Sanchez Energy Corporation
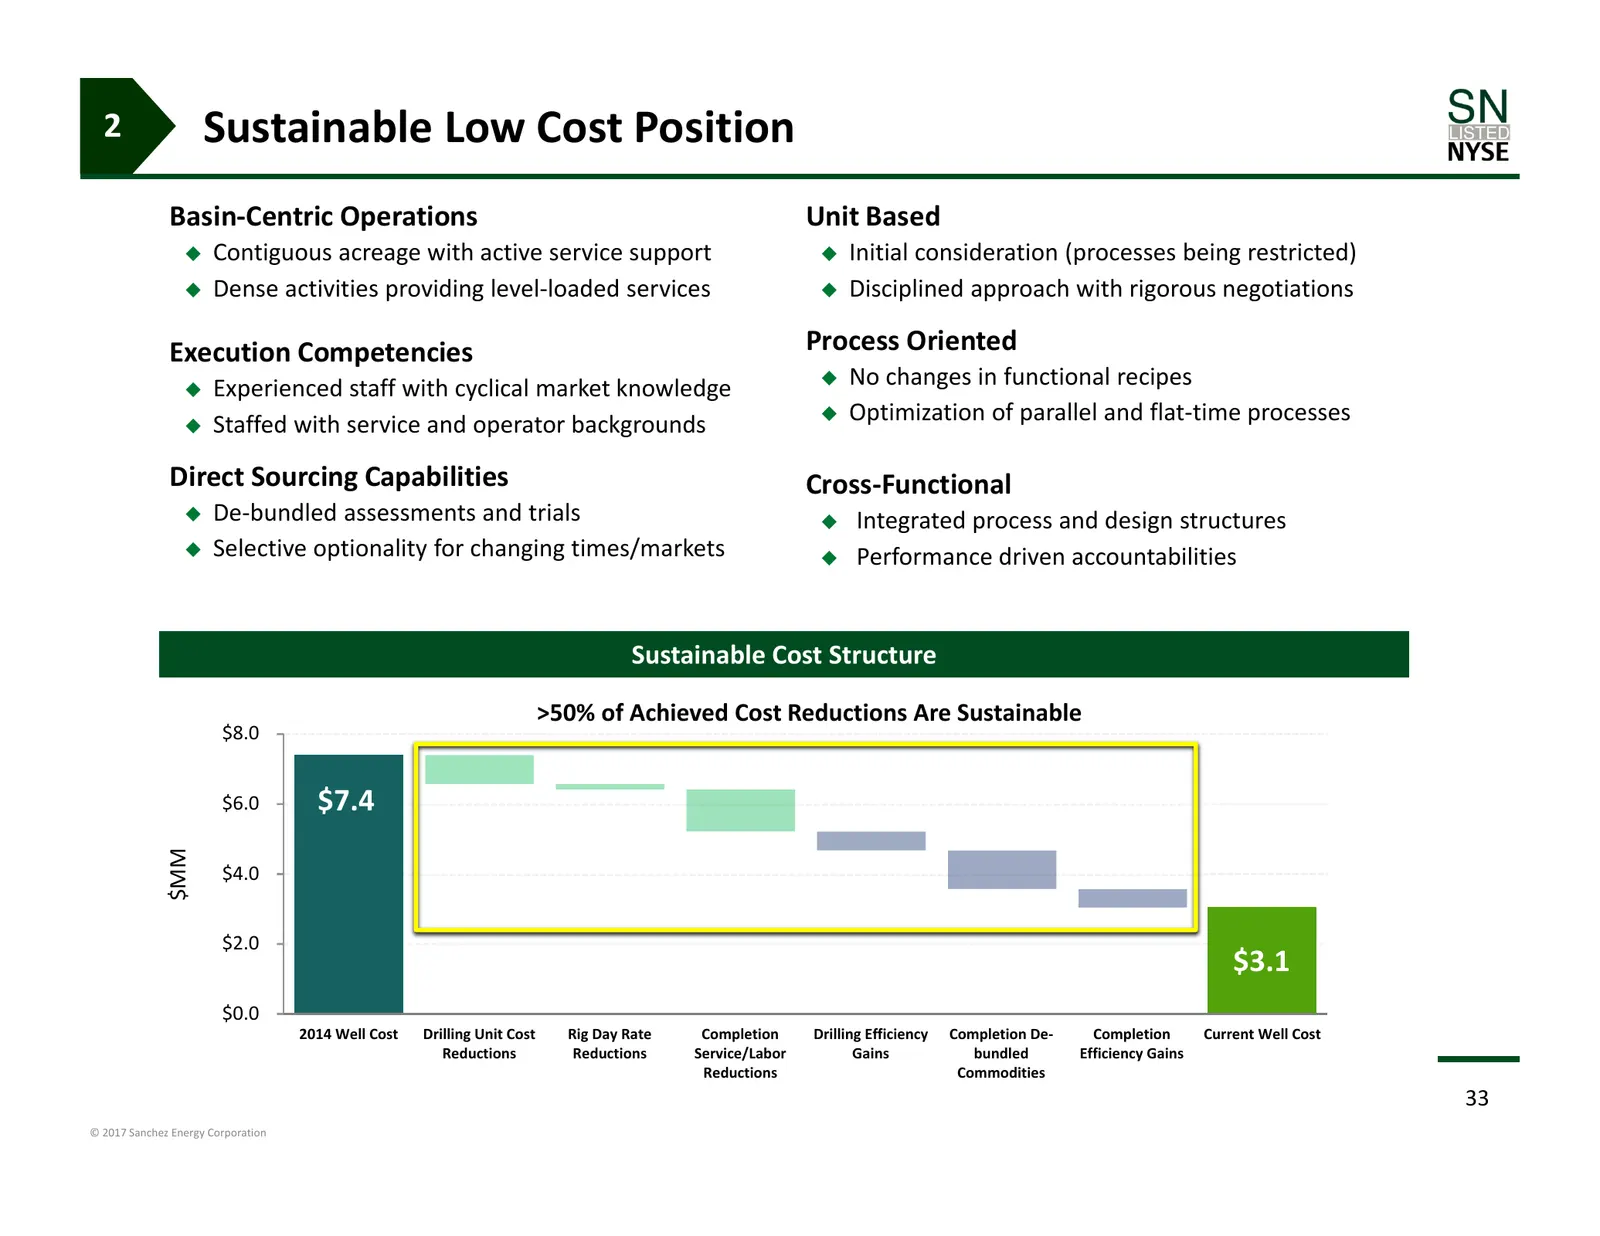
Slide 33: Sustainable Low Cost Position
2 Sustainable Low Cost Position Basin‐Centric Operations Unit Based Contiguous acreage with active service support Initial consideration (processes being restricted) Dense activities providing level‐loaded services Disciplined approach with rigorous negotiations Execution Competencies Proces
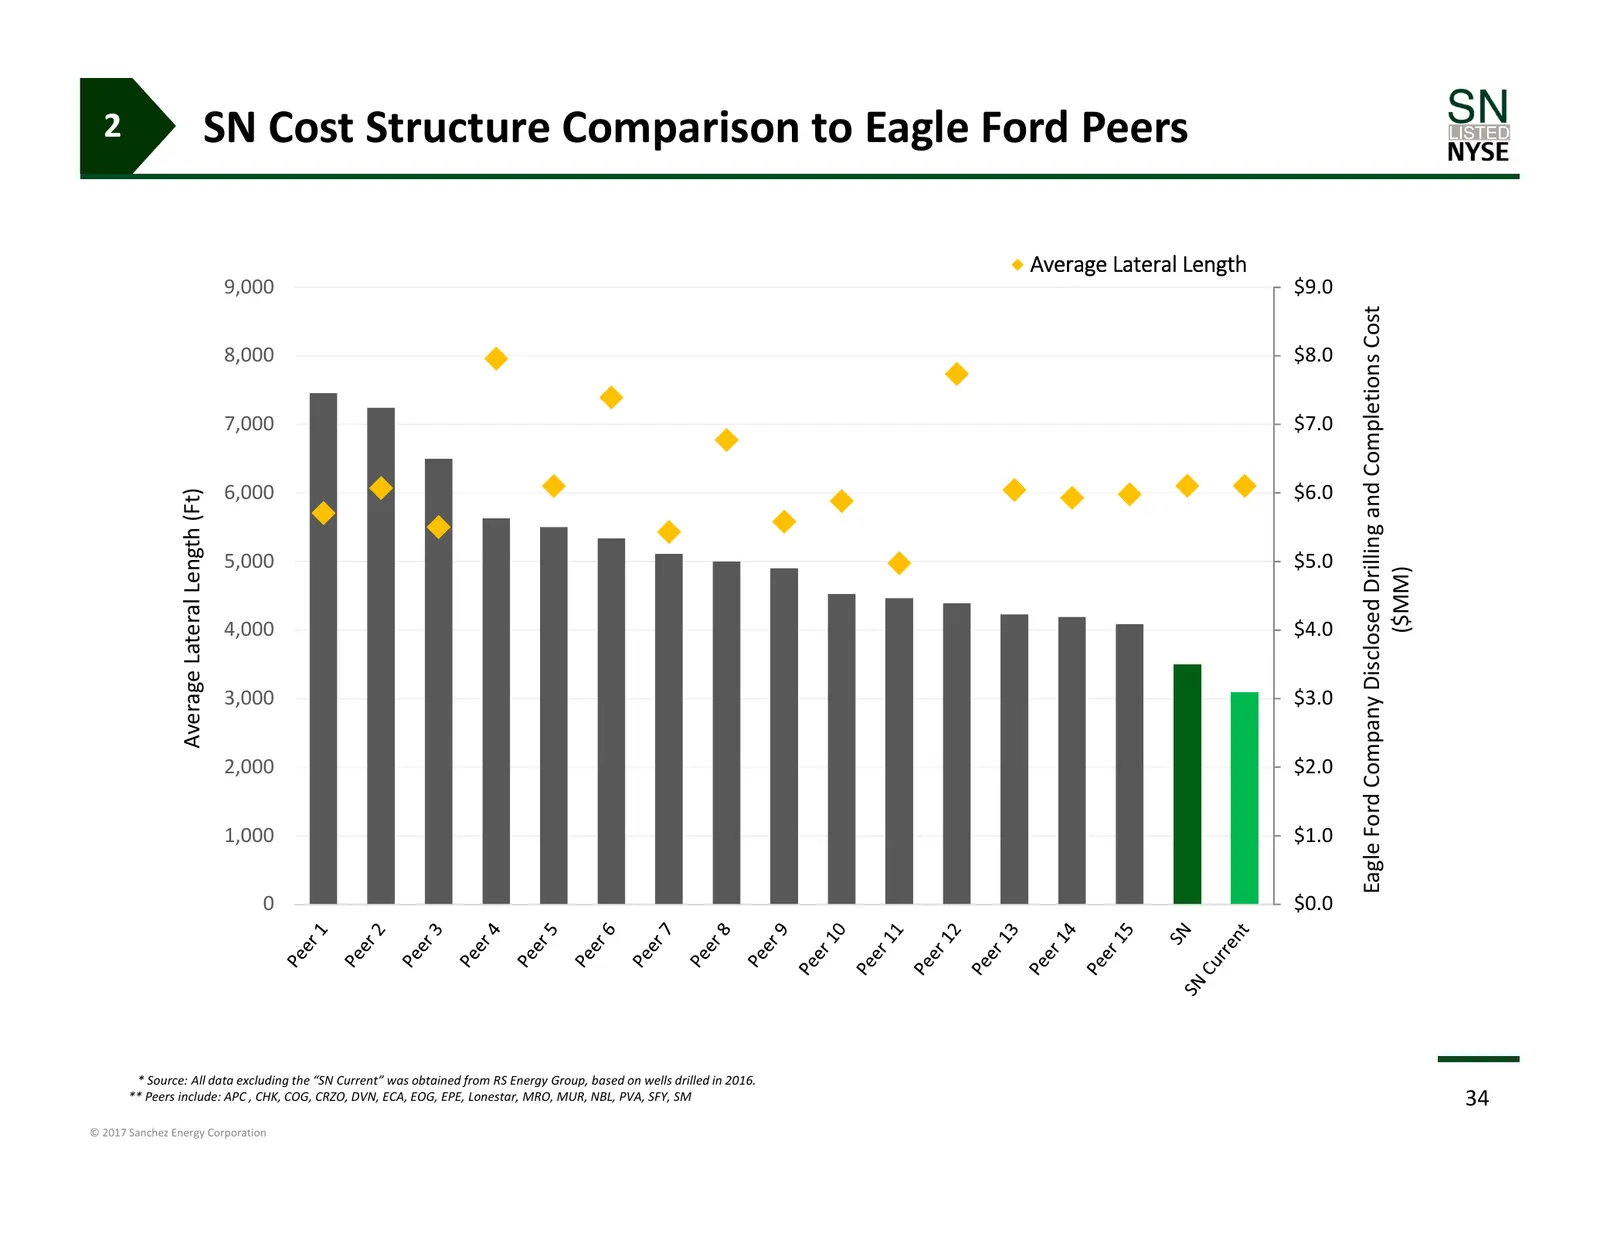
Slide 34: SN Cost Structure Comparison to Eagle Ford Peers
2 SN Cost Structure Comparison to Eagle Ford Peers Average Lateral Length 9,000 $9.0 Eagle Ford Company Disclosed Drilling and Completions Cost 8,000 $8.0 7,000 $7.0 6,000 $6.0 Average Lateral Length (Ft) 5,000 $5.0 ($MM) 4,000 $4.0 3,000 $3.0 2,000 $2.0 1,000 $1.0 0 $0.0 * Source: All data excludin
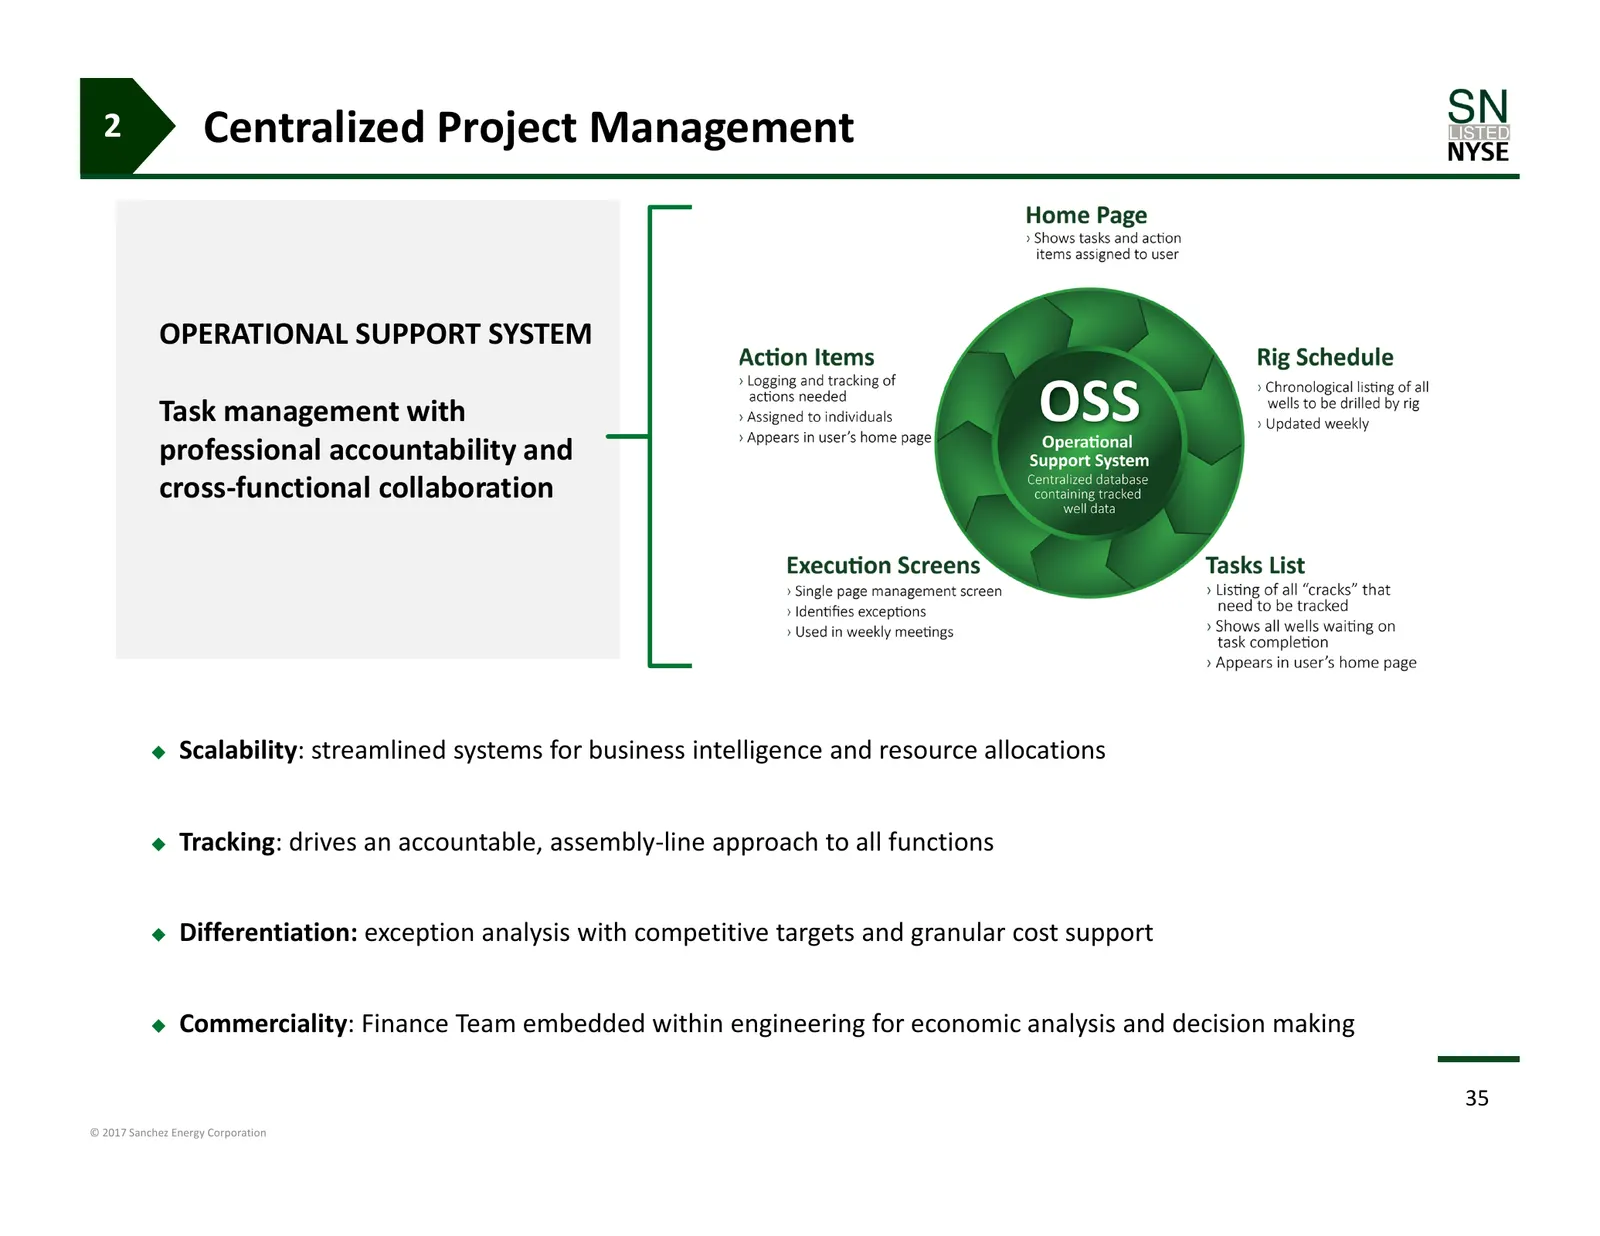
Slide 35: Centralized Project Management
2 Centralized Project Management OPERATIONAL SUPPORT SYSTEM Task management with professional accountability and cross‐functional collaboration Scalability: streamlined systems for business intelligence and resource allocations Tracking: drives an accountable, assembly‐line approach to all funct
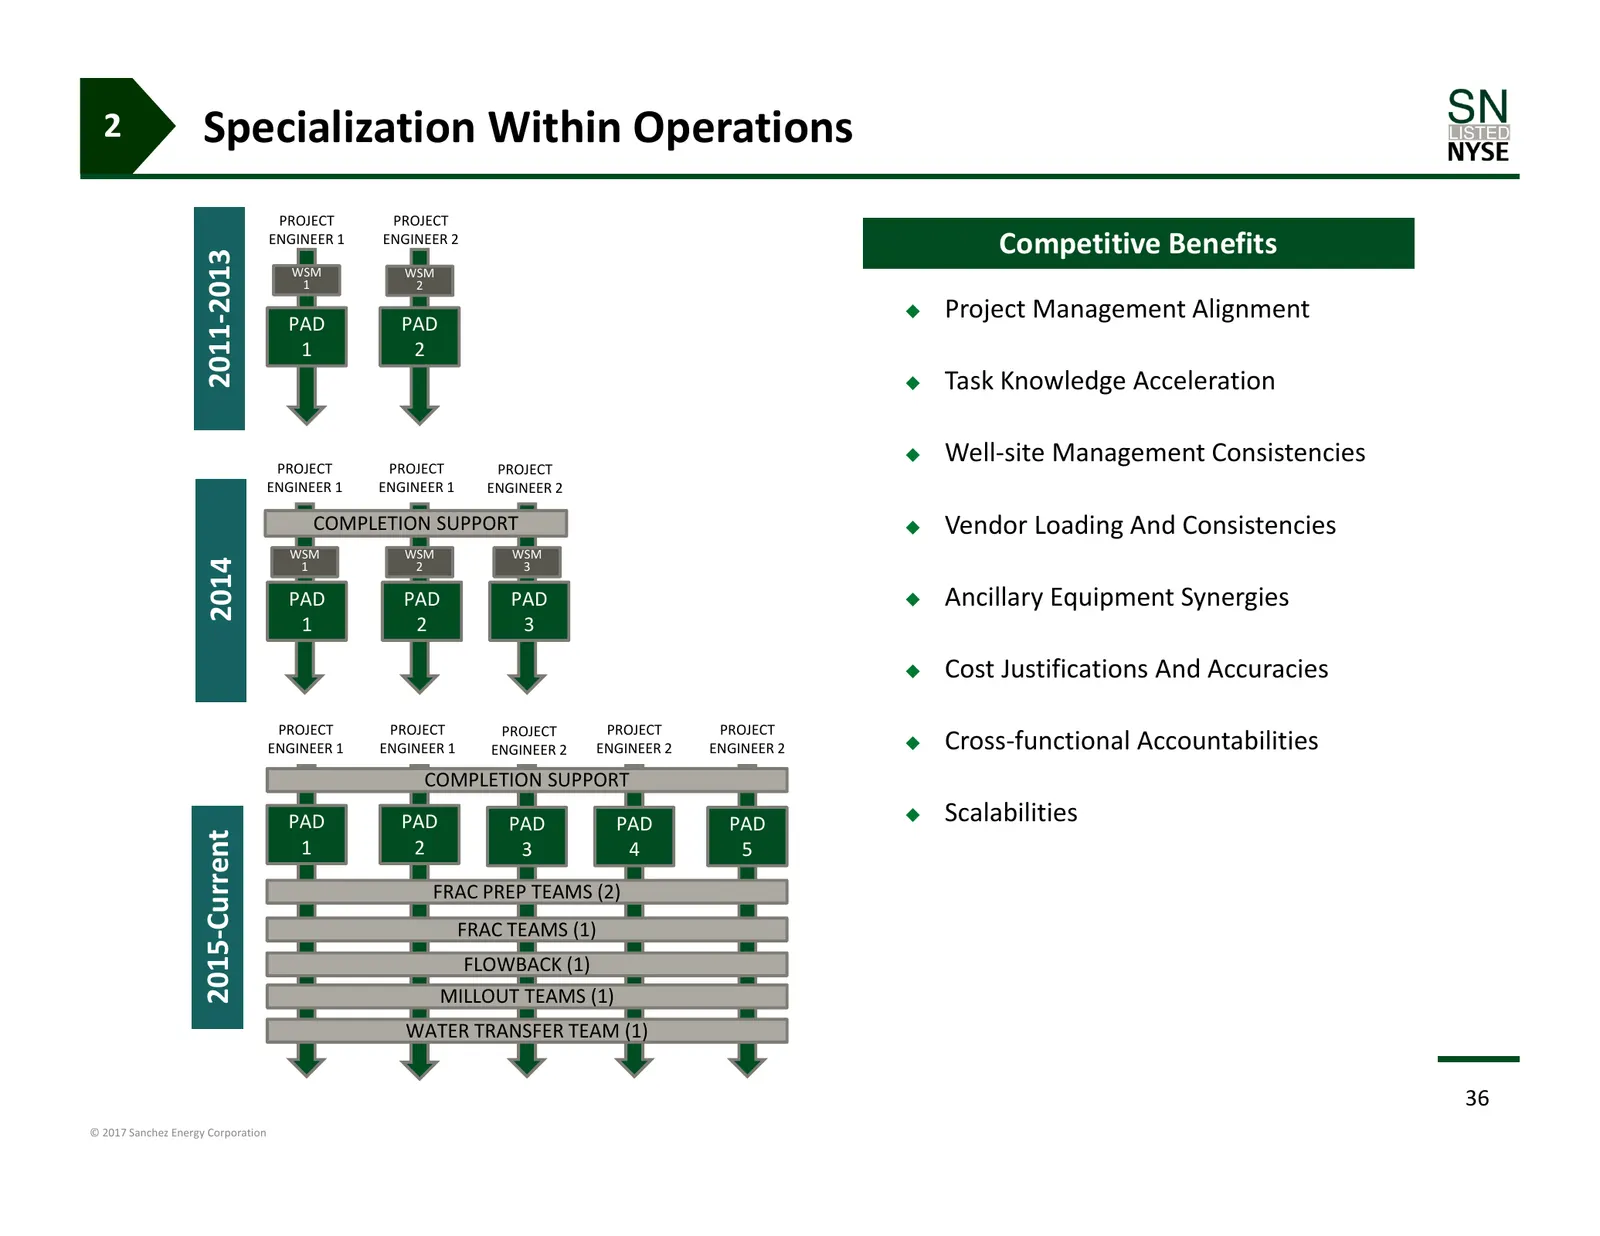
Slide 36: Specialization Within Operations
2 Specialization Within Operations PROJECT PROJECT ENGINEER 1 ENGINEER 2 Competitive Benefits 2011‐2013 WSM WSM 1 2 PAD PAD Project Management Alignment 1 2 Task Knowledge Acceleration PROJECT PROJECT PROJECT Well‐site Management Consistencies ENGINEER 1 ENGINEER 1 ENGINEER 2 COMPLETION SUPPOR
Slide 37: Concentrated Acreage Position
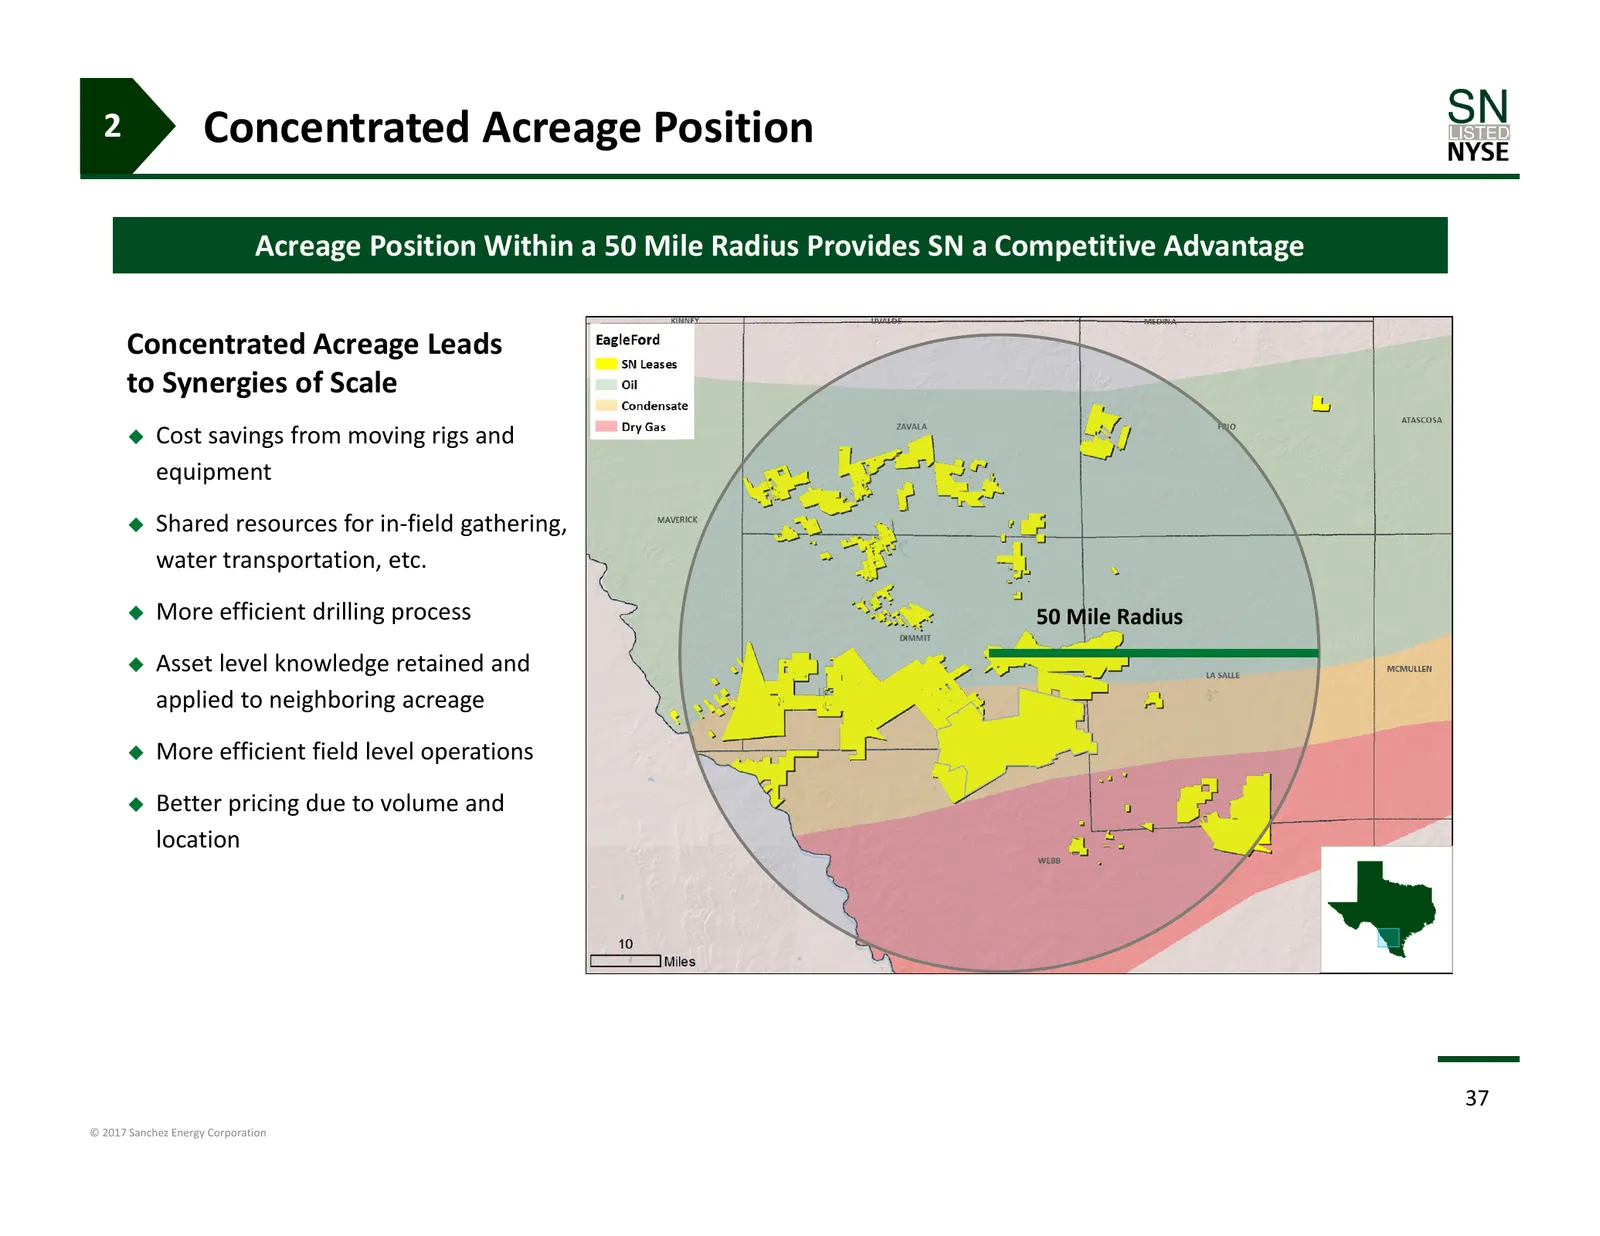
2 Concentrated Acreage Position Acreage Position Within a 50 Mile Radius Provides SN a Competitive Advantage Concentrated Acreage Leads to Synergies of Scale Cost savings from moving rigs and equipment Shared resources for in‐field gathering, water transportation, etc. More efficient drilling
Slide 38: Process Optimization
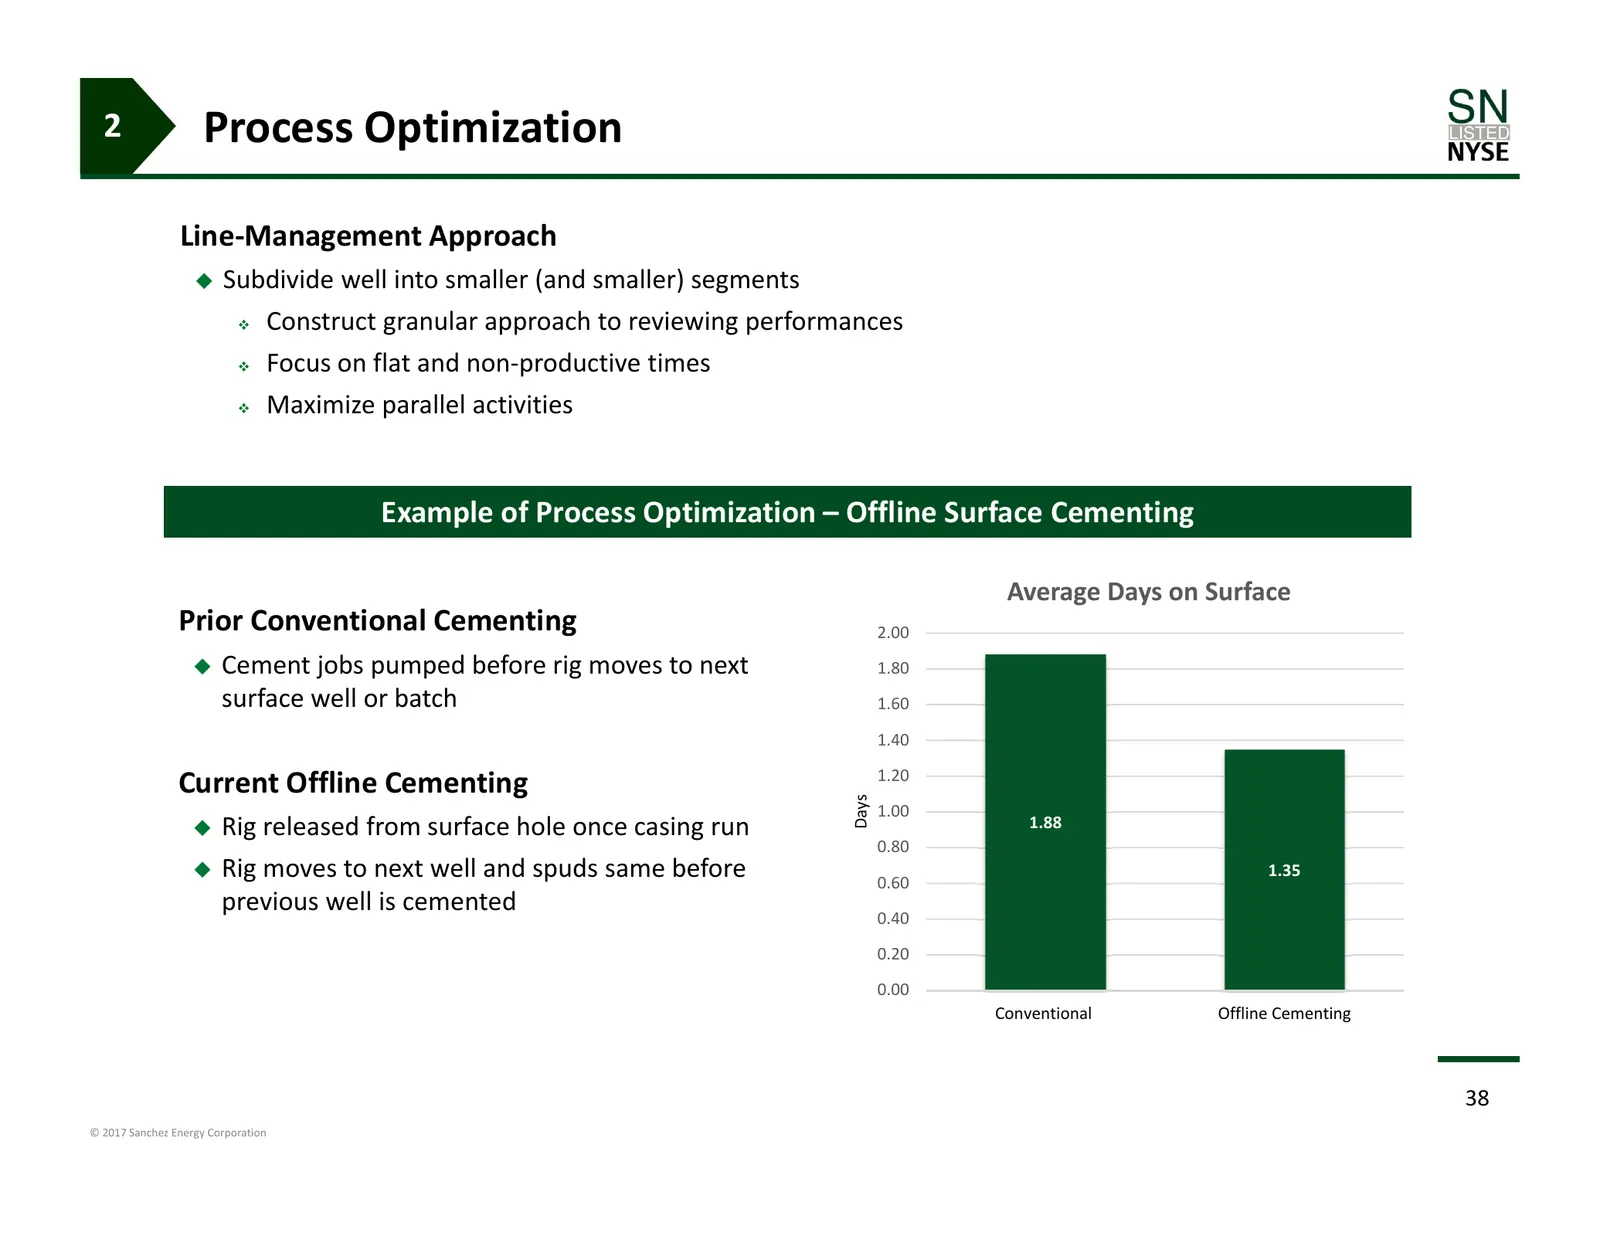
2 Process Optimization Line‐Management Approach Subdivide well into smaller (and smaller) segments Construct granular approach to reviewing performances Focus on flat and non‐productive times Maximize parallel activities Example of Process Optimization – Offline Surface Cementing Average Day
Slide 39: Selective De-Bundling & Efficiency Contributes to Sustainability
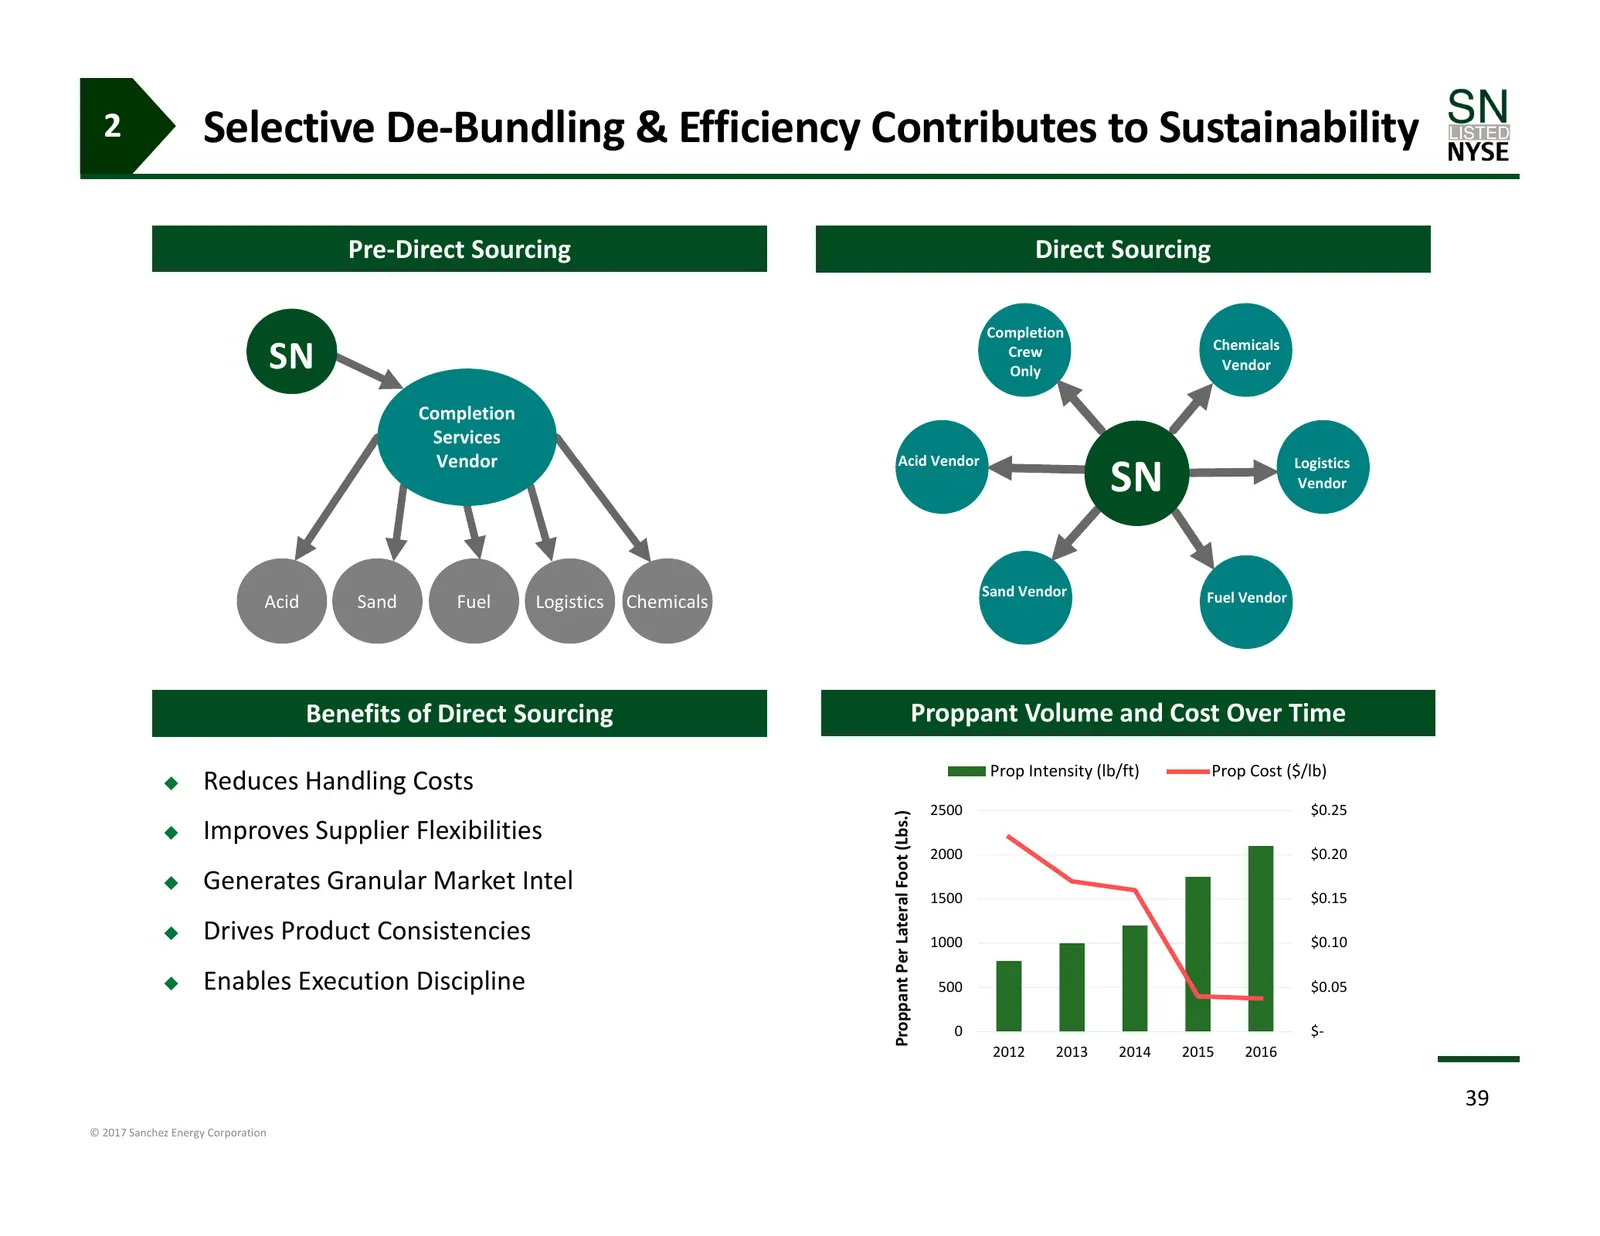
2 Selective De‐Bundling & Efficiency Contributes to Sustainability Pre‐Direct Sourcing Direct Sourcing Completion Chemicals SN Crew Only Vendor Completion Services Vendor Acid Vendor Logistics SN Vendor Sand Vendor Fuel Vendor Acid Sand Fuel Logistics Chemicals Benefits of Direct Sourcing Proppant V
Slide 40: Manufacturing Efficiency Driven by Scale
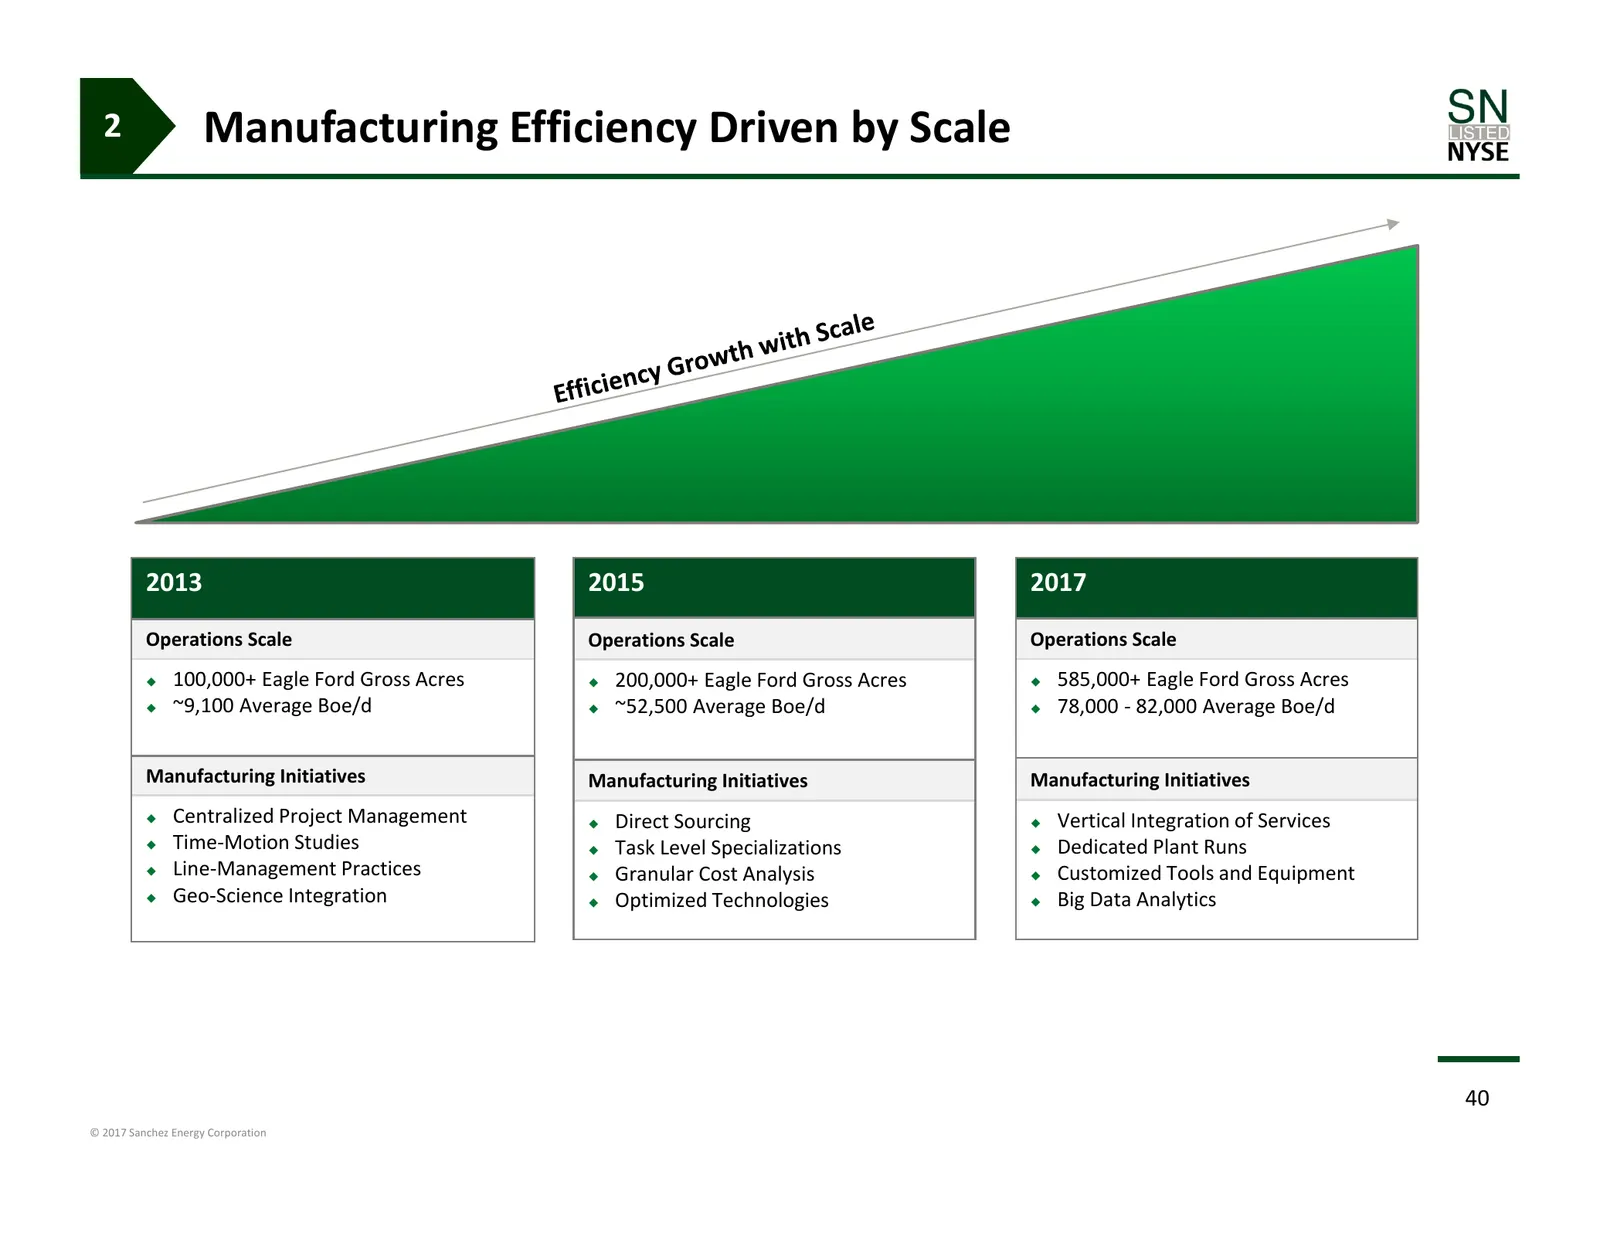
2 Manufacturing Efficiency Driven by Scale 2013 2015 2017 Operations Scale Operations Scale Operations Scale 100,000+ Eagle Ford Gross Acres 200,000+ Eagle Ford Gross Acres 585,000+ Eagle Ford Gross Acres ~9,100 Average Boe/d ~52,500 Average Boe/d 78,000 ‐ 82,000 Average Boe/d Manufactur
Slide 41: Drilling Cost Reduction Durability
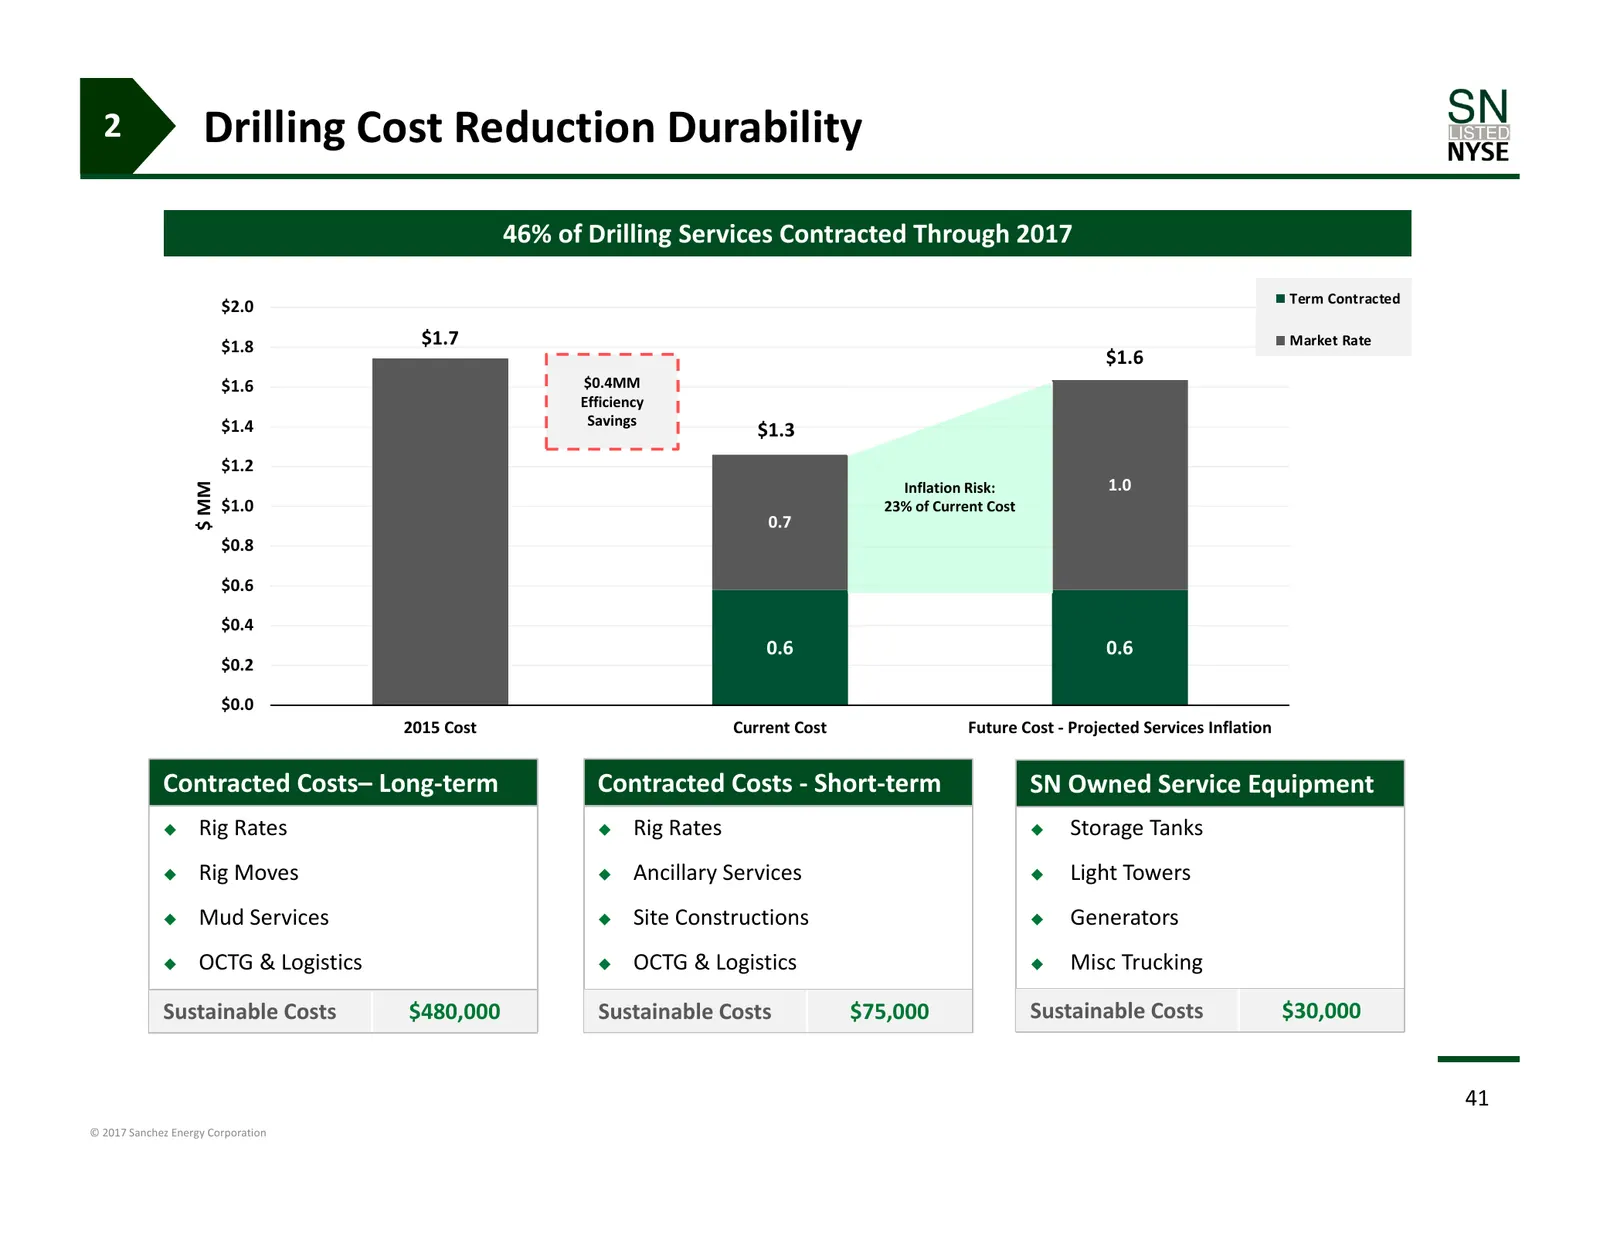
2 Drilling Cost Reduction Durability 46% of Drilling Services Contracted Through 2017 Term Contracted $2.0 $1.8 $1.7 Market Rate $1.6 $1.6 $0.4MM Efficiency $1.4 Savings $1.3 $1.2 Inflation Risk: 1.0 $ MM $1.0 23% of Current Cost 0.7 $0.8 $0.6 $0.4 0.6 0.6 $0.2 $0.0 2015 Cost Current Cost Future Cos
Slide 42: Completions Cost Reduction Durability
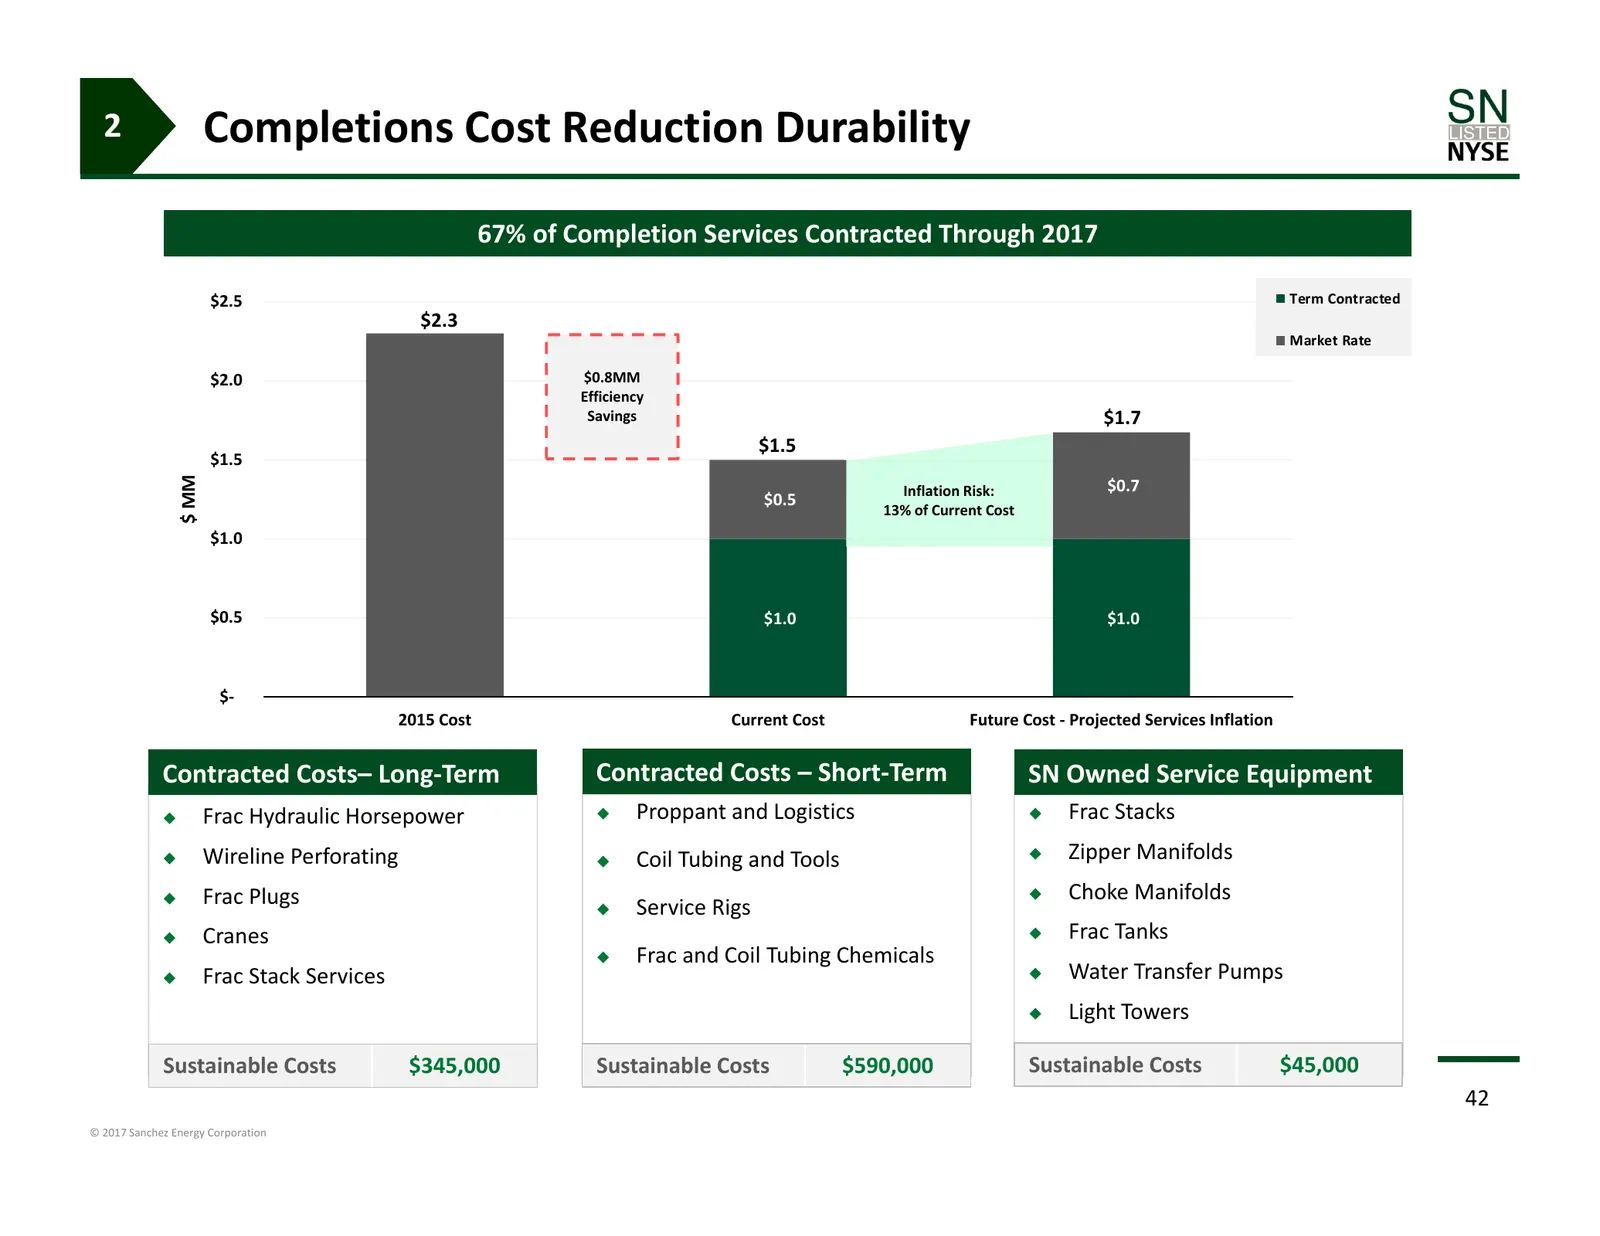
2 Completions Cost Reduction Durability 67% of Completion Services Contracted Through 2017 $2.5 Term Contracted $2.3 Market Rate $2.0 $0.8MM Efficiency Savings $1.7 $1.5 $1.5 $ MM Inflation Risk: $0.7 $0.5 13% of Current Cost $1.0 $0.5 $1.0 $1.0 $‐ 2015 Cost Current Cost Future Cost ‐ Projected Serv
Slide 43: Sensitivity & Sustainability
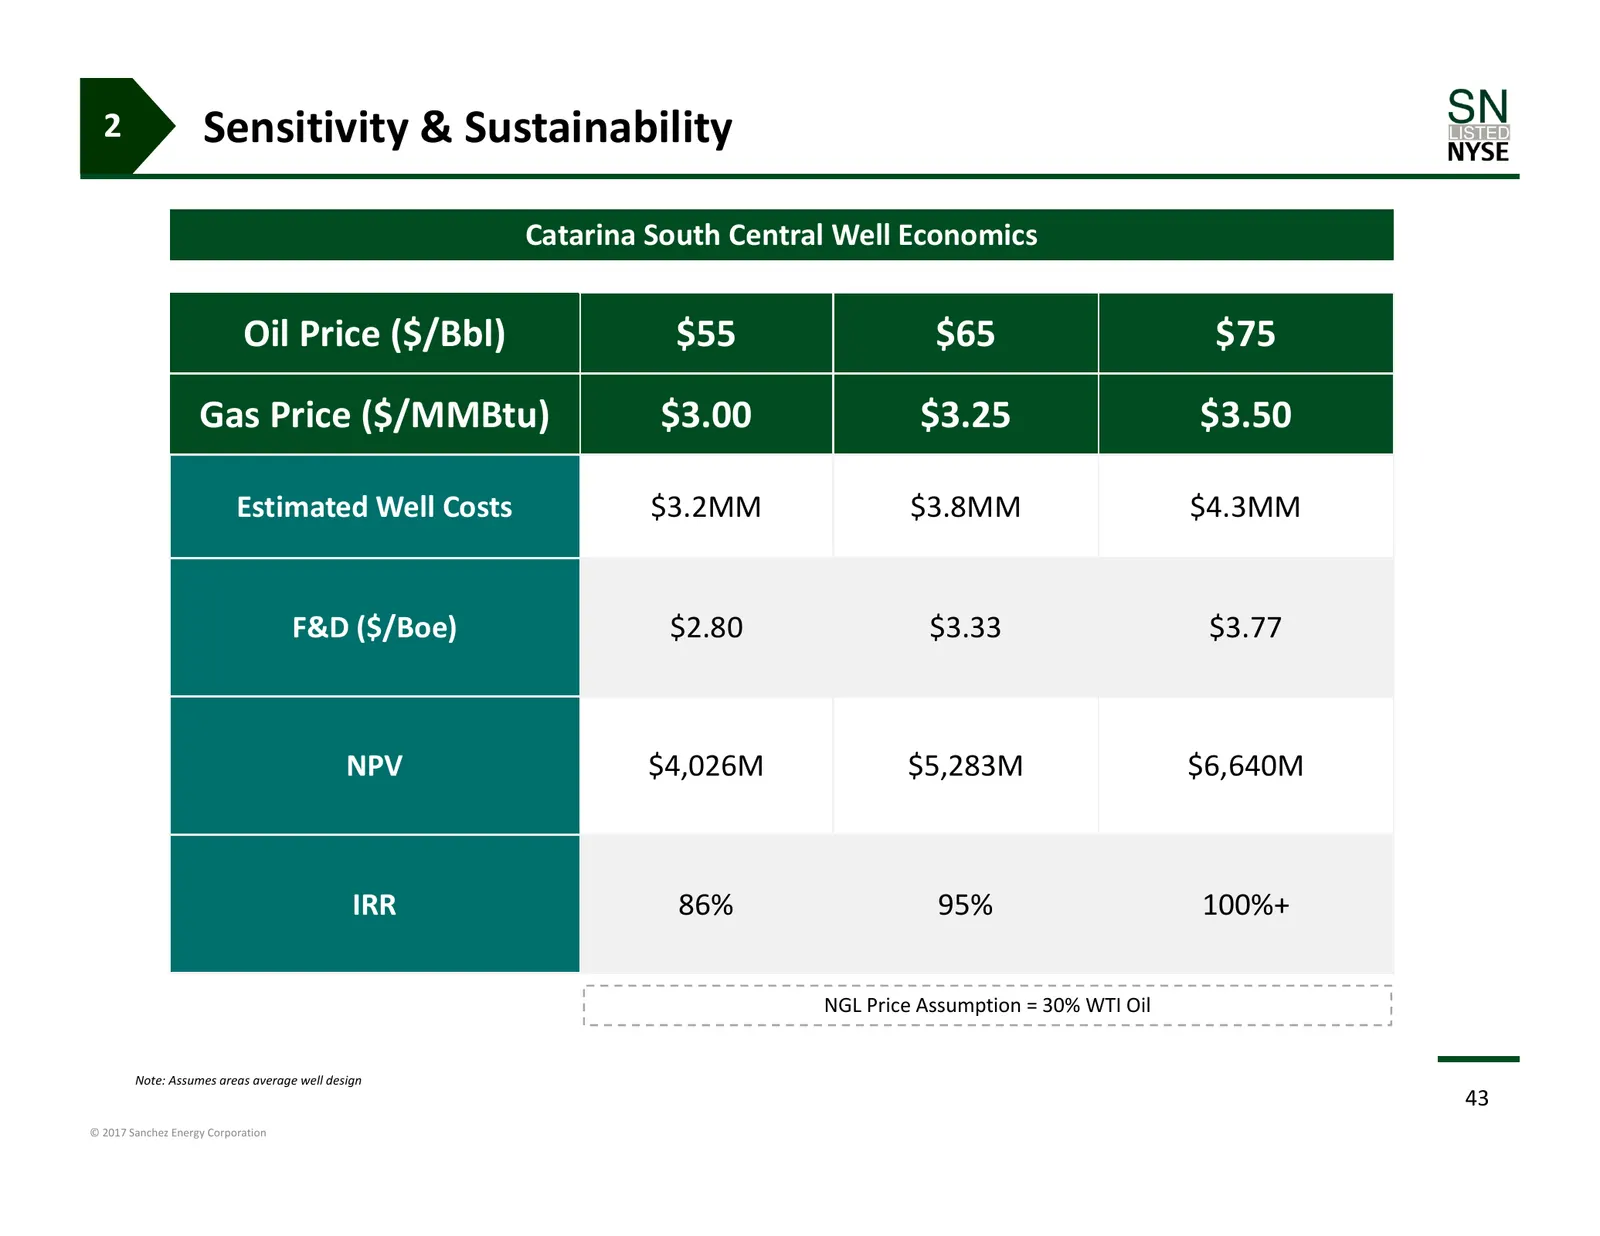
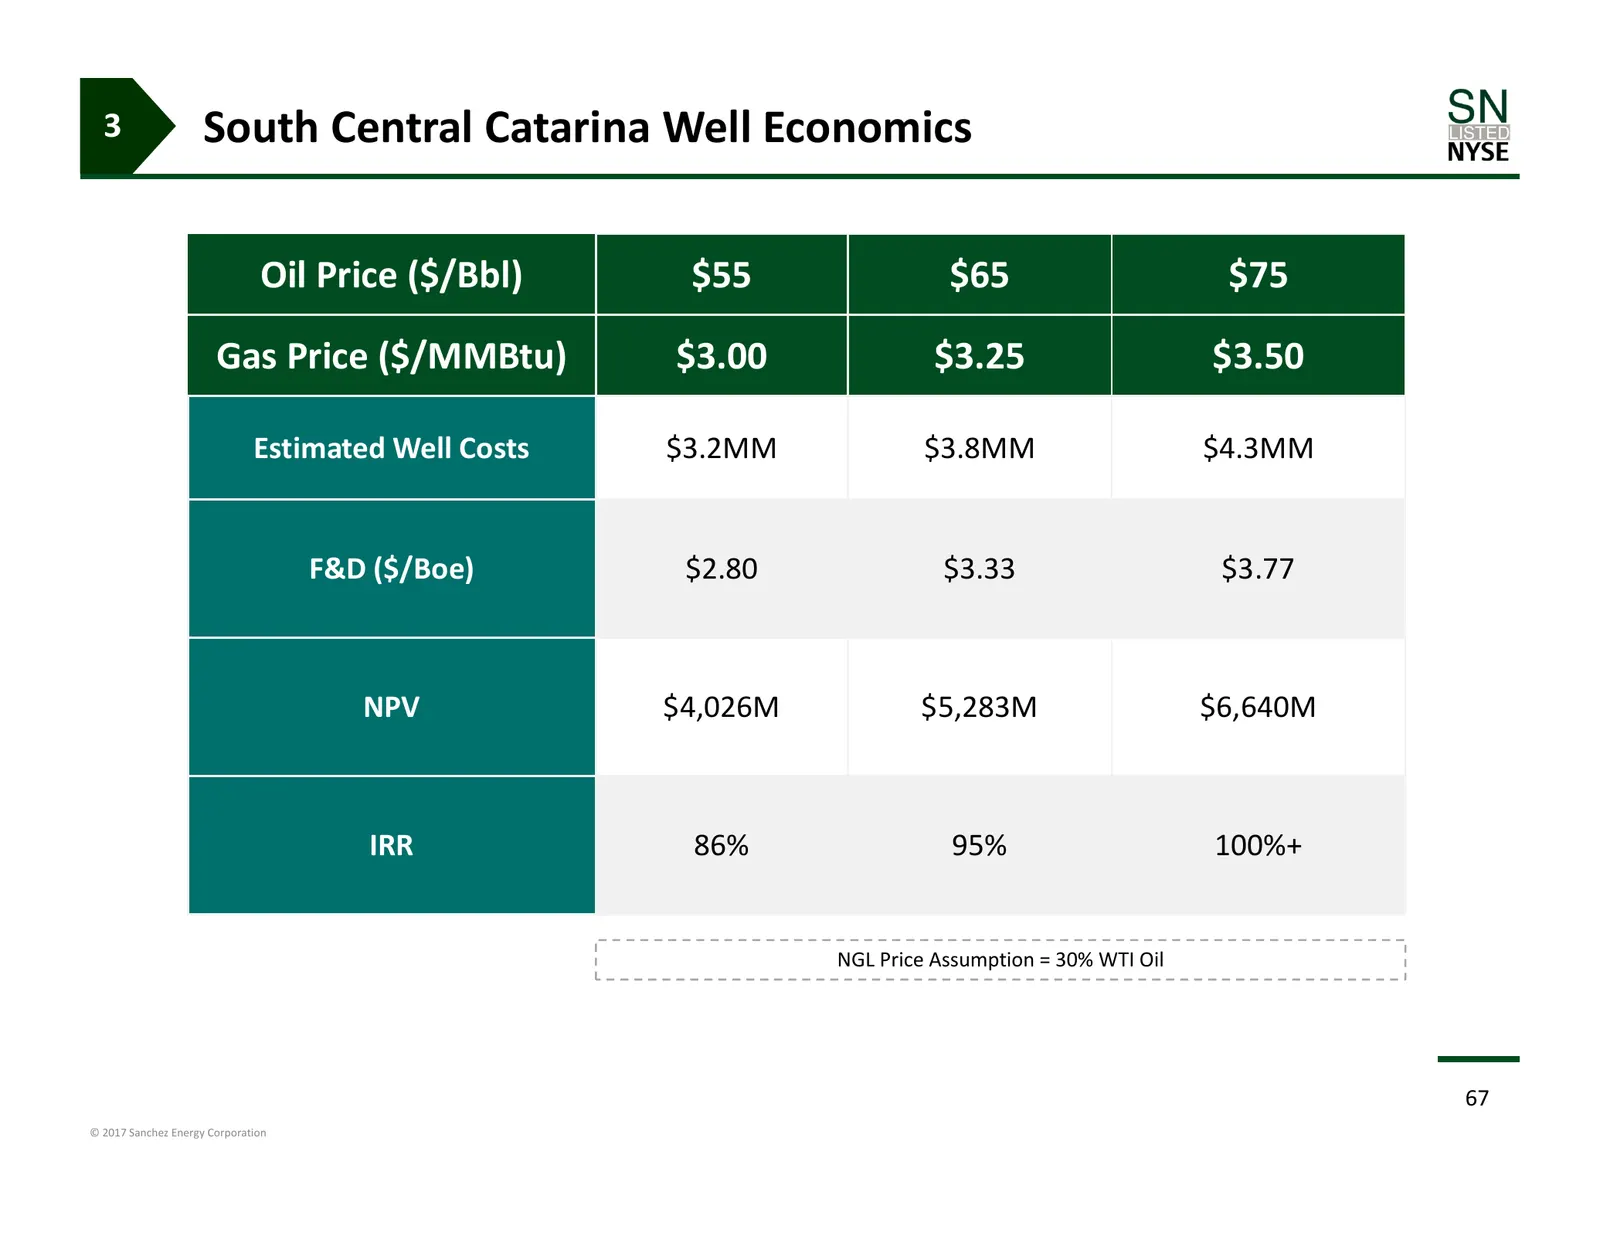
2 Sensitivity & Sustainability Catarina South Central Well Economics Oil Price ($/Bbl) $55 $65 $75 Gas Price ($/MMBtu) $3.00 $3.25 $3.50 Estimated Well Costs $3.2MM $3.8MM $4.3MM F&D ($/Boe) $2.80 $3.33 $3.77 NPV $4,026M $5,283M $6,640M IRR 86% 95% 100%+ NGL Price Assumption = 30% WTI Oil Note: Assu
Slide 44: Sanchez Energy: Asset Detail
Sanchez Energy: Asset Detail 3. Asset Detail o Comanche o Catarina o Maverick o Javelina Competitive Advantages Asset Detail Financial Strategy 44 © 2017 Sanchez Energy Corporation
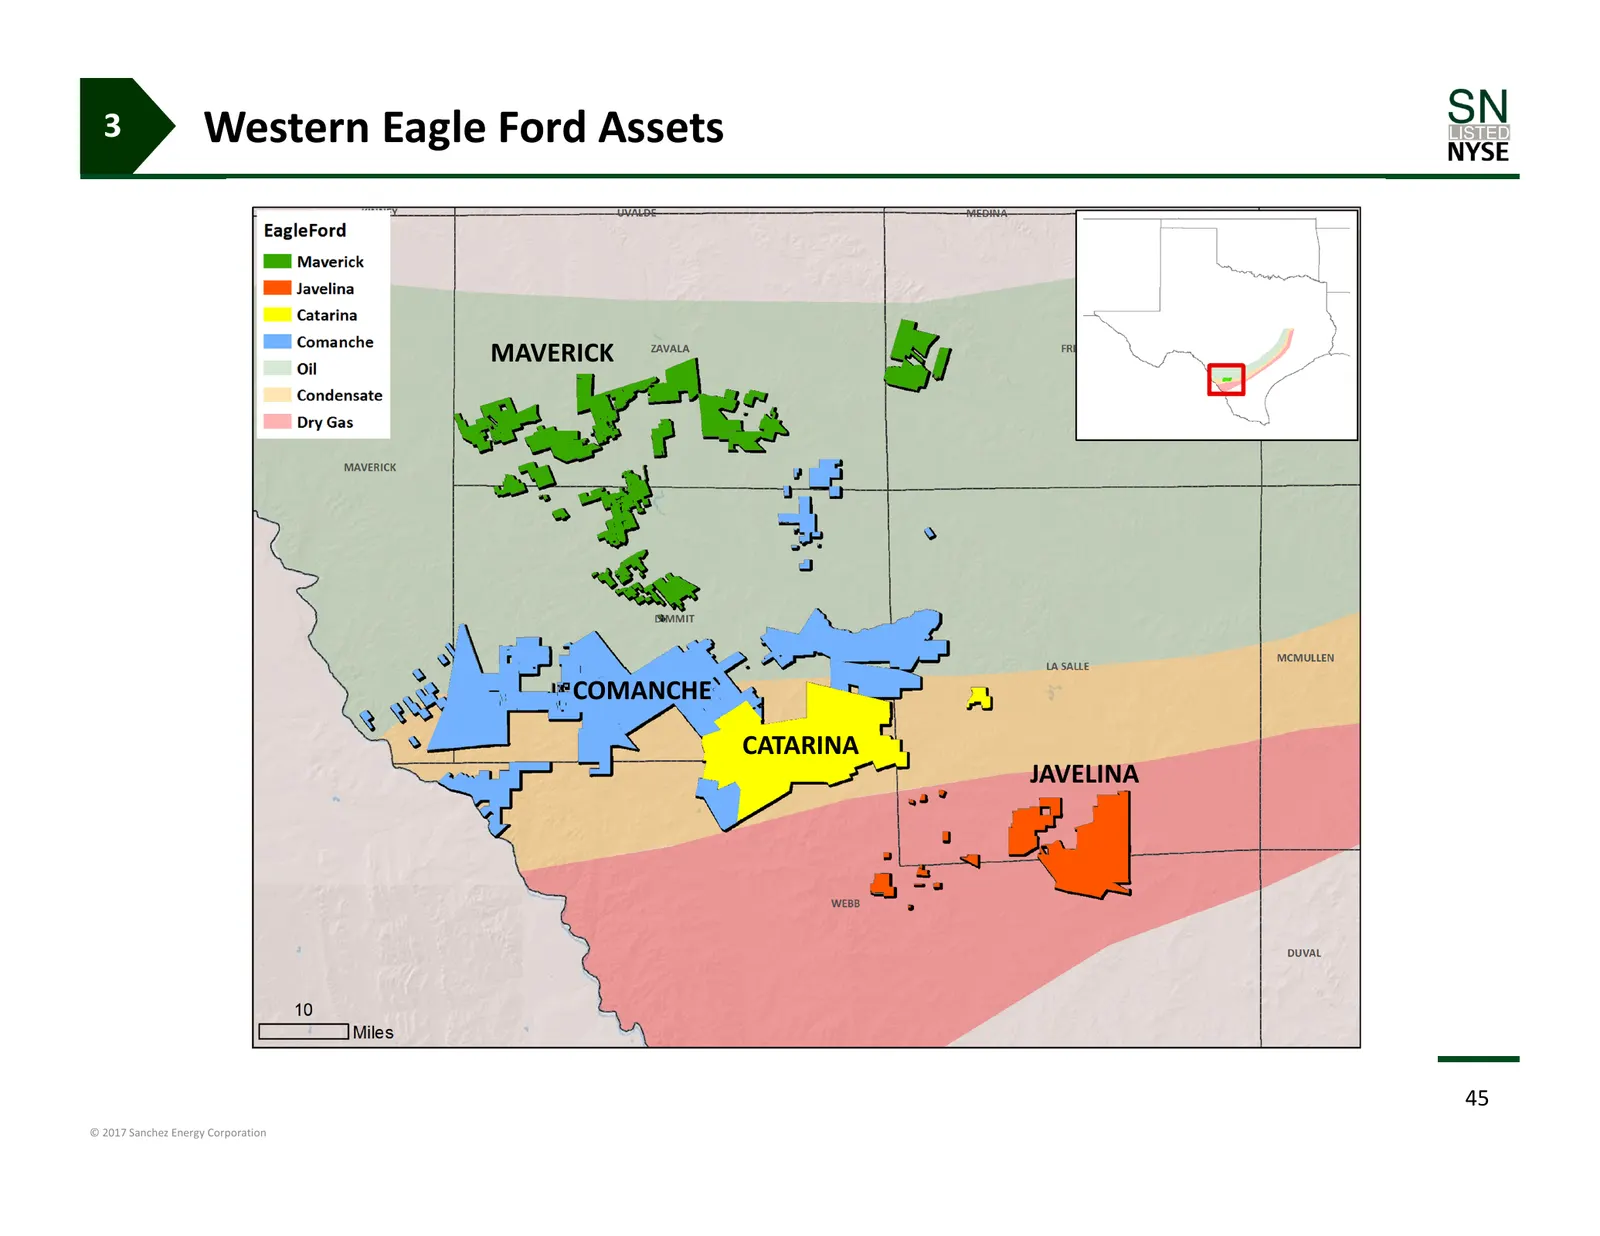
Slide 45: Western Eagle Ford Assets
3 Western Eagle Ford Assets MAVERICK COMANCHE CATARINA JAVELINA 45 © 2017 Sanchez Energy Corporation
Slide 46: Comanche
Comanche 46 © 2017 Sanchez Energy Corporation
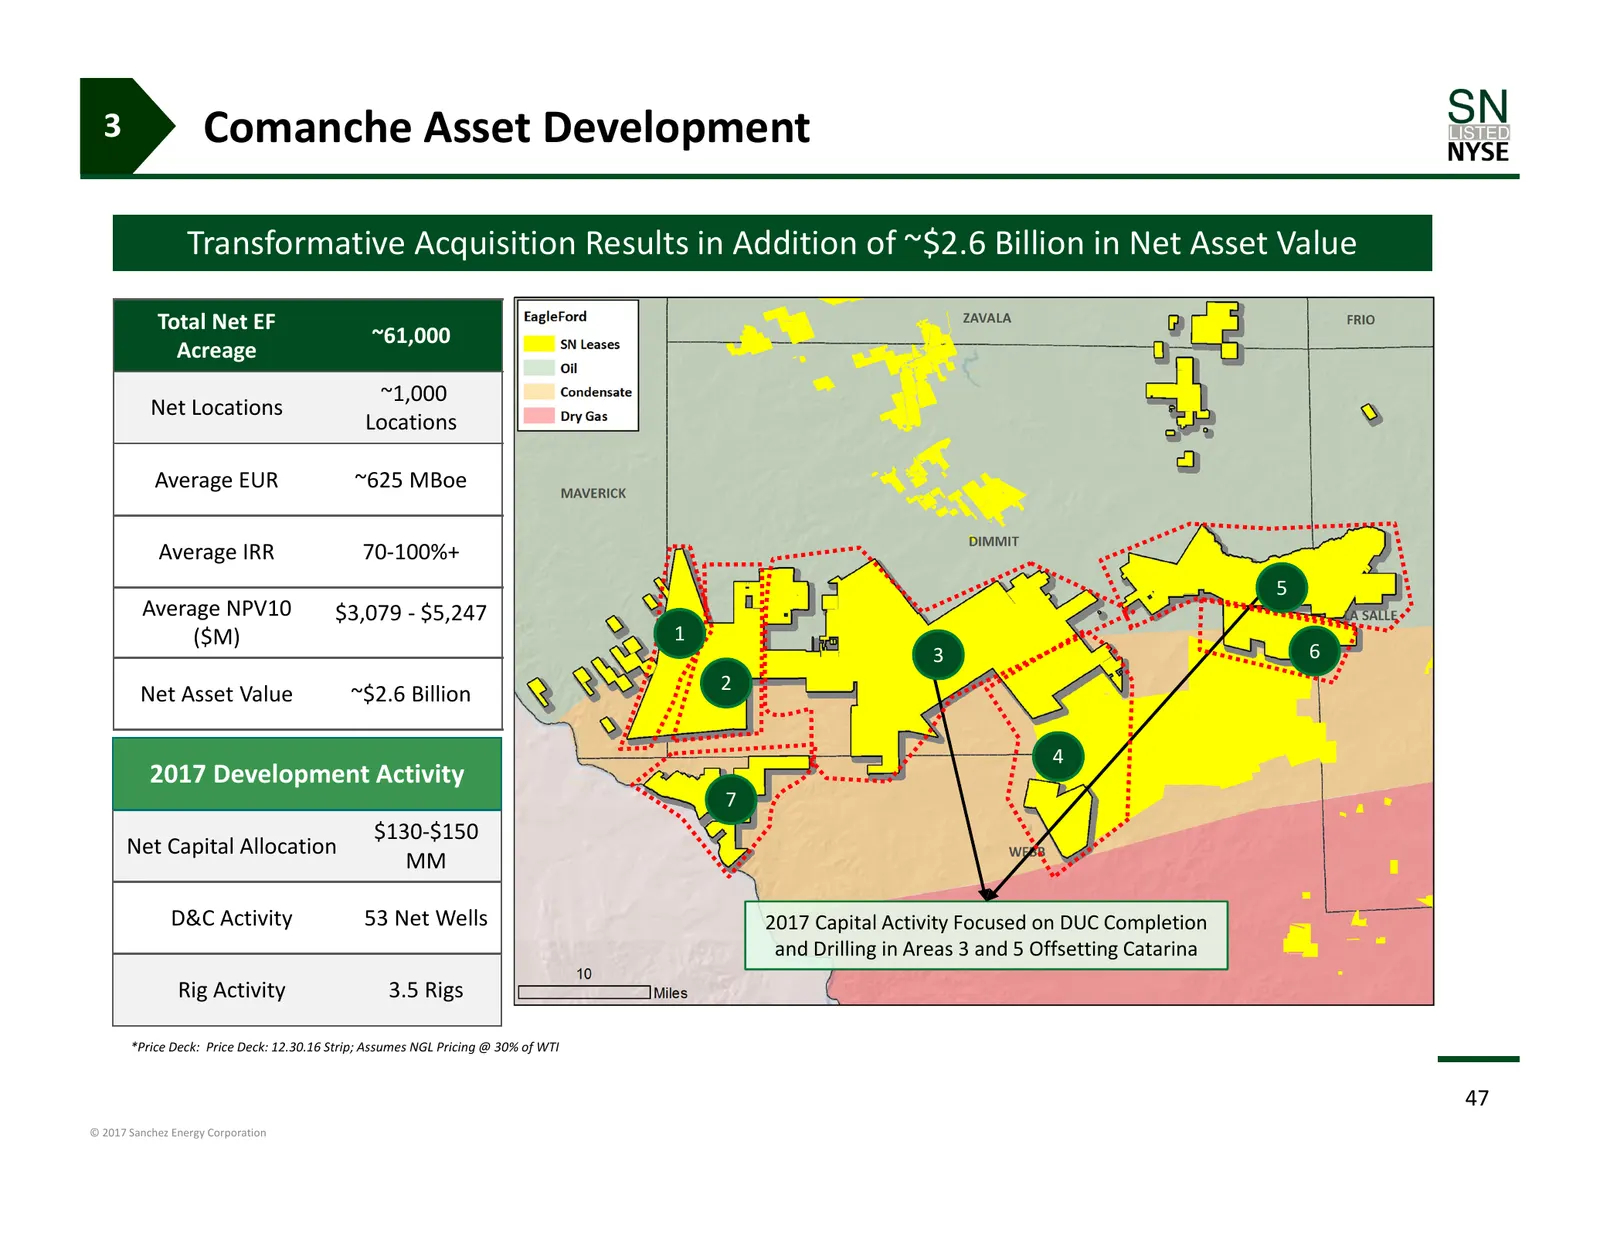
Slide 47: Comanche Asset Development
3 Comanche Asset Development Transformative Acquisition Results in Addition of ~$2.6 Billion in Net Asset Value Total Net EF ~61,000 Acreage ~1,000 Net Locations Locations Average EUR ~625 MBoe Average IRR 70‐100%+ 5 Average NPV10 $3,079 ‐ $5,247 ($M) 1 3 6 2 Net Asset Value ~$2.6 Billion 4 2017 Dev
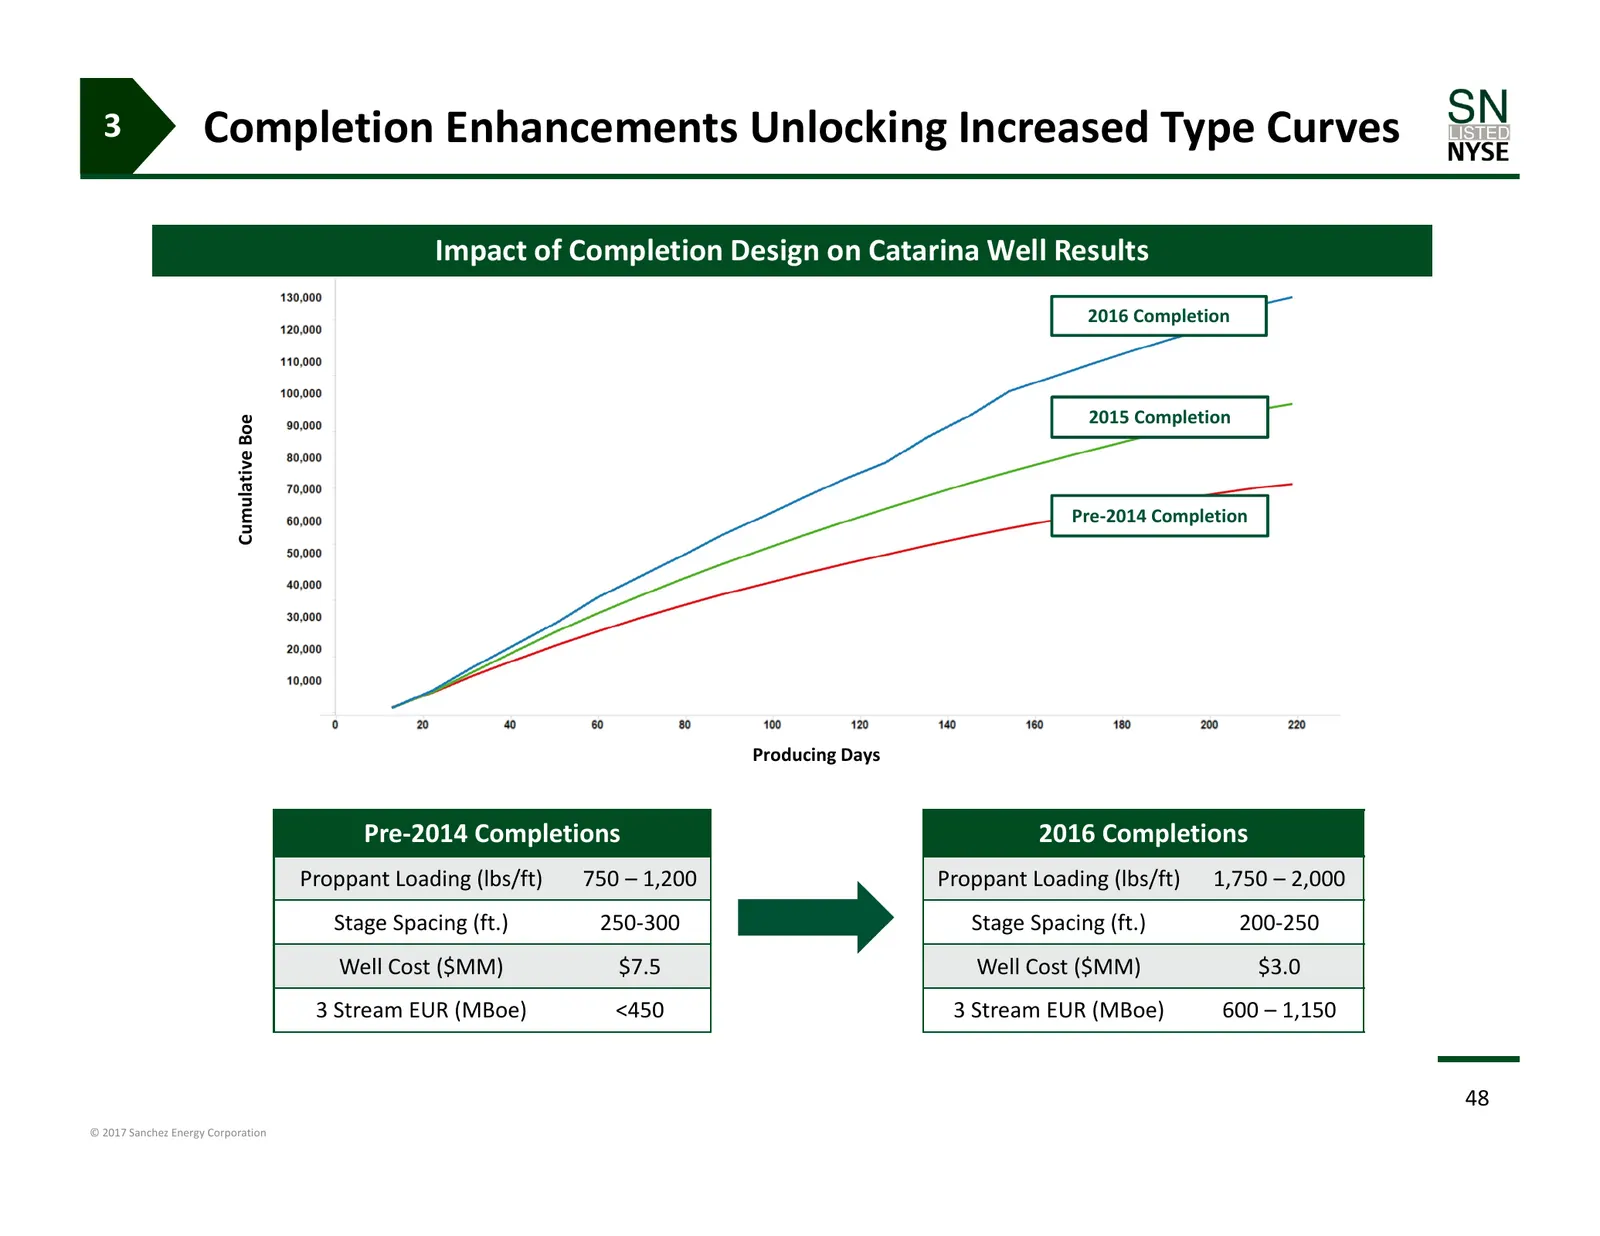
Slide 48: Completion Enhancements Unlocking Increased Type Curves
3 Completion Enhancements Unlocking Increased Type Curves Impact of Completion Design on Catarina Well Results 2016 Completion 2015 Completion Cumulative Boe Pre‐2014 Completion Producing Days Pre‐2014 Completions 2016 Completions Proppant Loading (lbs/ft) 750 – 1,200 Proppant Loading (lbs/ft) 1,750
Slide 49: Extensive Field Infrastructure Ready for Development
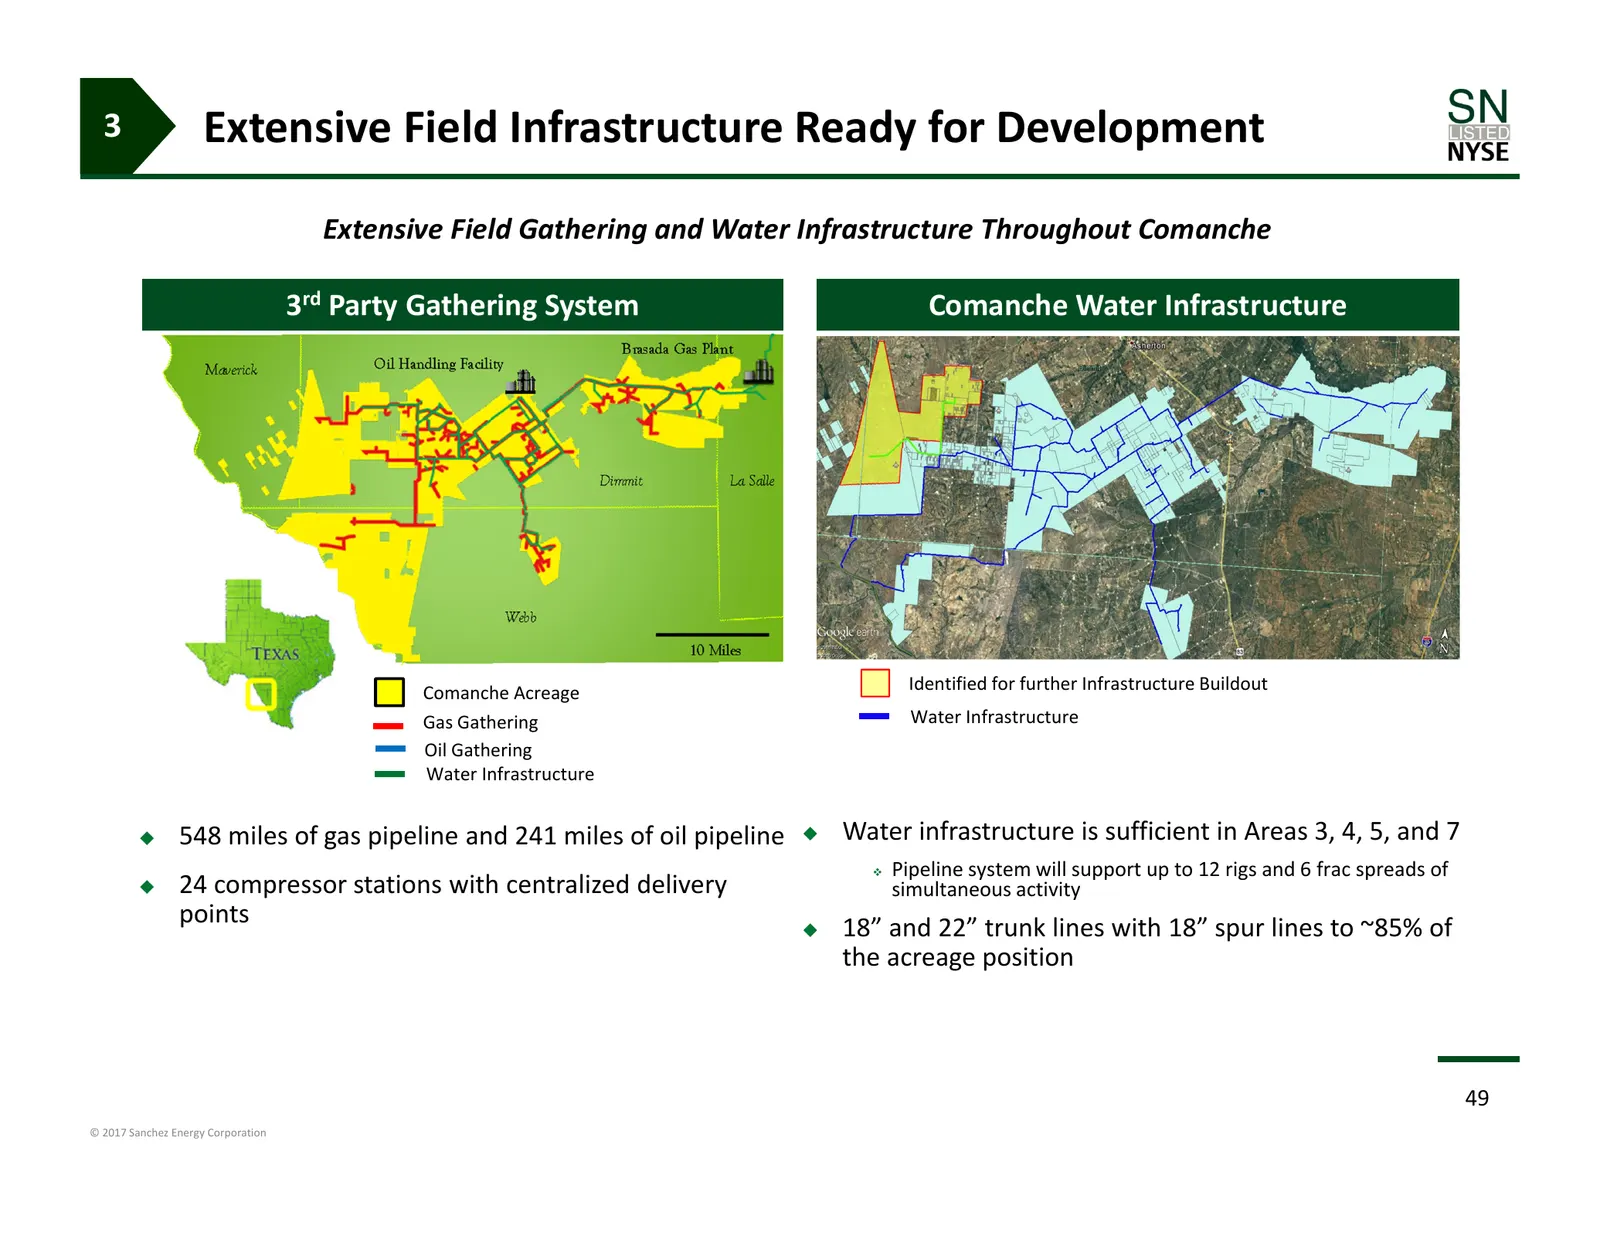
3 Extensive Field Infrastructure Ready for Development Extensive Field Gathering and Water Infrastructure Throughout Comanche 3rd Party Gathering System Comanche Water Infrastructure Comanche Acreage Identified for further Infrastructure Buildout Gas Gathering Water Infrastructure Oil Gathering Wate
Slide 50: Western Eagle Ford Stacked Development
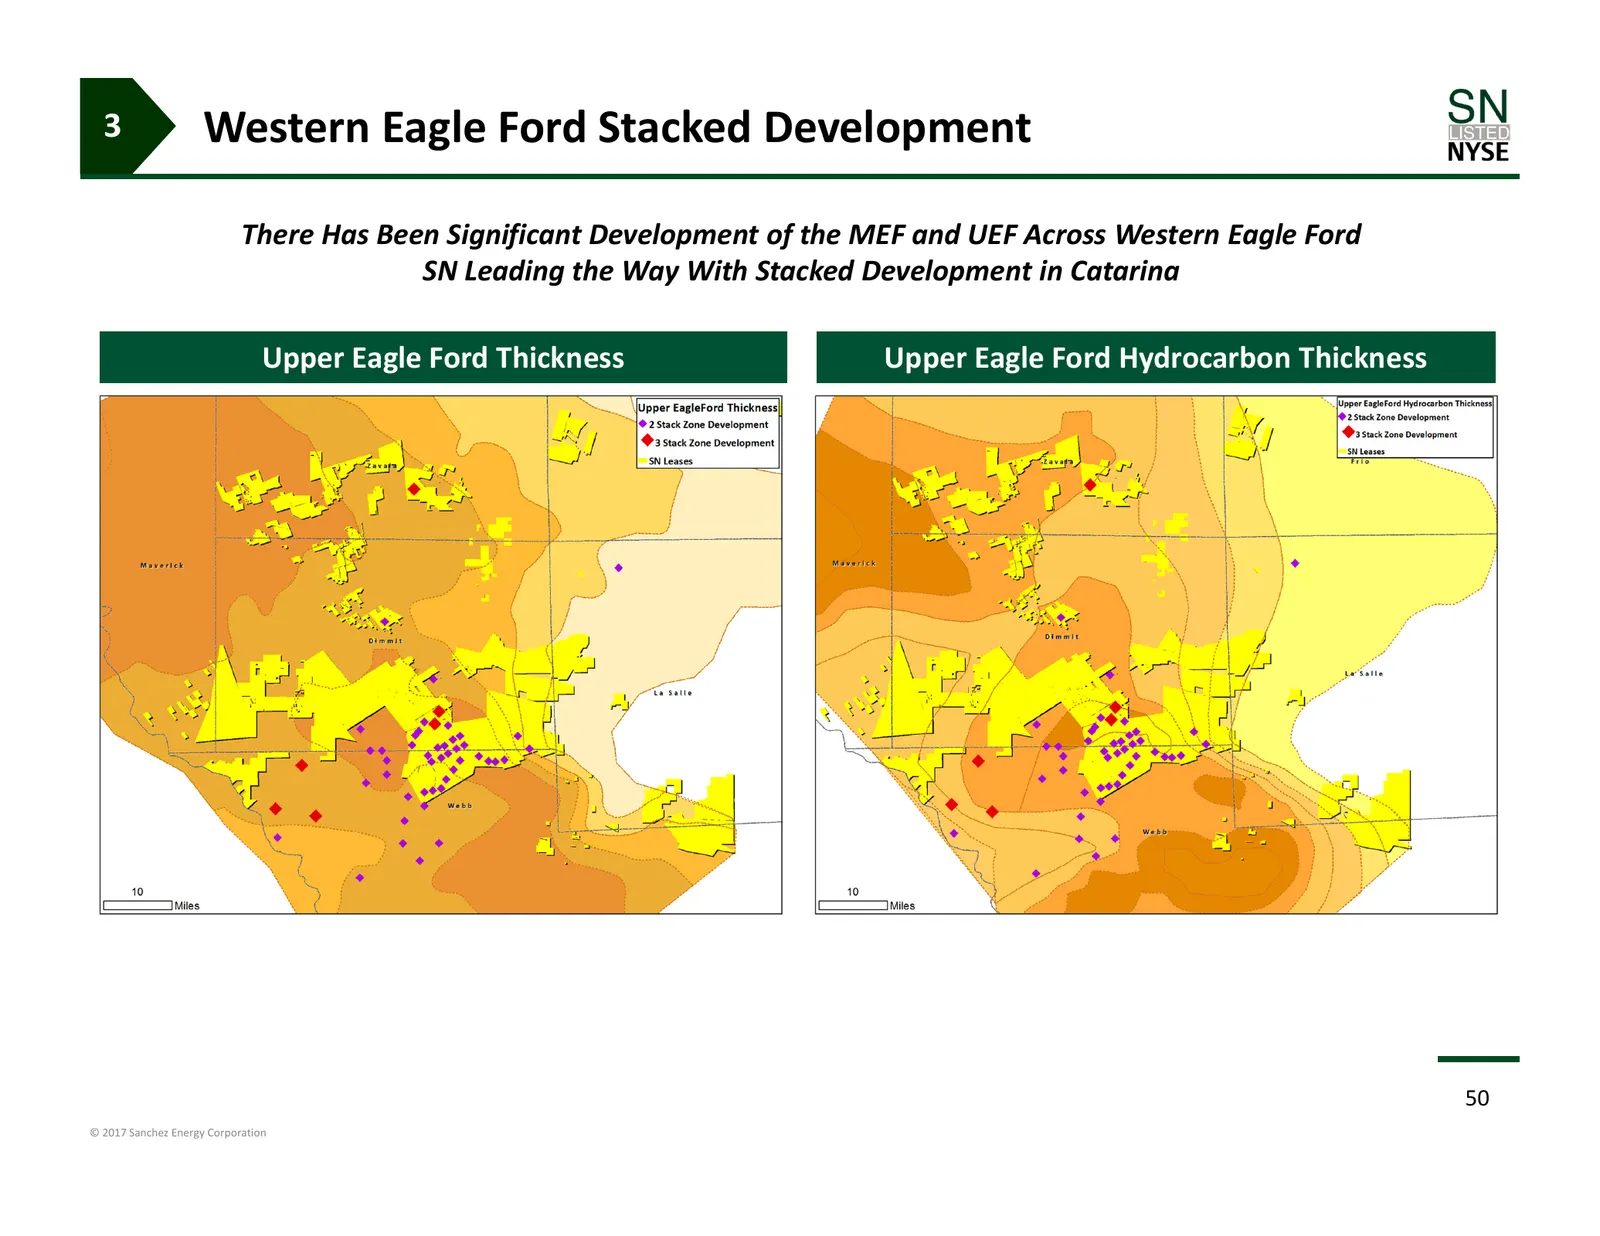
3 Western Eagle Ford Stacked Development There Has Been Significant Development of the MEF and UEF Across Western Eagle Ford SN Leading the Way With Stacked Development in Catarina Upper Eagle Ford Thickness Upper Eagle Ford Hydrocarbon Thickness 50 © 2017 Sanchez Energy Corporation
Slide 51: Multi-Bench Development Potential at Comanche
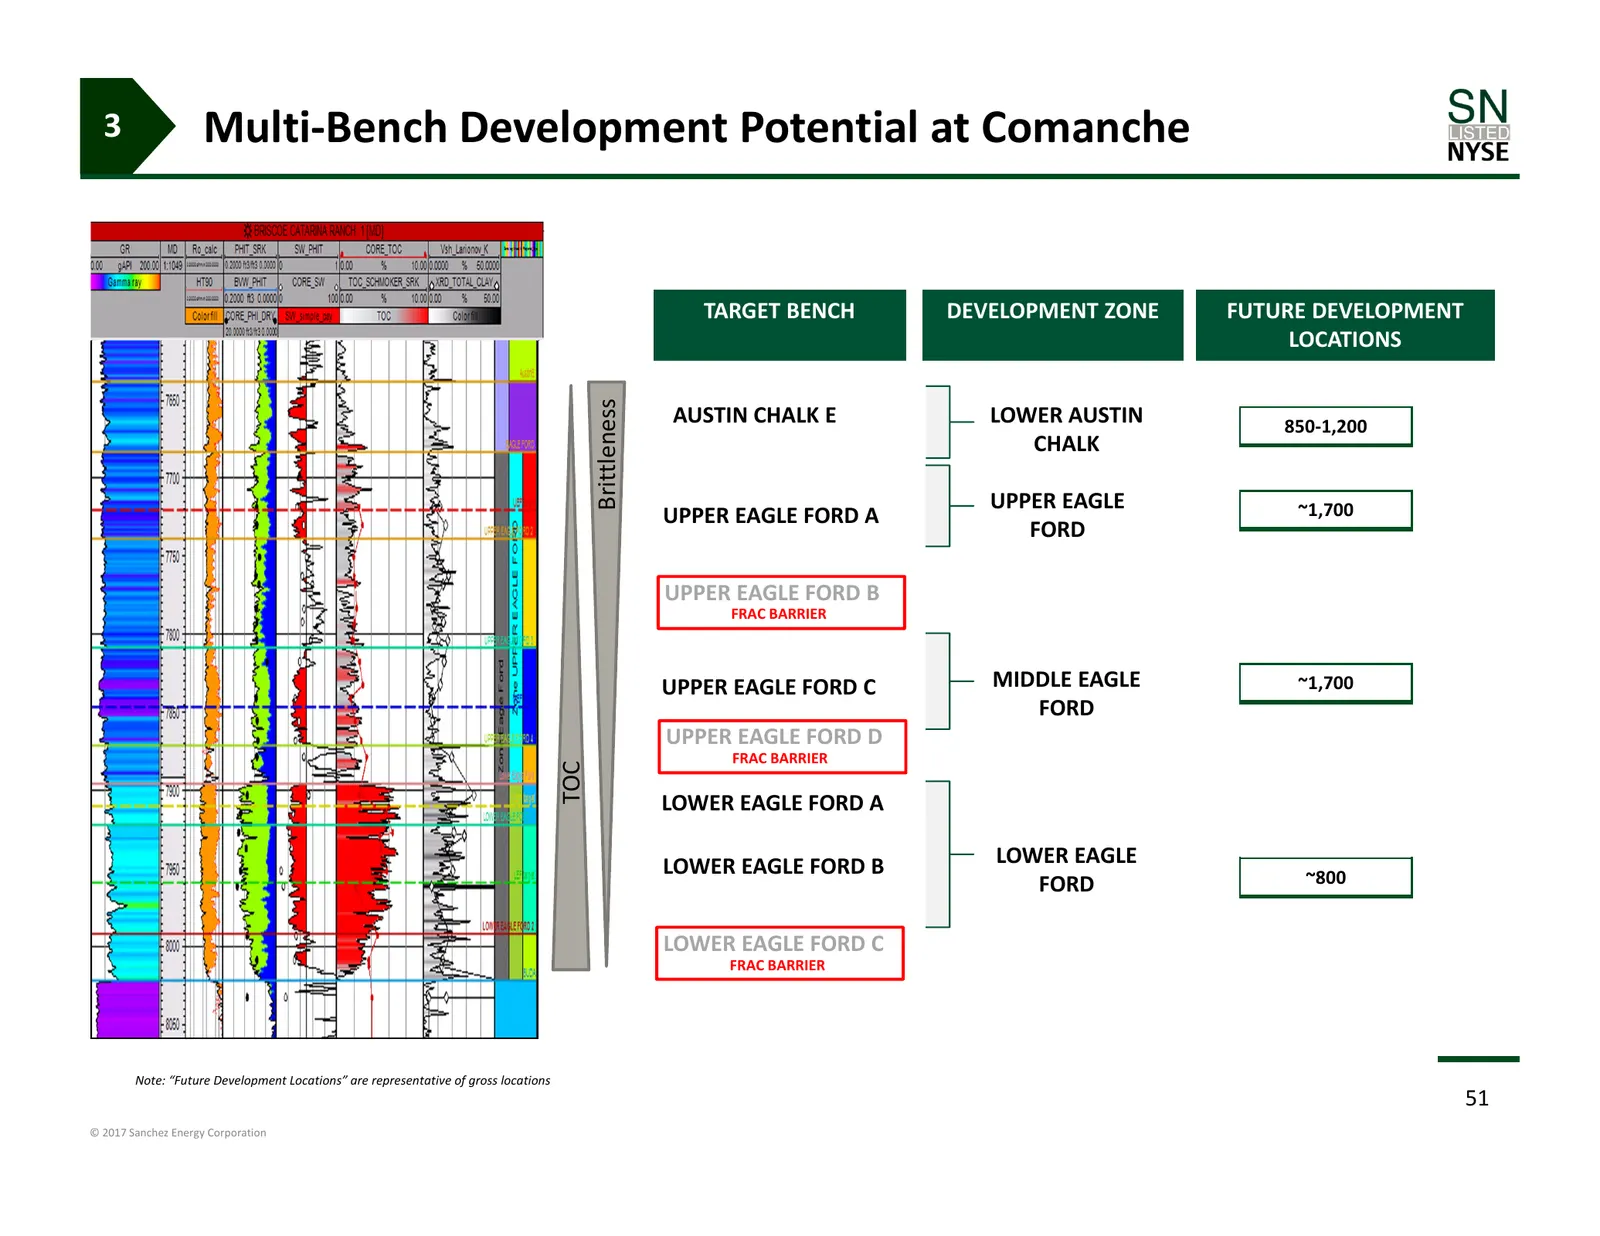
3 Multi‐Bench Development Potential at Comanche TARGET BENCH DEVELOPMENT ZONE FUTURE DEVELOPMENT LOCATIONS Brittleness AUSTIN CHALK E LOWER AUSTIN 850‐1,200 CHALK UPPER EAGLE ~1,700 UPPER EAGLE FORD A FORD UPPER EAGLE FORD B FRAC BARRIER UPPER EAGLE FORD C MIDDLE EAGLE ~1,700 FORD UPPER EAGLE FORD D
Slide 52: Comanche: Area 3 Asset Development
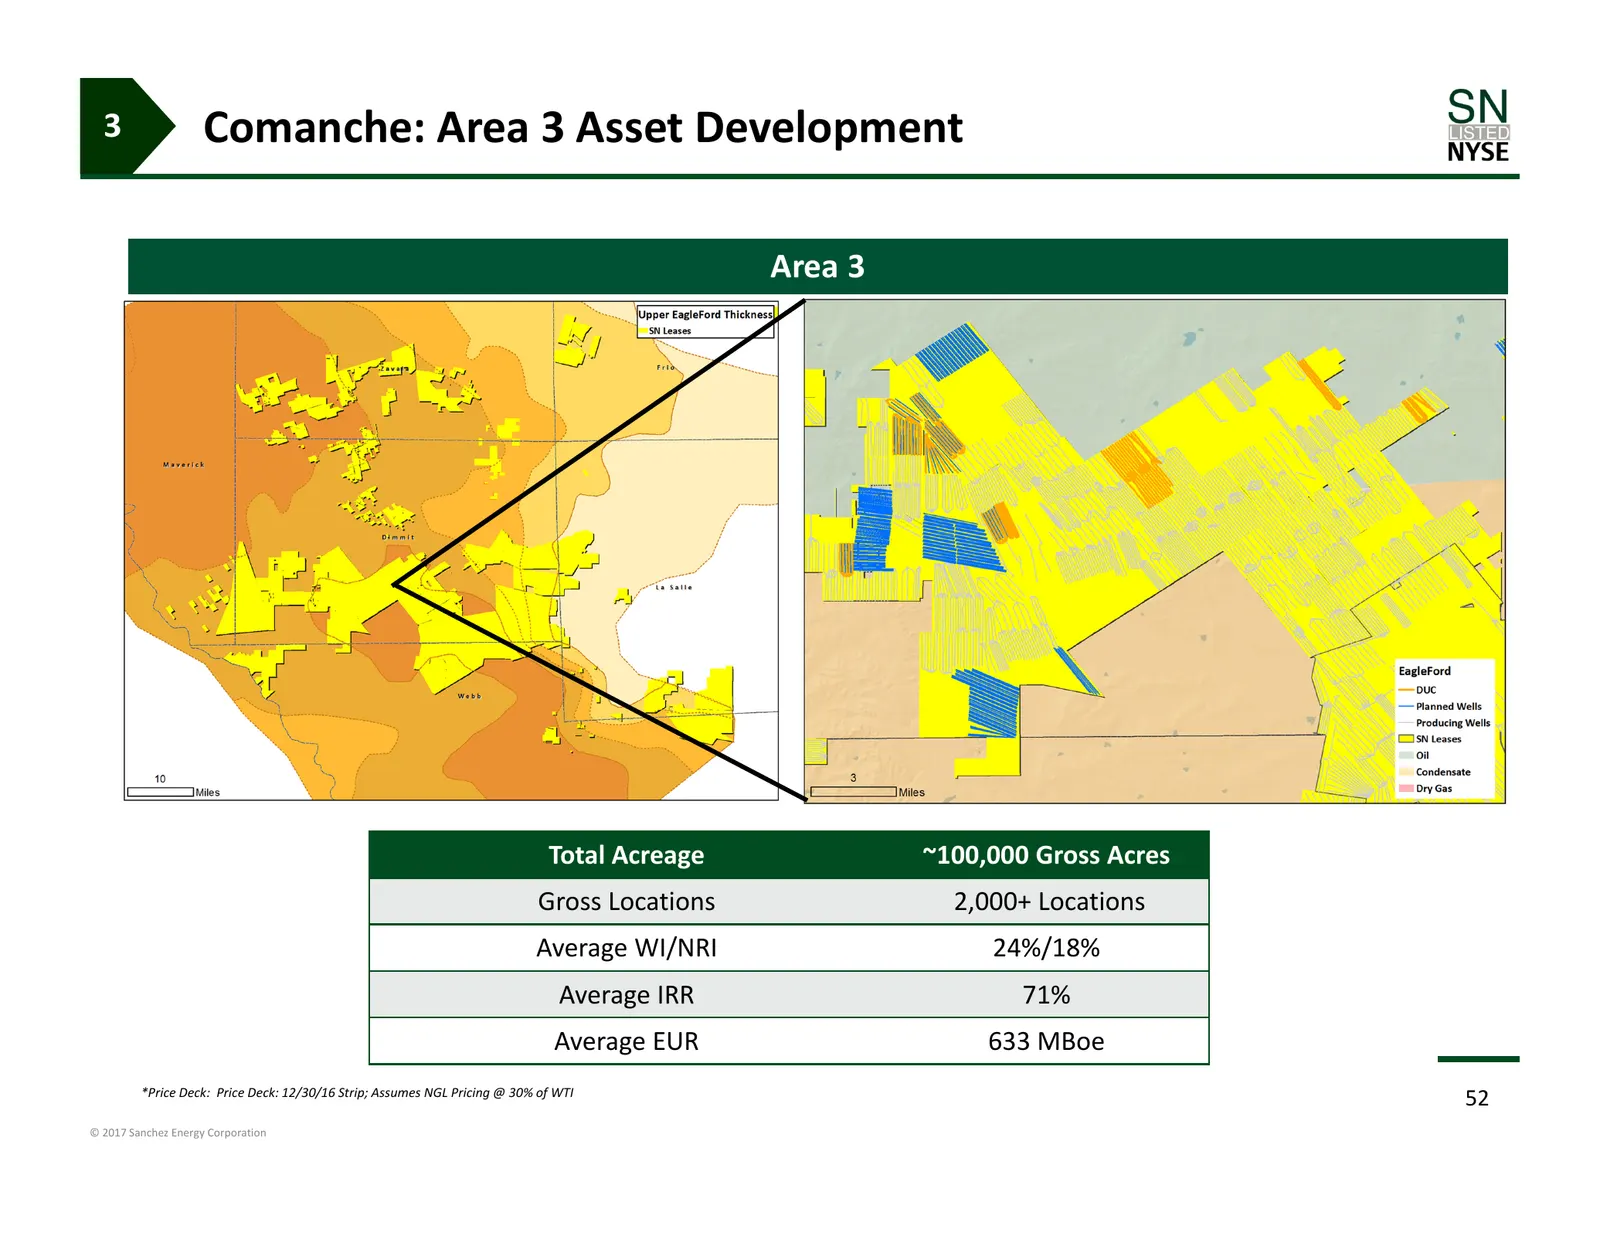
3 Comanche: Area 3 Asset Development Area 3 Total Acreage ~100,000 Gross Acres Gross Locations 2,000+ Locations Average WI/NRI 24%/18% Average IRR 71% Average EUR 633 MBoe *Price Deck: Price Deck: 12/30/16 Strip; Assumes NGL Pricing @ 30% of WTI 52 © 2017 Sanchez Energy Corporation
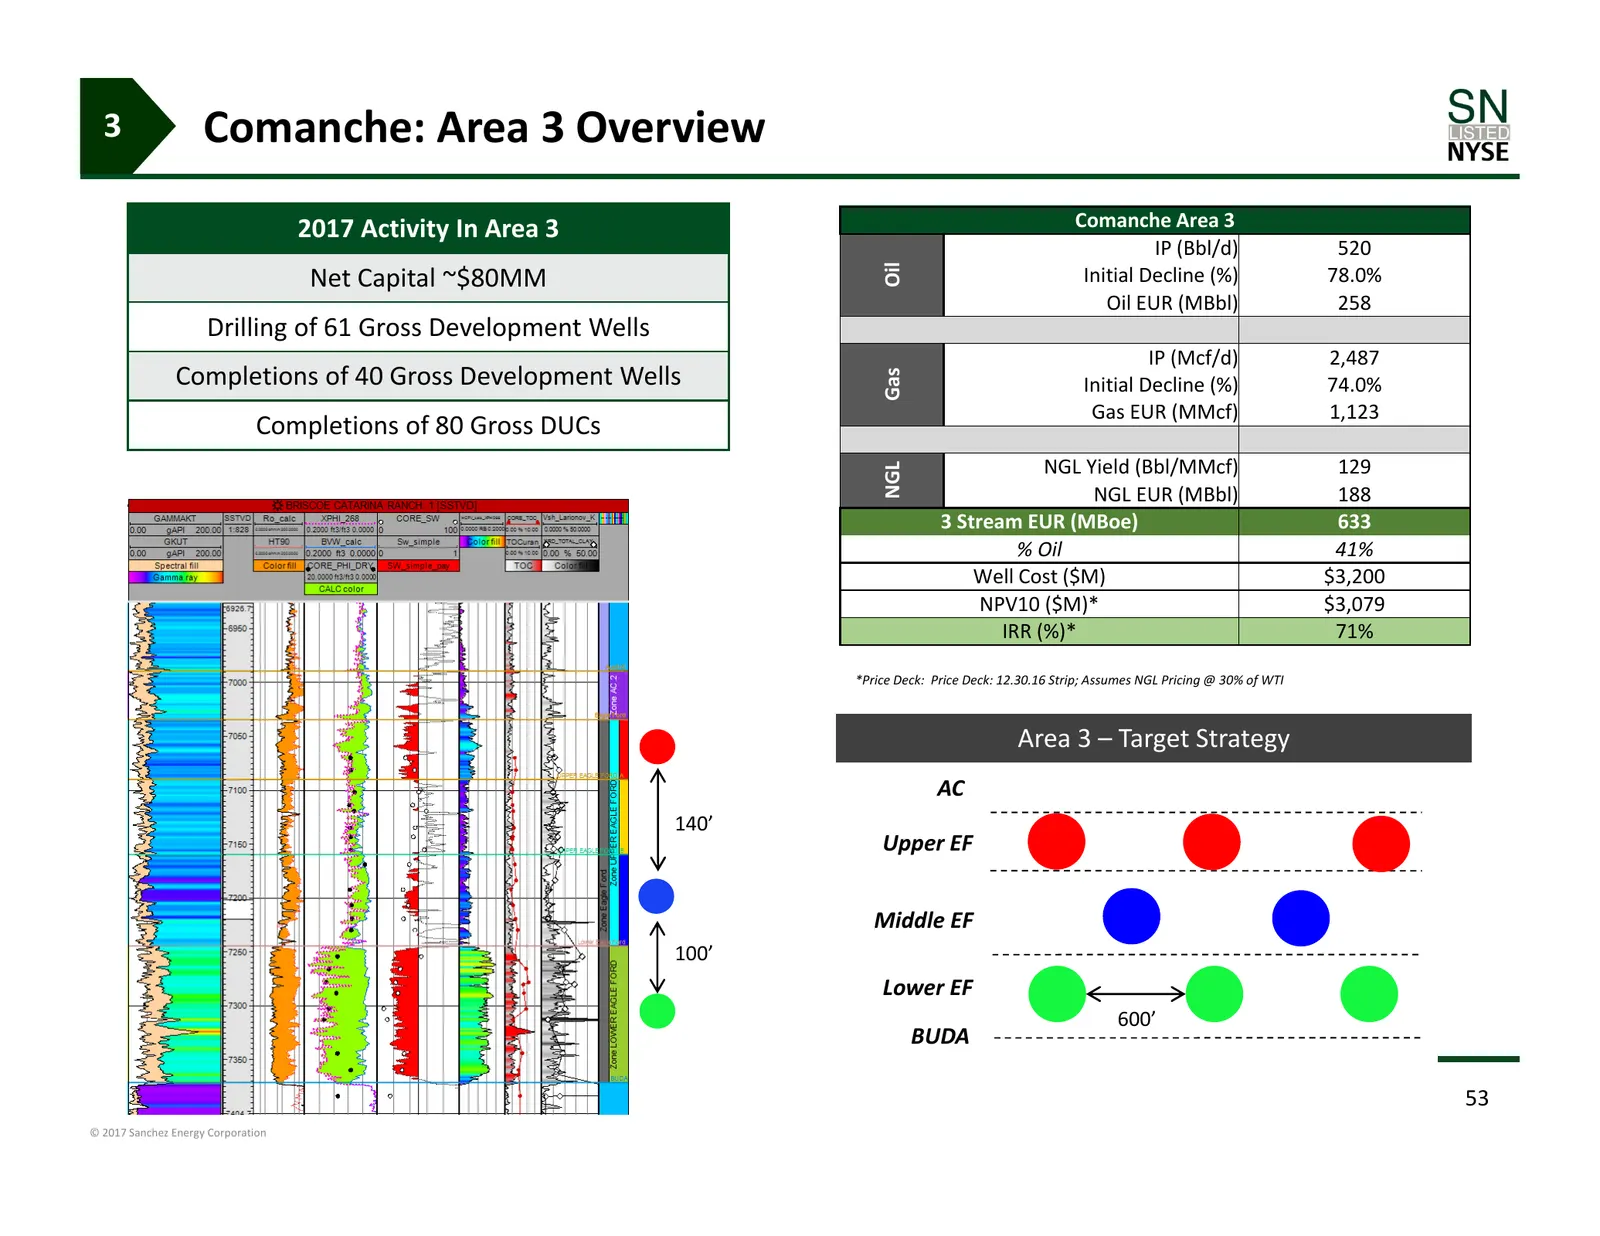
Slide 53: Comanche: Area 3 Overview
3 Comanche: Area 3 Overview 2017 Activity In Area 3 Comanche Area 3 IP (Bbl/d) 520 Oil Net Capital ~$80MM Initial Decline (%) 78.0% Oil EUR (MBbl) 258 Drilling of 61 Gross Development Wells IP (Mcf/d) 2,487 Completions of 40 Gross Development Wells Gas Initial Decline (%) 74.0% Gas EUR (MMcf) 1,123
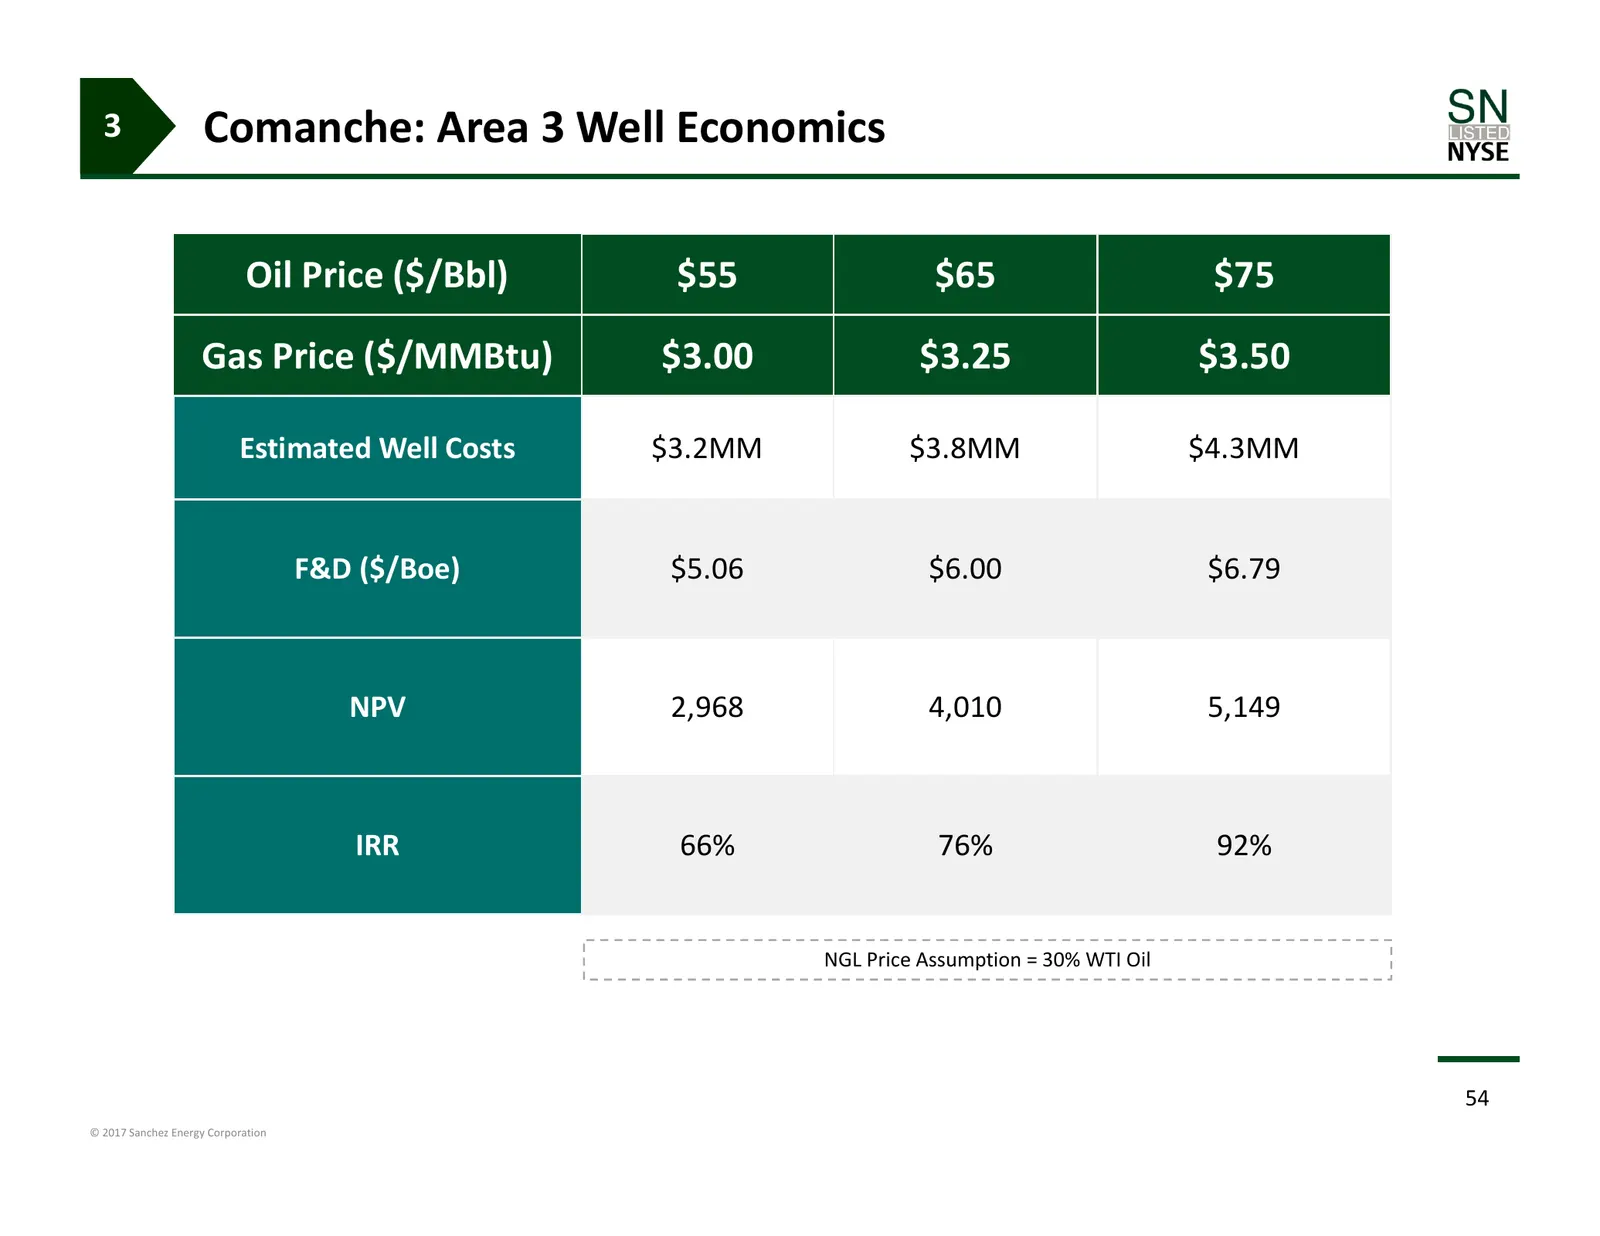
Slide 54: Comanche: Area 3 Well Economics
3 Comanche: Area 3 Well Economics Oil Price ($/Bbl) $55 $65 $75 Gas Price ($/MMBtu) $3.00 $3.25 $3.50 Estimated Well Costs $3.2MM $3.8MM $4.3MM F&D ($/Boe) $5.06 $6.00 $6.79 NPV 2,968 4,010 5,149 IRR 66% 76% 92% NGL Price Assumption = 30% WTI Oil 54 © 2017 Sanchez Energy Corporation
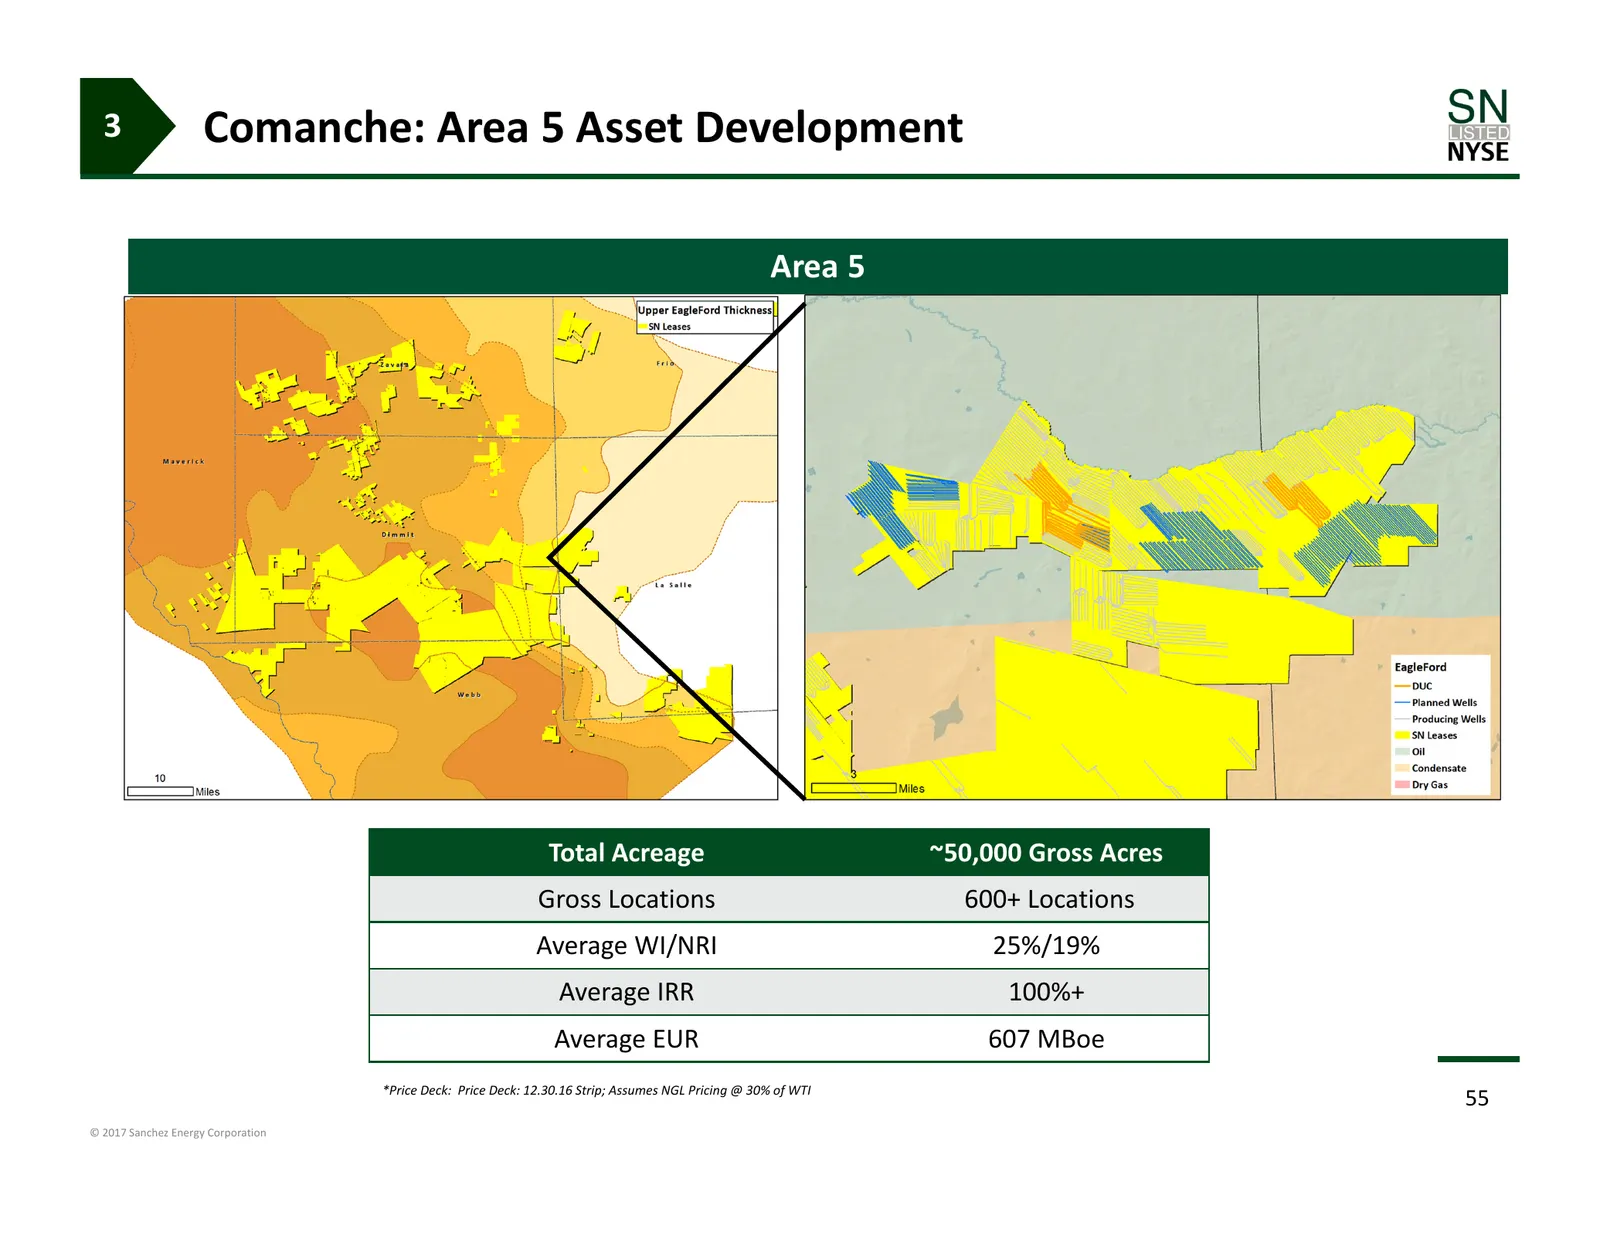
Slide 55: Comanche: Area 5 Asset Development
3 Comanche: Area 5 Asset Development Area 5 Total Acreage ~50,000 Gross Acres Gross Locations 600+ Locations Average WI/NRI 25%/19% Average IRR 100%+ Average EUR 607 MBoe *Price Deck: Price Deck: 12.30.16 Strip; Assumes NGL Pricing @ 30% of WTI 55 © 2017 Sanchez Energy Corporation
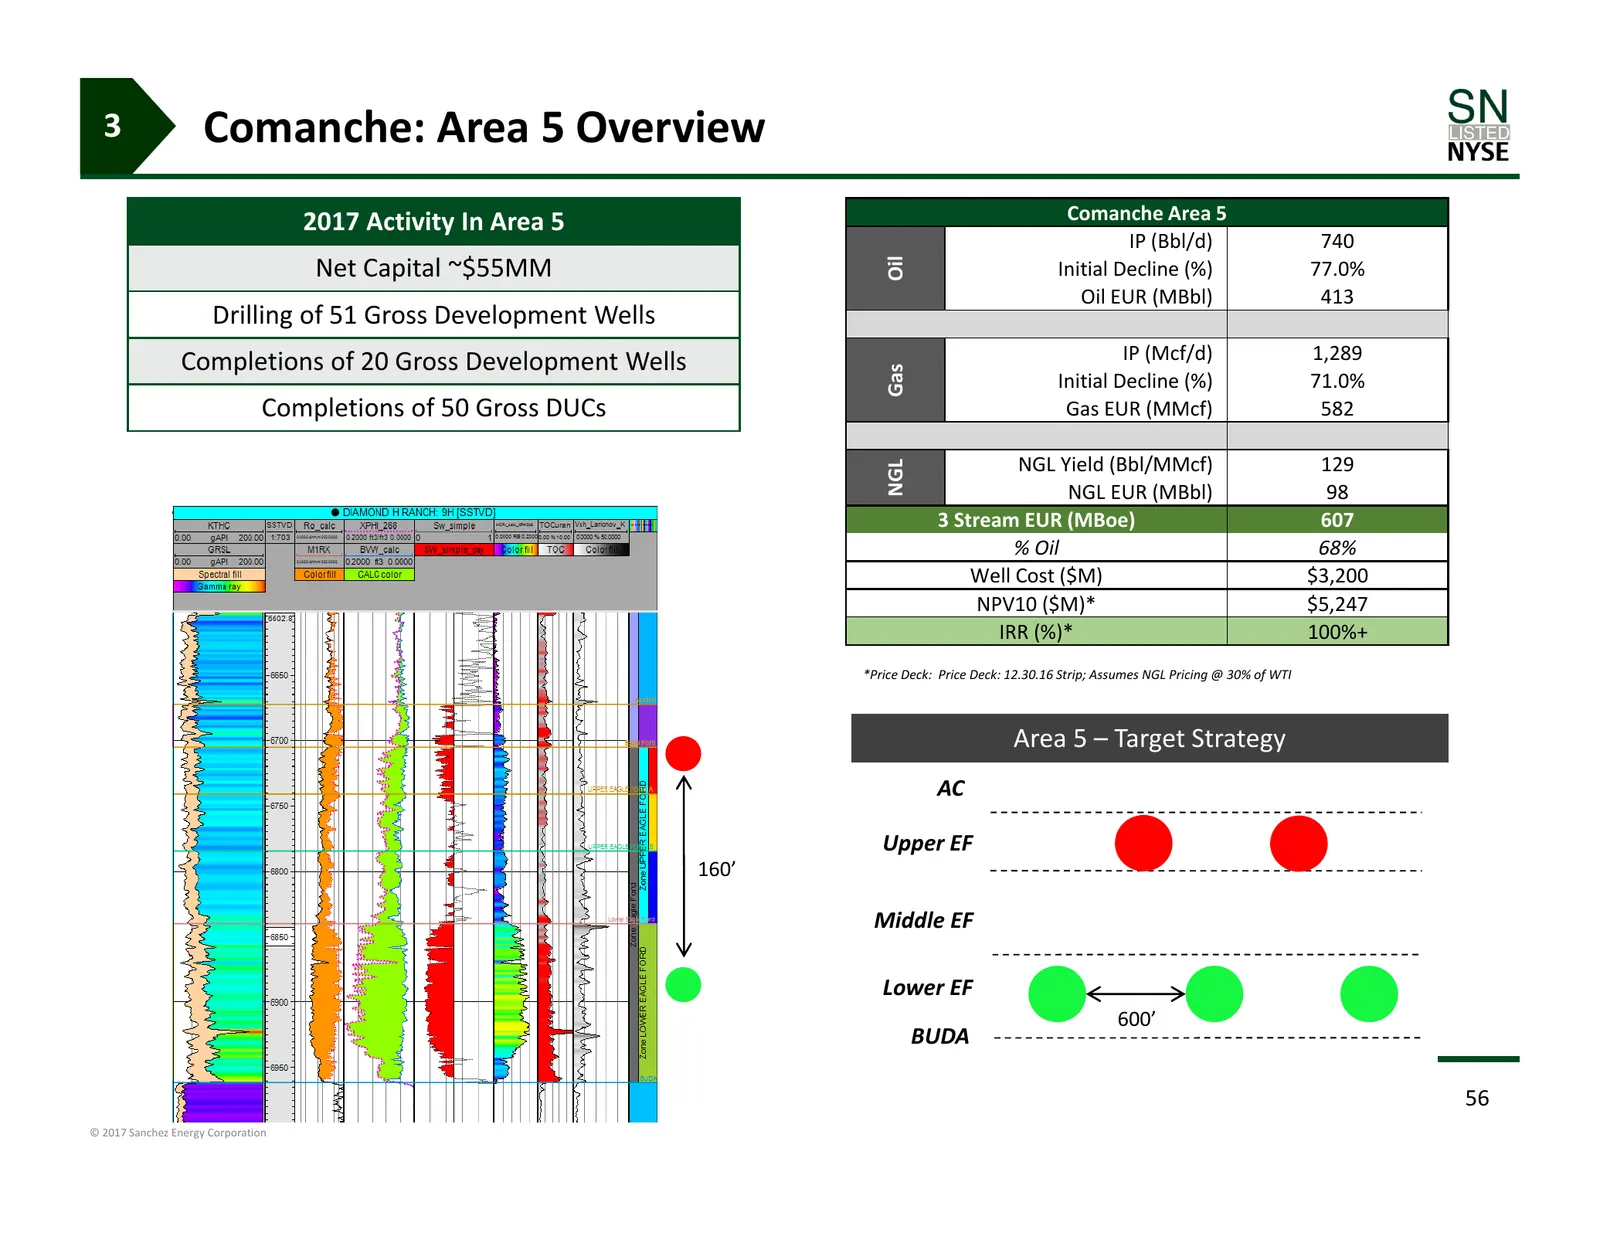
Slide 56: Comanche: Area 5 Overview
3 Comanche: Area 5 Overview 2017 Activity In Area 5 Comanche Area 5 IP (Bbl/d) 740 Oil Net Capital ~$55MM Initial Decline (%) 77.0% Oil EUR (MBbl) 413 Drilling of 51 Gross Development Wells Completions of 20 Gross Development Wells IP (Mcf/d) 1,289 Gas Initial Decline (%) 71.0% Completions of 50 Gro
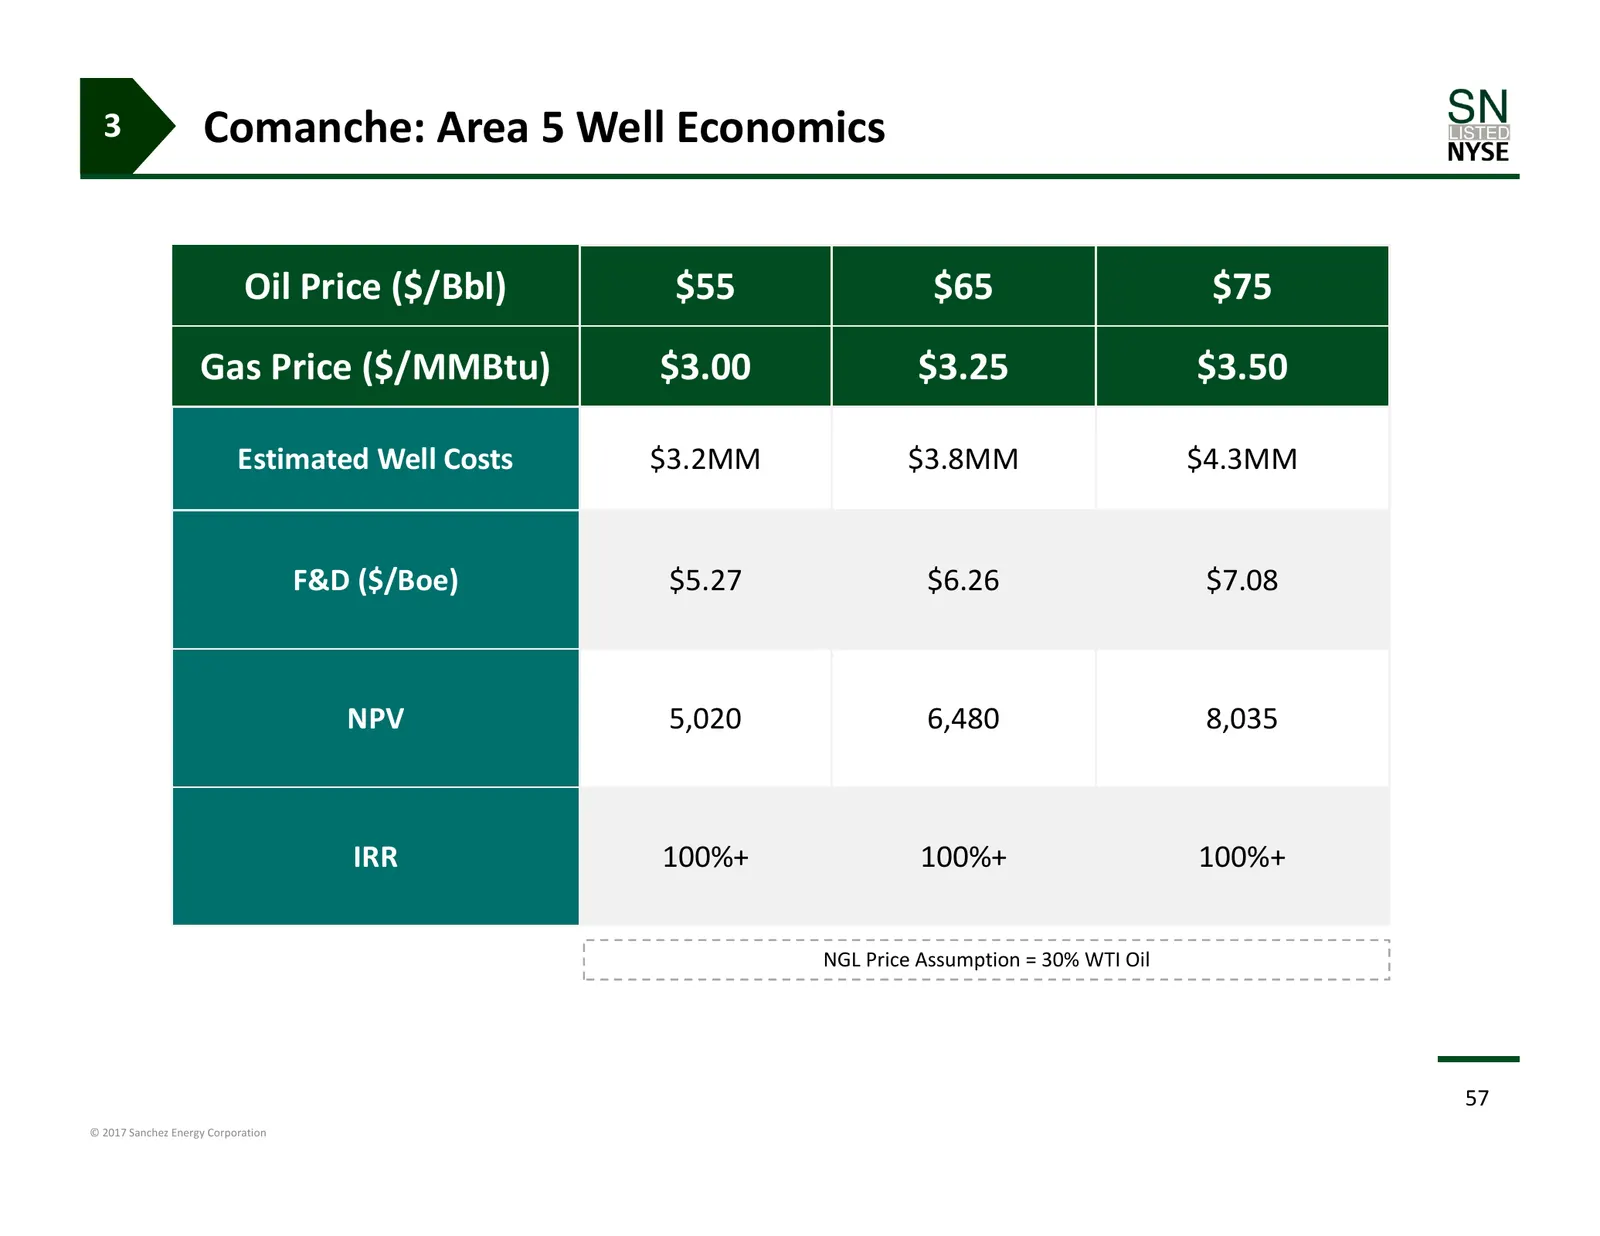
Slide 57: Comanche: Area 5 Well Economics
3 Comanche: Area 5 Well Economics Oil Price ($/Bbl) $55 $65 $75 Gas Price ($/MMBtu) $3.00 $3.25 $3.50 Estimated Well Costs $3.2MM $3.8MM $4.3MM F&D ($/Boe) $5.27 $6.26 $7.08 NPV 5,020 6,480 8,035 IRR 100%+ 100%+ 100%+ NGL Price Assumption = 30% WTI Oil 57 © 2017 Sanchez Energy Corporation
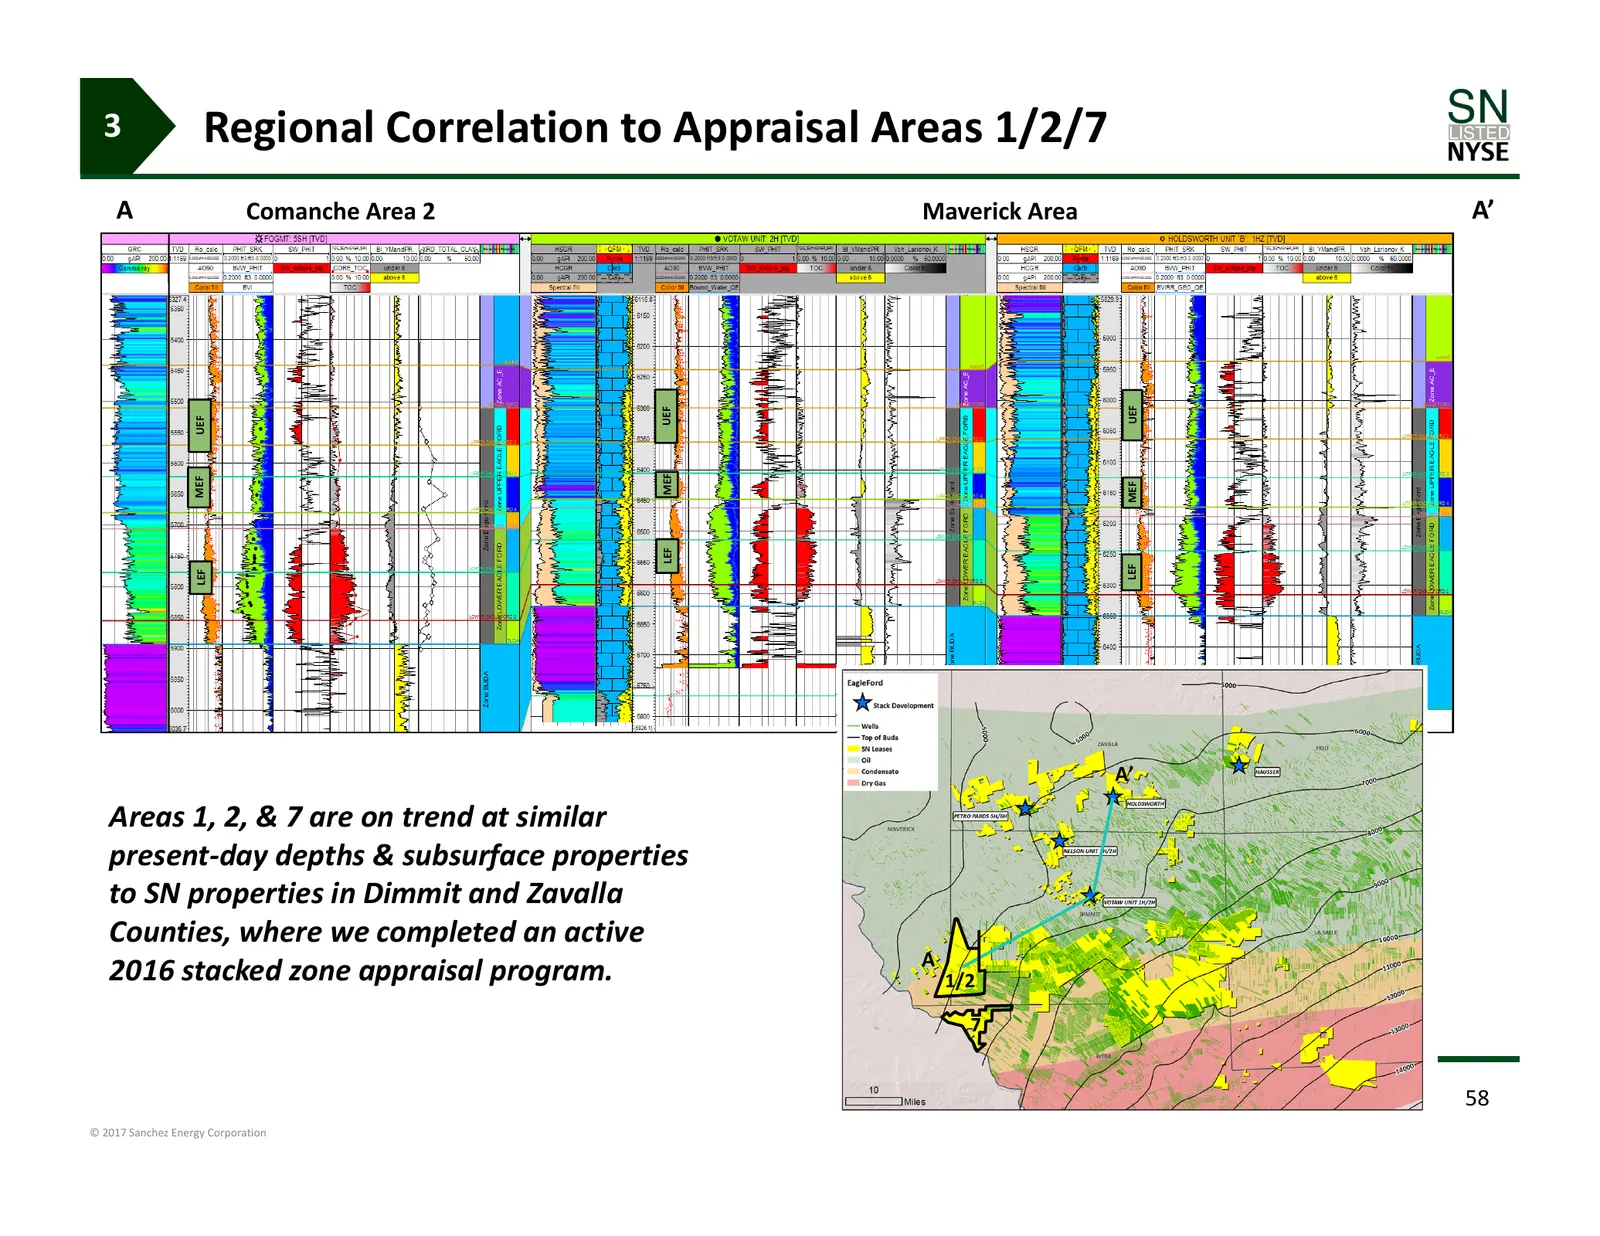
Slide 58: Regional Correlation to Appraisal Areas 1/2/7
3 Regional Correlation to Appraisal Areas 1/2/7 A Comanche Area 2 Maverick Area A’ UEF UEF UEF MEF MEF MEF LEF LEF LEF A’ Areas 1, 2, & 7 are on trend at similar present‐day depths & subsurface properties to SN properties in Dimmit and Zavalla Counties, where we completed an active A 2016 stacked zo
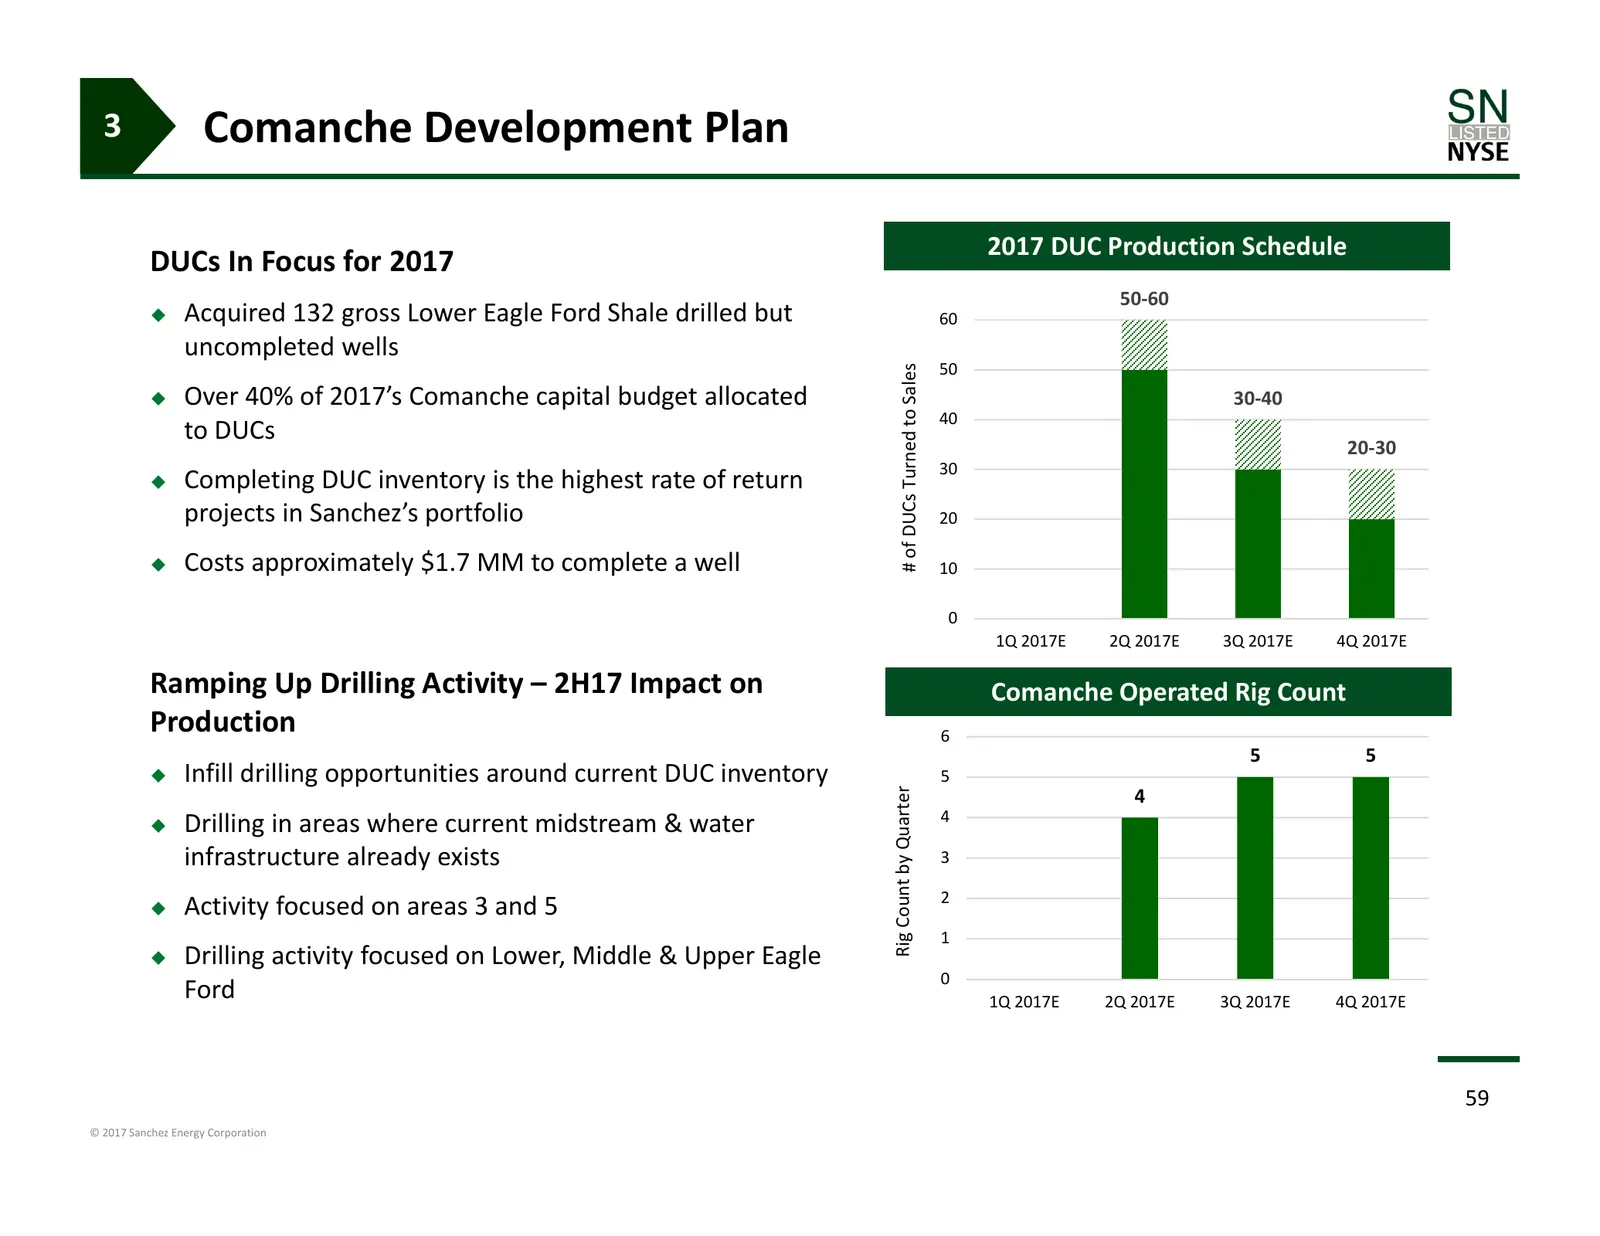
Slide 59: Comanche Development Plan
3 Comanche Development Plan 2017 DUC Production Schedule DUCs In Focus for 2017 50‐60 Acquired 132 gross Lower Eagle Ford Shale drilled but 60 uncompleted wells 50 # of DUCs Turned to Sales Over 40% of 2017’s Comanche capital budget allocated 30‐40 40 to DUCs 20‐30 30 Completing DUC inventory
Slide 60: Catarina
Catarina 60 © 2017 Sanchez Energy Corporation
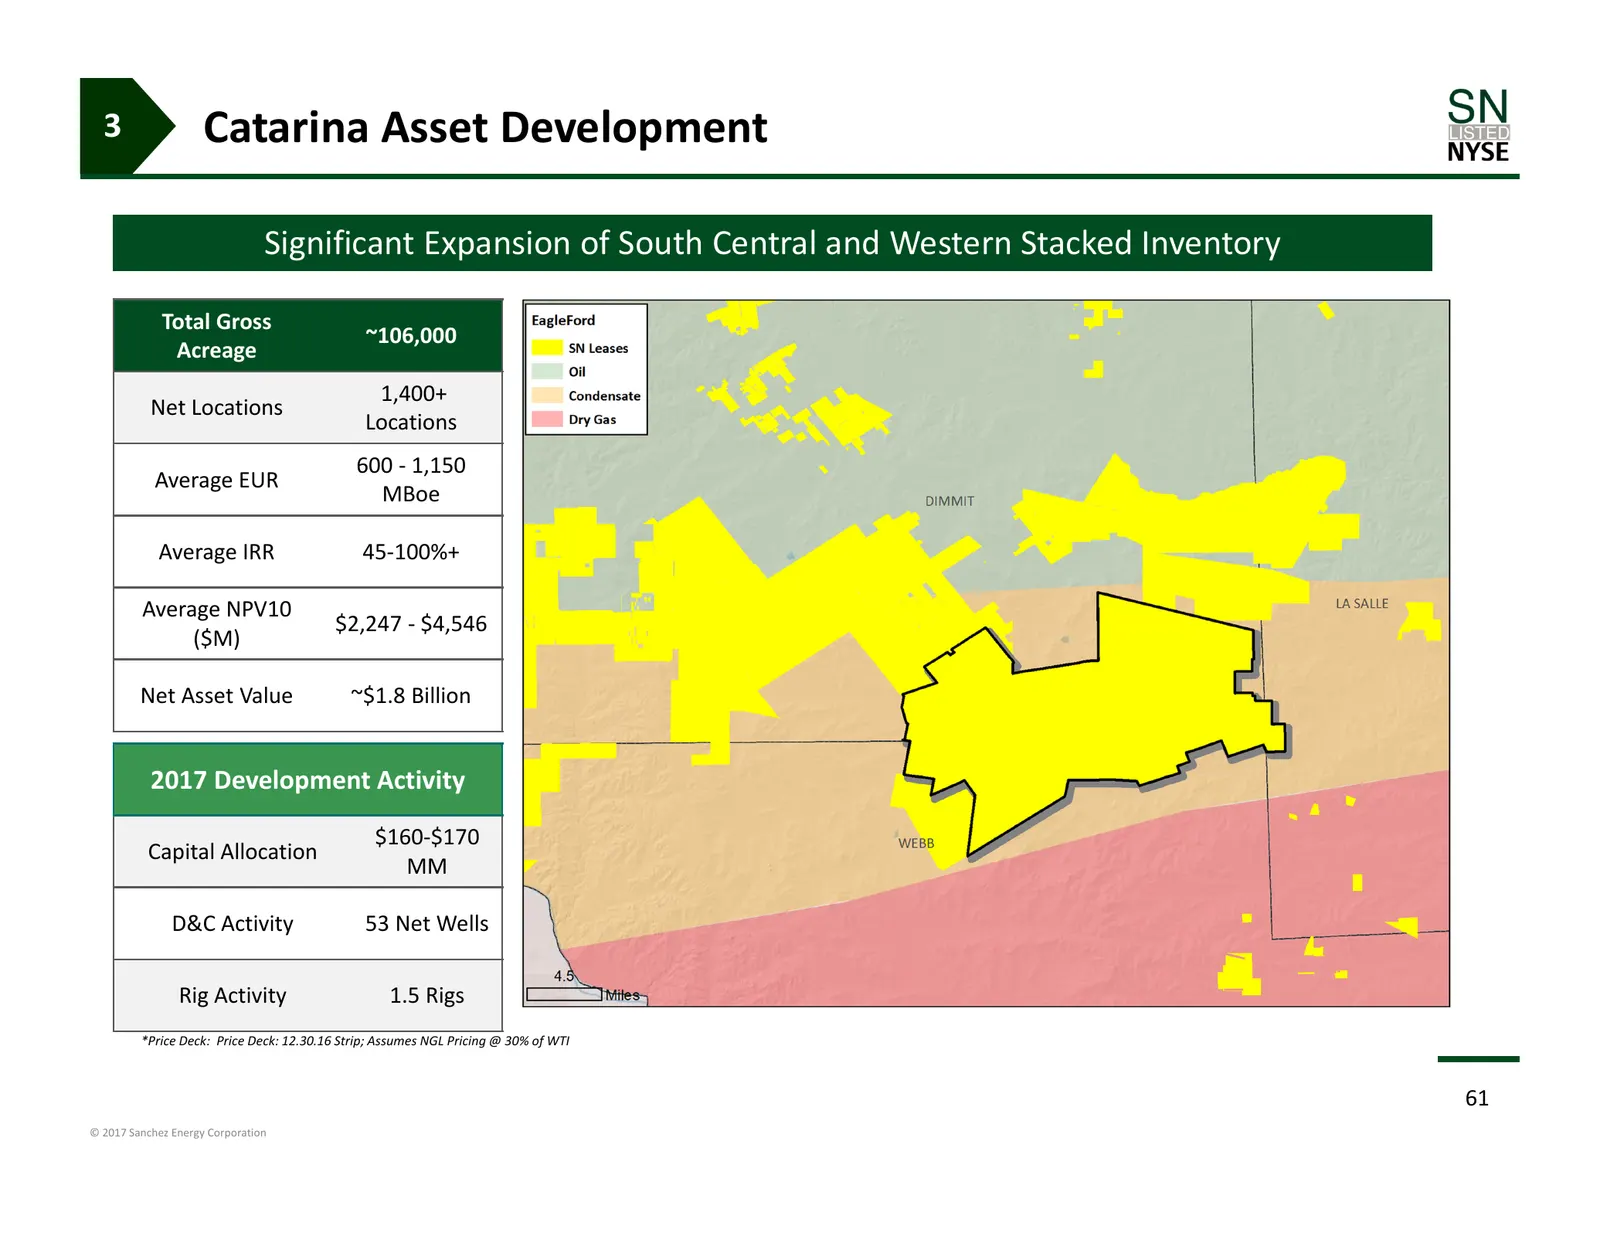
Slide 61: Catarina Asset Development
3 Catarina Asset Development Significant Expansion of South Central and Western Stacked Inventory Total Gross ~106,000 Acreage 1,400+ Net Locations Locations 600 ‐ 1,150 Average EUR MBoe Average IRR 45‐100%+ Average NPV10 $2,247 ‐ $4,546 ($M) Net Asset Value ~$1.8 Billion 2017 Development Activity $
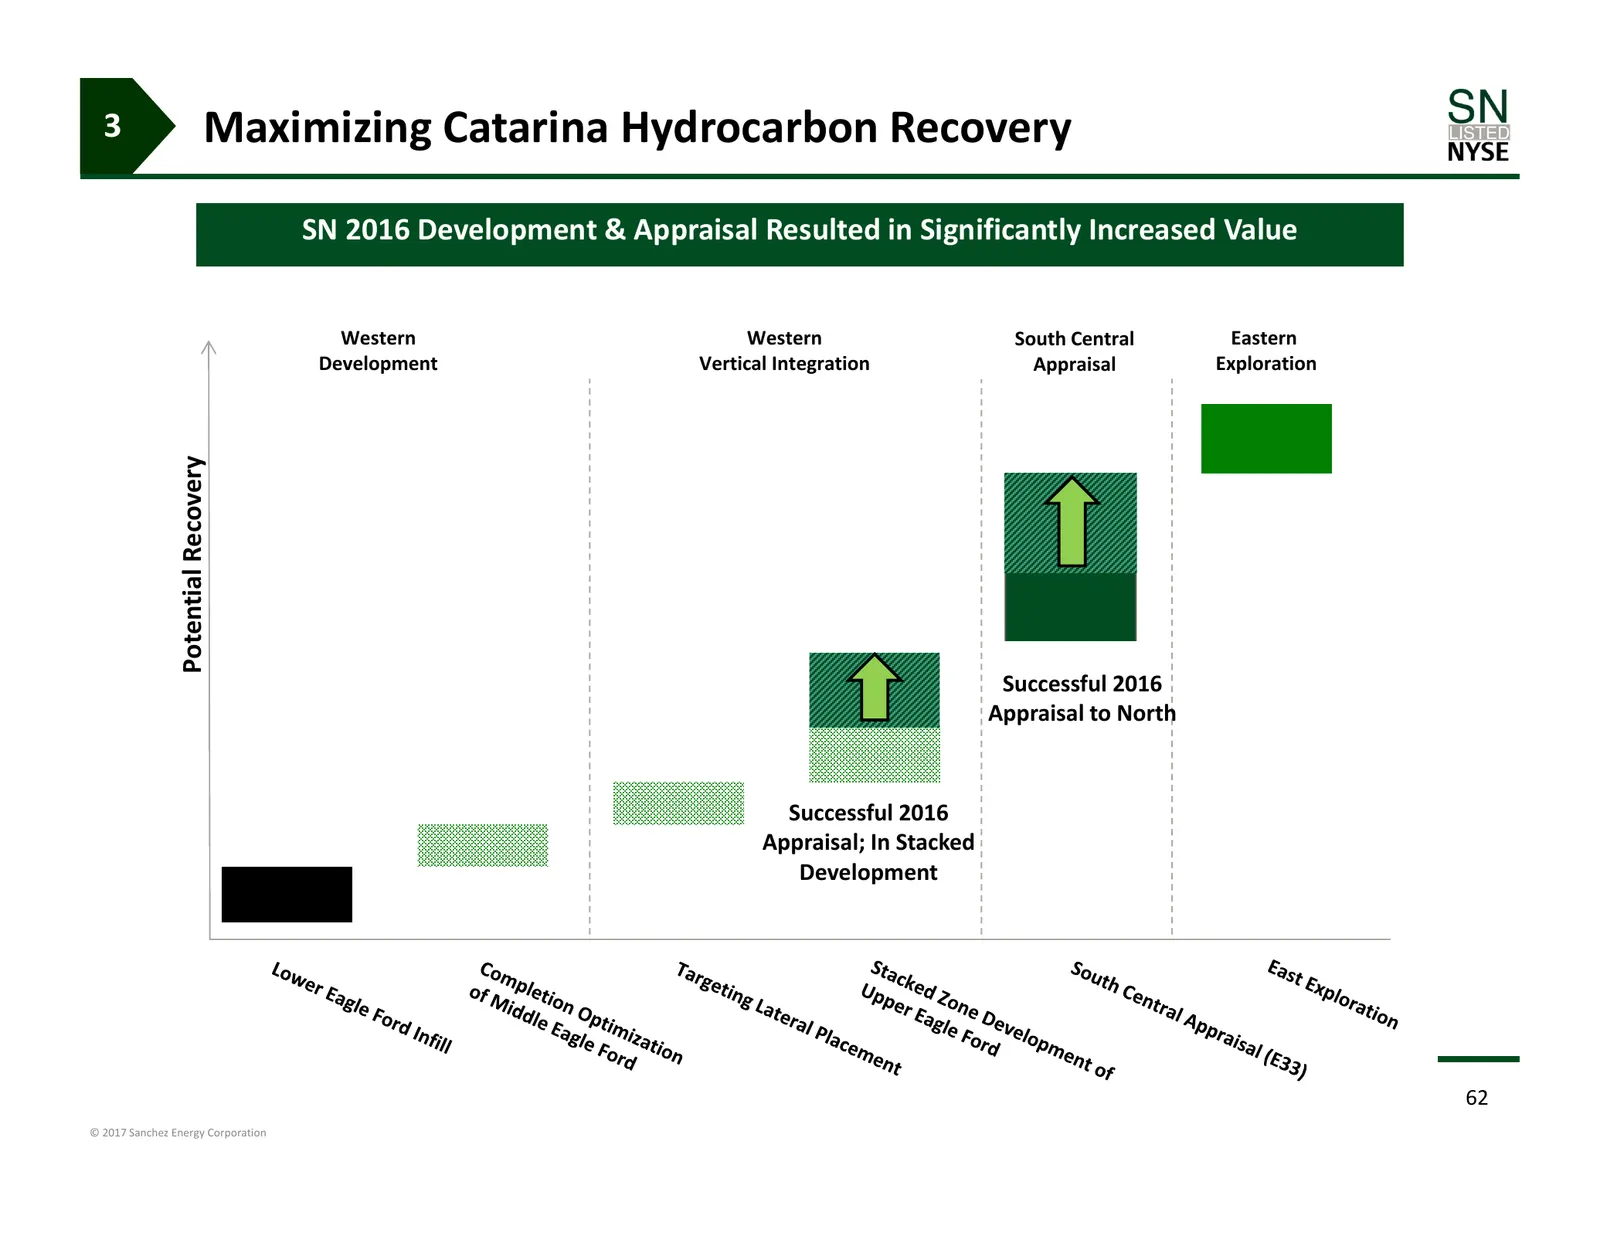
Slide 62: Maximizing Catarina Hydrocarbon Recovery
3 Maximizing Catarina Hydrocarbon Recovery SN 2016 Development & Appraisal Resulted in Significantly Increased Value Western Western South Central Eastern Development Vertical Integration Appraisal Exploration Potential Recovery Successful 2016 Appraisal to North Successful 2016 Appraisal; In Stacke
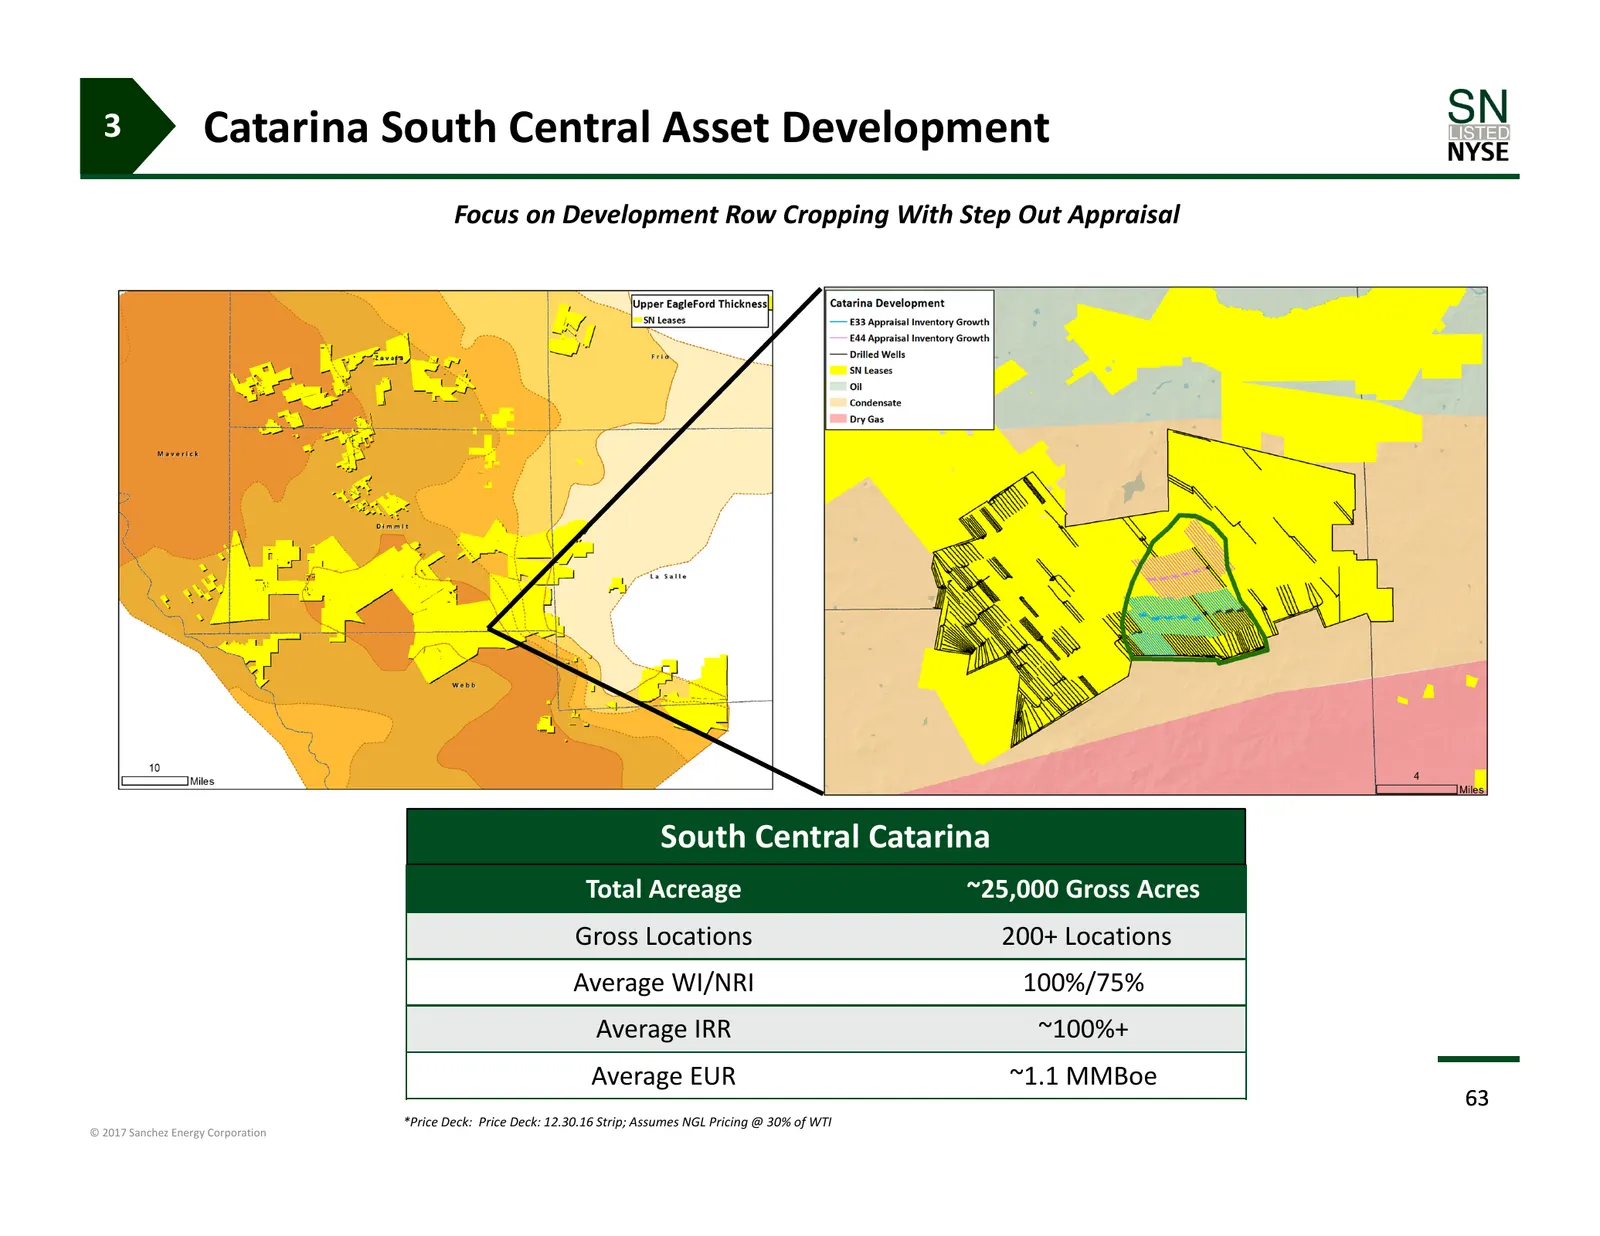
Slide 63: Catarina South Central Asset Development
3 Catarina South Central Asset Development Focus on Development Row Cropping With Step Out Appraisal South Central Catarina Total Acreage ~25,000 Gross Acres Gross Locations 200+ Locations Average WI/NRI 100%/75% Average IRR ~100%+ Average EUR ~1.1 MMBoe 63 *Price Deck: Price Deck: 12.30.16 Strip; A
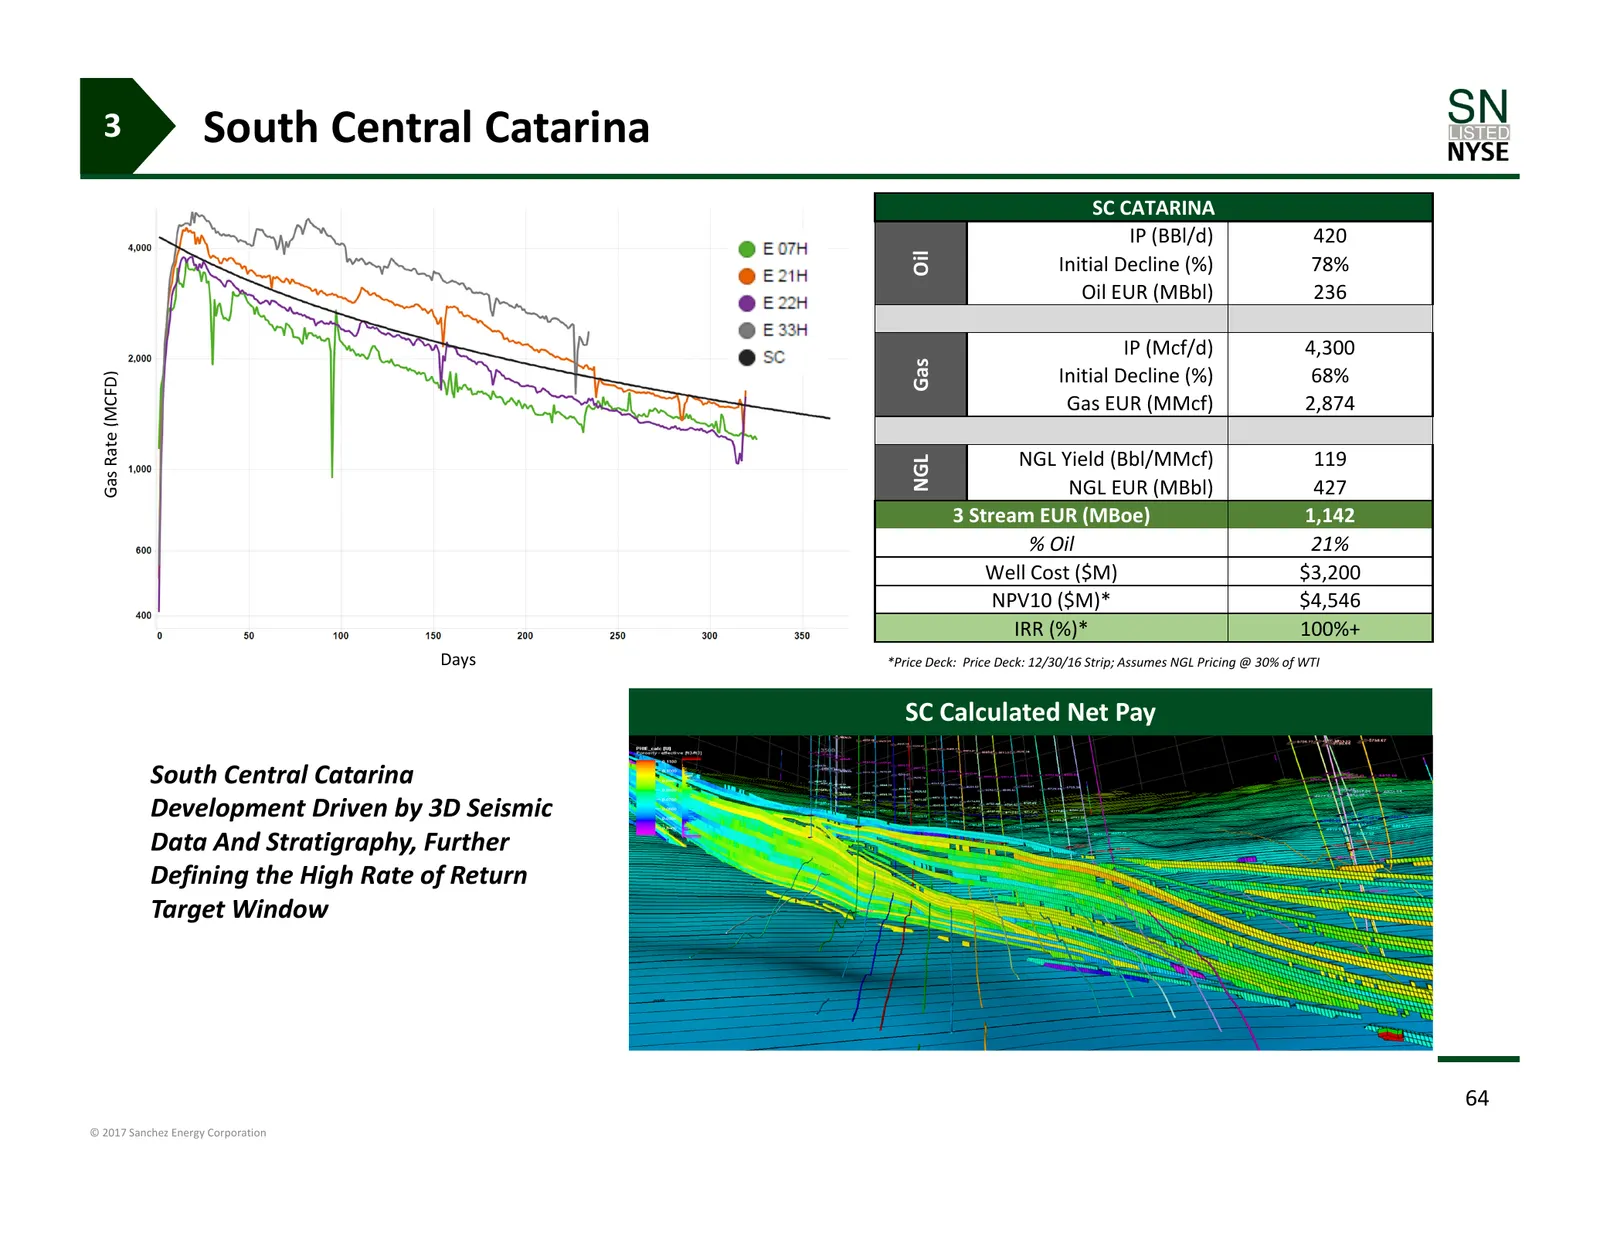
Slide 64: South Central Catarina
3 South Central Catarina SC CATARINA IP (BBl/d) 420 Oil Initial Decline (%) 78% Oil EUR (MBbl) 236 IP (Mcf/d) 4,300 Gas Initial Decline (%) 68% Gas Rate (MCFD) Gas EUR (MMcf) 2,874 NGL Yield (Bbl/MMcf) 119 NGL NGL EUR (MBbl) 427 3 Stream EUR (MBoe) 1,142 % Oil 21% Well Cost ($M) $3,200 NPV10 ($M)* $
Slide 65: South Central Delineation & Expansion
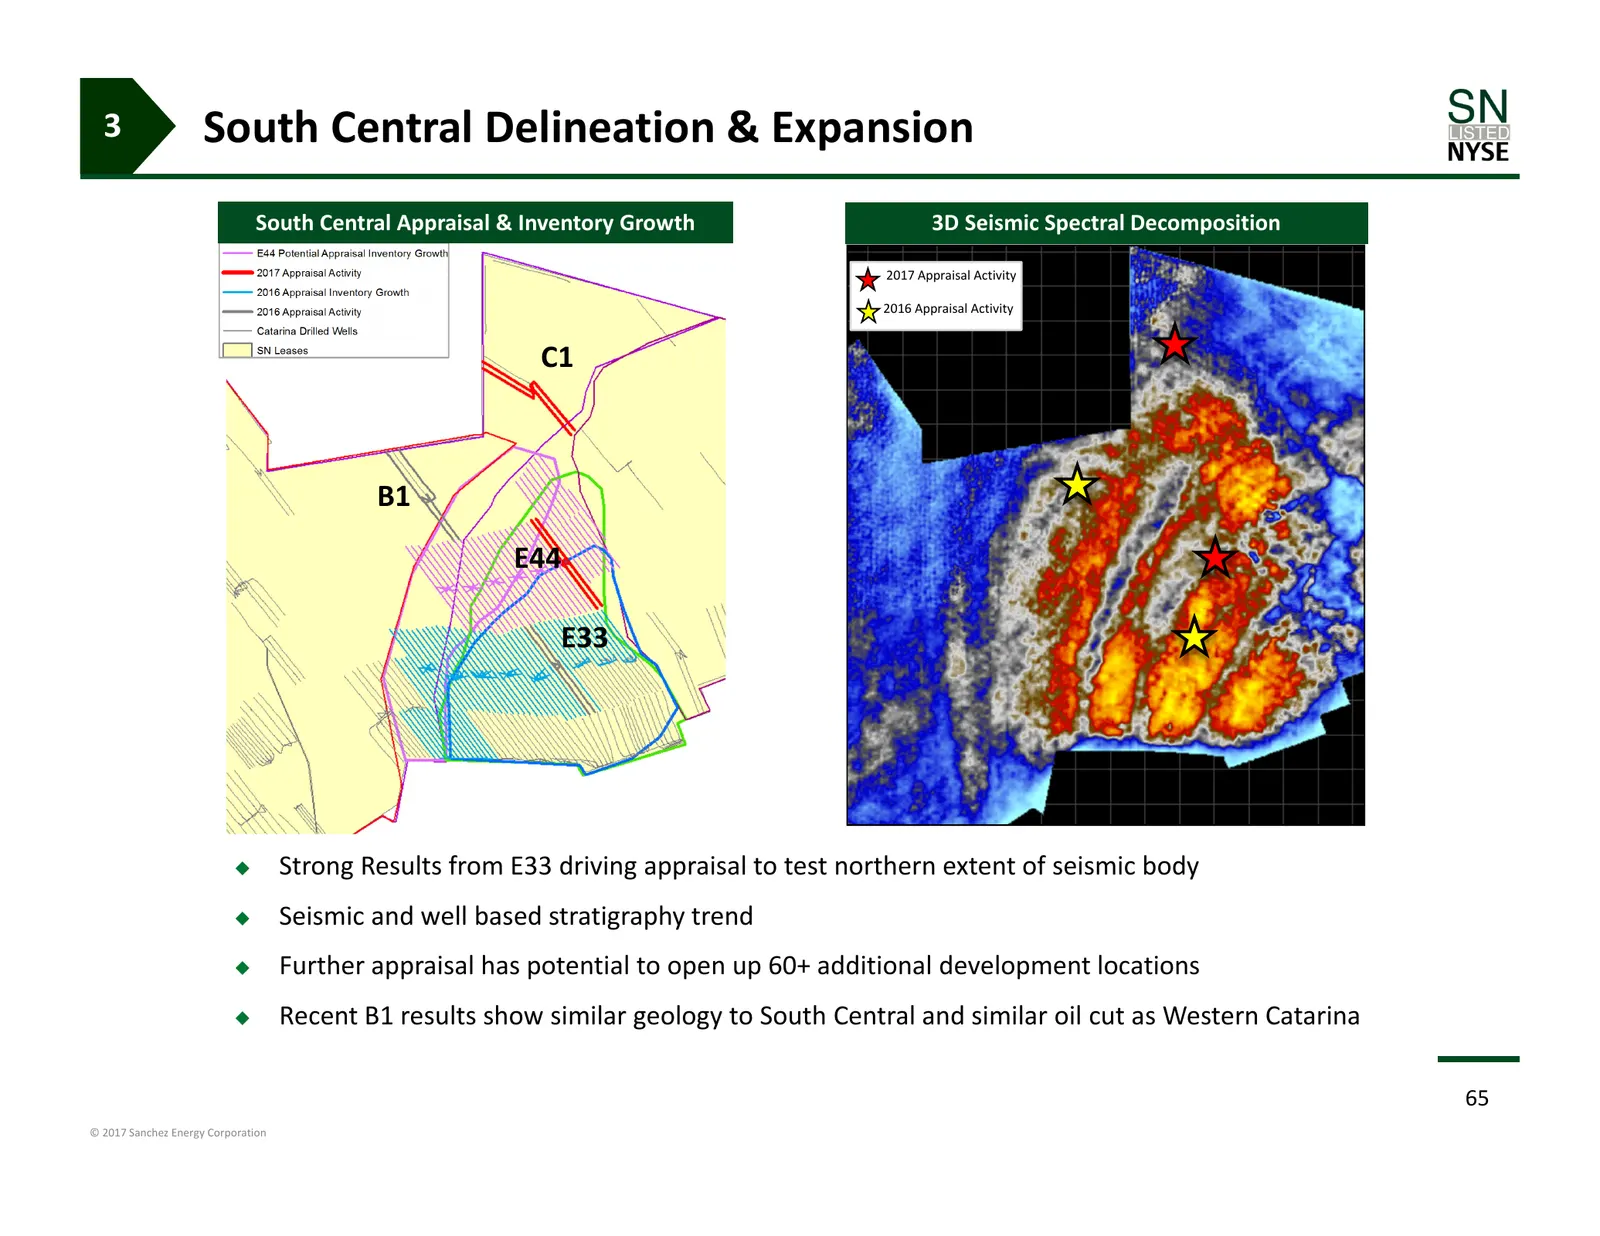
3 South Central Delineation & Expansion 3DSouth Central Seismic Appraisal Spectral & Inventory Growth Decomposition 3D3D Seismic SeismicSpectral SpectralDecomposition Decomposition 2017 Appraisal Activity 2016 Appraisal Activity C1 B1 E44 E33 Strong Results from E33 driving appraisal to test north
Slide 66: 2016 Catarina Appraisal Results
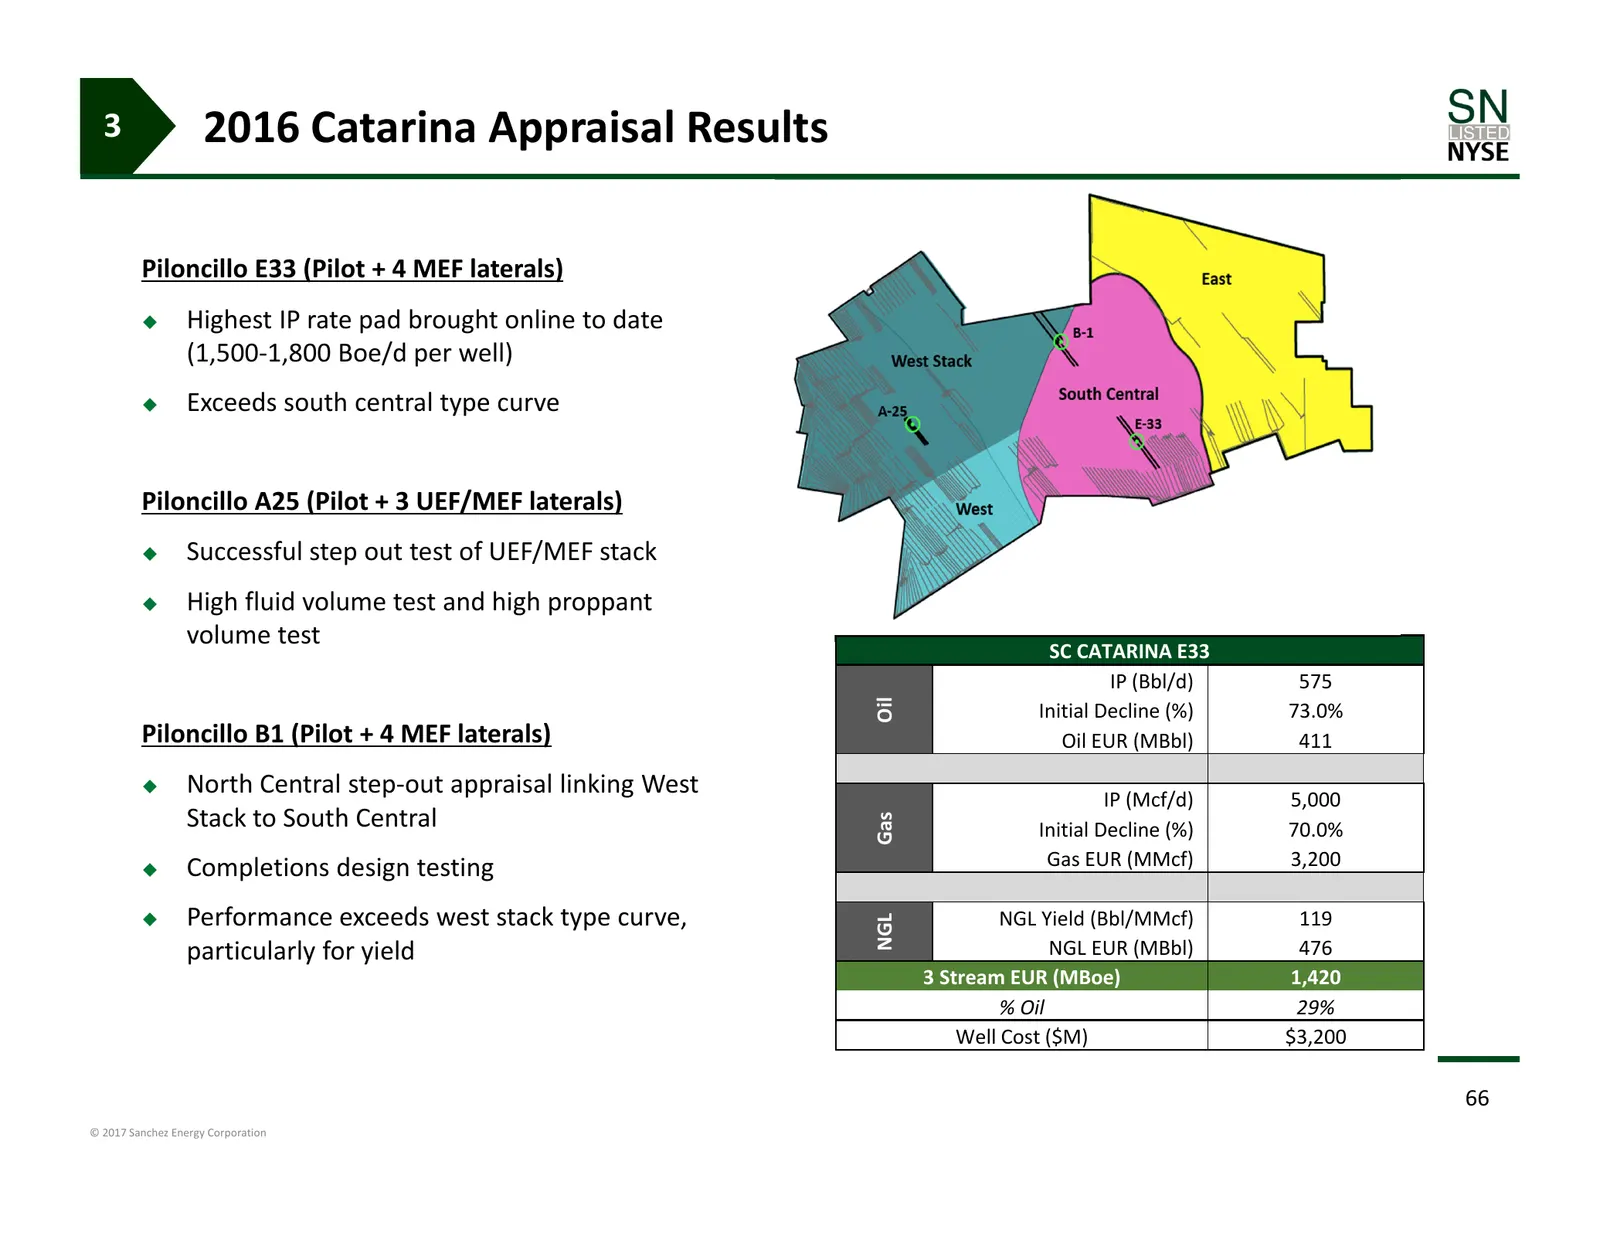
3 2016 Catarina Appraisal Results Piloncillo E33 (Pilot + 4 MEF laterals) Highest IP rate pad brought online to date (1,500‐1,800 Boe/d per well) Exceeds south central type curve Piloncillo A25 (Pilot + 3 UEF/MEF laterals) Successful step out test of UEF/MEF stack High fluid volume test and
Slide 67: South Central Catarina Well Economics
3 South Central Catarina Well Economics Oil Price ($/Bbl) $55 $65 $75 Gas Price ($/MMBtu) $3.00 $3.25 $3.50 Estimated Well Costs $3.2MM $3.8MM $4.3MM F&D ($/Boe) $2.80 $3.33 $3.77 NPV $4,026M $5,283M $6,640M IRR 86% 95% 100%+ NGL Price Assumption = 30% WTI Oil 67 © 2017 Sanchez Energy Corporation
Slide 68: Western Catarina Multi-Bench Development
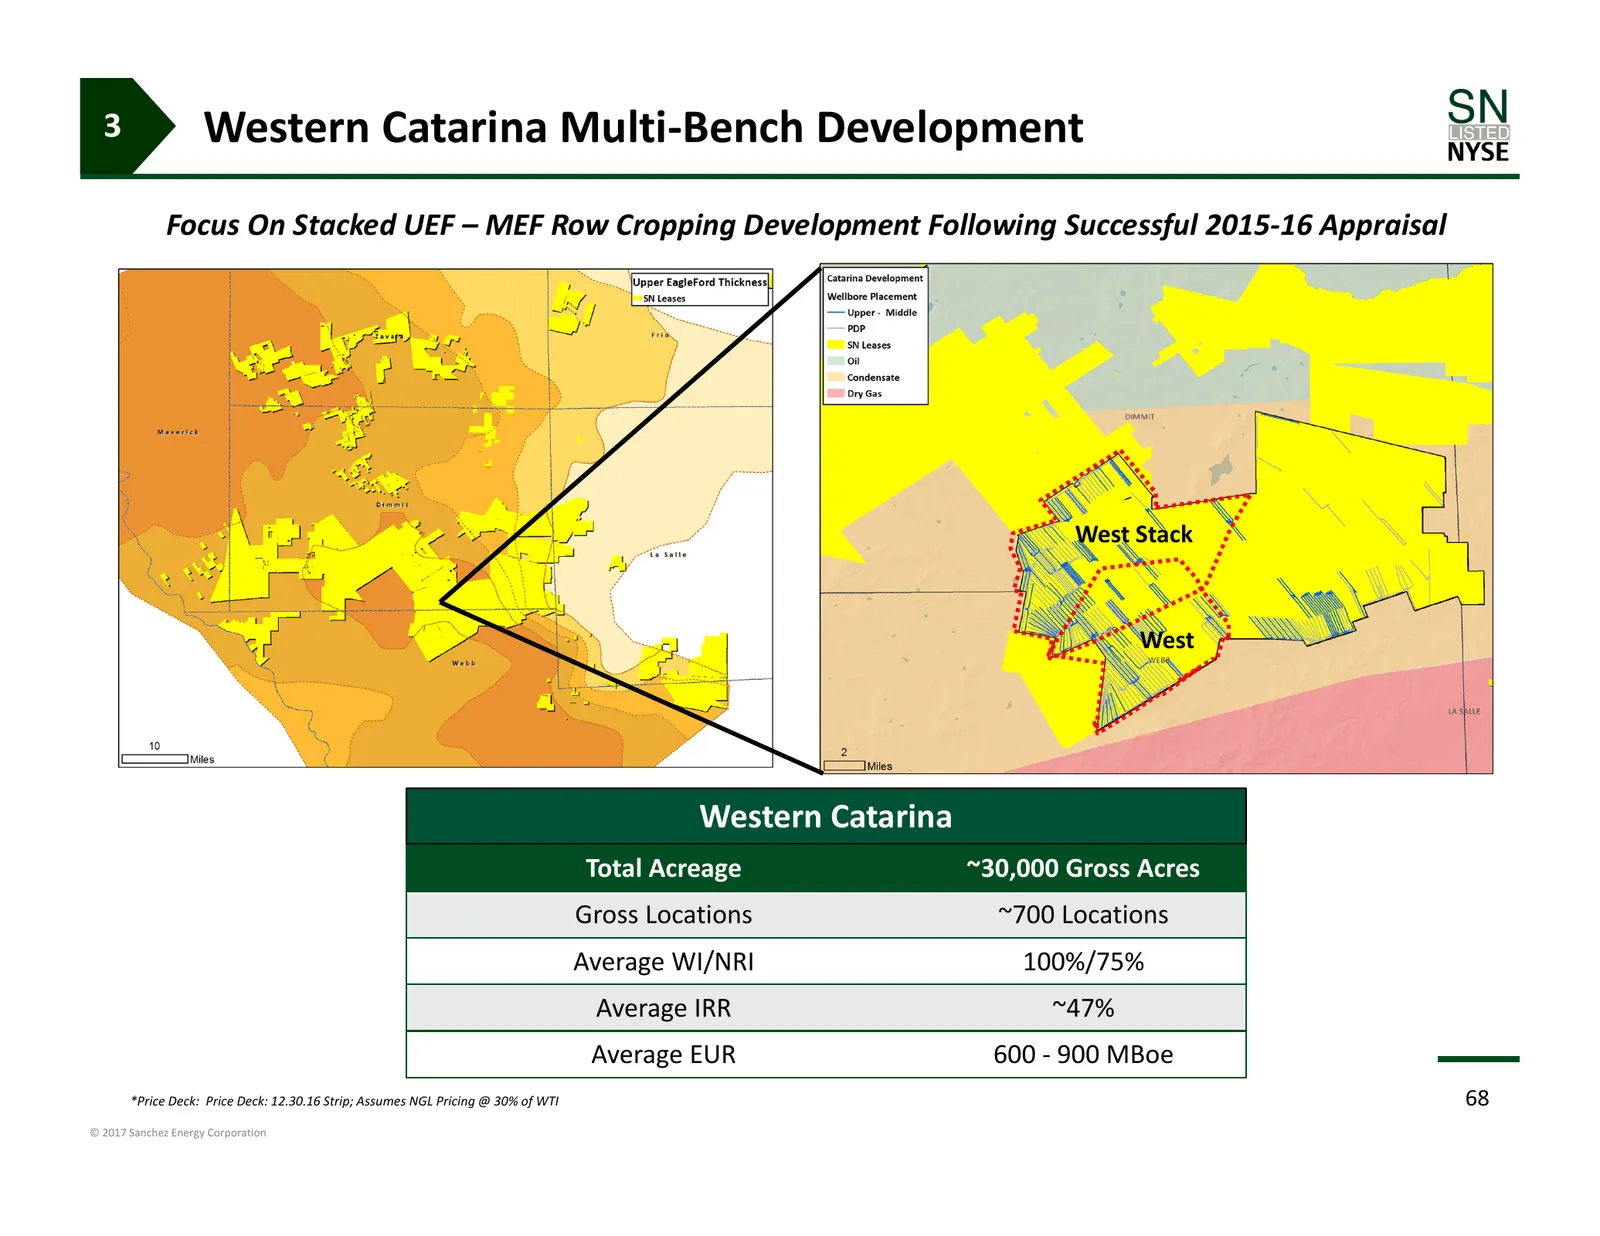
3 Western Catarina Multi‐Bench Development Focus On Stacked UEF – MEF Row Cropping Development Following Successful 2015‐16 Appraisal West Stack West Western Catarina Total Acreage ~30,000 Gross Acres Gross Locations ~700 Locations Average WI/NRI 100%/75% Average IRR ~47% Average EUR 600 ‐ 900 MBoe
Slide 69: Western Catarina Development
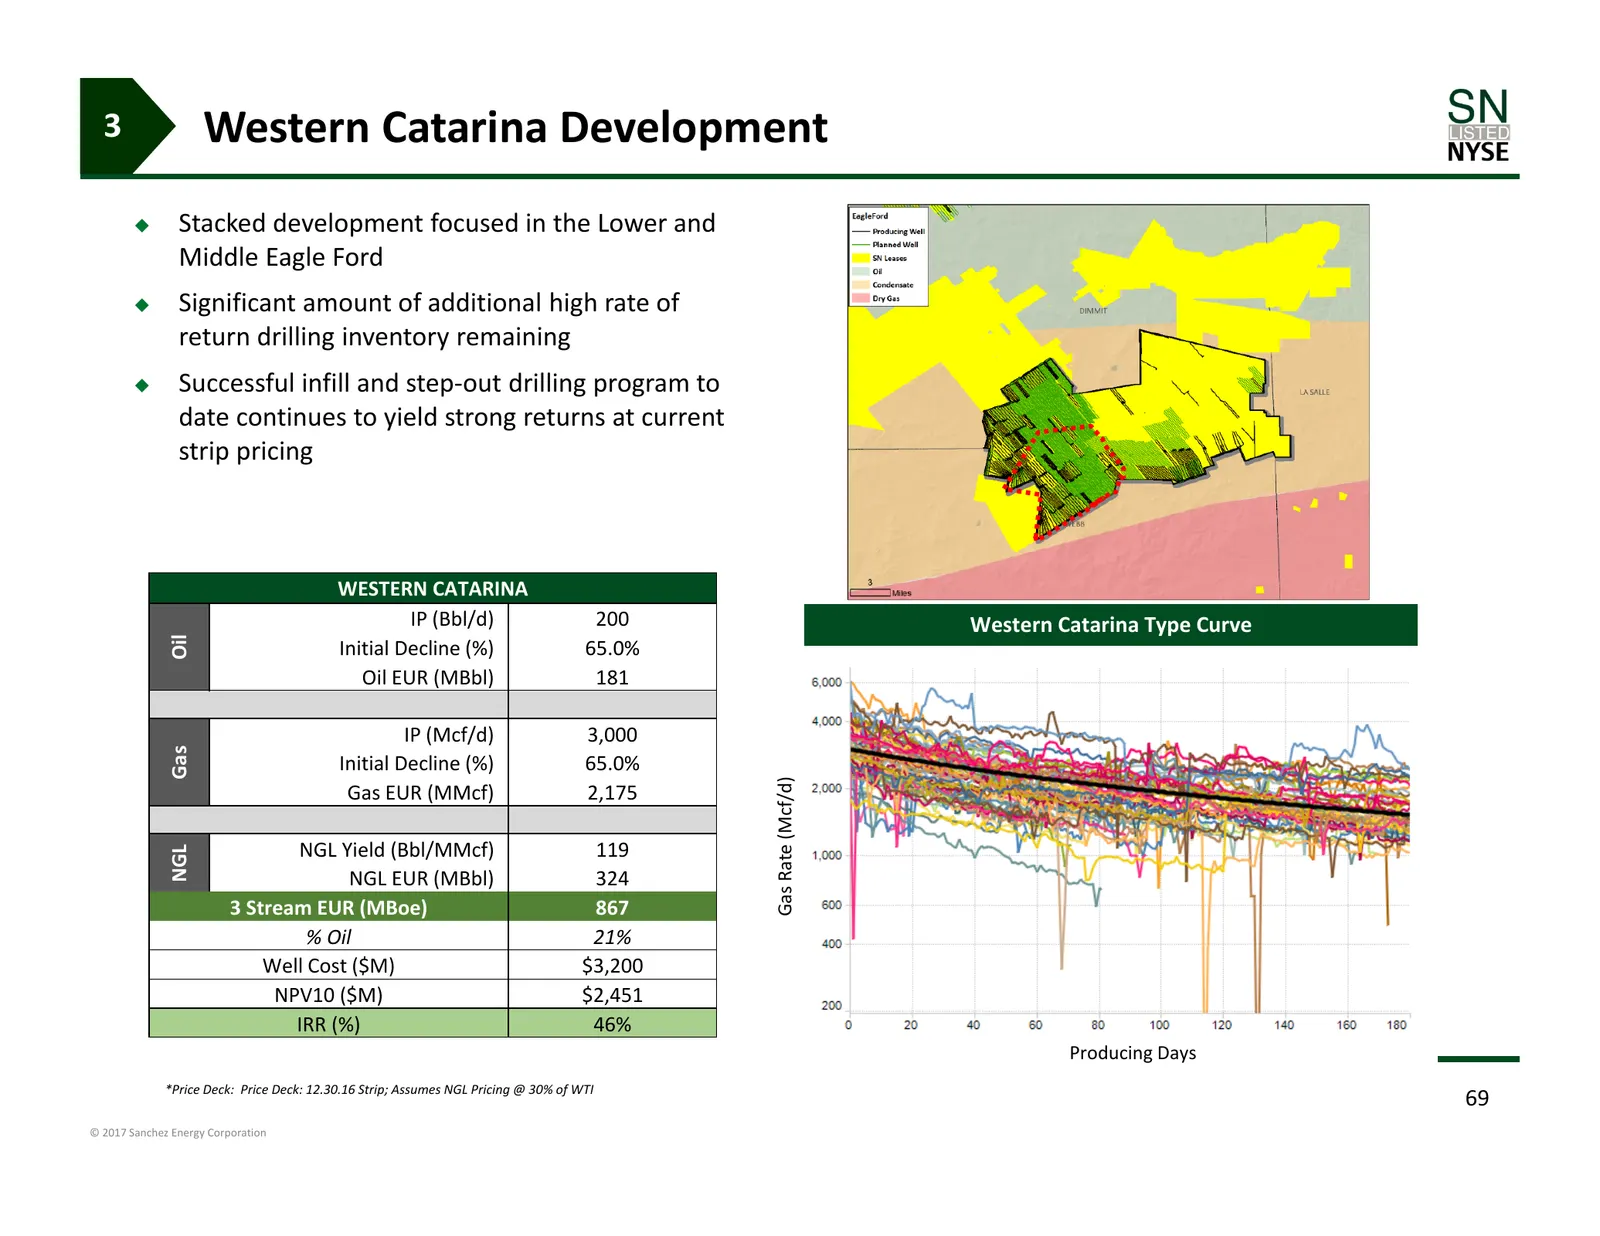
3 Western Catarina Development Stacked development focused in the Lower and Middle Eagle Ford Significant amount of additional high rate of return drilling inventory remaining Successful infill and step‐out drilling program to date continues to yield strong returns at current strip pricing WES
Slide 70: Western Catarina Stacked Development
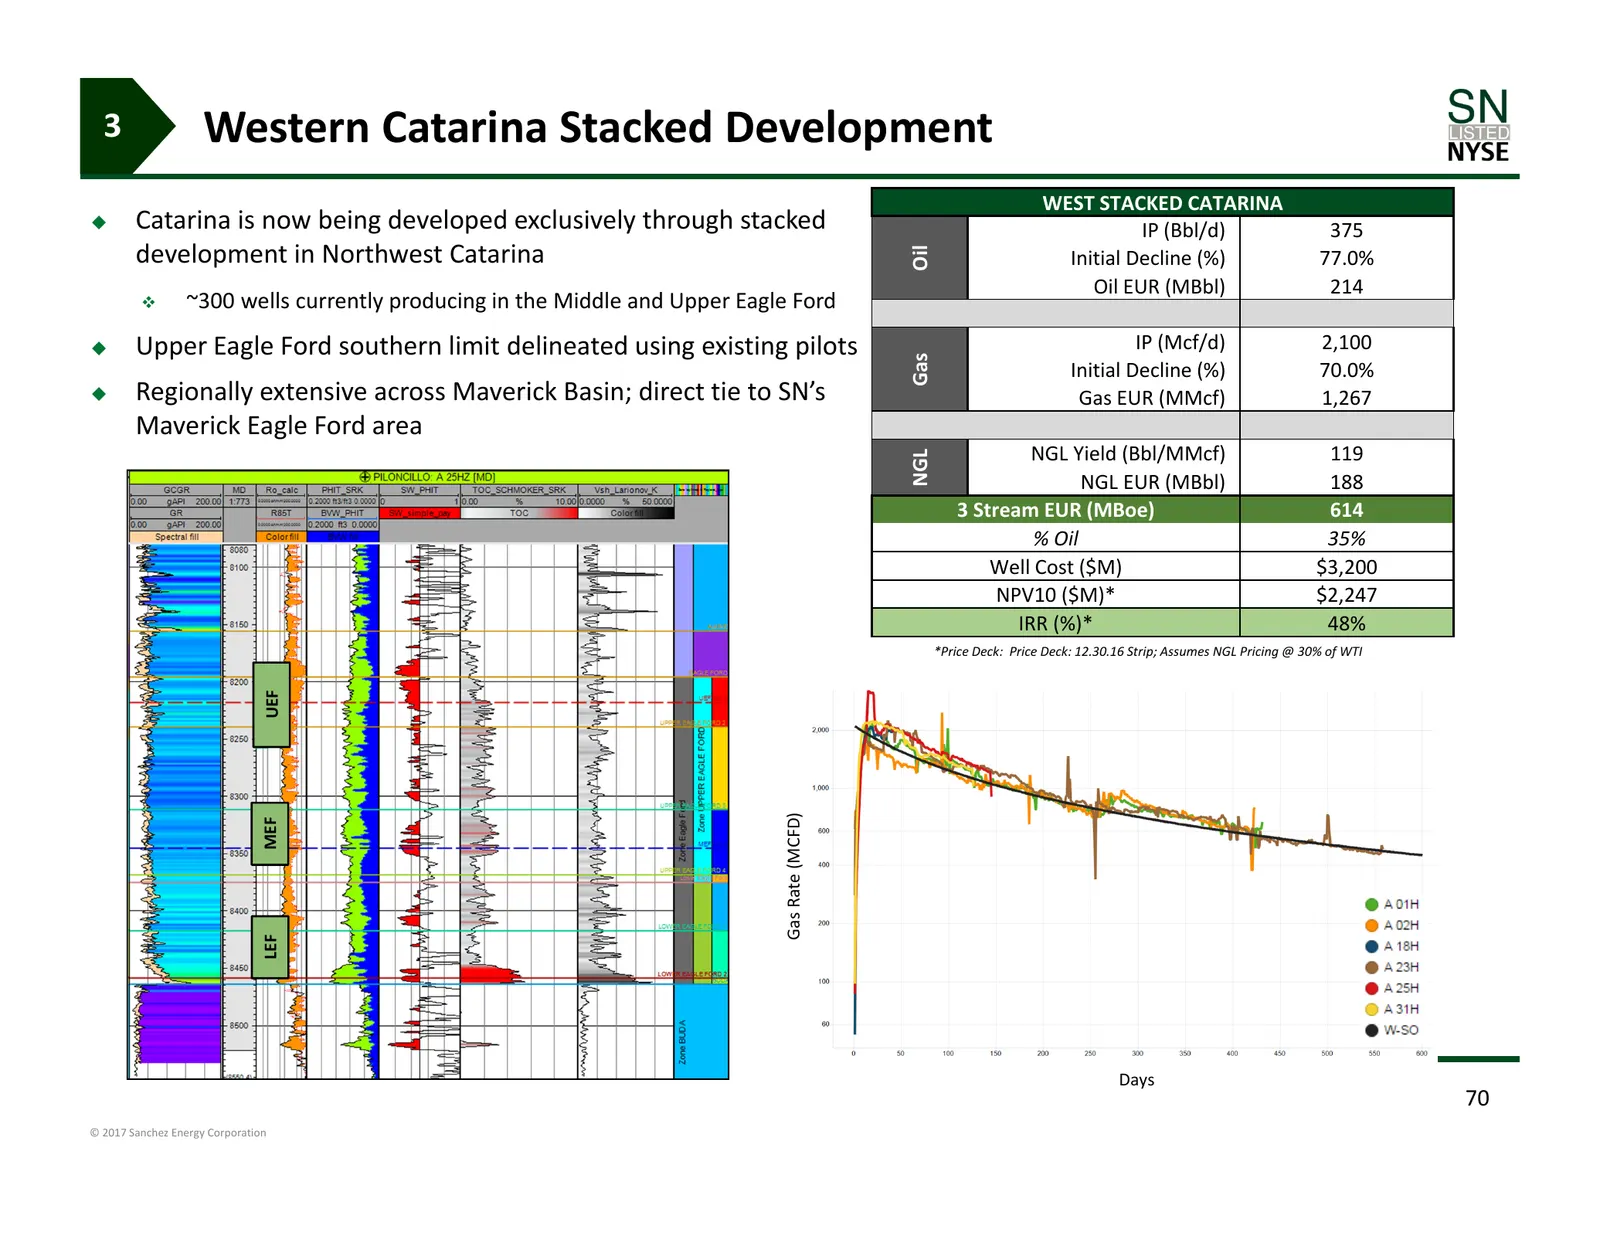
3 Western Catarina Stacked Development WEST STACKED CATARINA Catarina is now being developed exclusively through stacked IP (Bbl/d) 375 development in Northwest Catarina Oil Initial Decline (%) 77.0% Oil EUR (MBbl) 214 ~300 wells currently producing in the Middle and Upper Eagle Ford Upper Eag
Slide 71: Western Stacked Development - Catarina Well Economics
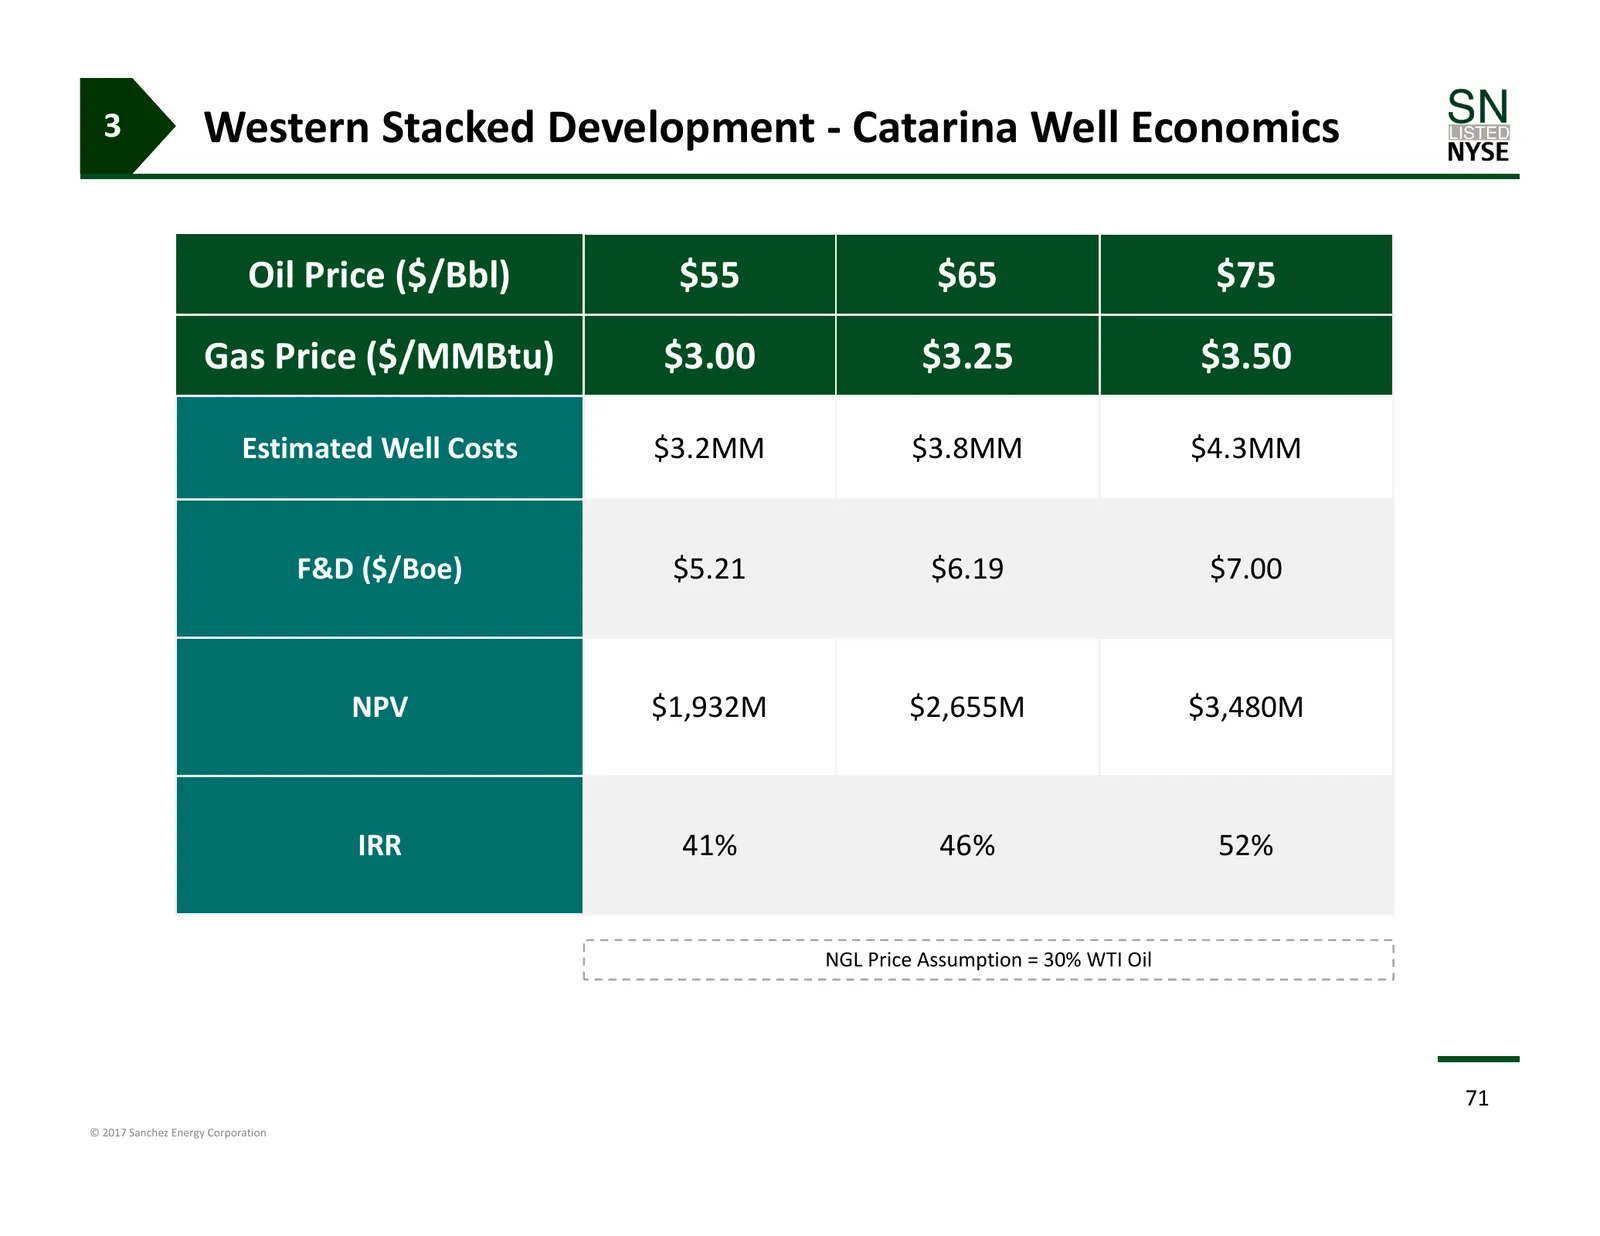
3 Western Stacked Development ‐ Catarina Well Economics Oil Price ($/Bbl) $55 $65 $75 Gas Price ($/MMBtu) $3.00 $3.25 $3.50 Estimated Well Costs $3.2MM $3.8MM $4.3MM F&D ($/Boe) $5.21 $6.19 $7.00 NPV $1,932M $2,655M $3,480M IRR 41% 46% 52% NGL Price Assumption = 30% WTI Oil 71 © 2017 Sanchez Energy
Slide 72: Resulting Impact of Catarina Asset Development
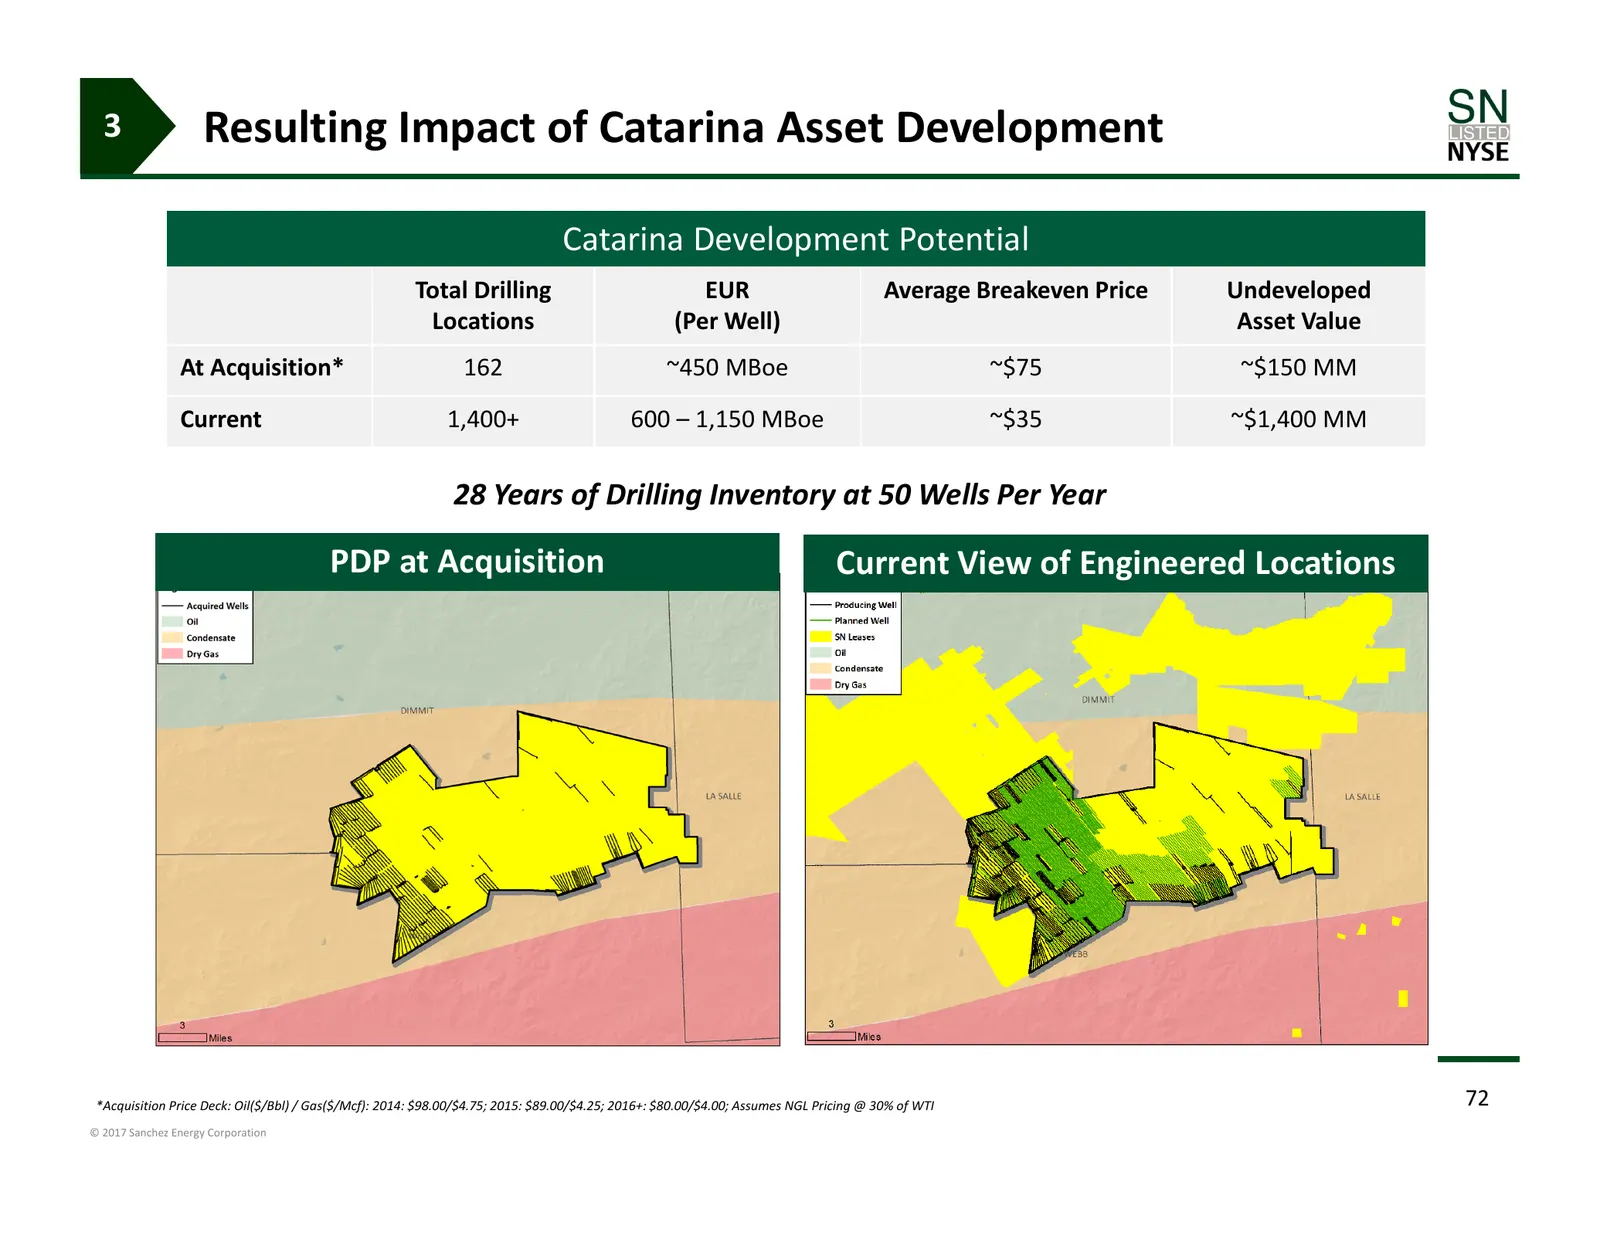
3 Resulting Impact of Catarina Asset Development Catarina Development Potential Total Drilling EUR Average Breakeven Price Undeveloped Locations (Per Well) Asset Value At Acquisition* 162 ~450 MBoe ~$75 ~$150 MM Current 1,400+ 600 – 1,150 MBoe ~$35 ~$1,400 MM 28 Years of Drilling Inventory at 50 Wel
Slide 73: Maverick
Maverick 73 © 2017 Sanchez Energy Corporation
Slide 74: Maverick Asset Leasing & Development
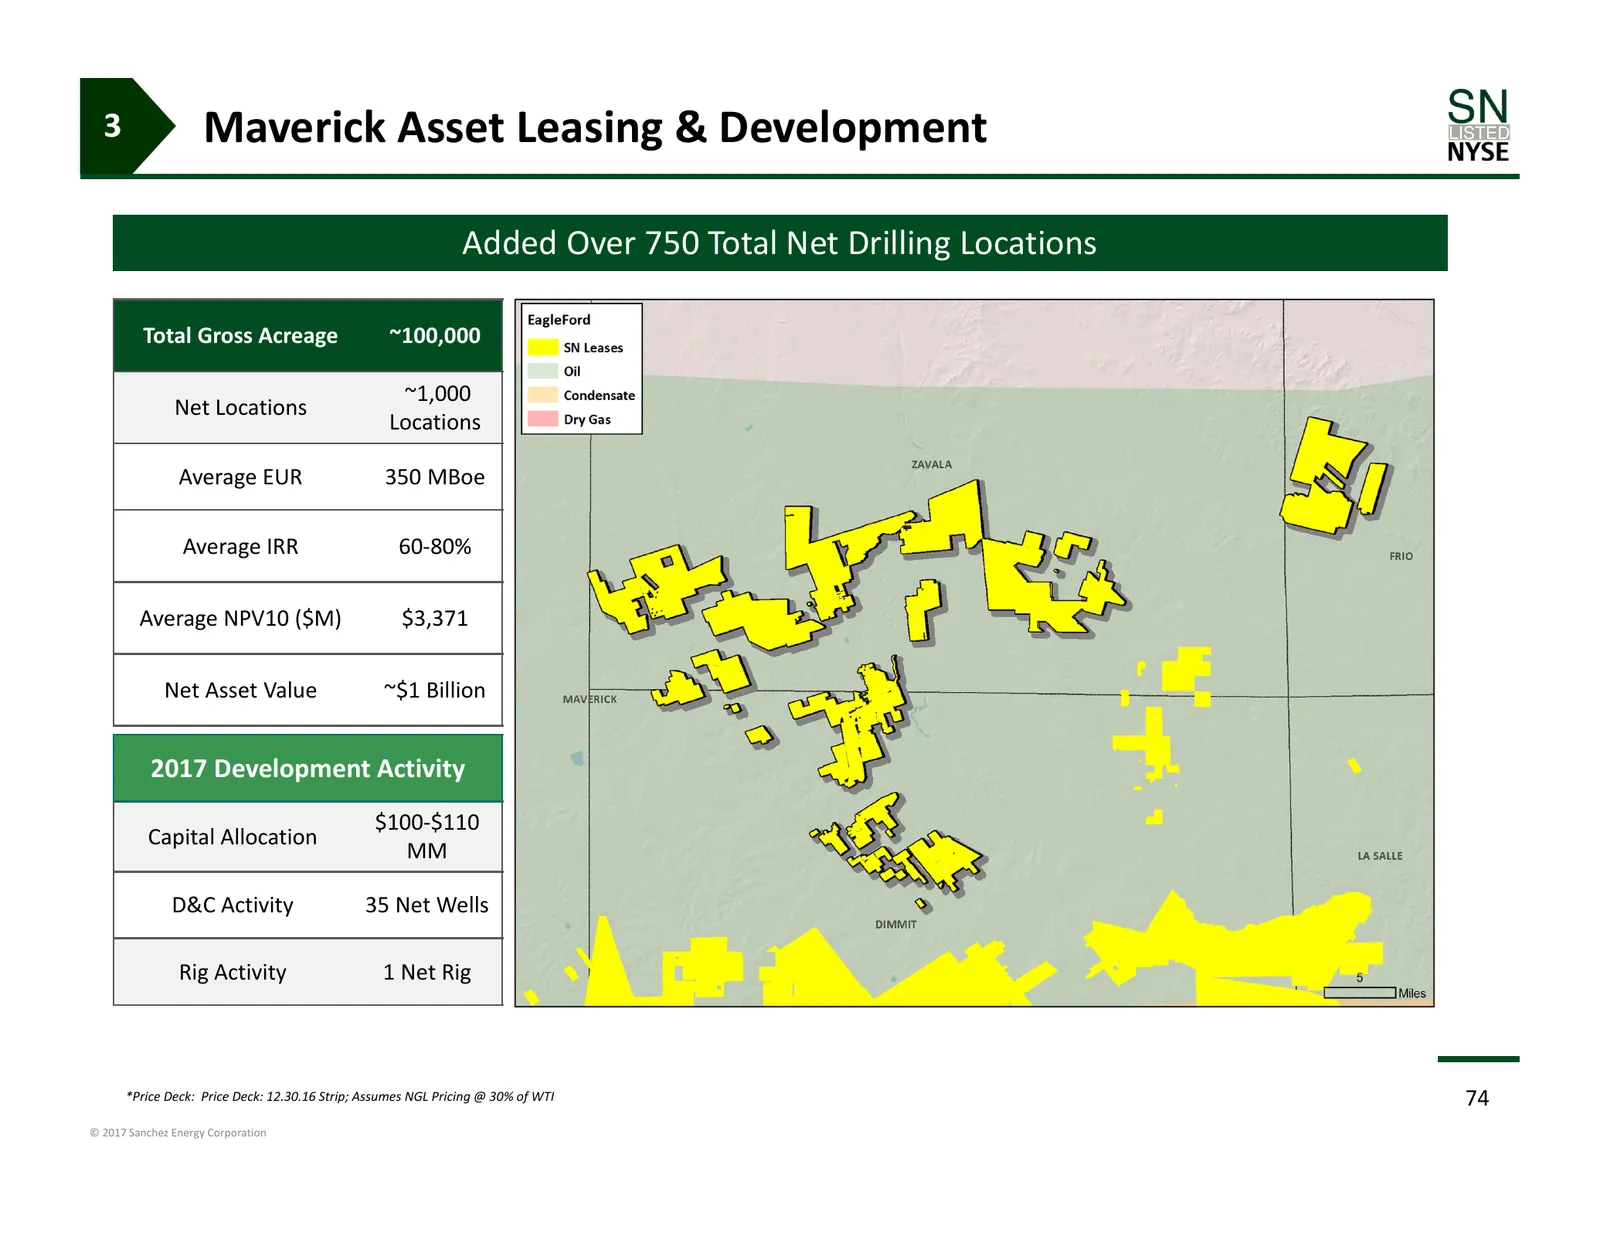
3 Maverick Asset Leasing & Development Added Over 750 Total Net Drilling Locations Total Gross Acreage ~100,000 ~1,000 Net Locations Locations Average EUR 350 MBoe Average IRR 60‐80% Average NPV10 ($M) $3,371 Net Asset Value ~$1 Billion 2017 Development Activity $100‐$110 Capital Allocation MM D&C A
Slide 75: Maverick Inventory Growth
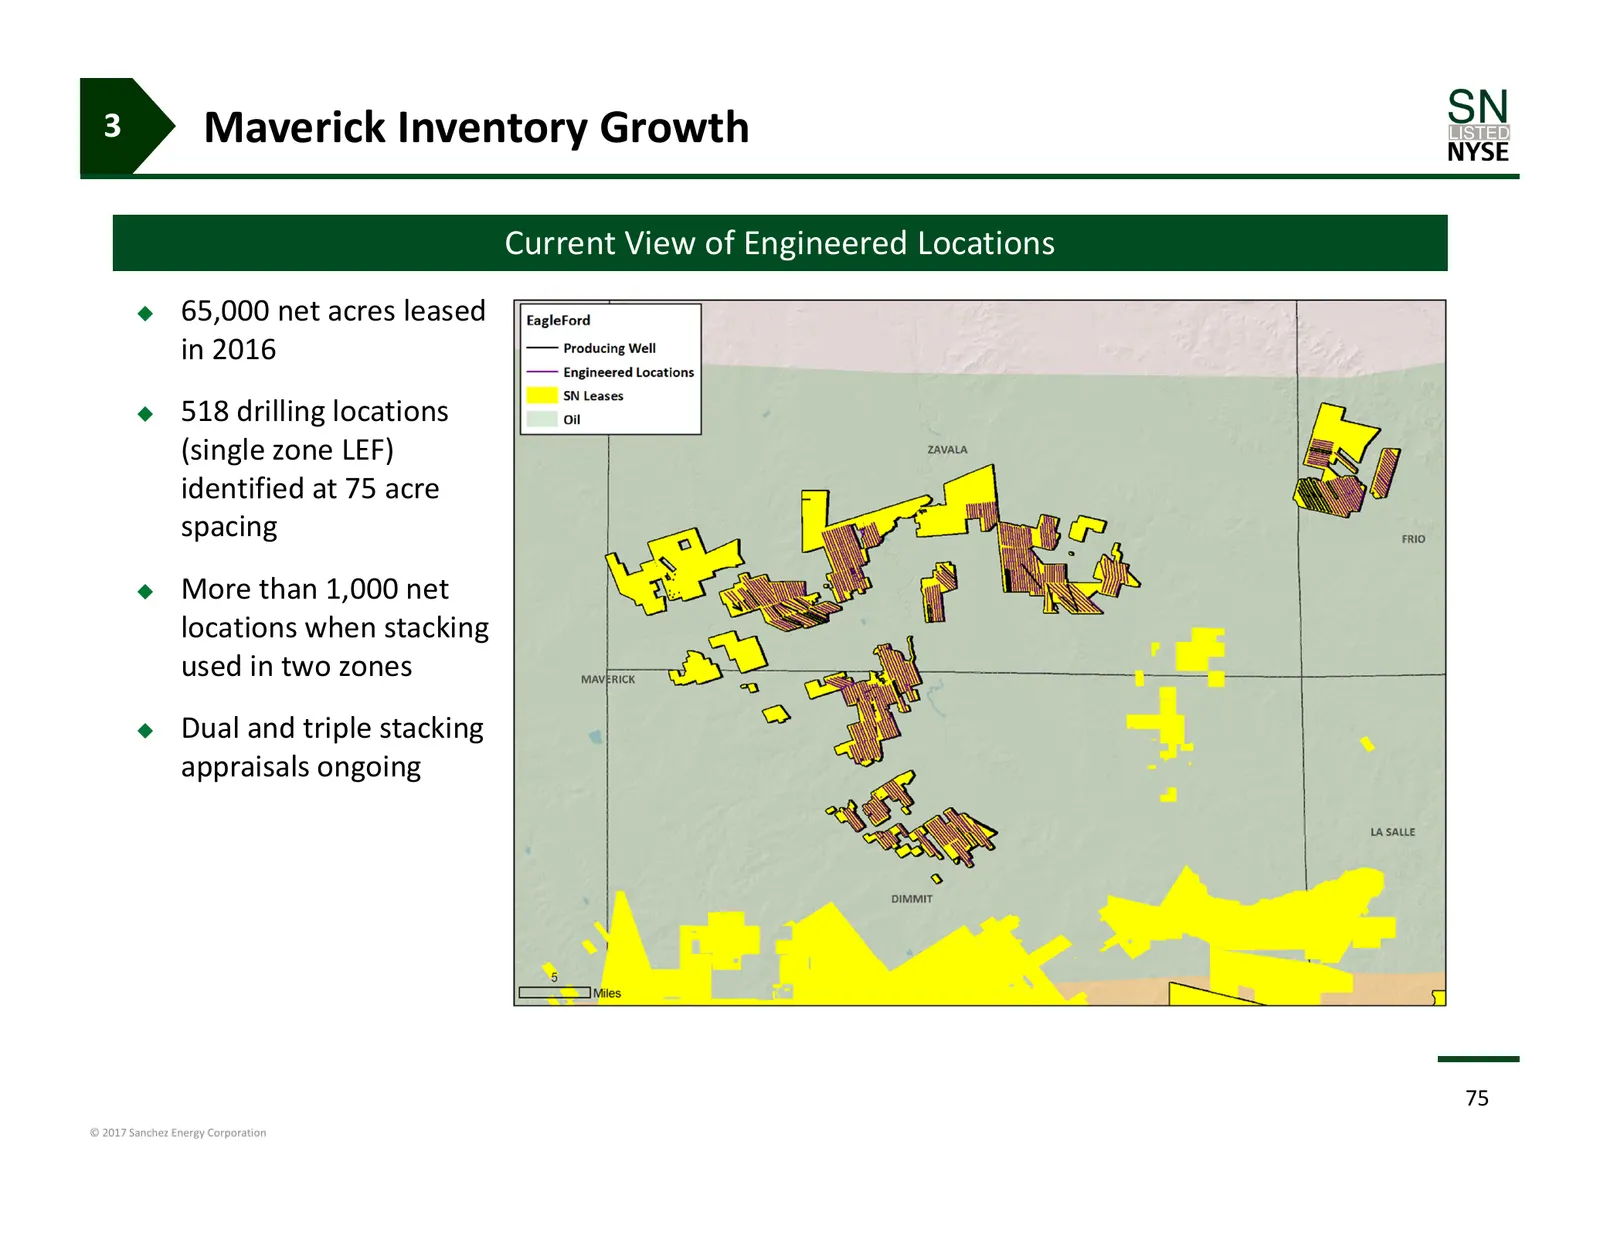
3 Maverick Inventory Growth Current View of Engineered Locations 65,000 net acres leased in 2016 518 drilling locations (single zone LEF) identified at 75 acre spacing More than 1,000 net locations when stacking used in two zones Dual and triple stacking appraisals ongoing 75 © 2017 Sanchez
Slide 76: Unlocking Maverick Updip Oil Play
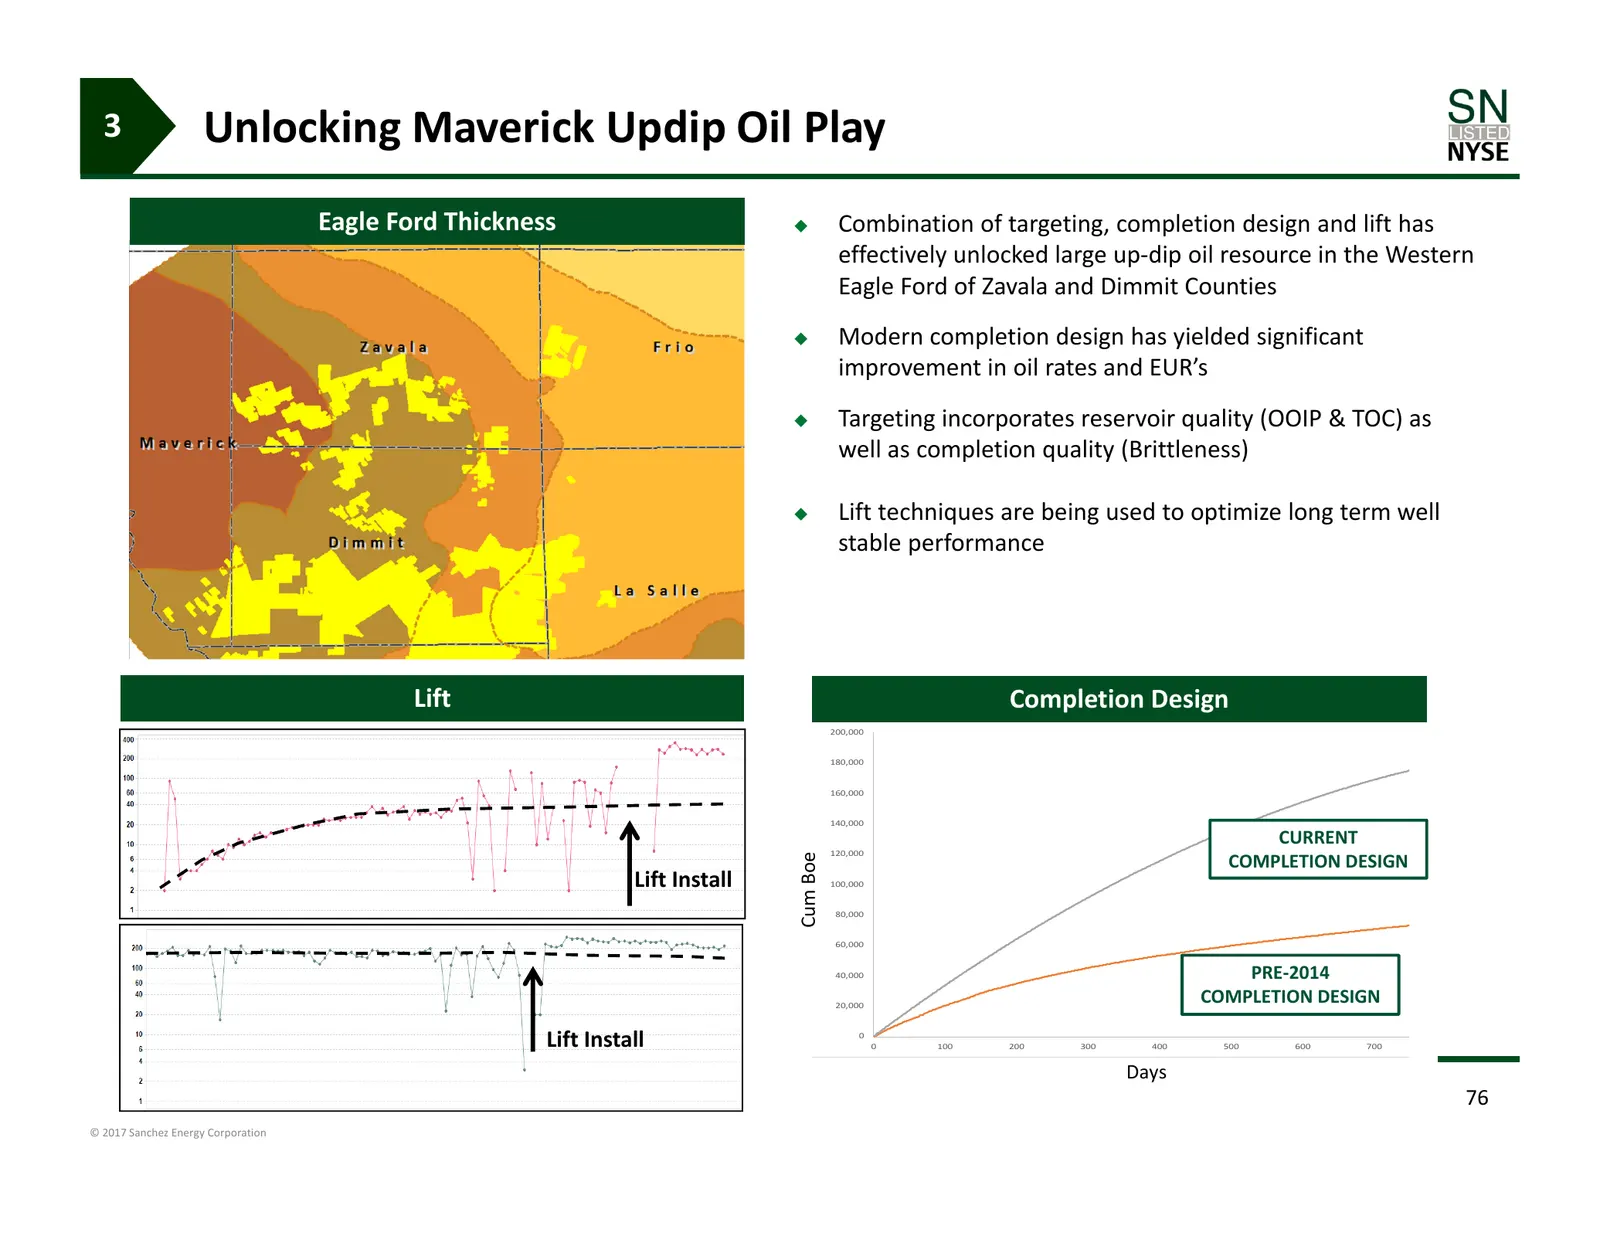
3 Unlocking Maverick Updip Oil Play Eagle EagleFord Ford Thickness Thickness Combination of targeting, completion design and lift has effectively unlocked large up‐dip oil resource in the Western Eagle Ford of Zavala and Dimmit Counties Modern completion design has yielded significant improvemen
Slide 77: Maverick Organic Stacked Zone Growth
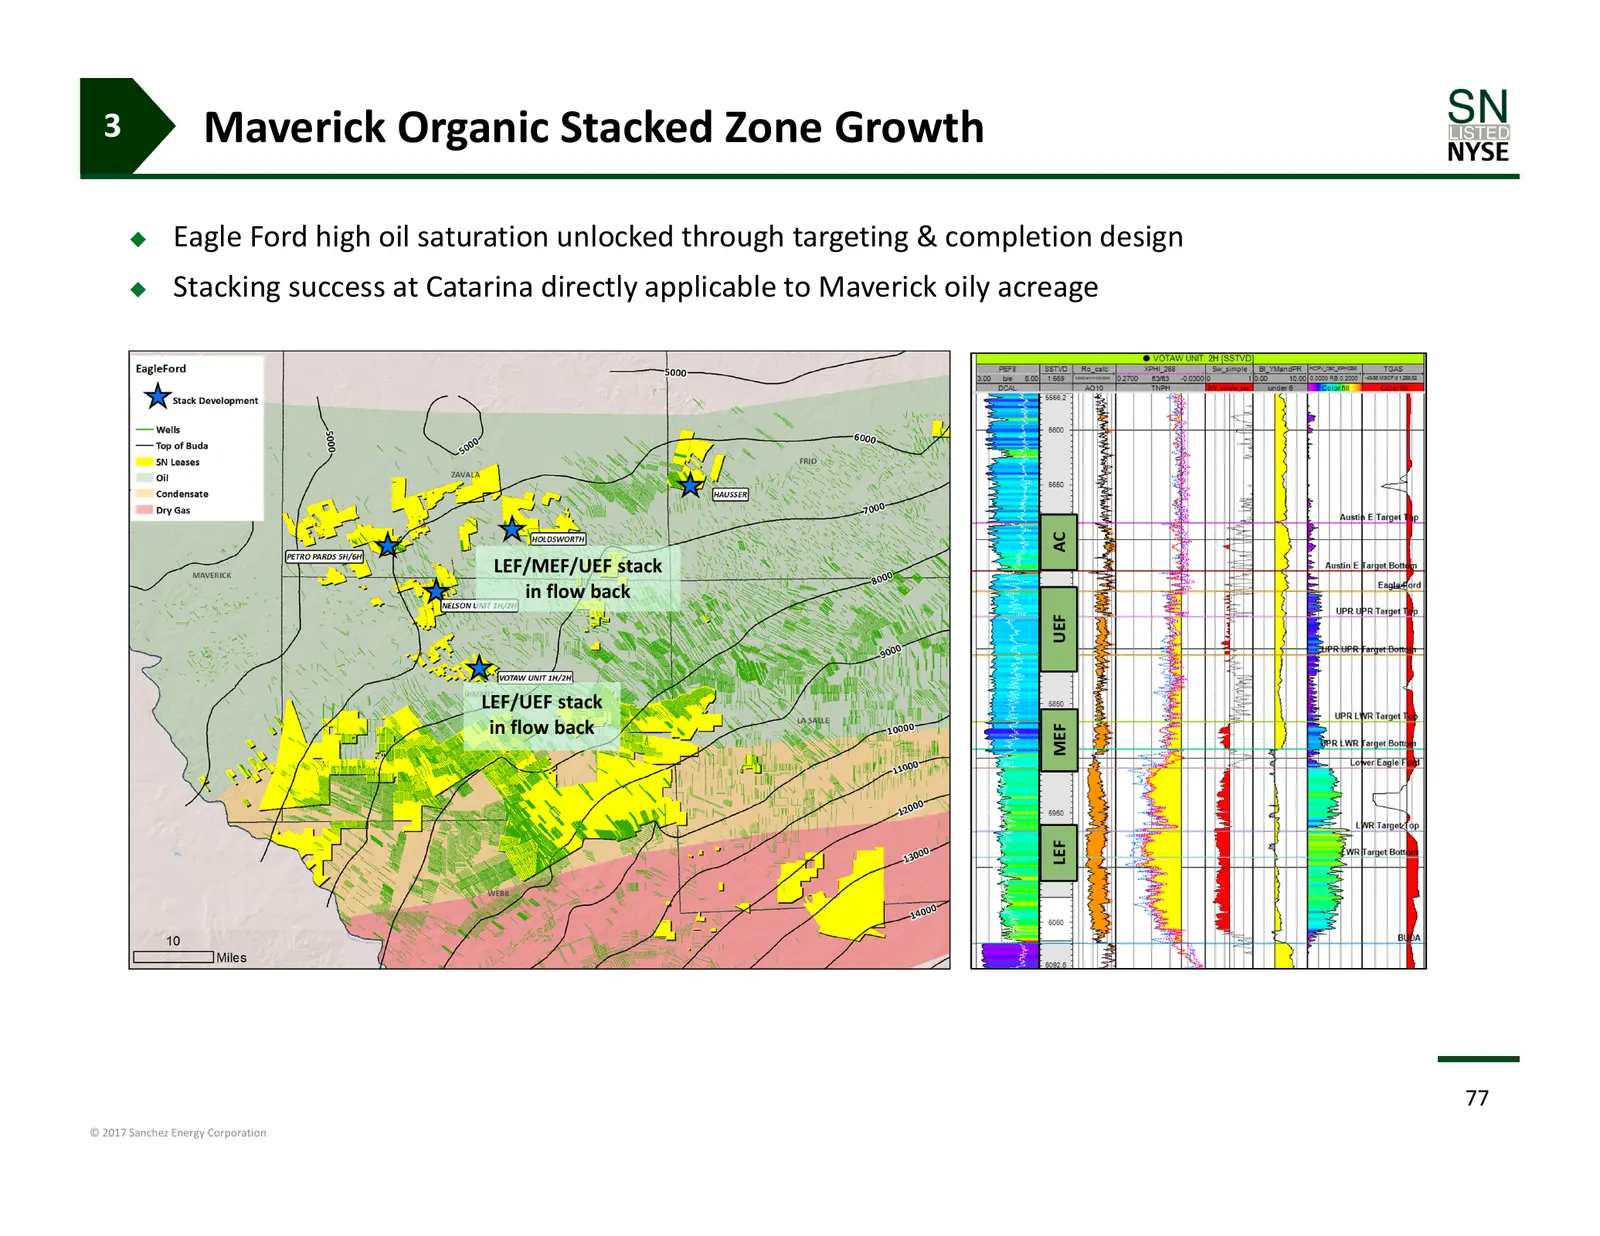
3 Maverick Organic Stacked Zone Growth Eagle Ford high oil saturation unlocked through targeting & completion design Stacking success at Catarina directly applicable to Maverick oily acreage AC LEF/MEF/UEF stack in flow back UEF LEF/UEF stack in flow back MEF LEF 77 © 2017 Sanchez Energy Corpora
Slide 78: Maverick Regional
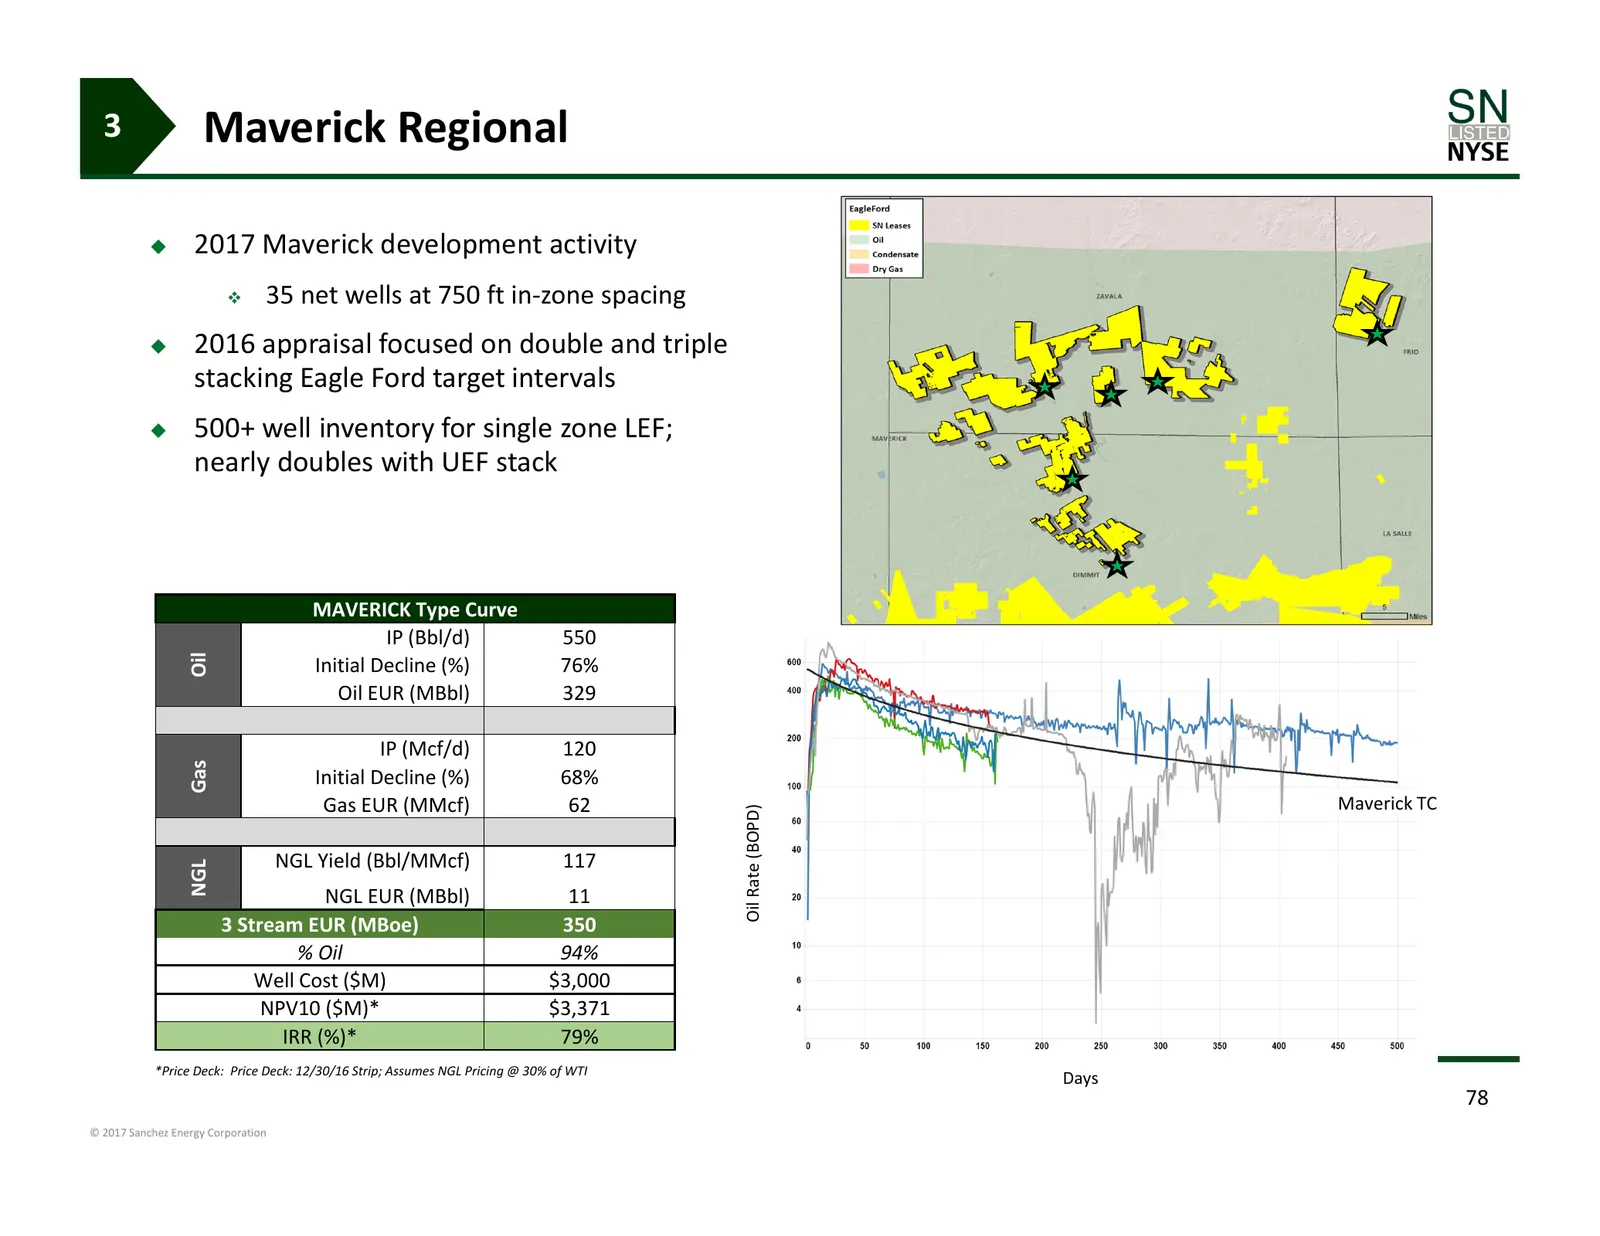
3 Maverick Regional 2017 Maverick development activity 35 net wells at 750 ft in‐zone spacing 2016 appraisal focused on double and triple stacking Eagle Ford target intervals 500+ well inventory for single zone LEF; nearly doubles with UEF stack MAVERICK Type Curve IP (Bbl/d) 550 Oil Initial
Slide 79: Maverick Well Economics
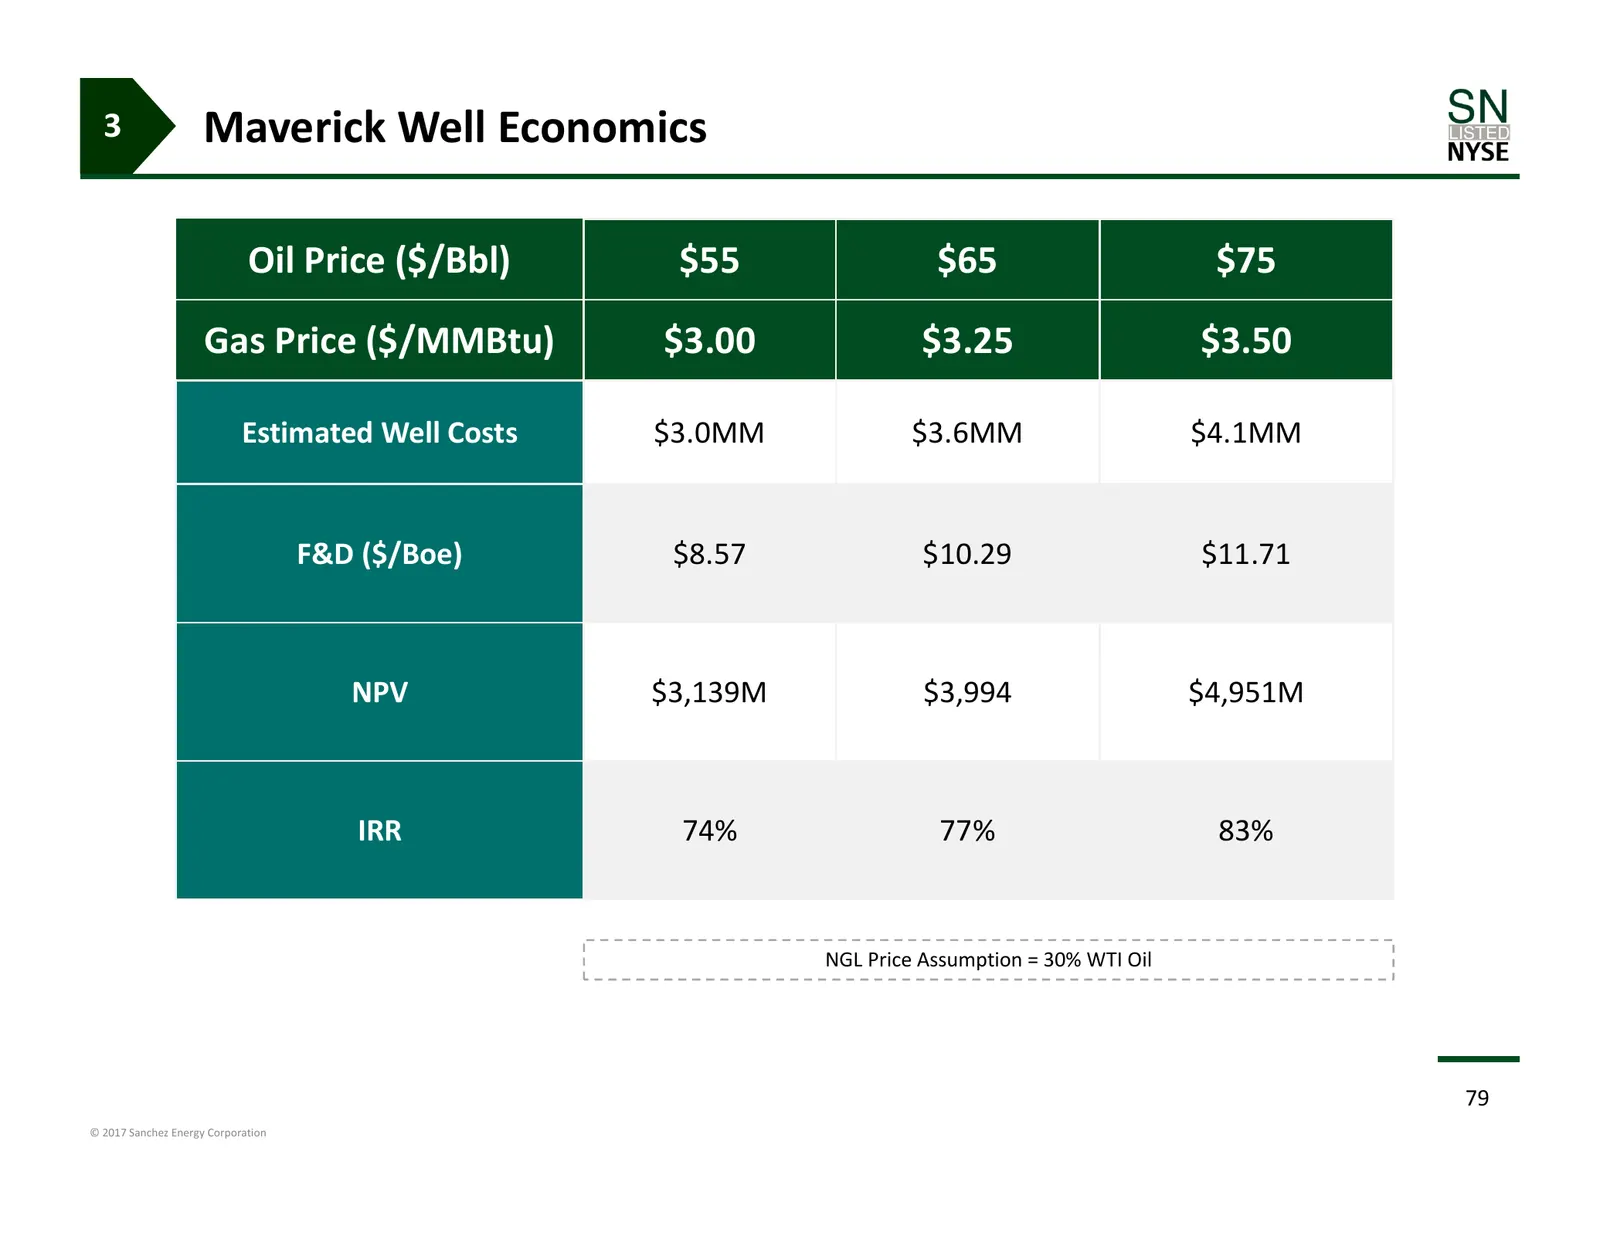
3 Maverick Well Economics Oil Price ($/Bbl) $55 $65 $75 Gas Price ($/MMBtu) $3.00 $3.25 $3.50 Estimated Well Costs $3.0MM $3.6MM $4.1MM F&D ($/Boe) $8.57 $10.29 $11.71 NPV $3,139M $3,994 $4,951M IRR 74% 77% 83% NGL Price Assumption = 30% WTI Oil 79 © 2017 Sanchez Energy Corporation
Slide 80: Javelina
Javelina 80 © 2017 Sanchez Energy Corporation
Slide 81: Javelina Leasing
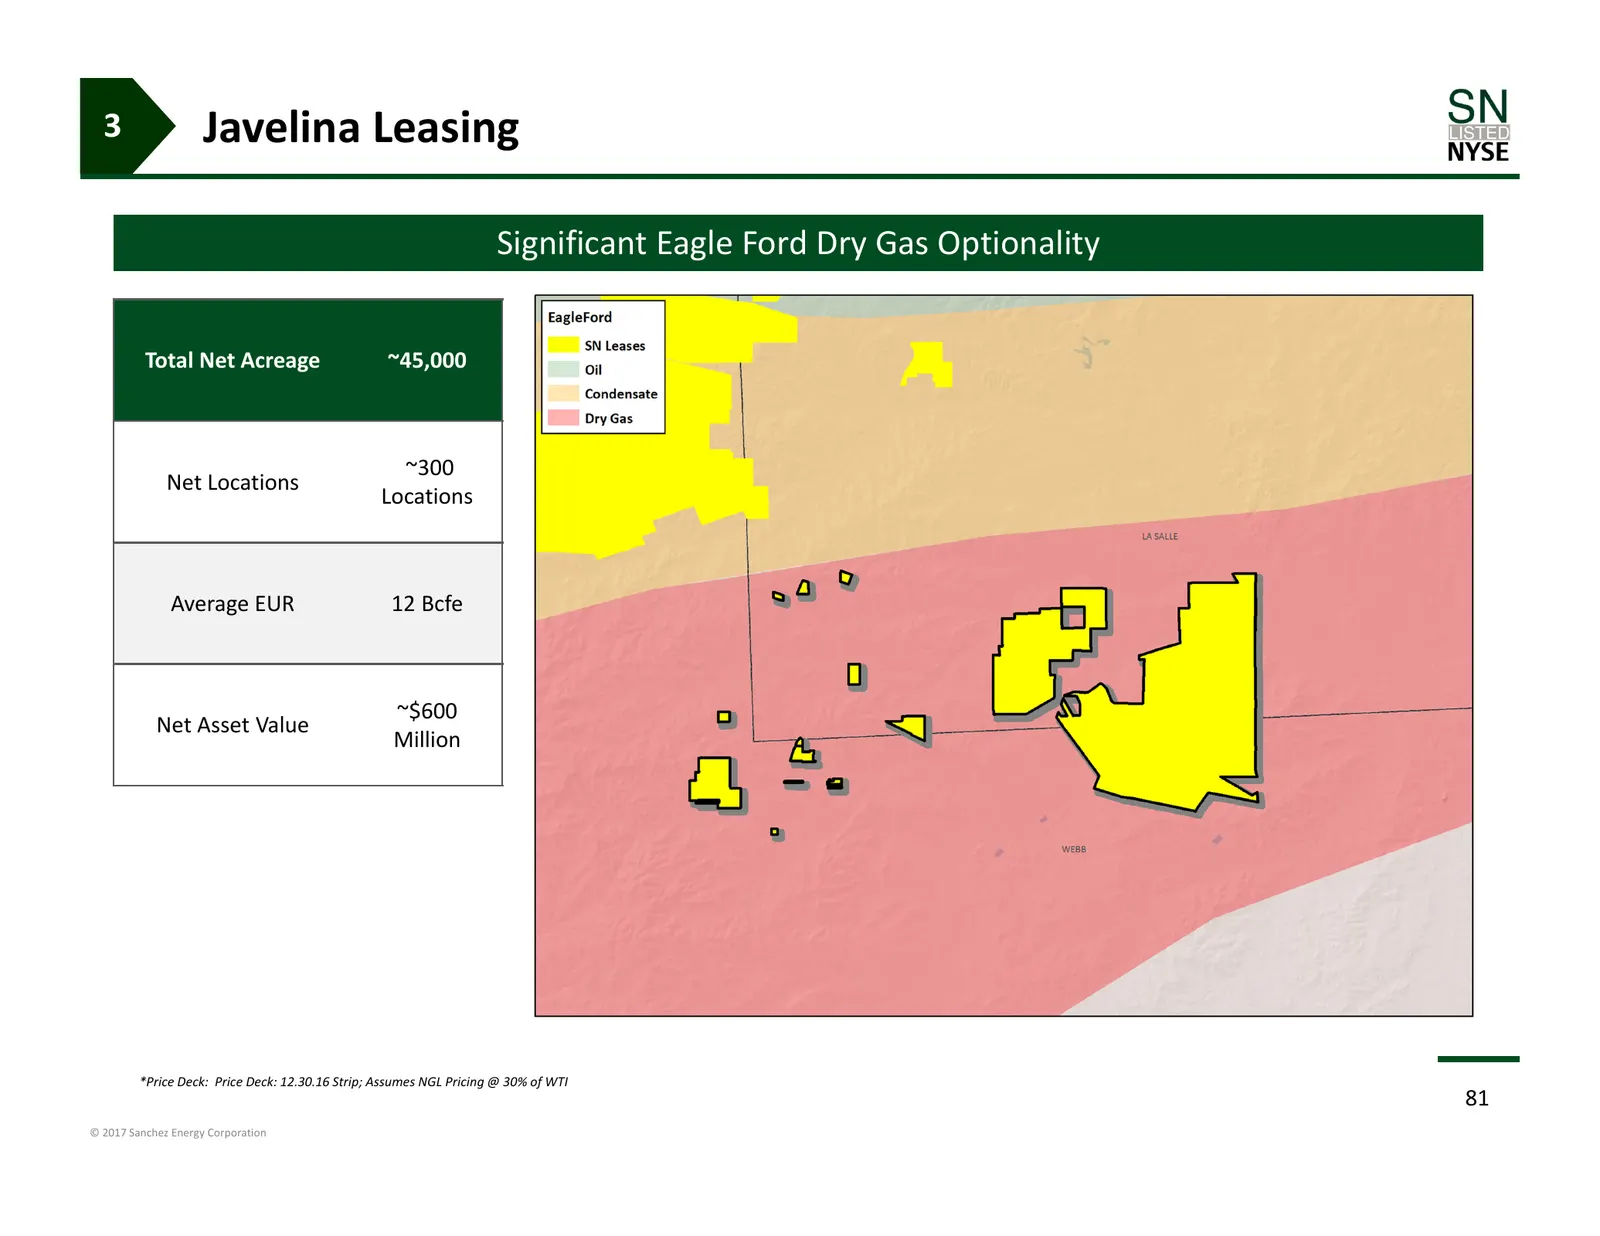
3 Javelina Leasing Significant Eagle Ford Dry Gas Optionality Total Net Acreage ~45,000 ~300 Net Locations Locations Average EUR 12 Bcfe ~$600 Net Asset Value Million *Price Deck: Price Deck: 12.30.16 Strip; Assumes NGL Pricing @ 30% of WTI 81 © 2017 Sanchez Energy Corporation
Slide 82: Javelina Eagle Ford Down-dip Gas
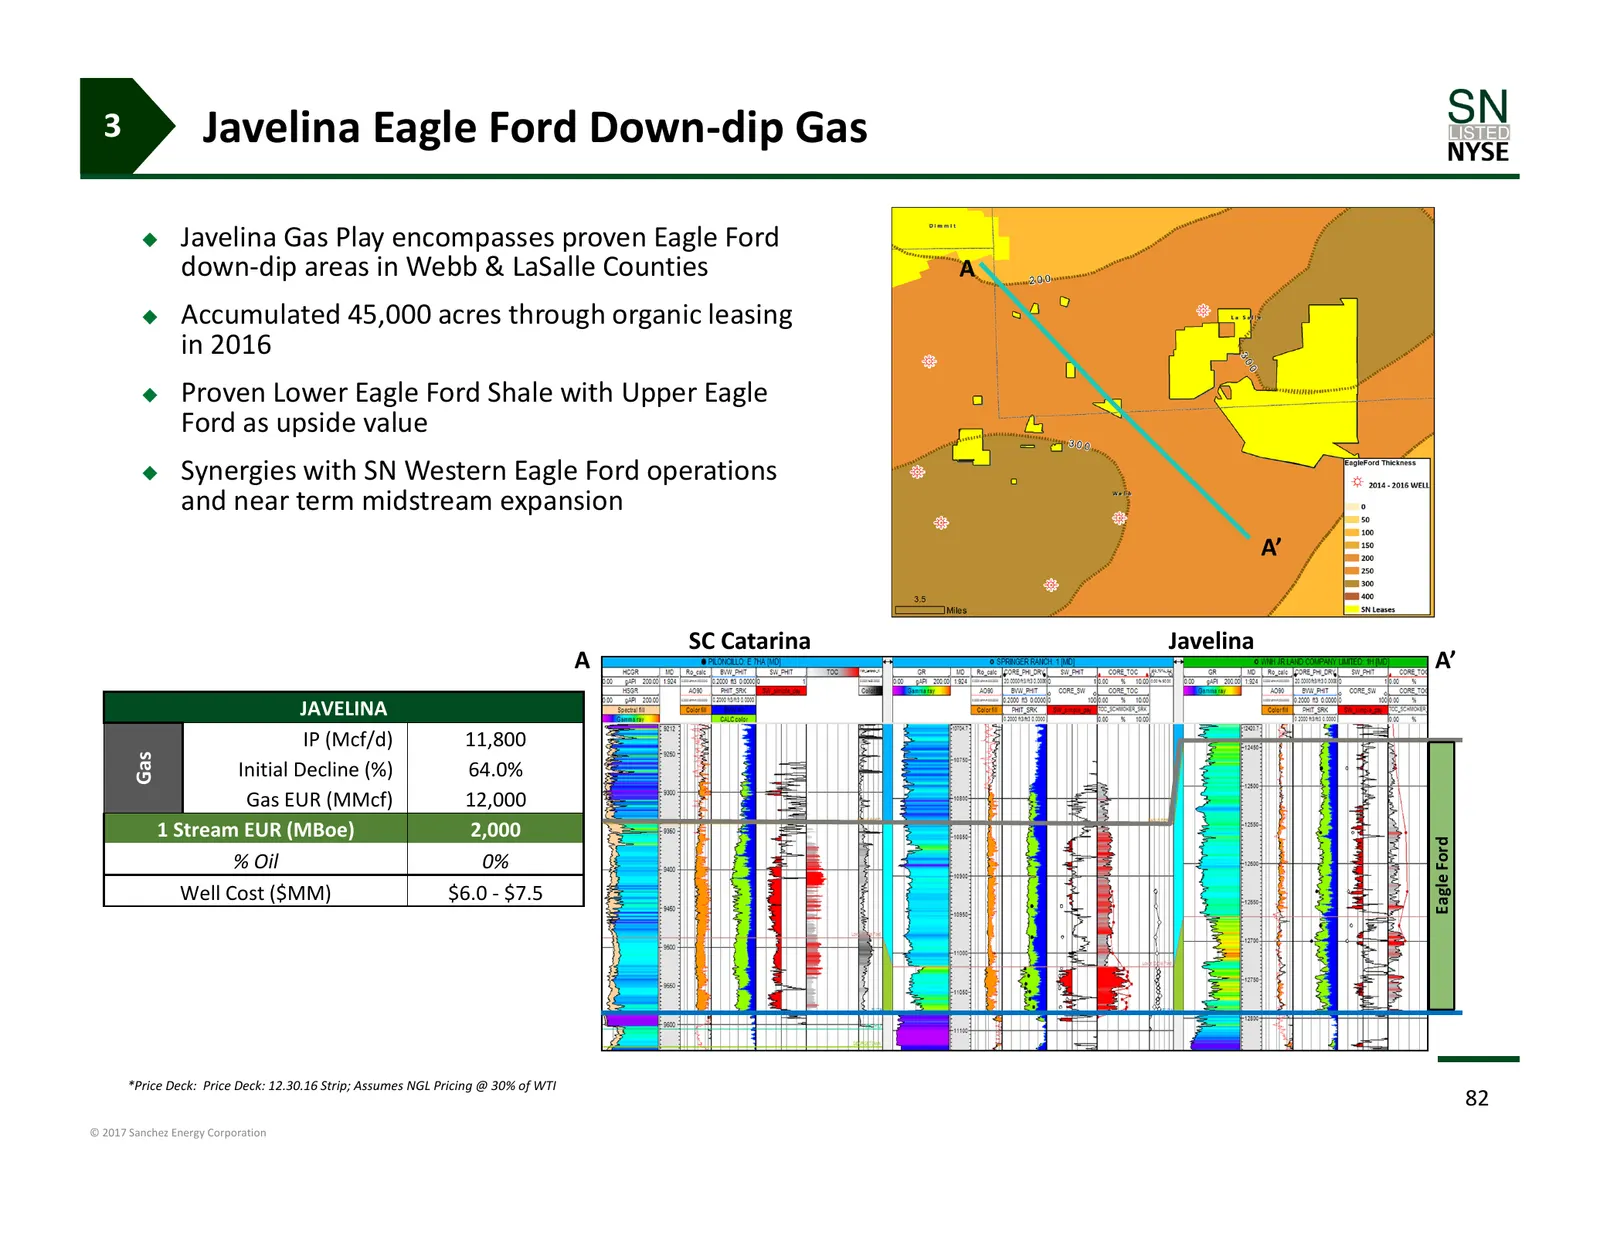
3 Javelina Eagle Ford Down‐dip Gas Javelina Gas Play encompasses proven Eagle Ford down‐dip areas in Webb & LaSalle Counties A Accumulated 45,000 acres through organic leasing in 2016 Proven Lower Eagle Ford Shale with Upper Eagle Ford as upside value Synergies with SN Western Eagle Ford ope
Slide 83: Sanchez Energy: Financial Strategy
Sanchez Energy: Financial Strategy 4. Financial Strategy Competitive Advantages Asset Detail Financial Strategy 83 © 2017 Sanchez Energy Corporation
Slide 84: Financial Strategy
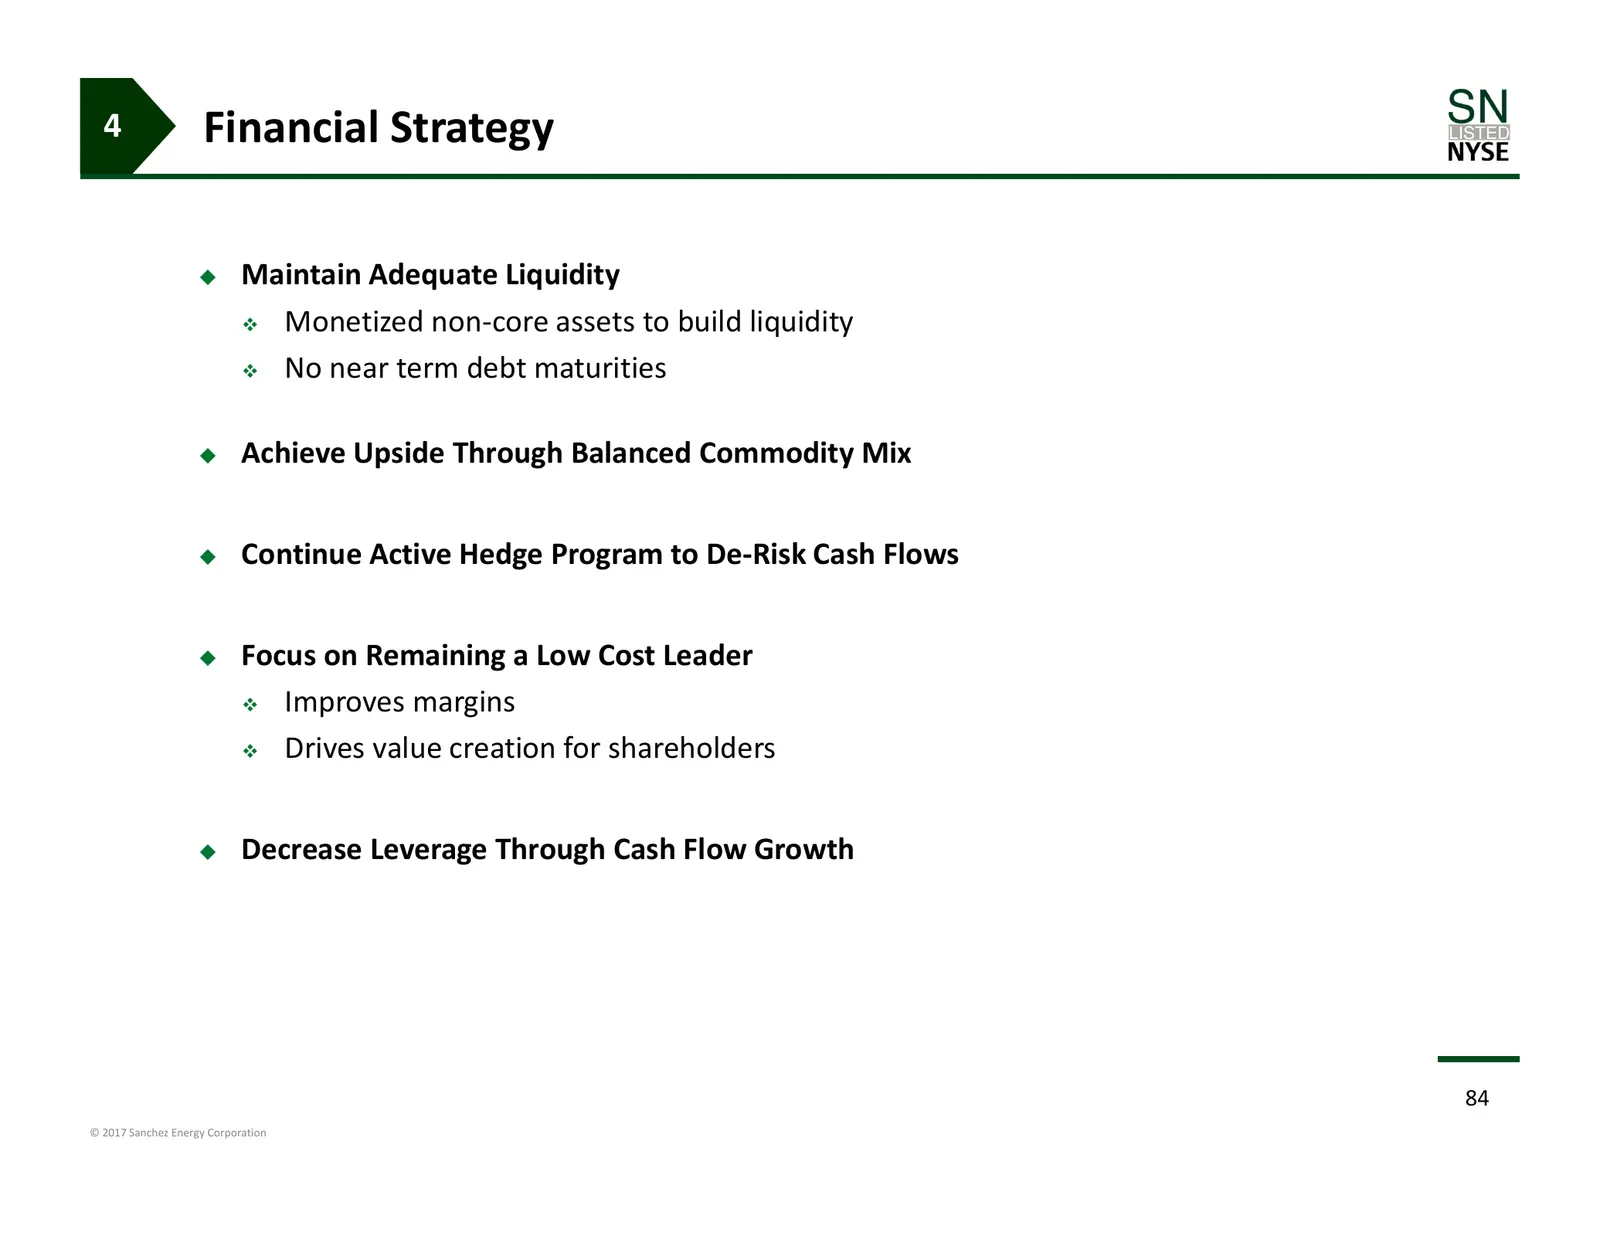
4 Financial Strategy Maintain Adequate Liquidity Monetized non‐core assets to build liquidity No near term debt maturities Achieve Upside Through Balanced Commodity Mix Continue Active Hedge Program to De‐Risk Cash Flows Focus on Remaining a Low Cost Leader Improves margins Drives va
Slide 85: Maintain Adequate Liquidity
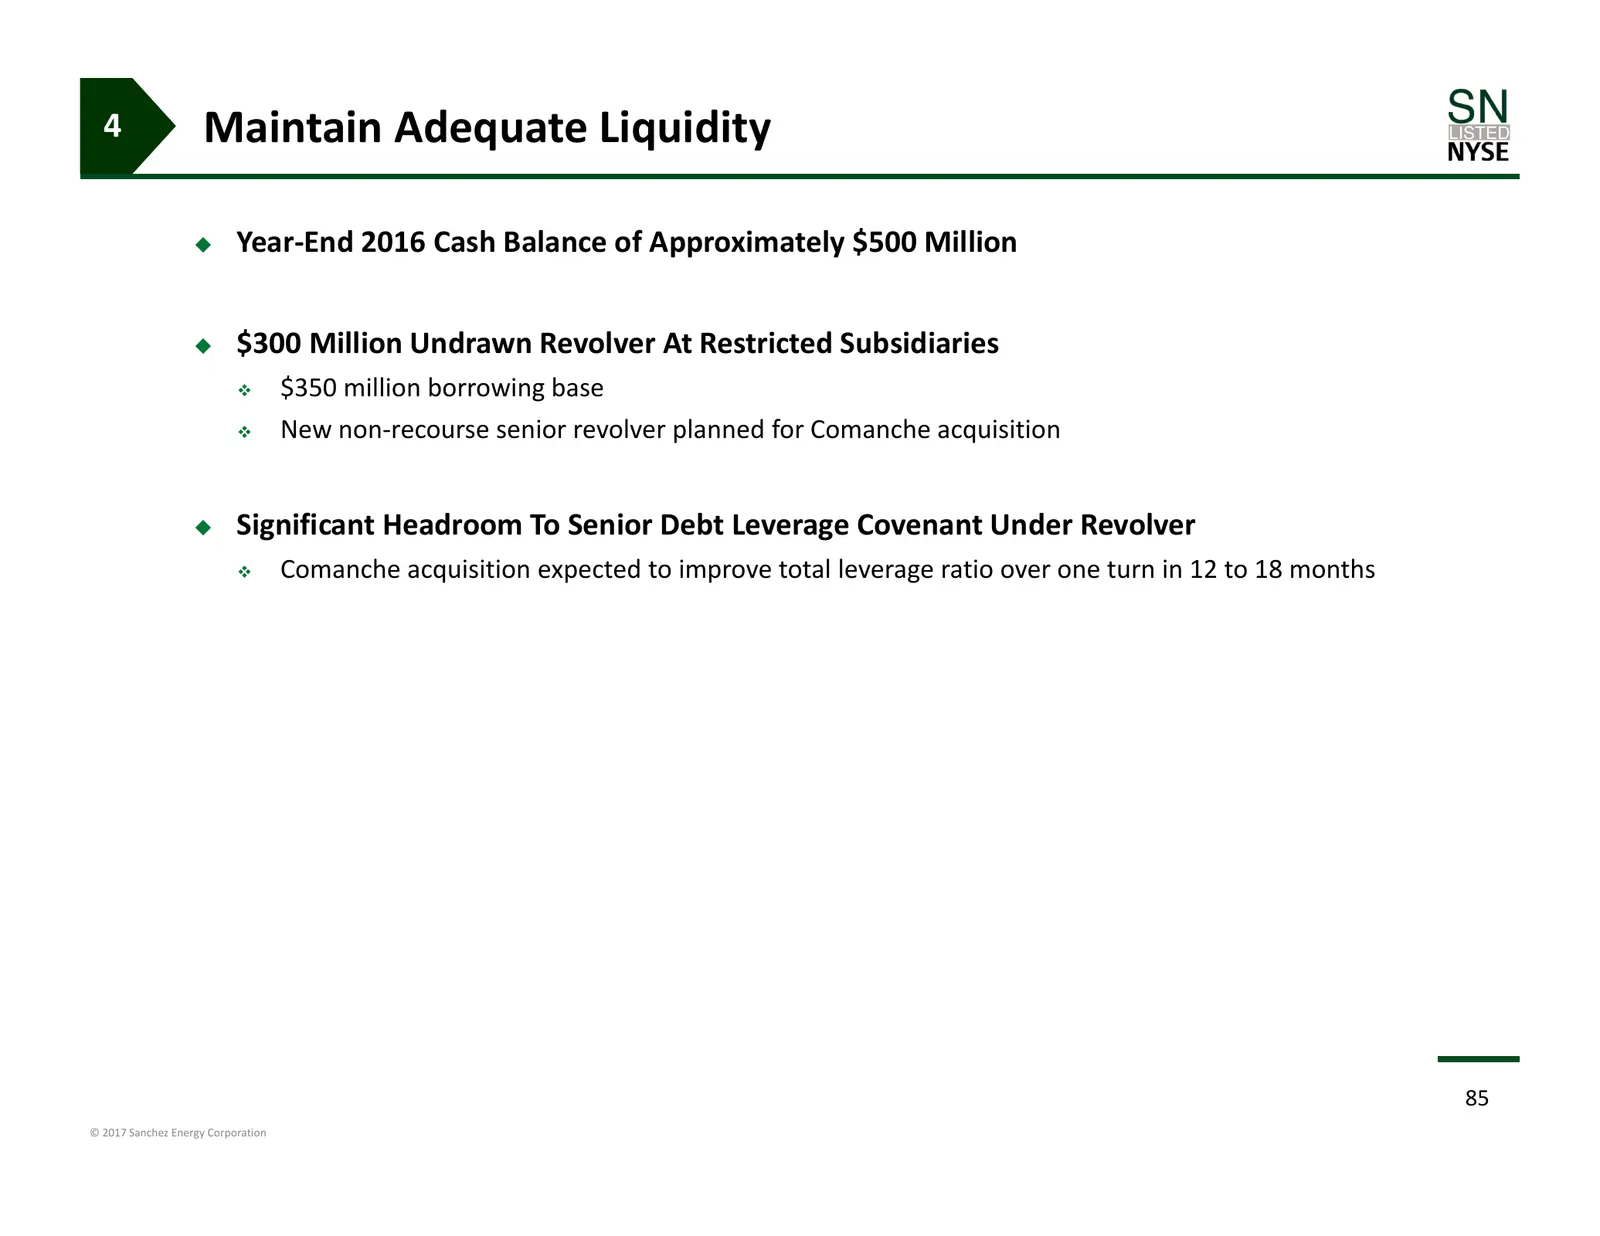
4 Maintain Adequate Liquidity Year‐End 2016 Cash Balance of Approximately $500 Million $300 Million Undrawn Revolver At Restricted Subsidiaries $350 million borrowing base New non‐recourse senior revolver planned for Comanche acquisition Significant Headroom To Senior Debt Leverage Covenan
Slide 86: Monetize Non-Core Assets to Build Liquidity
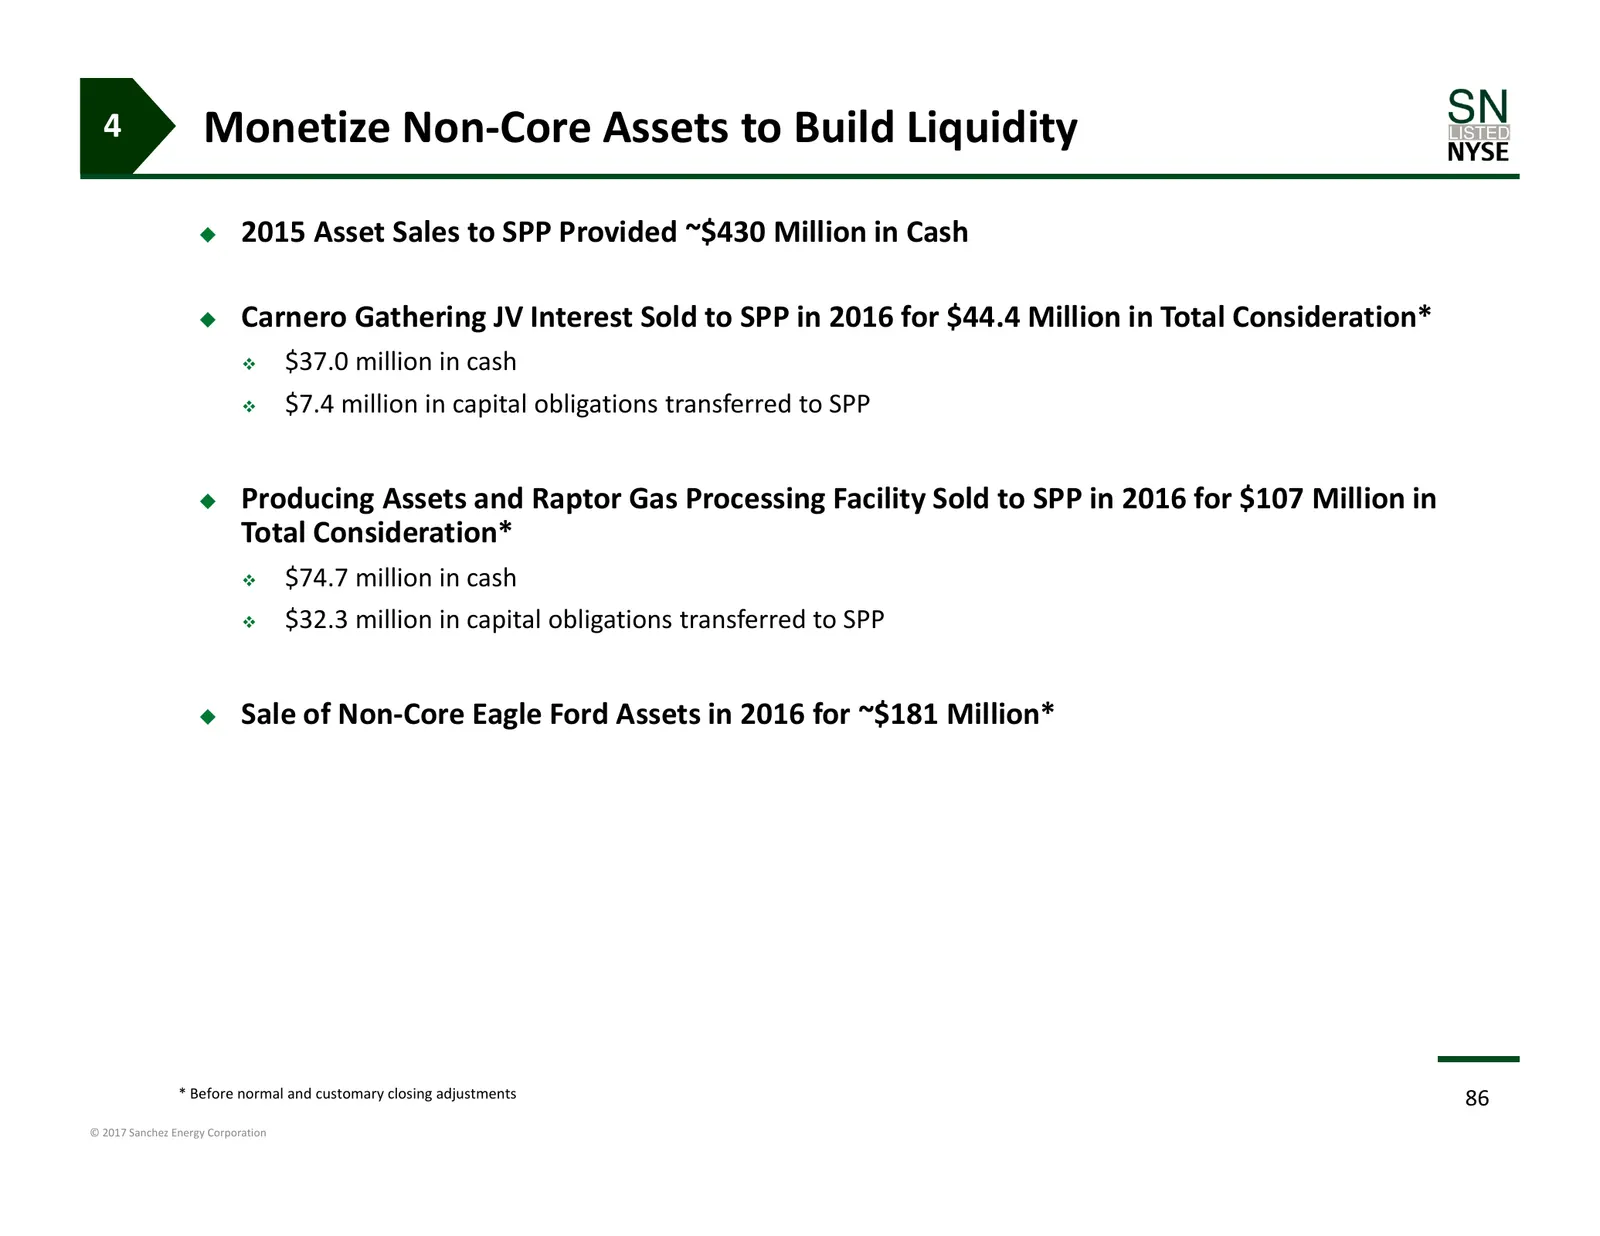
4 Monetize Non‐Core Assets to Build Liquidity 2015 Asset Sales to SPP Provided ~$430 Million in Cash Carnero Gathering JV Interest Sold to SPP in 2016 for $44.4 Million in Total Consideration* $37.0 million in cash $7.4 million in capital obligations transferred to SPP Producing Assets and
Slide 87: Extended Debt Maturity Runway
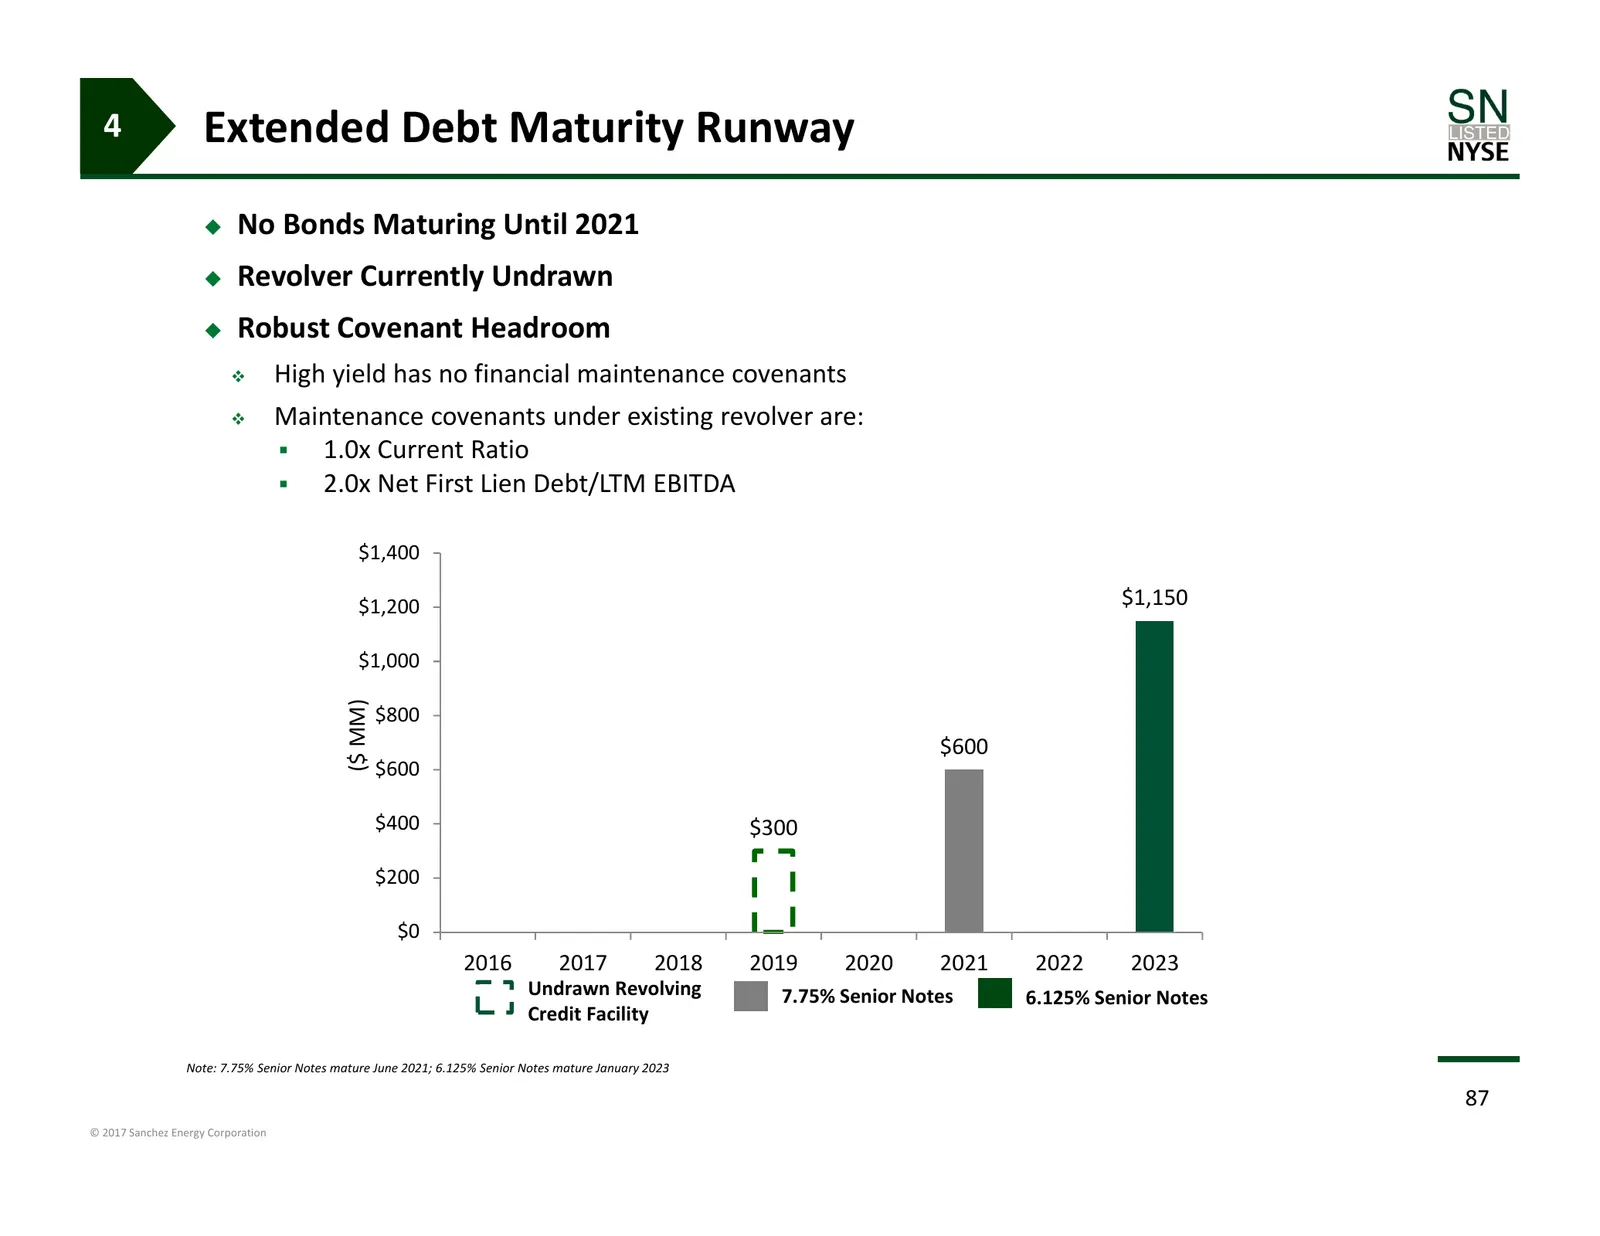
4 Extended Debt Maturity Runway No Bonds Maturing Until 2021 Revolver Currently Undrawn Robust Covenant Headroom High yield has no financial maintenance covenants Maintenance covenants under existing revolver are: 1.0x Current Ratio 2.0x Net First Lien Debt/LTM EBITDA $1,400 $1,200 $1,
Slide 88: Achieve Upside Through Blended Commodity Mix
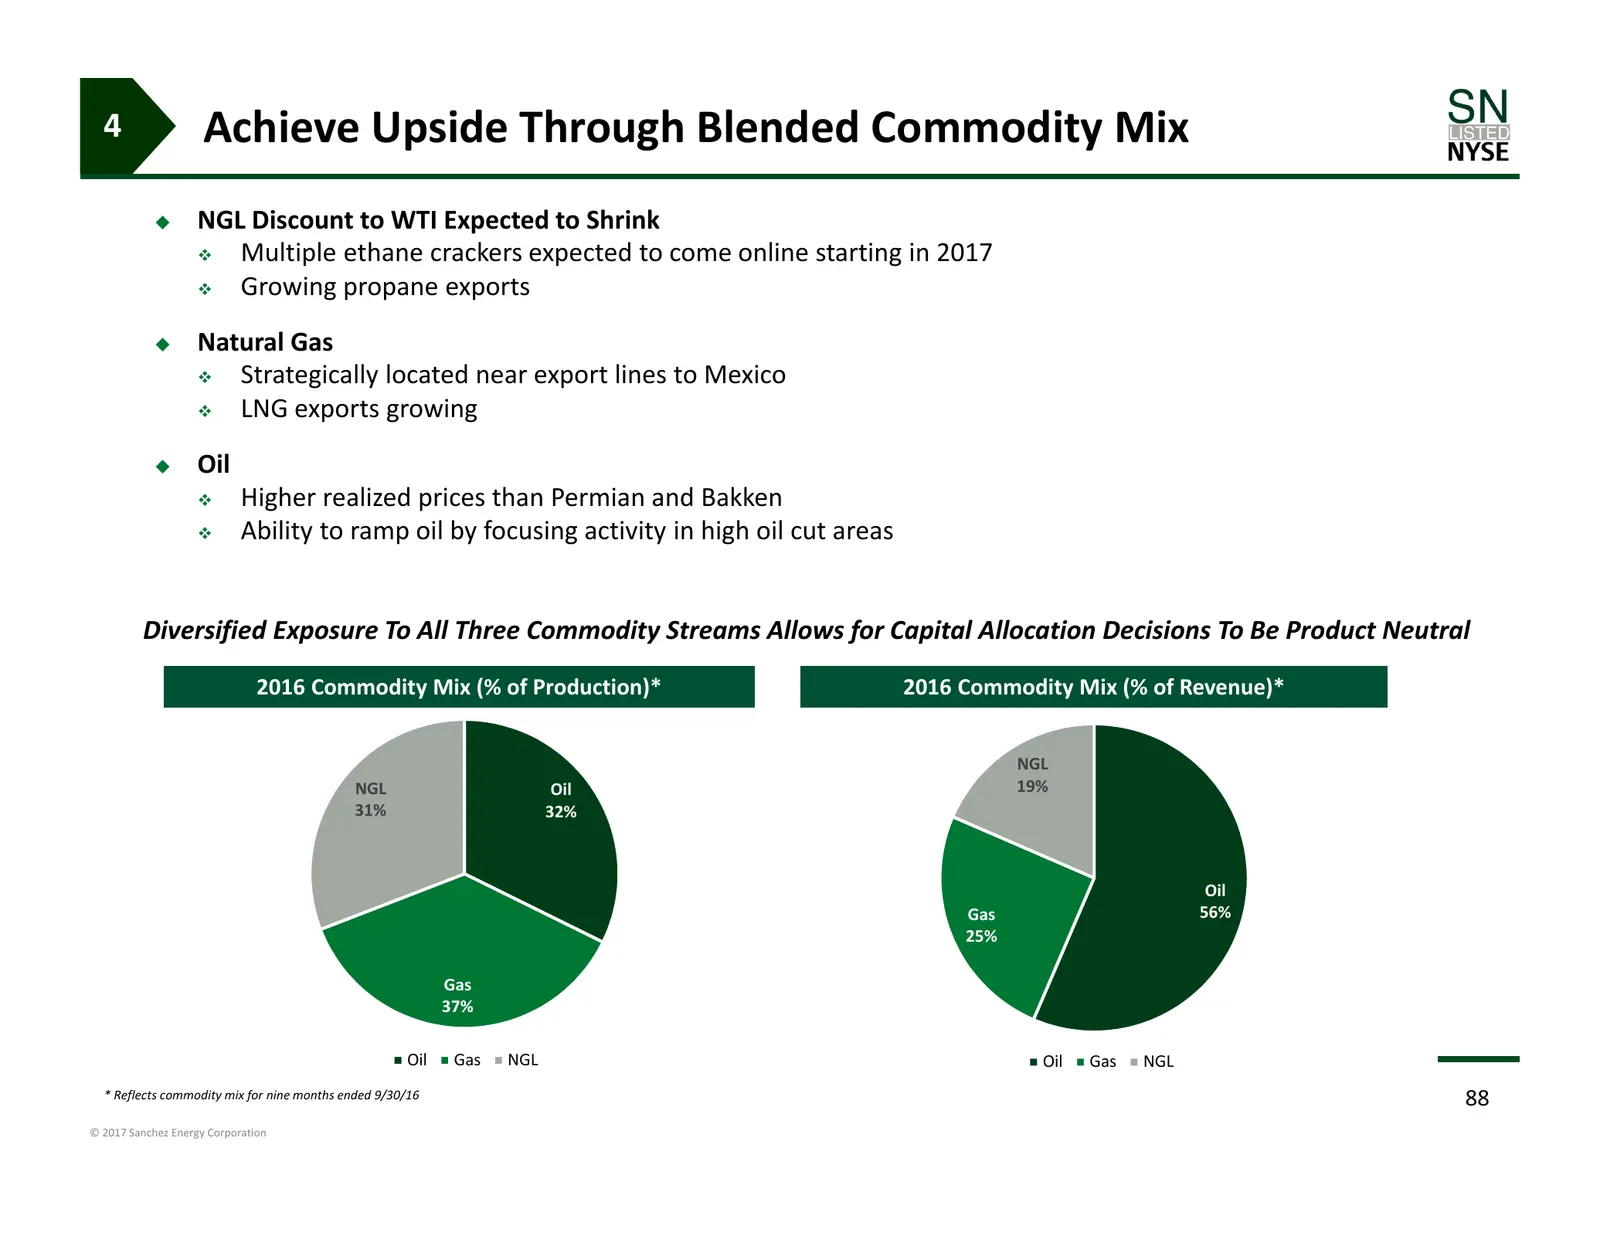
4 Achieve Upside Through Blended Commodity Mix NGL Discount to WTI Expected to Shrink Multiple ethane crackers expected to come online starting in 2017 Growing propane exports Natural Gas Strategically located near export lines to Mexico LNG exports growing Oil Higher realized prices
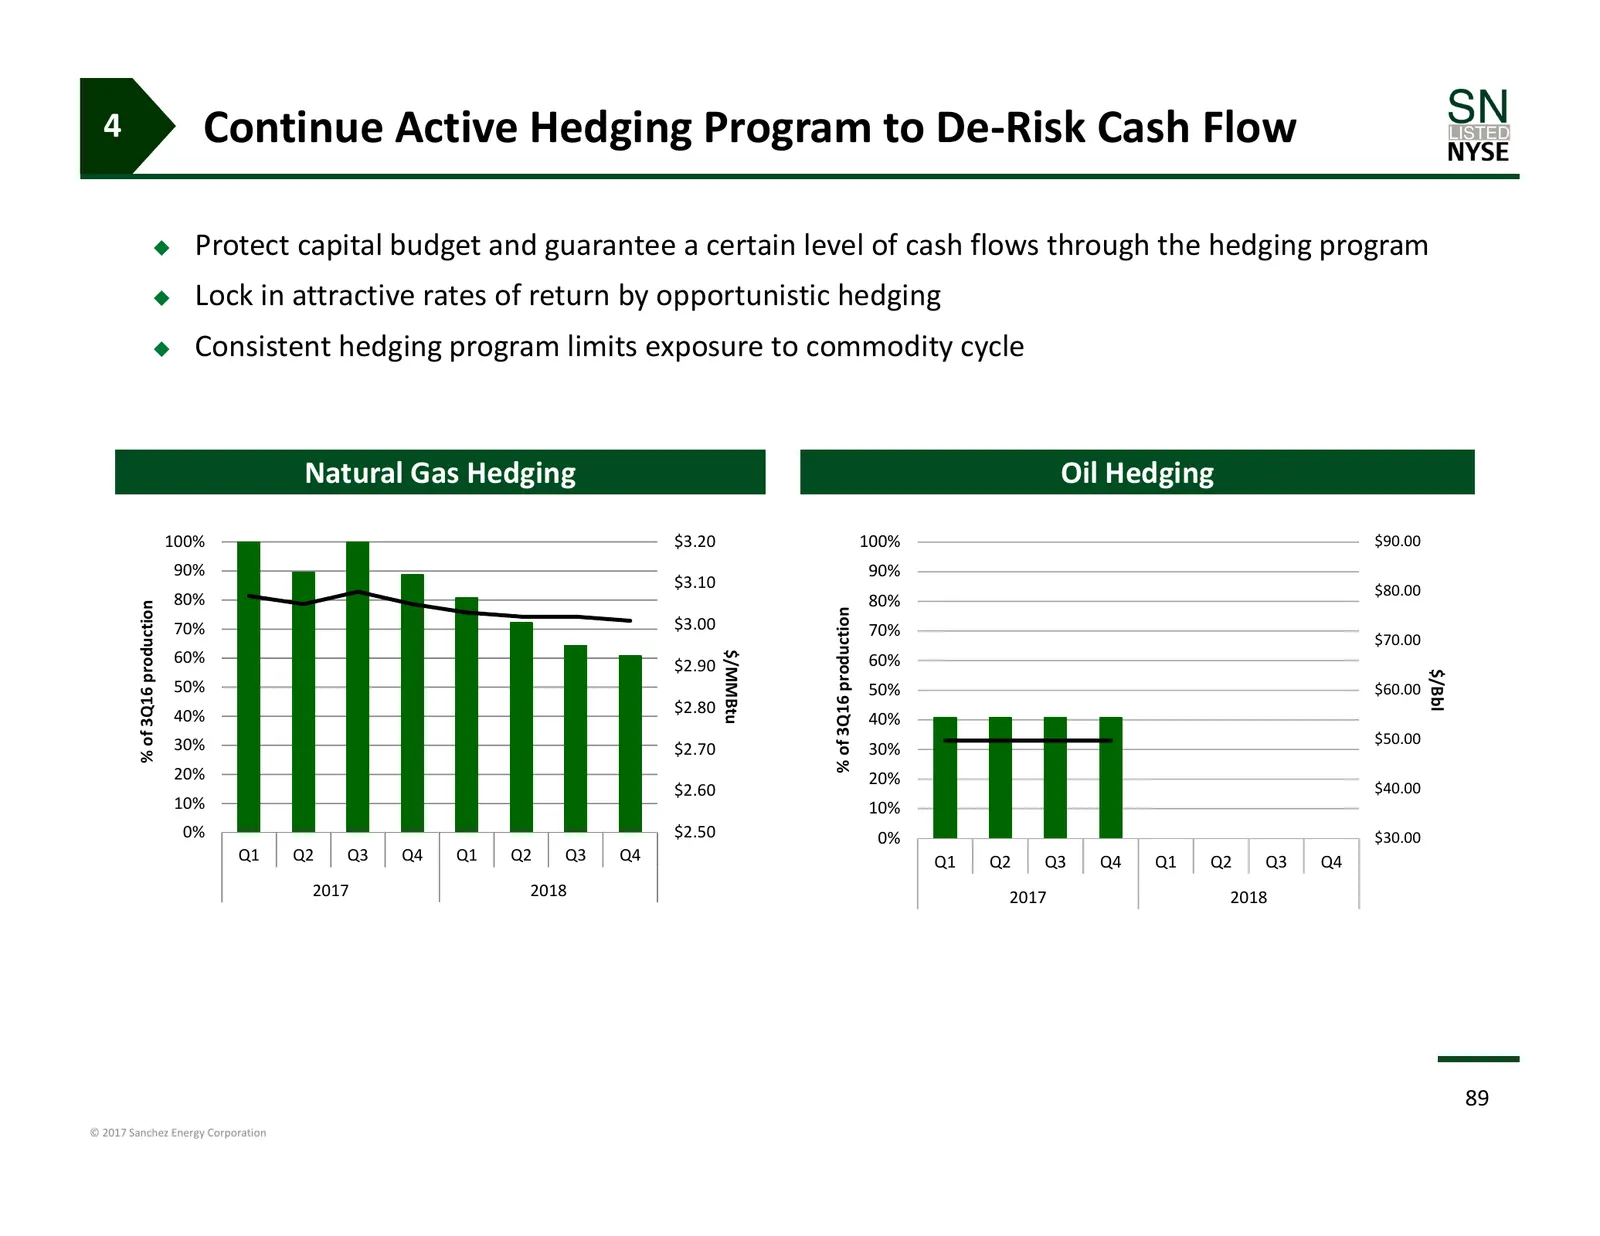
Slide 89: Continue Active Hedging Program to De-Risk Cash Flow
4 Continue Active Hedging Program to De‐Risk Cash Flow Protect capital budget and guarantee a certain level of cash flows through the hedging program Lock in attractive rates of return by opportunistic hedging Consistent hedging program limits exposure to commodity cycle Natural Gas Hedging Oi
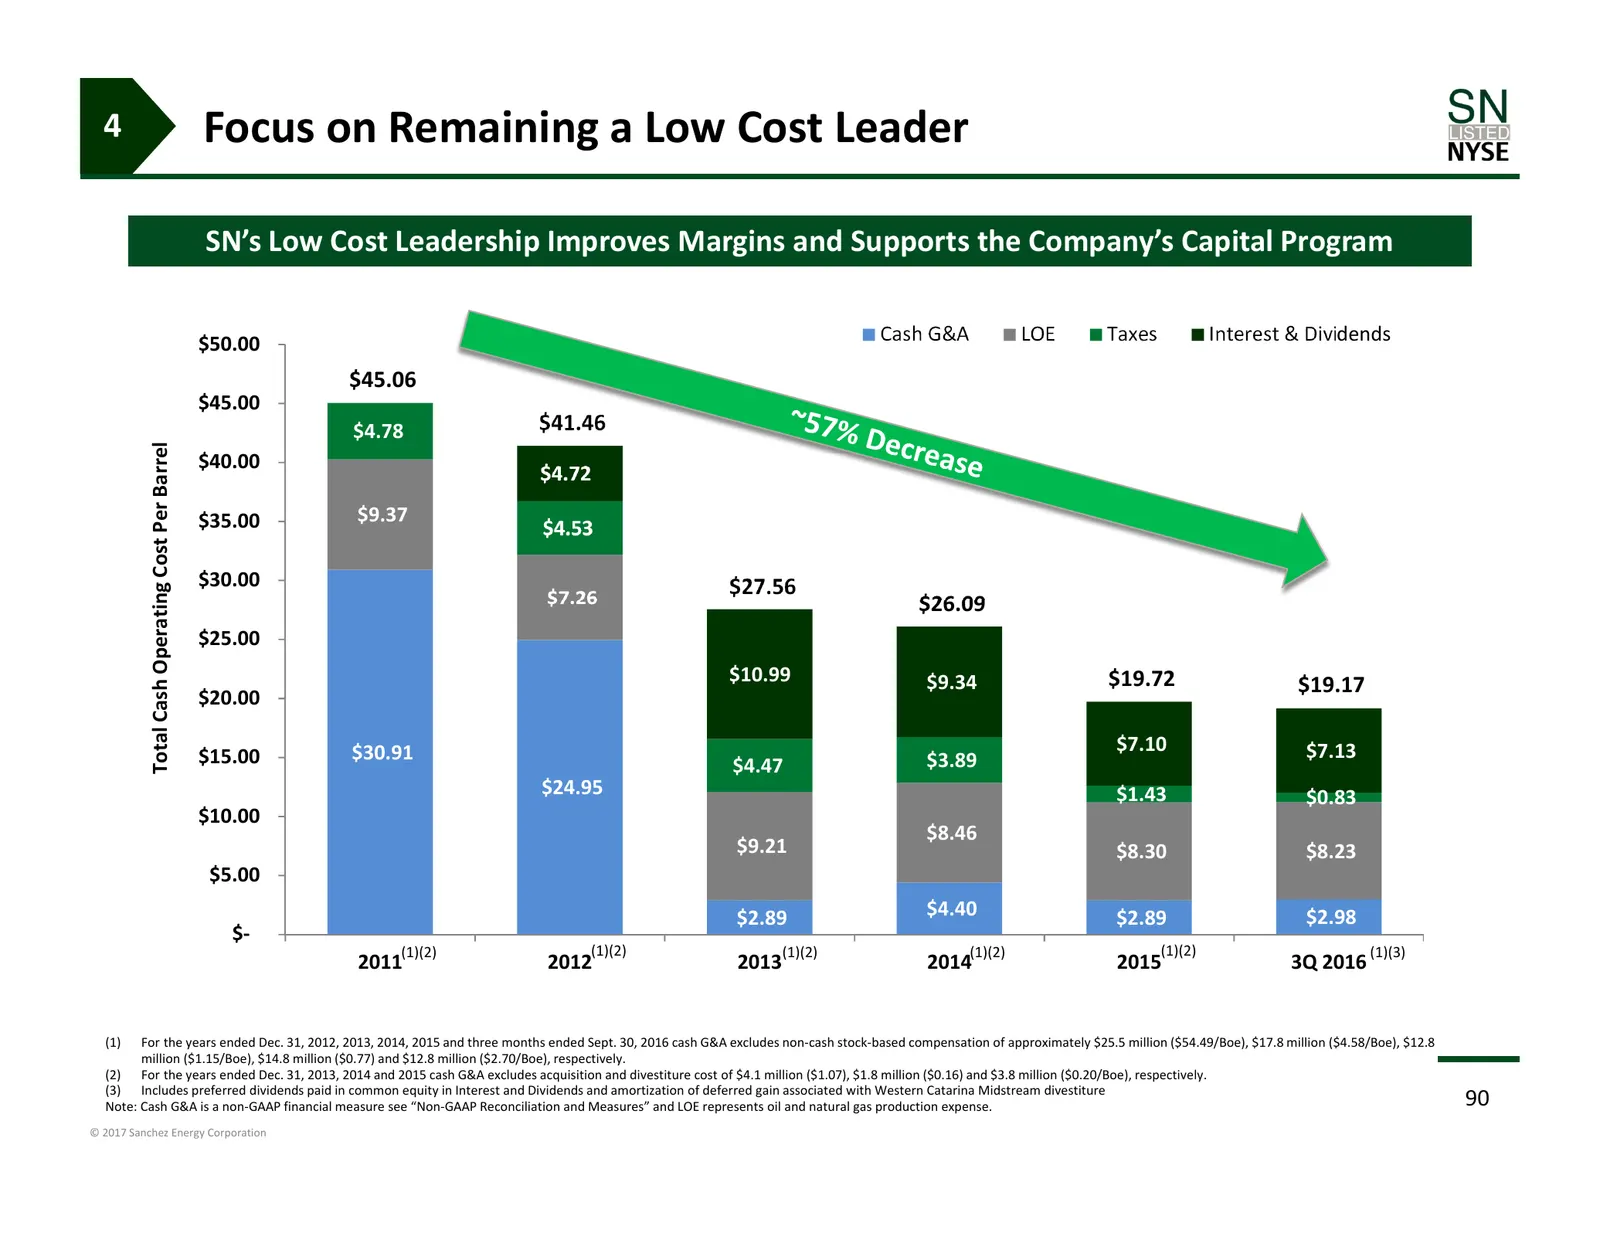
Slide 90: Focus on Remaining a Low Cost Leader
4 Focus on Remaining a Low Cost Leader SN’s Low Cost Leadership Improves Margins and Supports the Company’s Capital Program $50.00 Cash G&A LOE Taxes Interest & Dividends $45.06 $45.00 $4.78 $41.46 Total Cash Operating Cost Per Barrel $40.00 $4.72 $35.00 $9.37 $4.53 $30.00 $27.56 $7.26 $26.09 $25.00
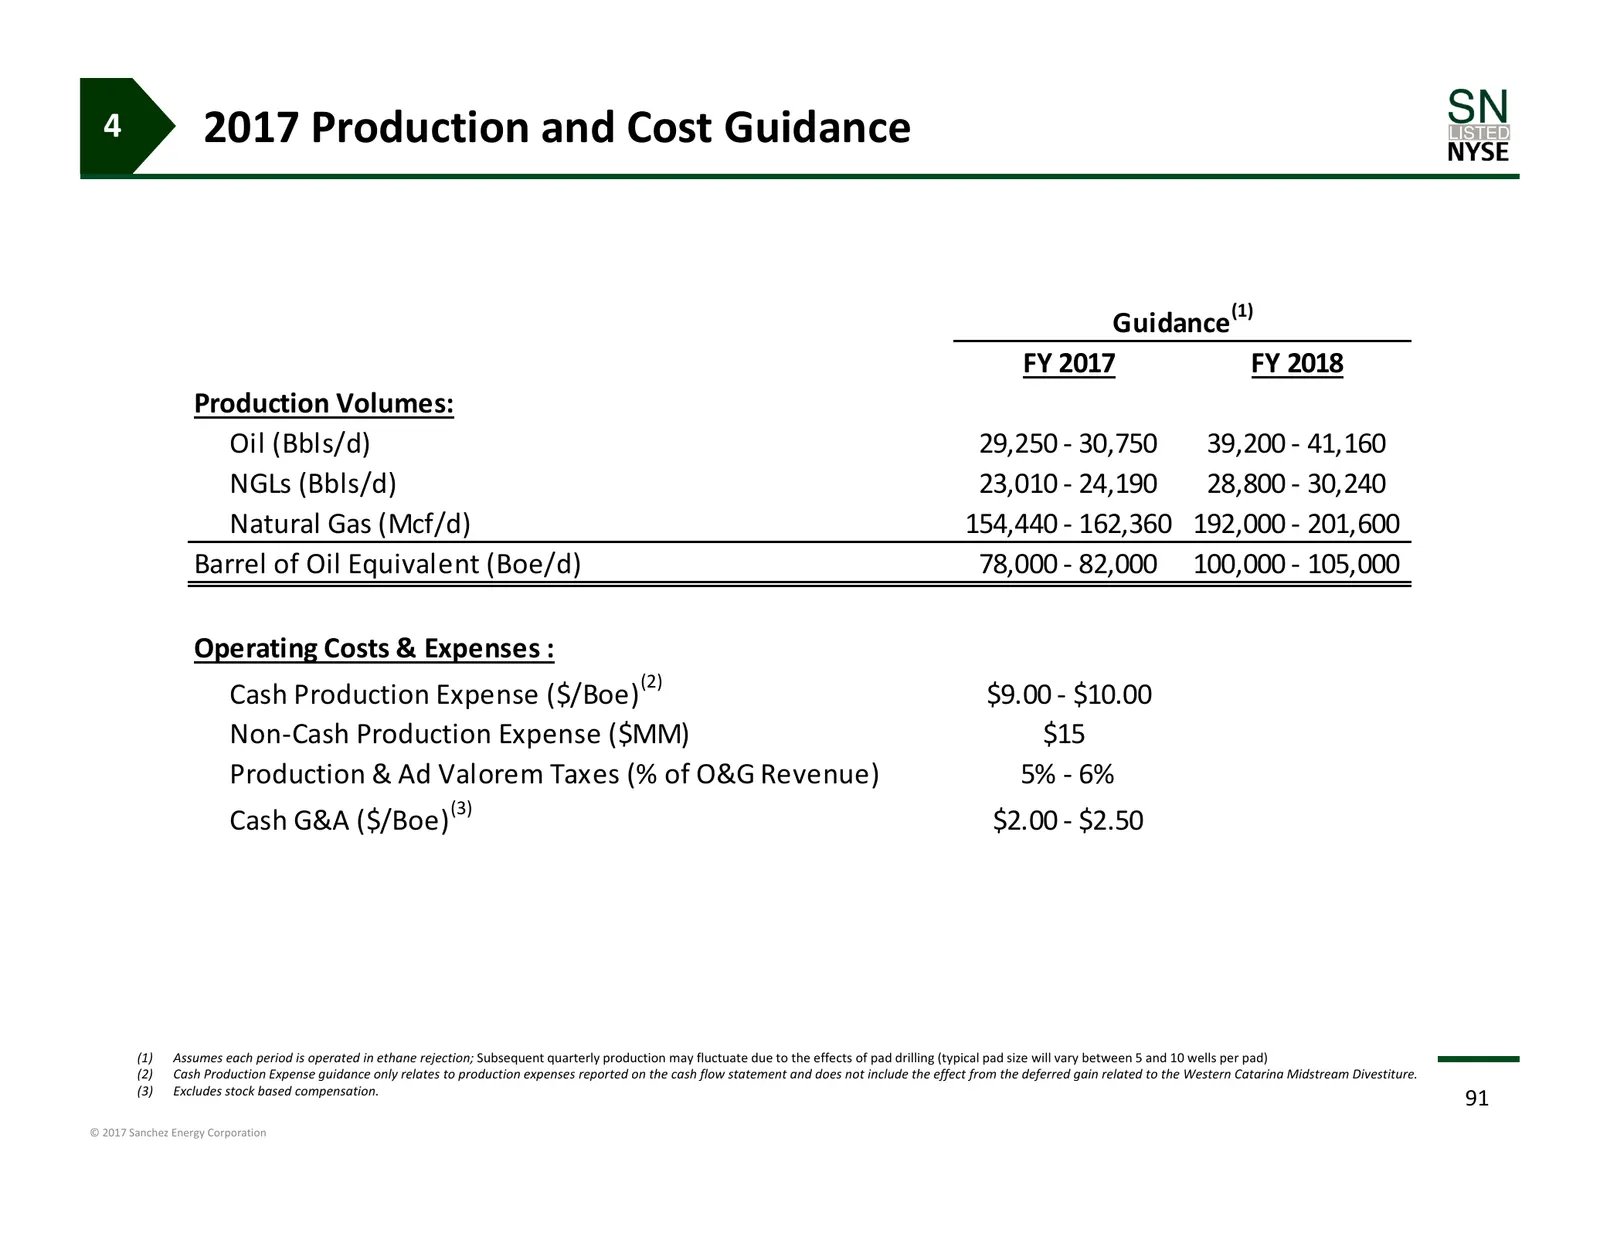
Slide 91: 2017 Production and Cost Guidance
4 2017 Production and Cost Guidance (1) Guidance FY 2017 FY 2018 Production Volumes: Oil (Bbls/d) 29,250 ‐ 30,750 39,200 ‐ 41,160 NGLs (Bbls/d) 23,010 ‐ 24,190 28,800 ‐ 30,240 Natural Gas (Mcf/d) 154,440 ‐ 162,360 192,000 ‐ 201,600 Barrel of Oil Equivalent (Boe/d) 78,000 ‐ 82,000 100,000 ‐ 105,000 O
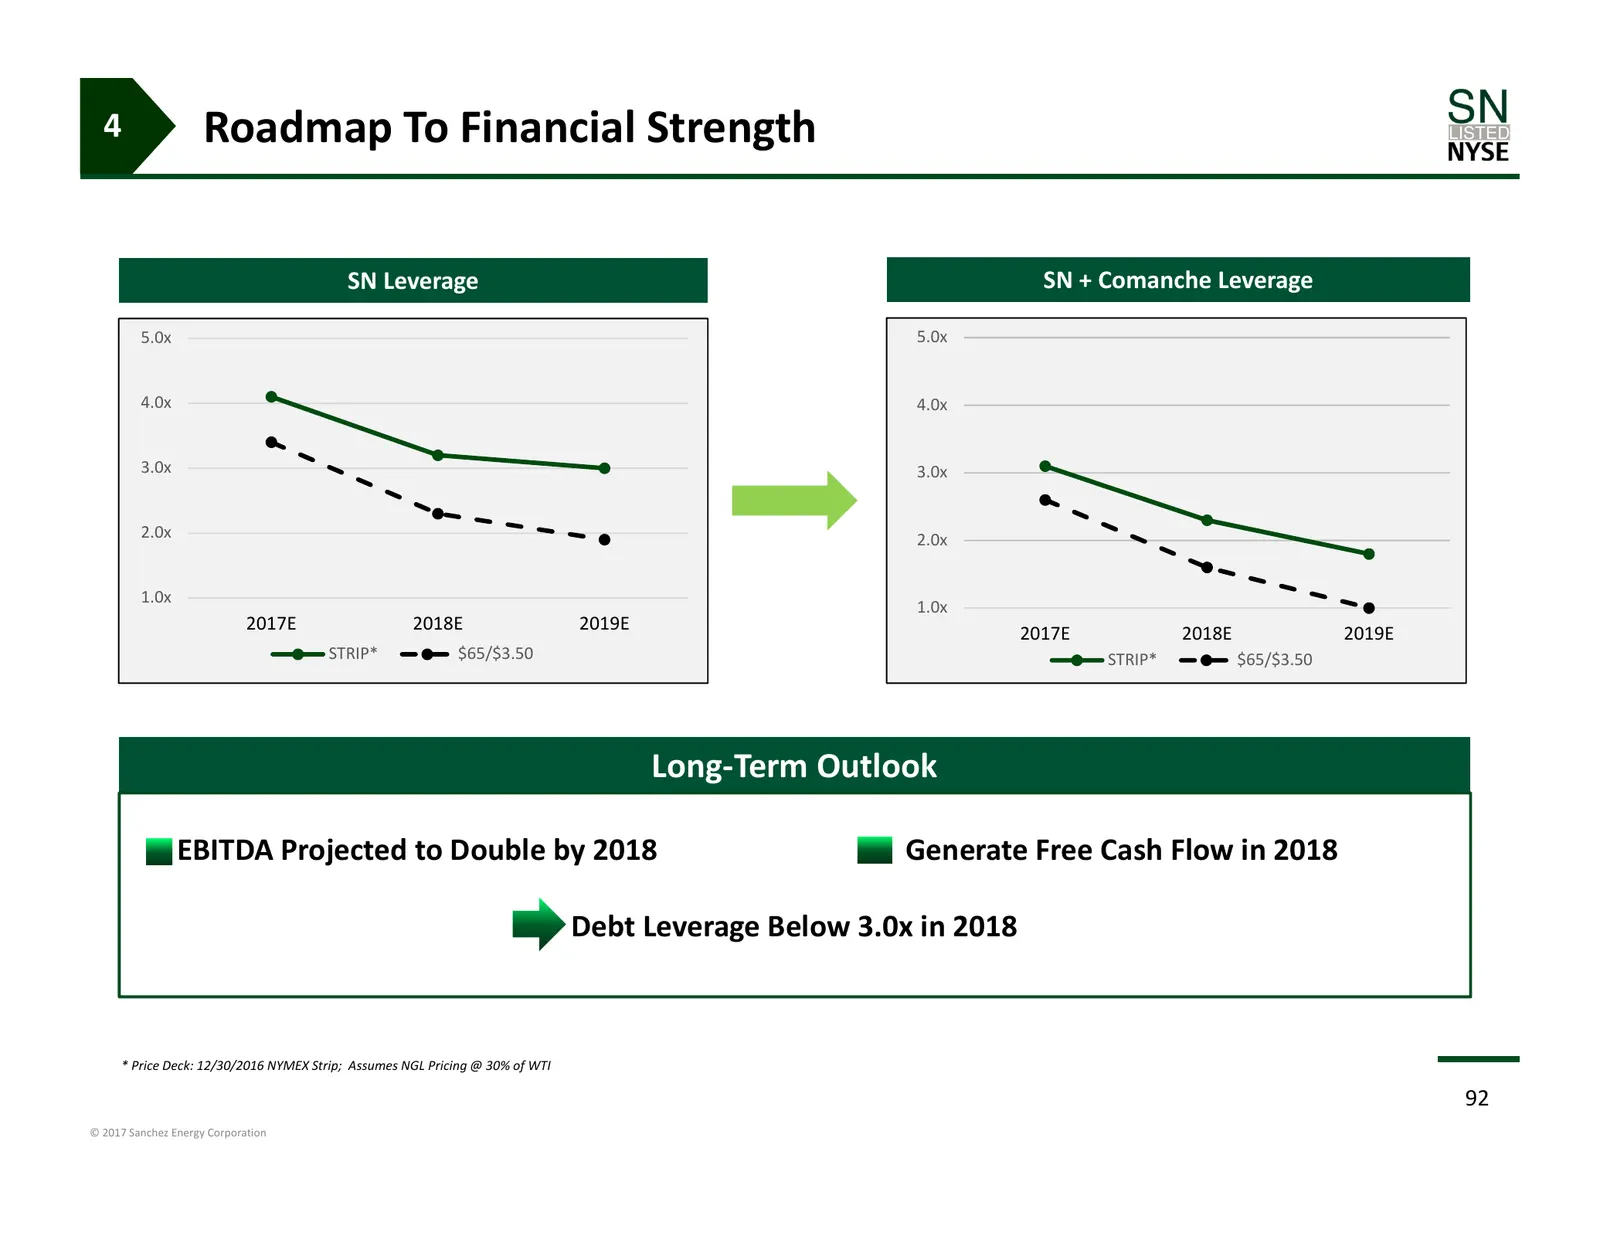
Slide 92: Roadmap To Financial Strength
4 Roadmap To Financial Strength SN Leverage SN + Comanche Leverage 5.0x 5.0x 4.0x 4.0x 3.0x 3.0x 2.0x 2.0x 1.0x 1.0x 2017E 2018E 2019E 2017E 2018E 2019E STRIP* $65/$3.50 STRIP* $65/$3.50 Long‐Term Outlook EBITDA Projected to Double by 2018 Generate Free Cash Flow in 2018 Debt Leverage Below 3.0x in
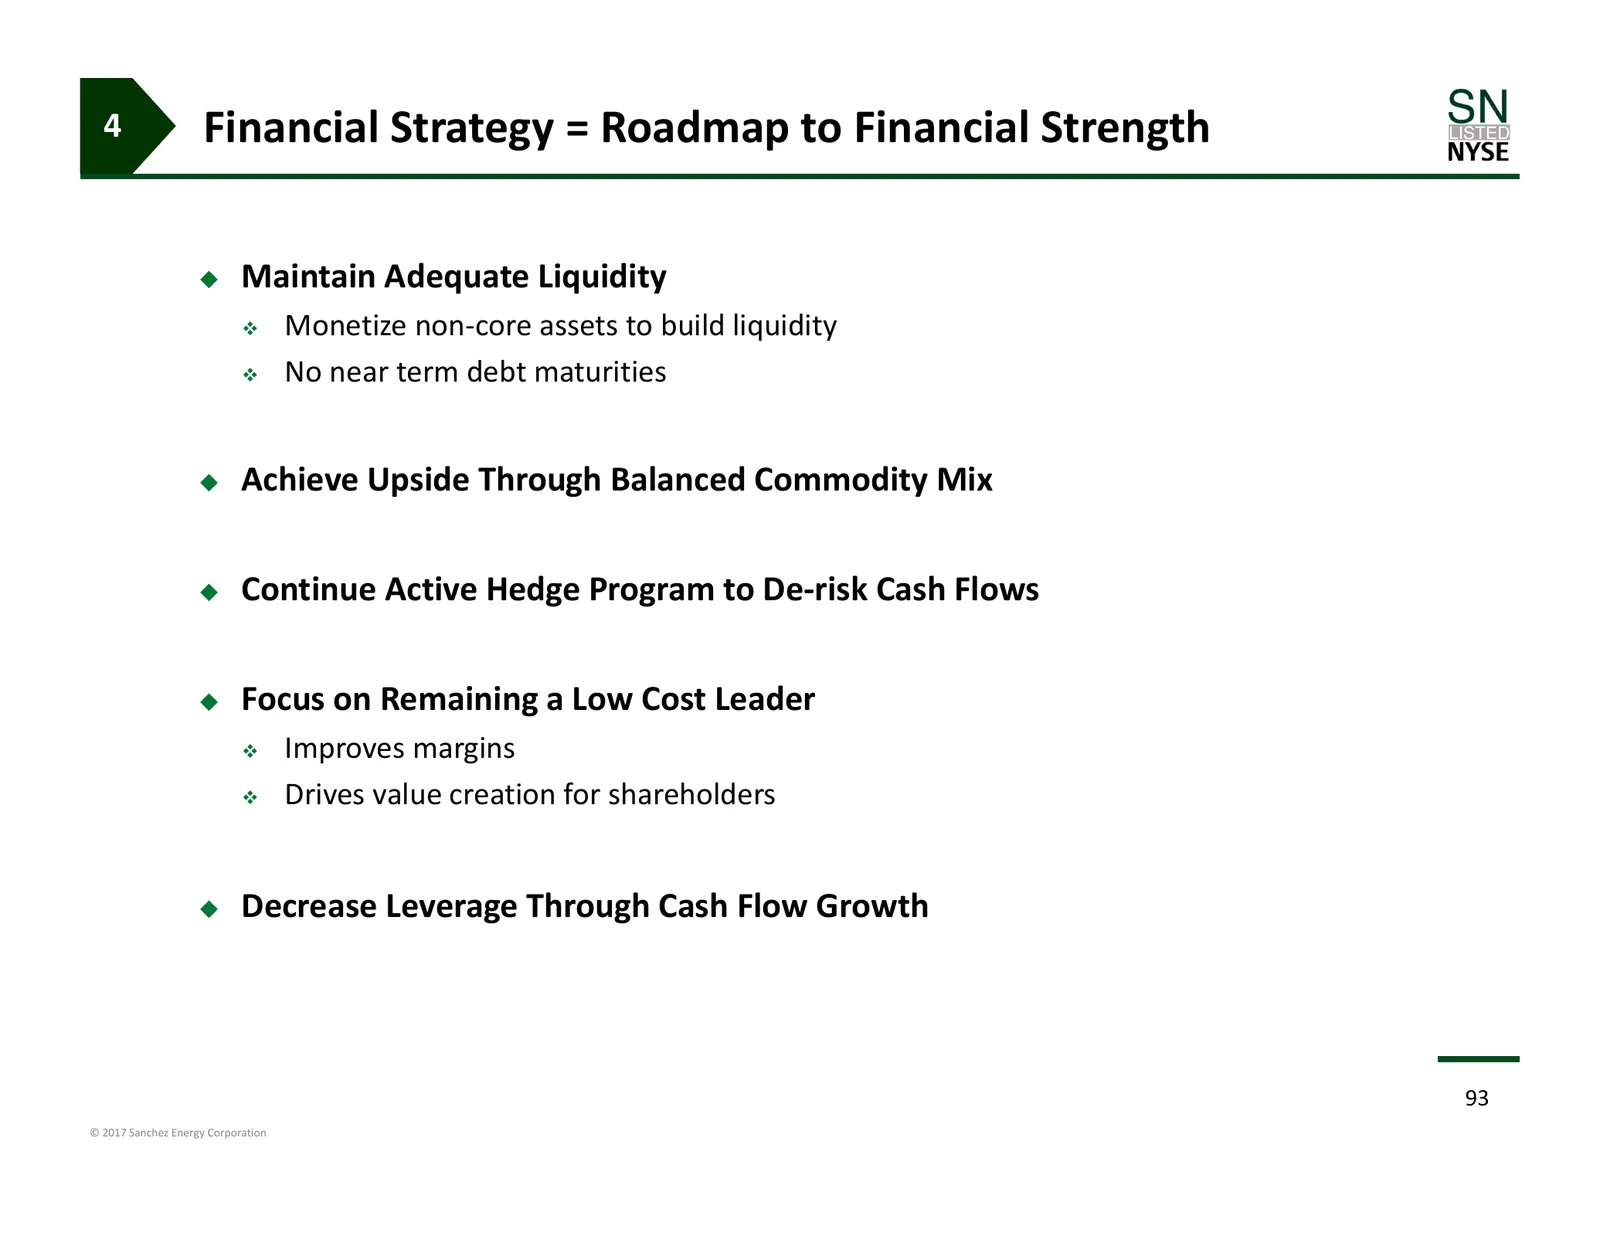
Slide 93: Financial Strategy = Roadmap to Financial Strength
4 Financial Strategy = Roadmap to Financial Strength Maintain Adequate Liquidity Monetize non‐core assets to build liquidity No near term debt maturities Achieve Upside Through Balanced Commodity Mix Continue Active Hedge Program to De‐risk Cash Flows Focus on Remaining a Low Cost Leader
Slide 94: Summary
Summary 94 © 2017 Sanchez Energy Corporation
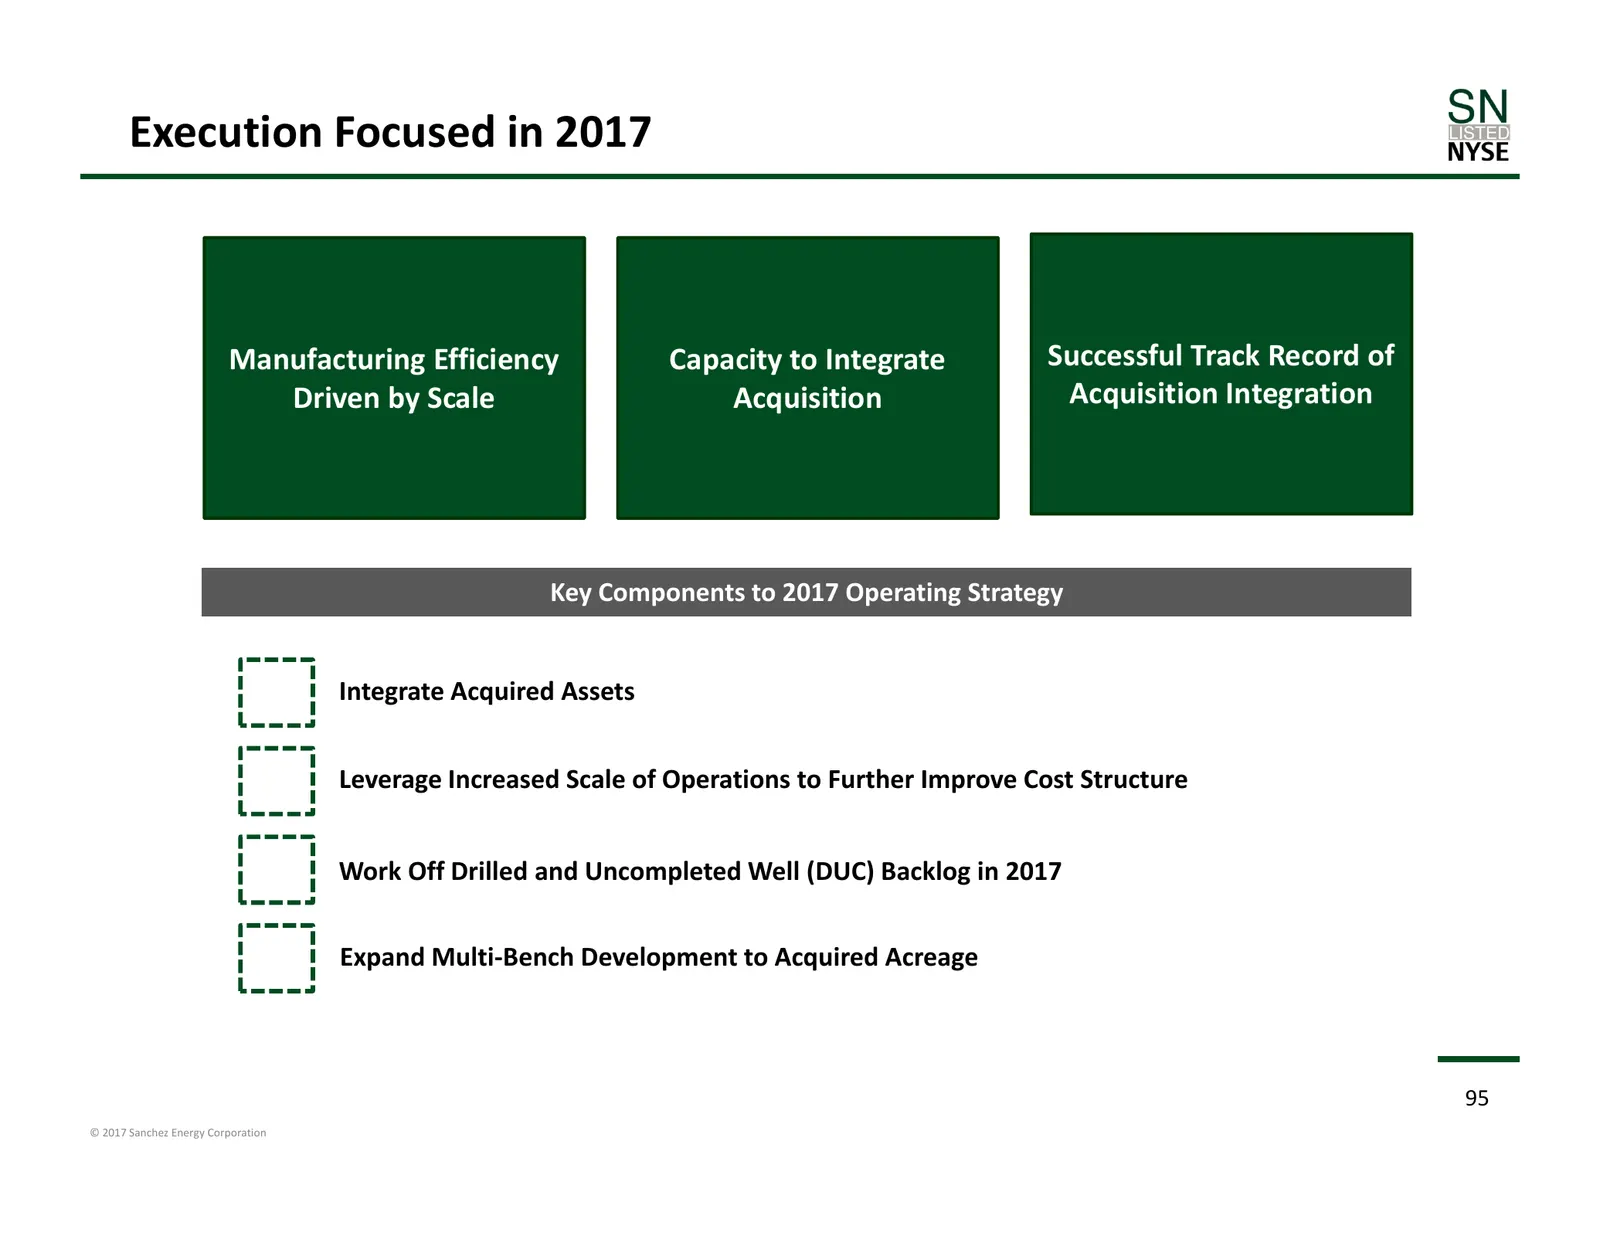
Slide 95: Execution Focused in 2017
Execution Focused in 2017 Manufacturing Efficiency Capacity to Integrate Successful Track Record of Driven by Scale Acquisition Acquisition Integration Key Components to 2017 Operating Strategy Integrate Acquired Assets Leverage Increased Scale of Operations to Further Improve Cost Structure Work Of
Slide 96: Appendix
Appendix 96 © 2017 Sanchez Energy Corporation
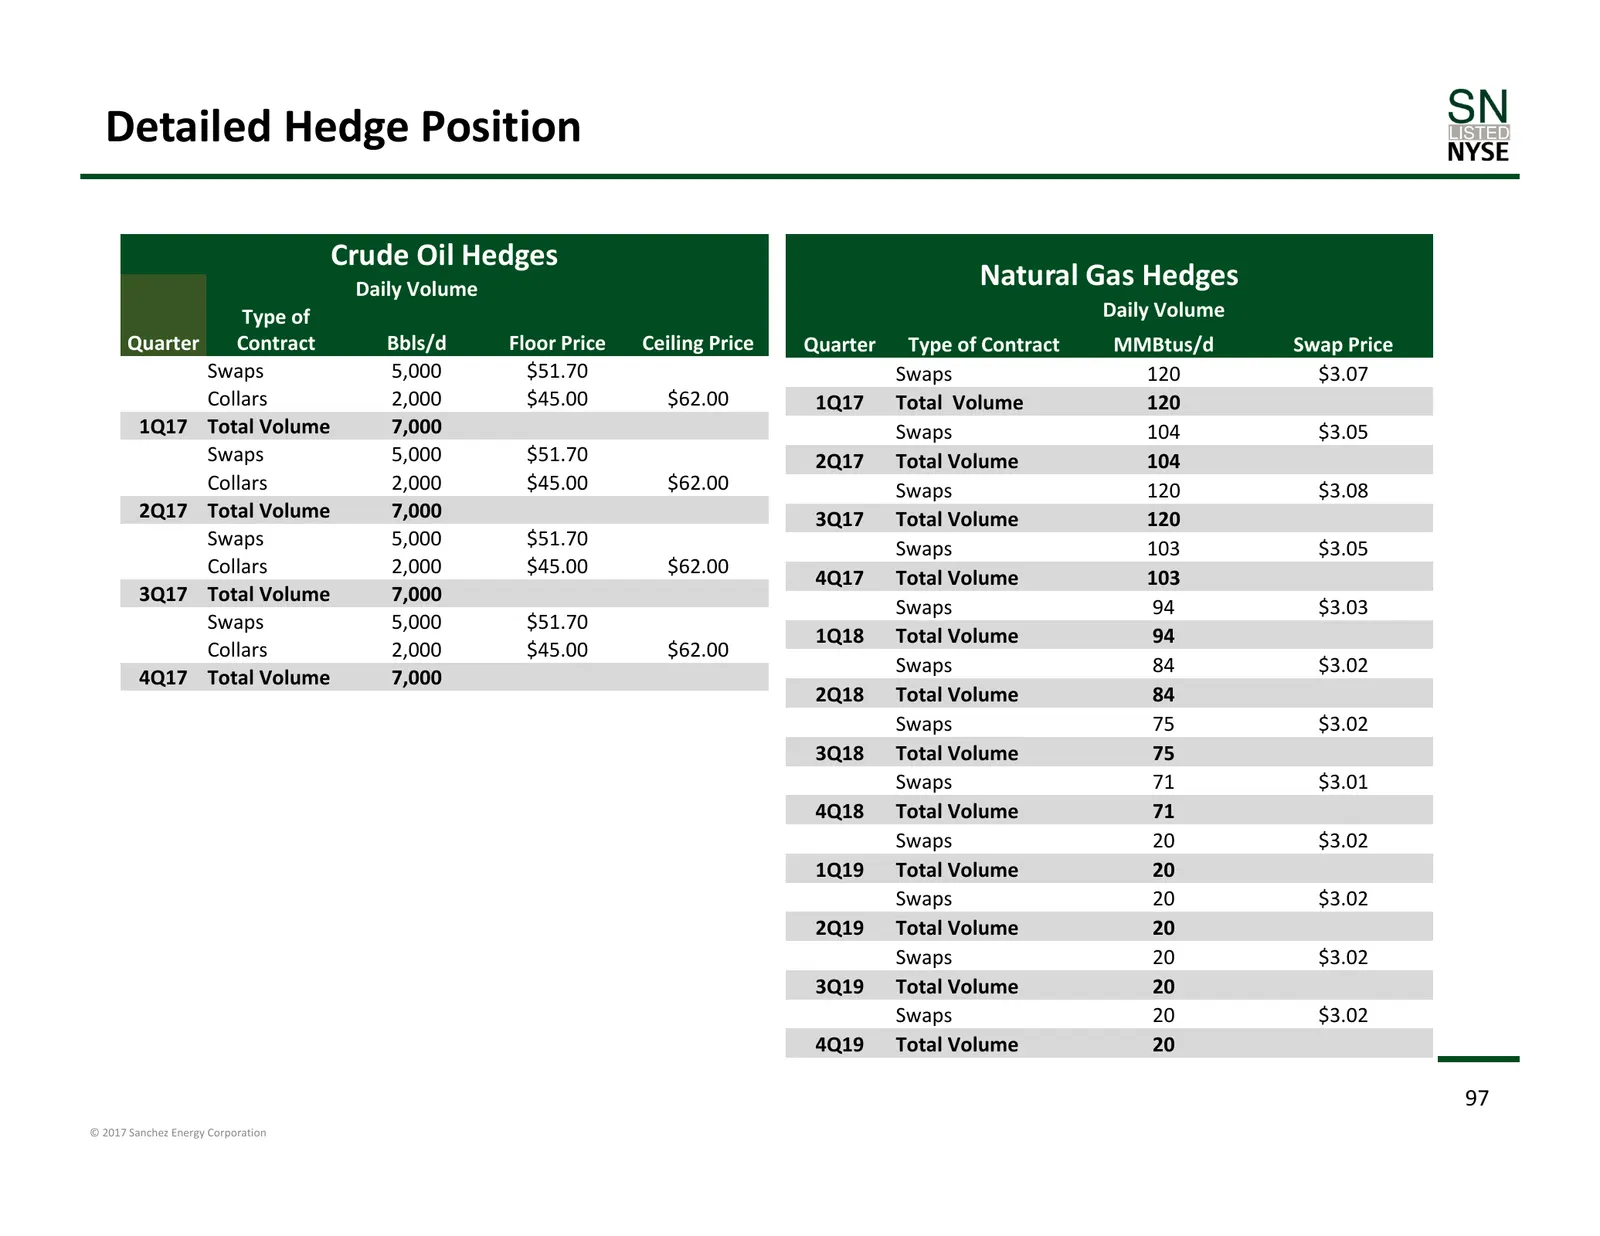
Slide 97: Detailed Hedge Position
Detailed Hedge Position Crude Oil Hedges Daily Volume Natural Gas Hedges Type of Daily Volume Quarter Contract Bbls/d Floor Price Ceiling Price Quarter Type of Contract MMBtus/d Swap Price Swaps 5,000 $51.70 Swaps 120 $3.07 Collars 2,000 $45.00 $62.00 1Q17 Total Volume 120 1Q17 Total Volume 7,000 Sw
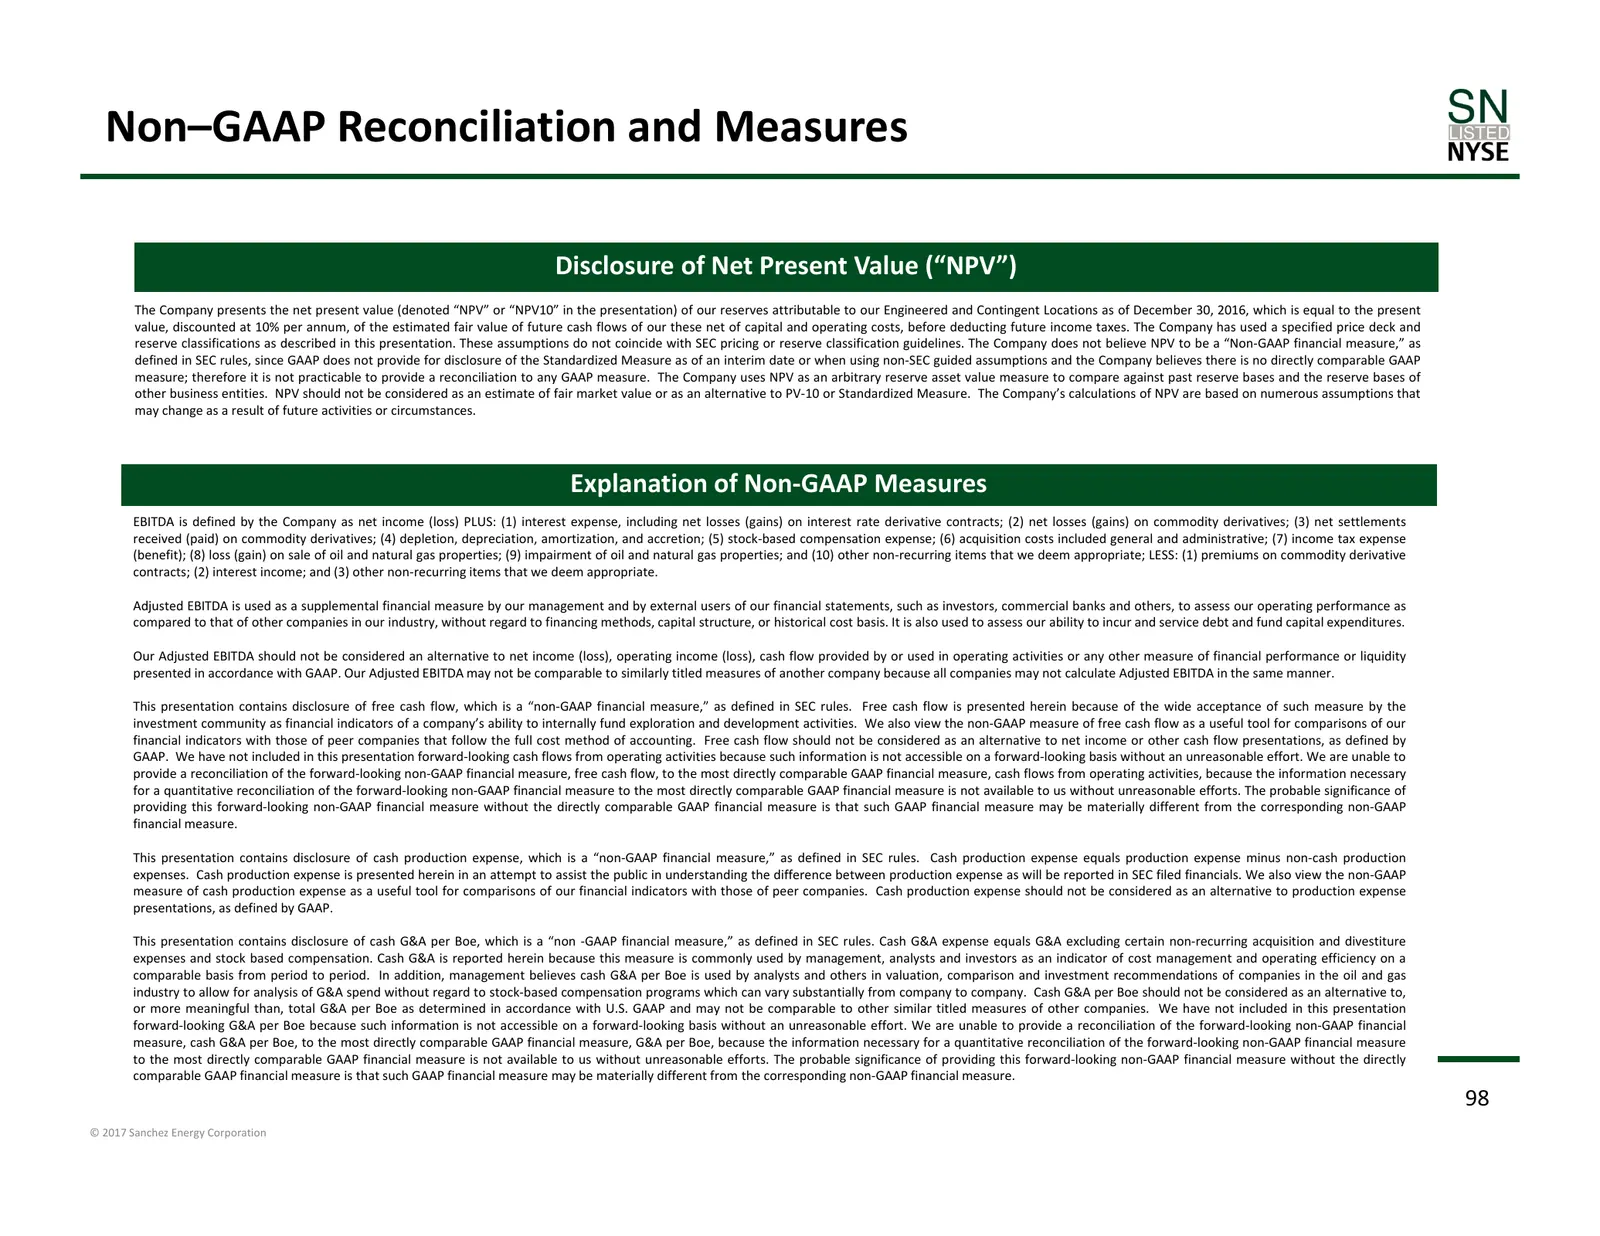
Slide 98: Non-GAAP Reconciliation and Measures
Non–GAAP Reconciliation and Measures Disclosure of Net Present Value (“NPV”) The Company presents the net present value (denoted “NPV” or “NPV10” in the presentation) of our reserves attributable to our Engineered and Contingent Locations as of December 30, 2016, which is equal to the present value,
Source: SEC EDGAR · 8-K filed Jan 23, 2017
More decks from Sanchez Energy Corporation
 Corporate Update (April 2020)49 slides · Apr 7, 2020
 Corporate Update (March 2020)47 slides · Mar 11, 2020
 Presentation (August 2019)7 slides · Aug 12, 2019
 Presentation (August 2019)64 slides · Aug 12, 2019
 Debt Investor Presentation (August 2019)5 slides · Aug 12, 2019
 Investor Presentation (February 2018)36 slides · Feb 1, 2018