William Lyon Homes — Q2 2017 Earnings Presentation
17 slides from William Lyon Homes's earnings presentation, Aug 7, 2017
Slide 1: 2017 Q2 Earnings Call
2017 Q2 Earnings Call August 7, 2017, 9:00 am PT Exhibit 99.2
Slide 2: Forward Looking Statements and Non-GAAP Information
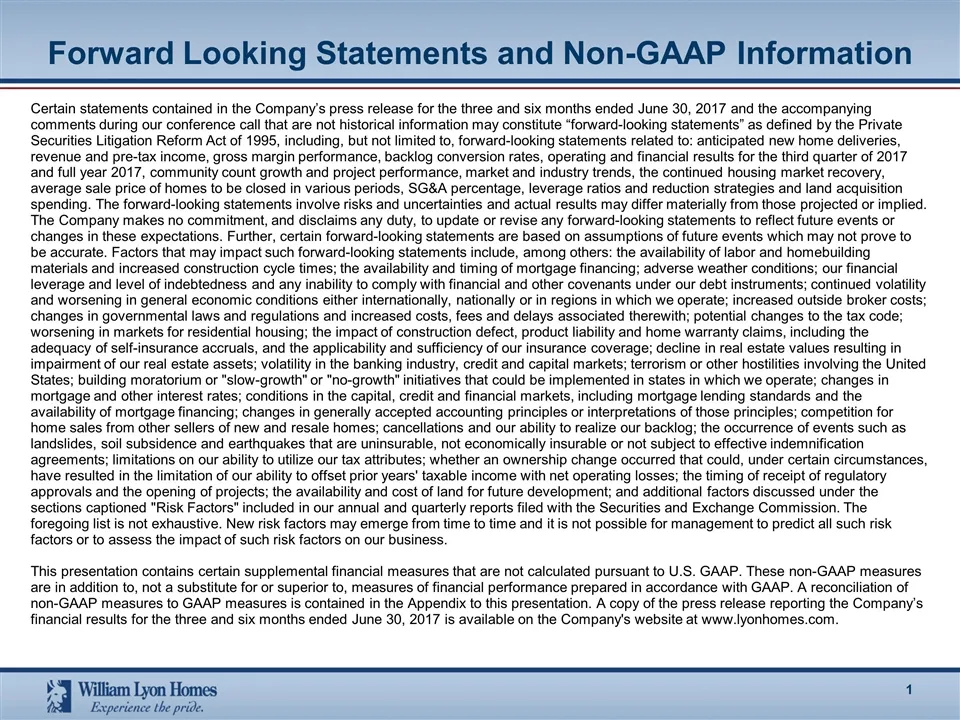
Forward Looking Statements and Non-GAAP Information Certain statements contained in the Company’s press release for the three and six months ended June 30, 2017 and the accompanying comments during our conference call that are not historical information may constitute “forward-looking statements” as
Slide 3: Management Presenters
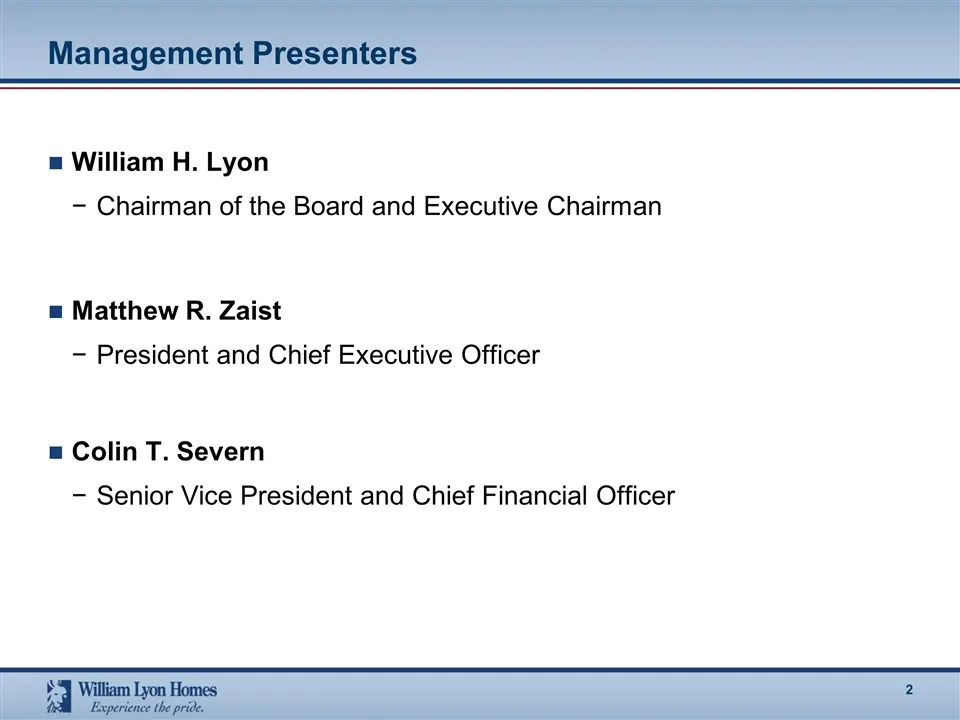
Management Presenters William H. Lyon Chairman of the Board and Executive Chairman Matthew R. Zaist President and Chief Executive Officer Colin T. Severn Senior Vice President and Chief Financial Officer
Slide 4: 2017 Sales Volume – Actual vs. Prior Year
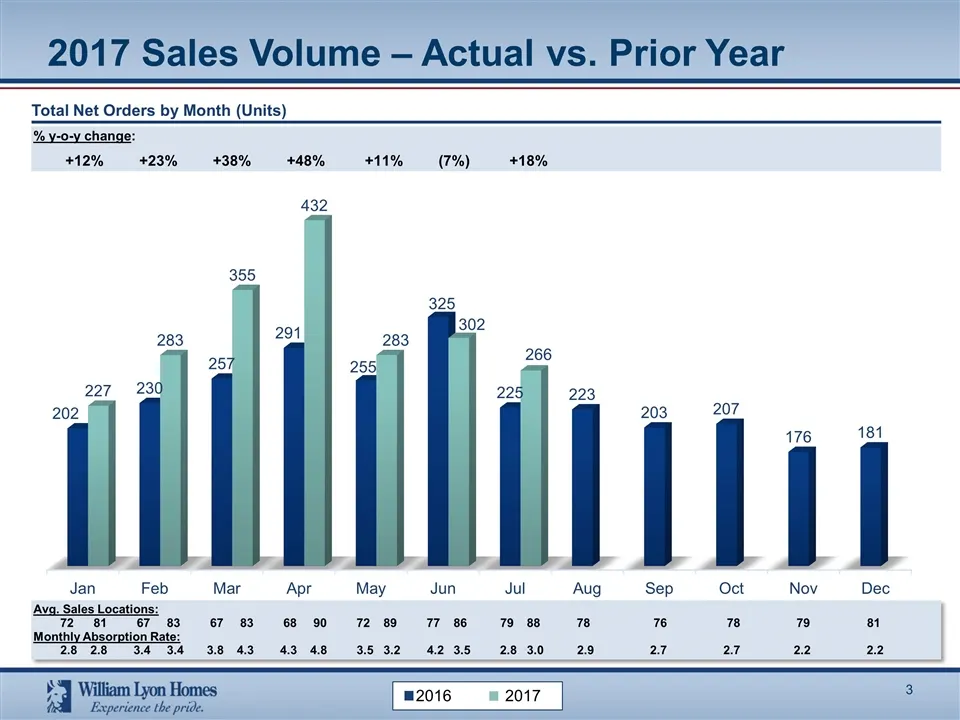
2017 Sales Volume – Actual vs. Prior Year Total Net Orders by Month (Units) % y-o-y change: +12% +23% +38% +48% +11% (7%) +18% 2016 2017 Avg. Sales Locations: 72 81 67 83 67 83 68 90 72 89 77 86 79 88 78 76 78 79 81 Monthly Absorption Rate: 2.8 2.8 3.4 3.4 3.8 4.3 4.3 4.8 3.5 3.2 4.2 3.5 2.8 3.0 2.9
Slide 5: Backlog Growth – Year over Year
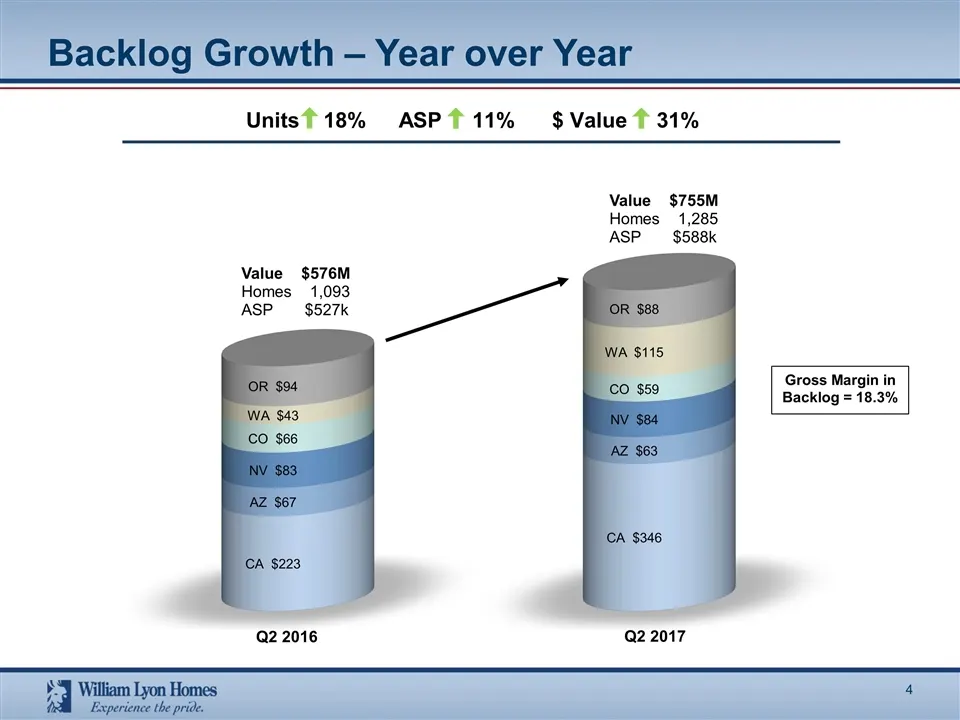
Backlog Growth – Year over Year Value $576M Homes 1,093 ASP $527k Q2 2016 Q2 2017 Value $755M Homes 1,285 ASP $588k Units 18%ASP 11%$ Value 31% Gross Margin in Backlog = 18.3%
Slide 6: Year over Year Comparisons
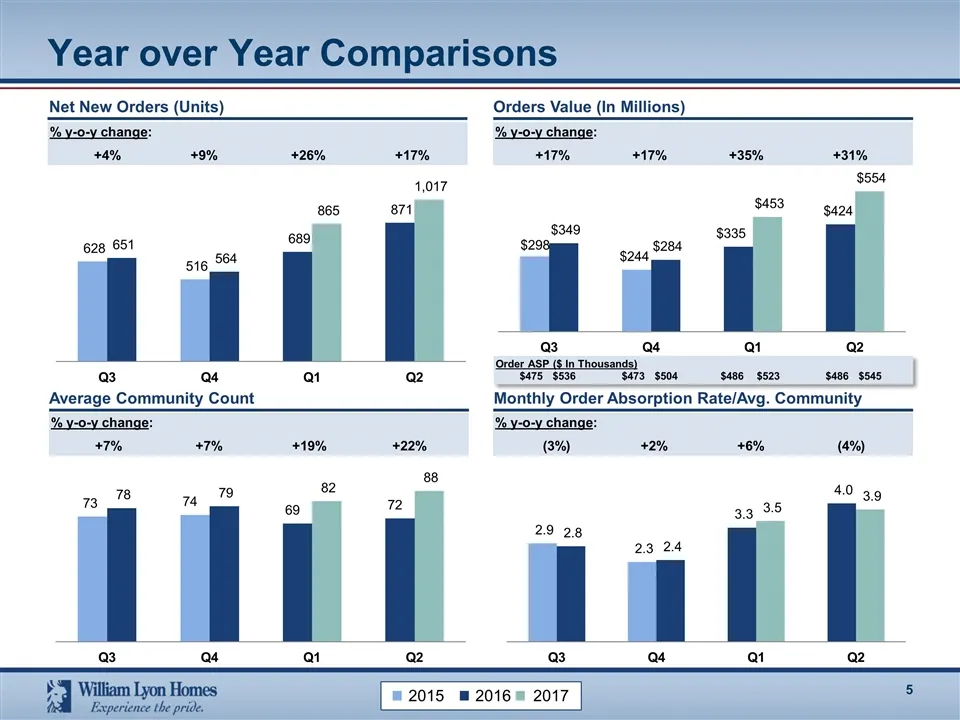
Year over Year Comparisons % y-o-y change: +4% +9% +26% +17% % y-o-y change: +7% +7% +19% +22% % y-o-y change: (3%) +2% +6% (4%) Net New Orders (Units) Orders Value (In Millions) Average Community Count Monthly Order Absorption Rate/Avg. Community % y-o-y change: +17% +17% +35% +31% Order ASP ($ In
Slide 7: Year over Year Comparisons (continued)
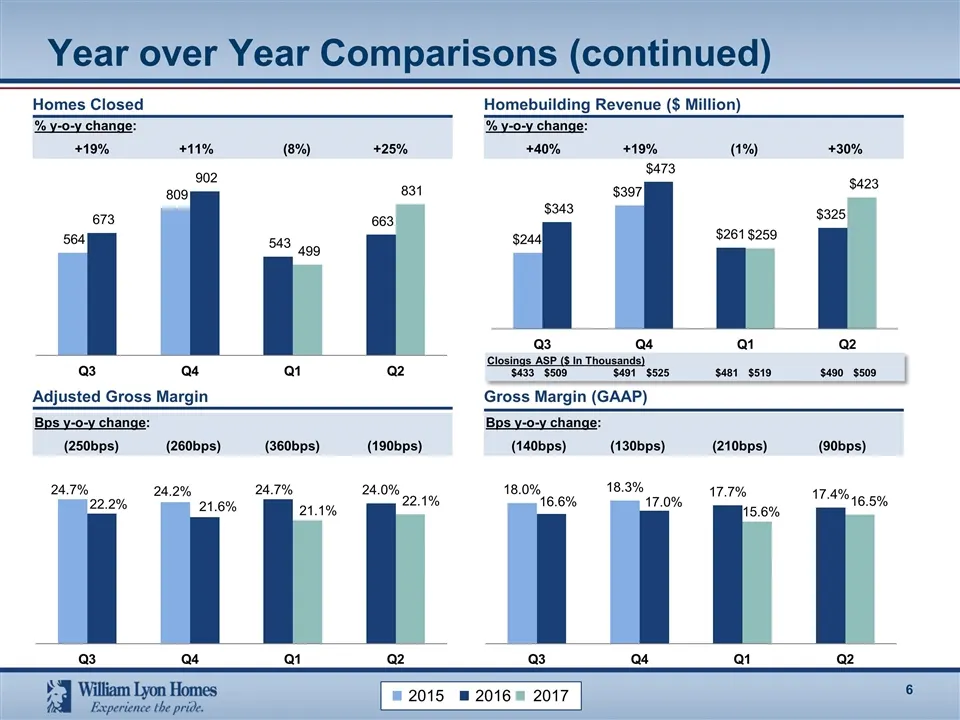
% y-o-y change: +40% +19% (1%) +30% Year over Year Comparisons (continued) % y-o-y change: +19% +11% (8%) +25% Homes Closed Homebuilding Revenue ($ Million) Bps y-o-y change: (250bps) (260bps) (360bps) (190bps) Bps y-o-y change: (140bps) (130bps) (210bps) (90bps) Adjusted Gross Margin Gross Margin (
Slide 8: Summary of 2017 Q2 and YTD Results
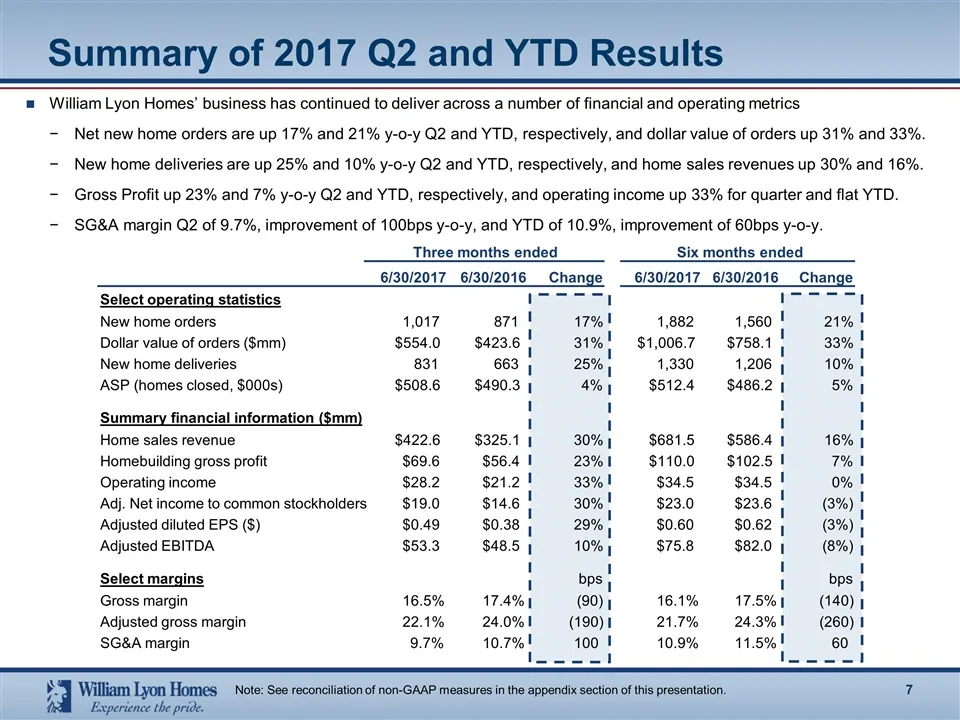
William Lyon Homes’ business has continued to deliver across a number of financial and operating metrics Net new home orders are up 17% and 21% y-o-y Q2 and YTD, respectively, and dollar value of orders up 31% and 33%. New home deliveries are up 25% and 10% y-o-y Q2 and YTD, respectively, and home s
Slide 9: Backlog Conversion Rate
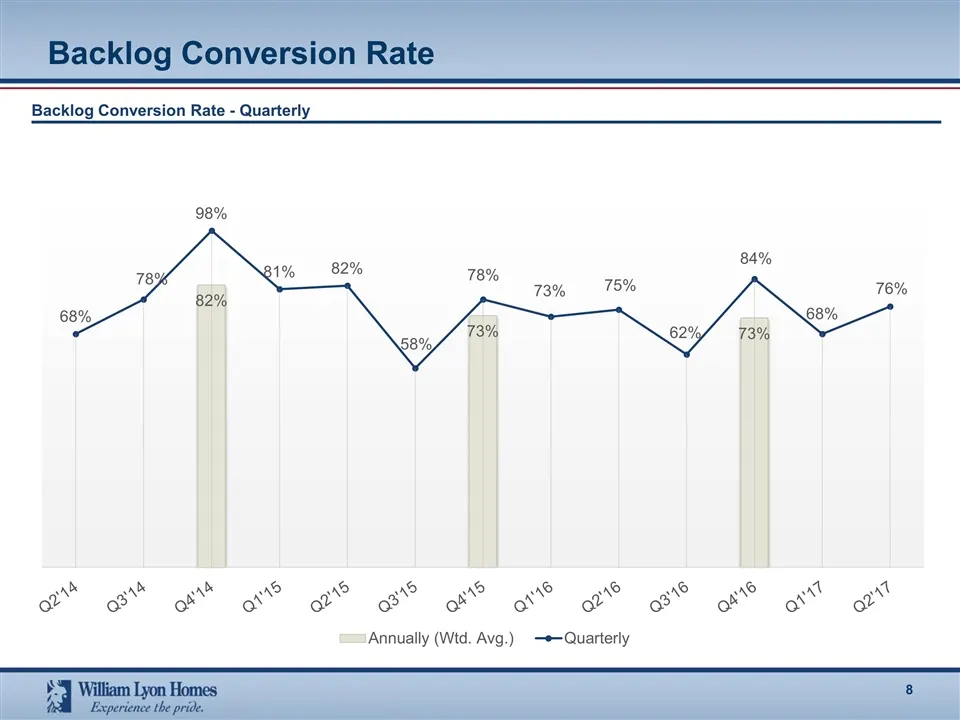
Backlog Conversion Rate Backlog Conversion Rate - Quarterly
Slide 10: Diversified product strategy
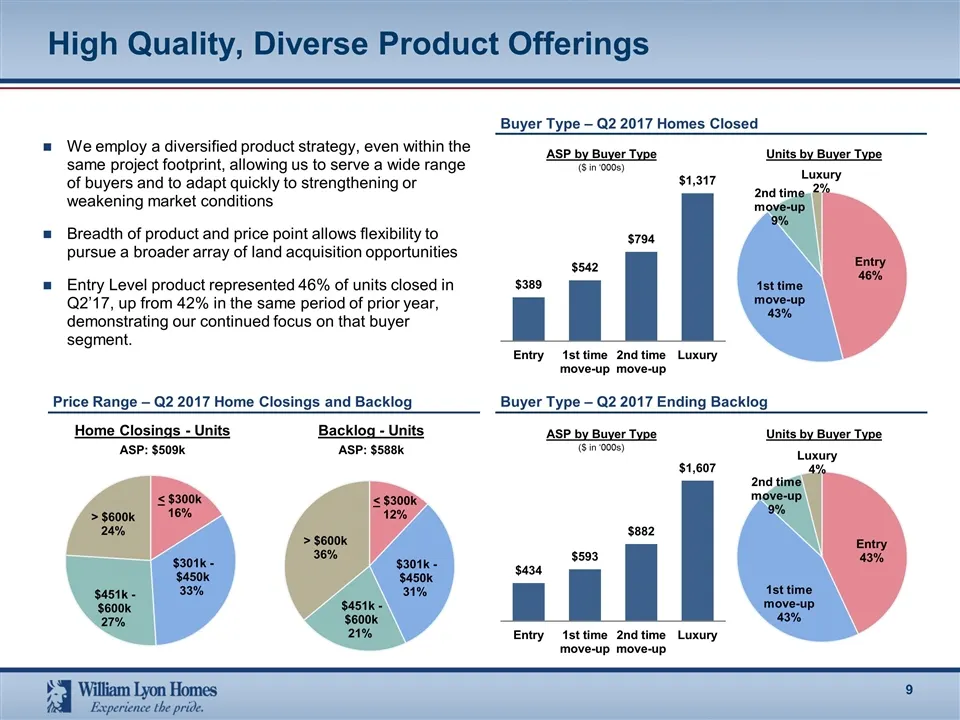
We employ a diversified product strategy, even within the same project footprint, allowing us to serve a wide range of buyers and to adapt quickly to strengthening or weakening market conditions Breadth of product and price point allows flexibility to pursue a broader array of land acquisition oppor
Slide 11: Strong New Order Growth – Dollars Trailing Twelve Months
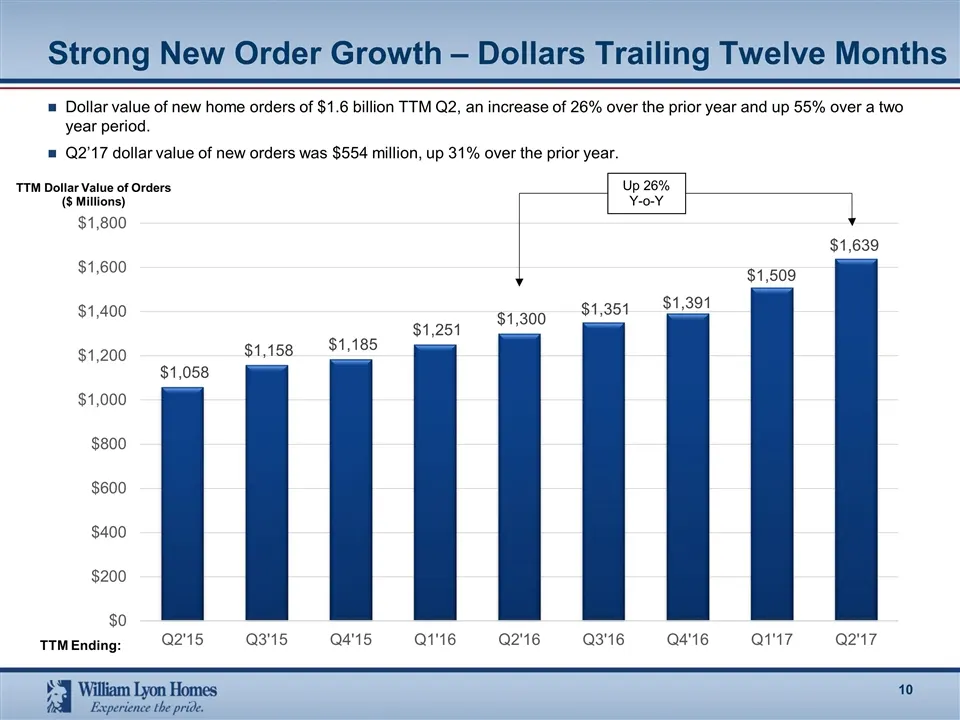
Strong New Order Growth – Dollars Trailing Twelve Months Dollar value of new home orders of $1.6 billion TTM Q2, an increase of 26% over the prior year and up 55% over a two year period. Q2’17 dollar value of new orders was $554 million, up 31% over the prior year. TTM Dollar Value of Orders ($ Mill
Slide 12: Growth and Operating Leverage
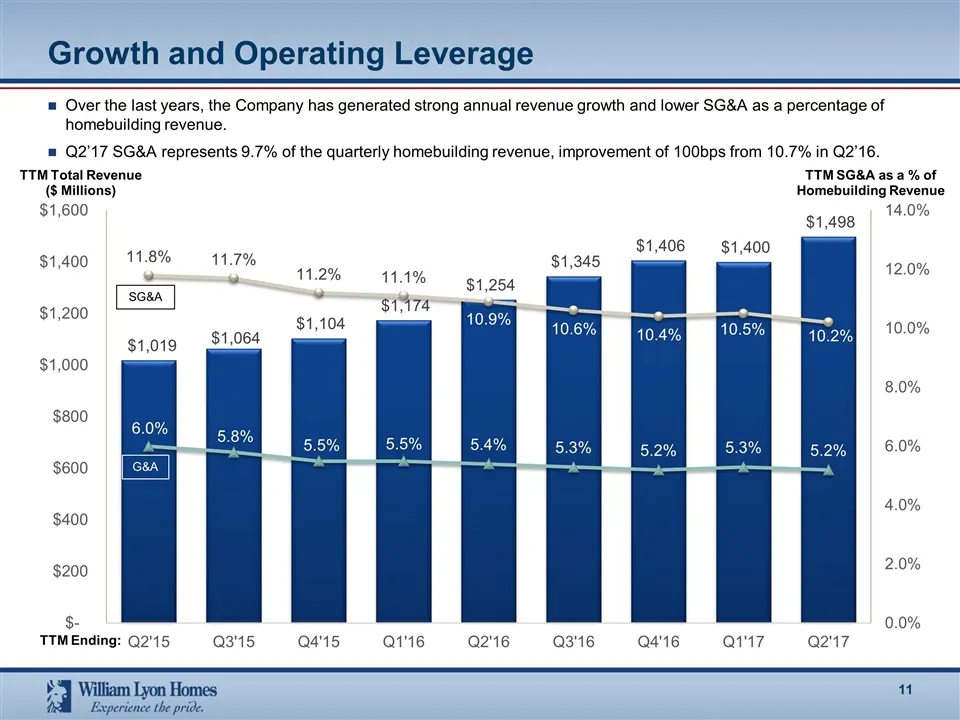
Growth and Operating Leverage Over the last years, the Company has generated strong annual revenue growth and lower SG&A as a percentage of homebuilding revenue. Q2’17 SG&A represents 9.7% of the quarterly homebuilding revenue, improvement of 100bps from 10.7% in Q2’16. TTM Total Revenue ($ Millions
Slide 13: Continued Growth and Diversification Through Monetization of High Quality Land Positions
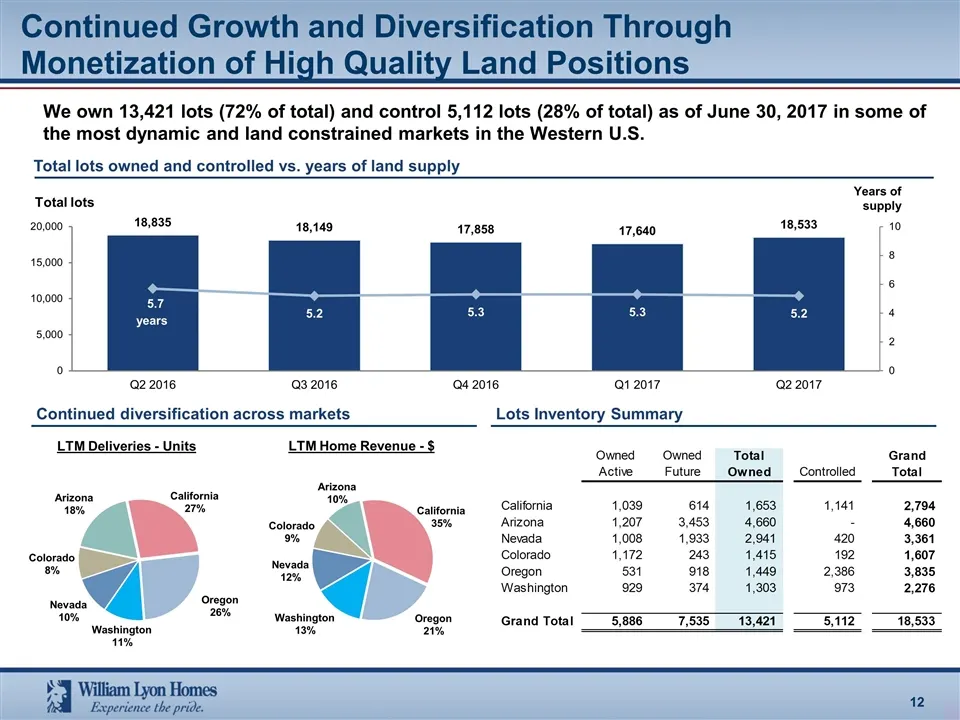
Continued Growth and Diversification Through Monetization of High Quality Land Positions Total lots owned and controlled vs. years of land supply LTM Deliveries - Units Continued diversification across markets Lots Inventory Summary We own 13,421 lots (72% of total) and control 5,112 lots (28% of to
Slide 14: Appendix
Appendix
Slide 15: Adjusted EBITDA
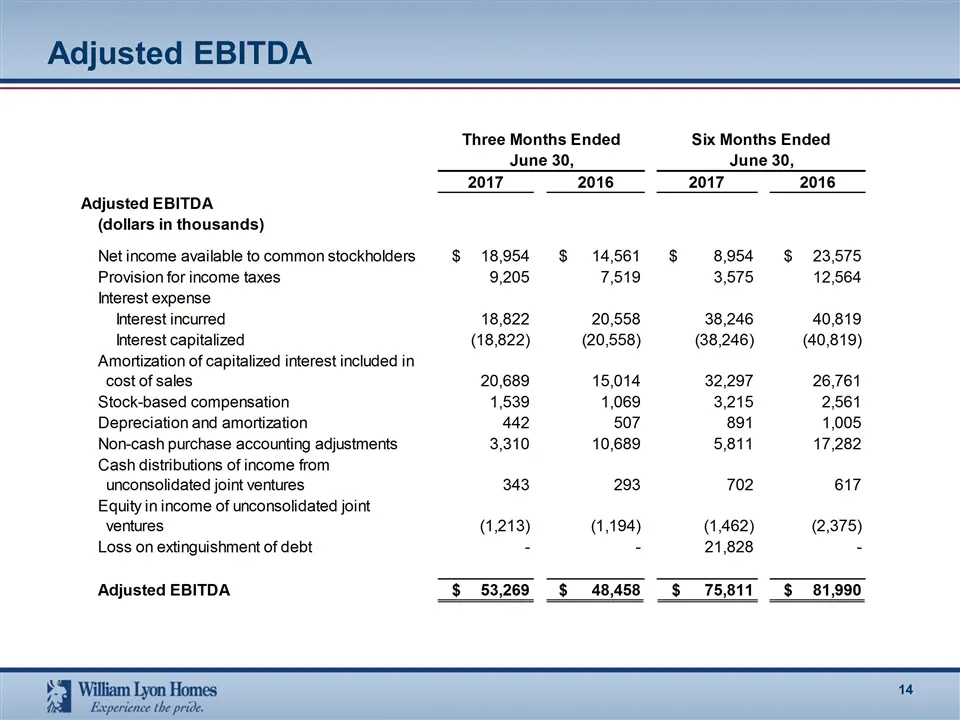
Adjusted EBITDA (dollars in thousands) Net i Provision for income taxes Amortization of capitalized interest included in {tock-based compensation Depreciation and amortization Non-cash purchase accounting adjustments Cash distributions of income from unconsolidated joint ventures Equity in income of
Slide 16: Adjusted Homebuilding Gross Margin
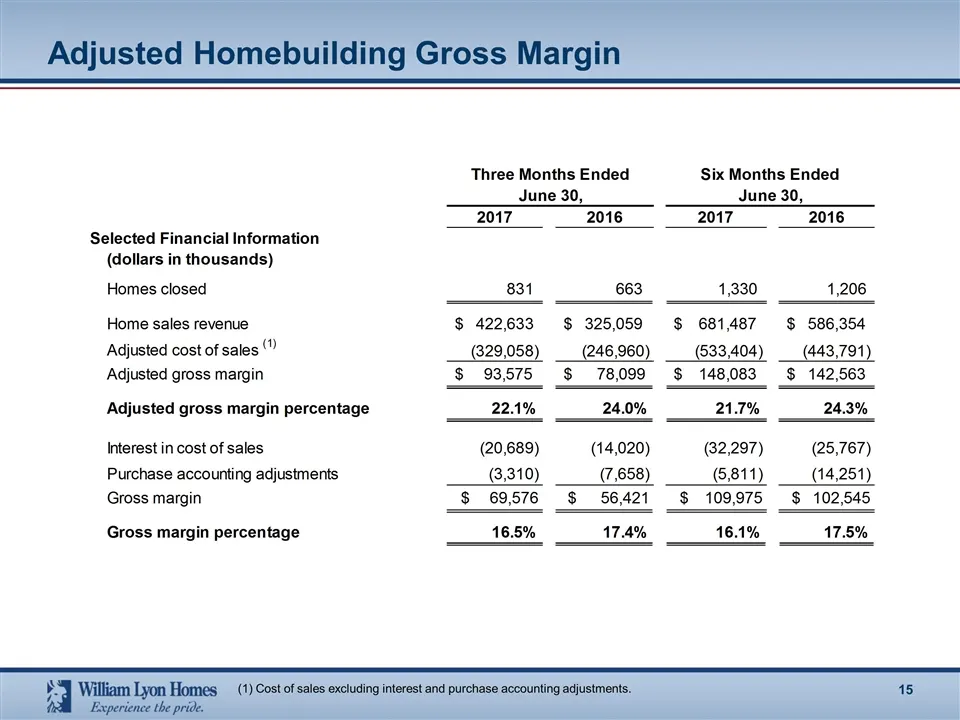
Adjusted Homebuilding Gross Margin (1) Cost of sales excluding interest and purchase accounting adjustments.
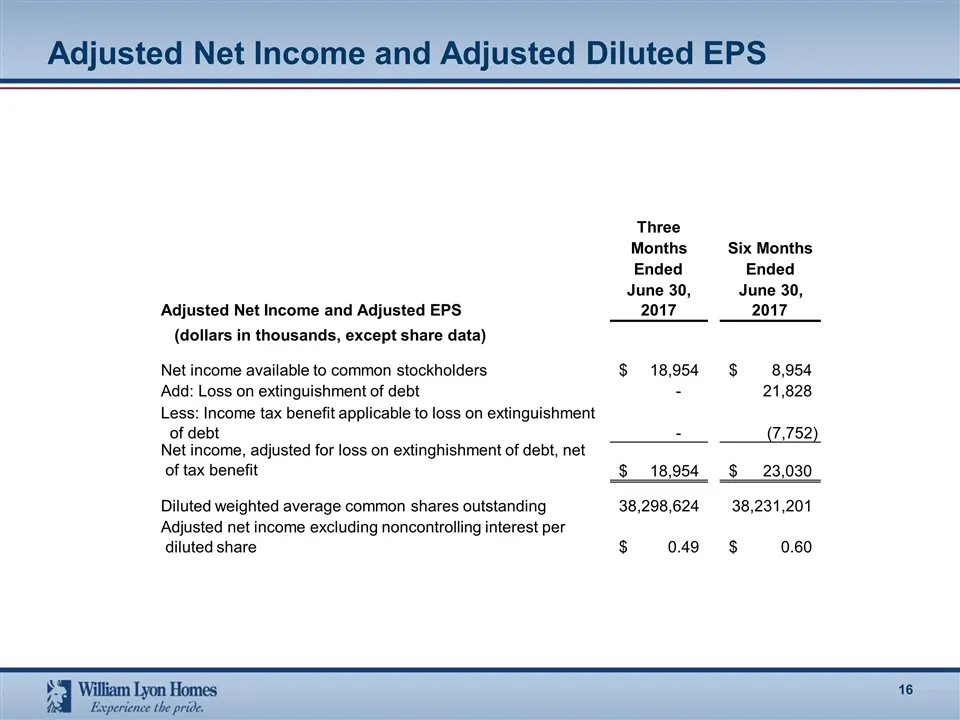
Slide 17: Adjusted Net Income and Adjusted Diluted EPS
Adjusted Net Income and Adjusted Diluted EPS Three Months Ended June 30, Six Months Ended June 30, Adjusted Net Income and Adjusted EPS 2017 2017 (dollars in thousands, except share data) Net income available to common stockholders 18,954 $ 8,954 $ Add: Loss on extinguishment of debt - 21,828 - (7,7
Source: SEC EDGAR · 8-K filed Aug 7, 2017
More decks from William Lyon Homes
 Merger or Acquisition (November 2019)18 slides · Nov 6, 2019
 Q2 2019 Earnings Presentation15 slides · Aug 1, 2019
 Q1 2019 Earnings Presentation14 slides · May 2, 2019
 Q4 2018 Earnings Presentation18 slides · Feb 14, 2019
 Q3 2018 Earnings Presentation17 slides · Oct 30, 2018
 2018 Zelman Housing Summit31 slides · Sep 27, 2018