DEX ONE — R.H. Donnelley — Deutsche Bank High Yield Conference 2006
23 slides from DEX ONE's conference presentation, Oct 4, 2006
Slide 1: Deutsche Bank High Yield Conference October 4, 2006
Deutsche Bank High Yield Conference October 4, 2006
Slide 2: Safe Harbor Statement
Safe Harbor Statement Certain statements contained in this presentation regarding RHD's future operating results or performance or business plans or prospects and any other statements not constituting historical fact are "forward-looking statements" subject to the safe harbor created by the Private
Slide 3: R.H. Donnelley Overview
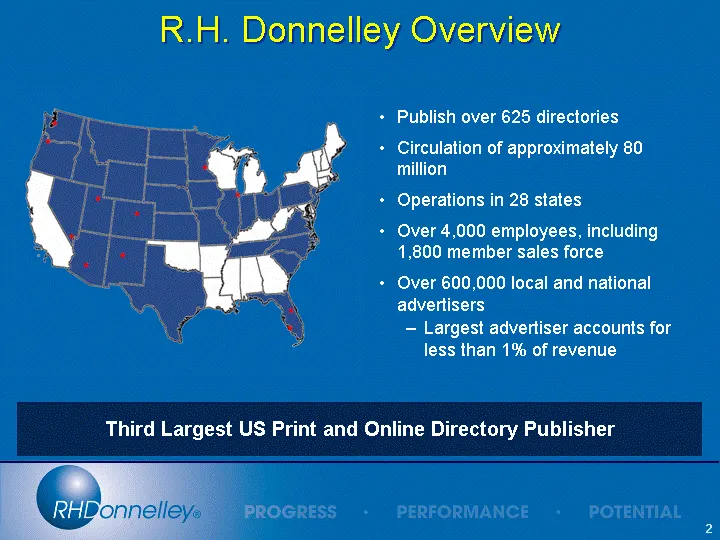
R.H. Donnelley Overview Third Largest US Print and Online Directory Publisher Publish over 625 directories Circulation of approximately 80 million Operations in 28 states Over 4,000 employees, including 1,800 member sales force Over 600,000 local and national advertisers Largest advertiser accounts
Slide 4: Investment Highlights
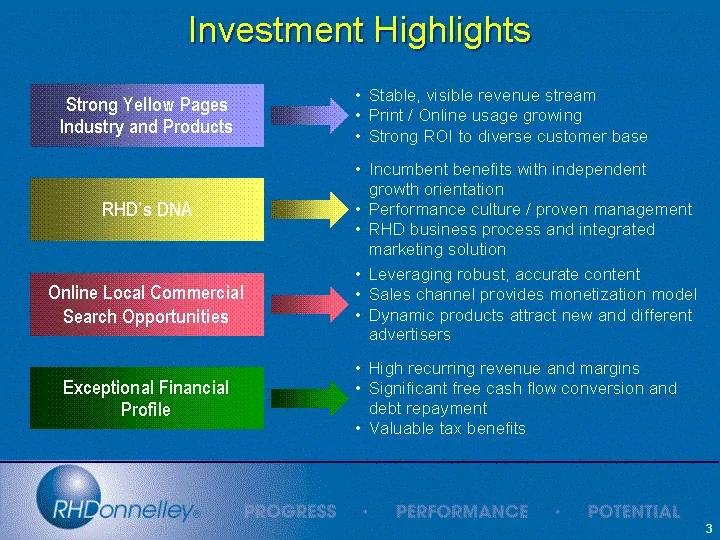
Investment Highlights Strong Yellow Pages Industry and Products Stable, visible revenue stream Print / Online usage growing Strong ROI to diverse customer base RHD's DNA Incumbent benefits with independent growth orientation Performance culture / proven management RHD business process and integrated
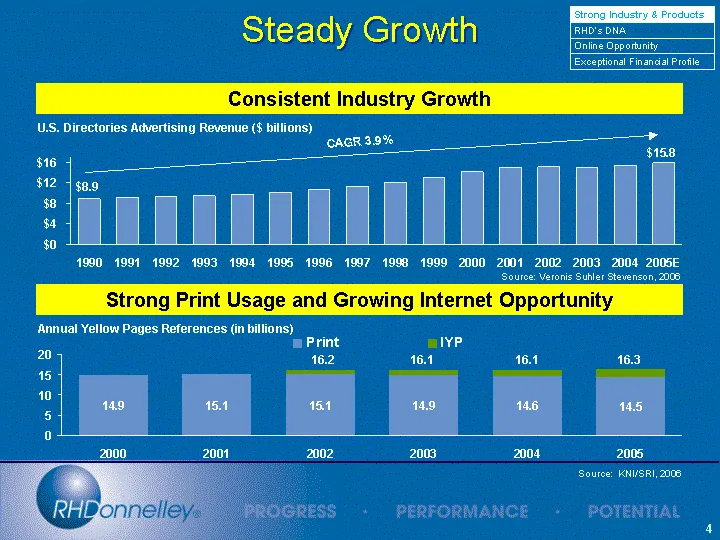
Slide 5: Consistent Industry Growth and Strong Print Usage
Revenue 1990 8.9 1991 9.2 1992 9.3 1993 9.5 1994 9.8 1995 10.2 1996 10.7 1997 11.4 1998 12.1 1999 13 2000 14.1 2001 14.9 2002 15.1 2003 15 2004 15.4 2005E 15.8 Source: Veronis Suhler Stevenson, 2006 Consistent Industry Growth CAGR 3.9% Print IYP 2000 14.9 2001 15.1 2002 15.1 1.1 2003 14.9 1.2 2004 1
Slide 6: Long-Term Customer Relationships and Competitive Advantage
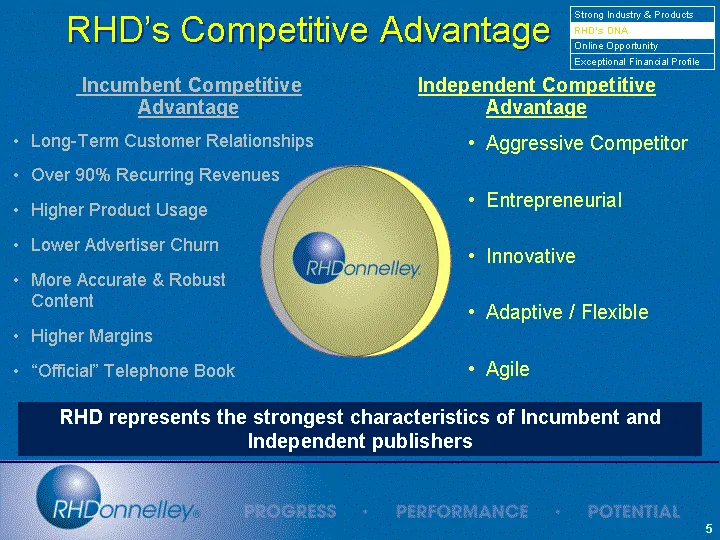
Long-Term Customer Relationships Over 90% Recurring Revenues Higher Product Usage Lower Advertiser Churn More Accurate & Robust Content Higher Margins "Official" Telephone Book Aggressive Competitor Entrepreneurial Innovative Adaptive / Flexible Agile Independent Competitive Advantage Incumbent Comp
Slide 7: RHD Business Process
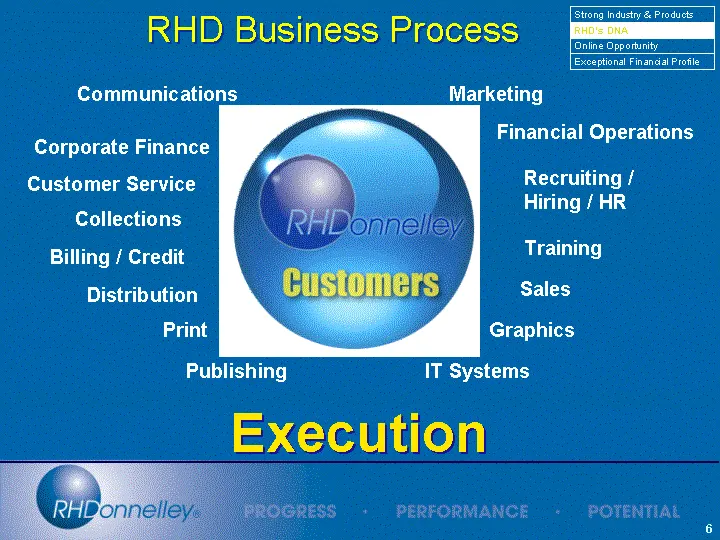
Marketing Financial Operations Recruiting / Hiring / HR Training Sales Graphics IT Systems Publishing Print Distribution Billing / Credit Collections Customer Service Corporate Finance Communications Execution RHD Business Process Strong Industry & Products RHD's DNA Exceptional Financial Profile On
Slide 8: Local Commercial Search
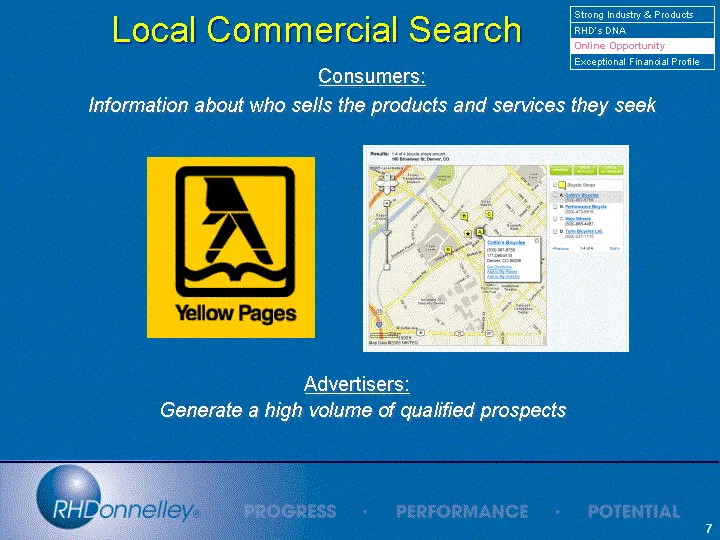
Local Commercial Search Consumers: Information about who sells the products and services they seek Advertisers: Generate a high volume of qualified prospects Strong Industry & Products RHD's DNA Exceptional Financial Profile Online Opportunity
Slide 9: The RHD Bundled Solution
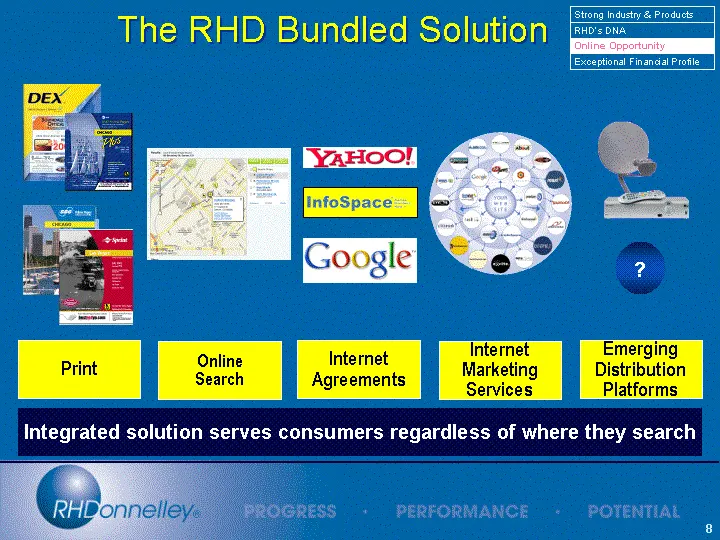
? Print Internet Agreements Internet Marketing Services Online Search Emerging Distribution Platforms The RHD Bundled Solution Integrated solution serves consumers regardless of where they search Strong Industry & Products RHD's DNA Exceptional Financial Profile Online Opportunity
Slide 10: Valuable Tax Benefits
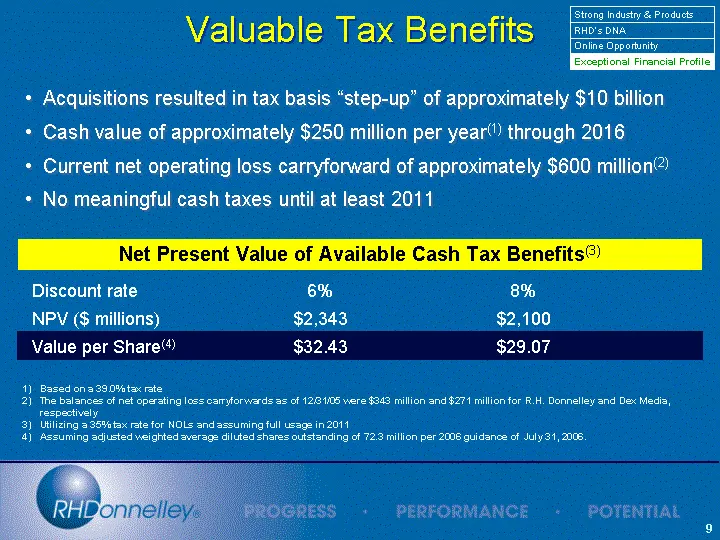
Based on a 39.0% tax rate The balances of net operating loss carryforwards as of 12/31/05 were $343 million and $271 million for R.H. Donnelley and Dex Media, respectively Utilizing a 35% tax rate for NOLs and assuming full usage in 2011 Assuming adjusted weighted average diluted shares outstanding
Slide 11: Debt Repayment
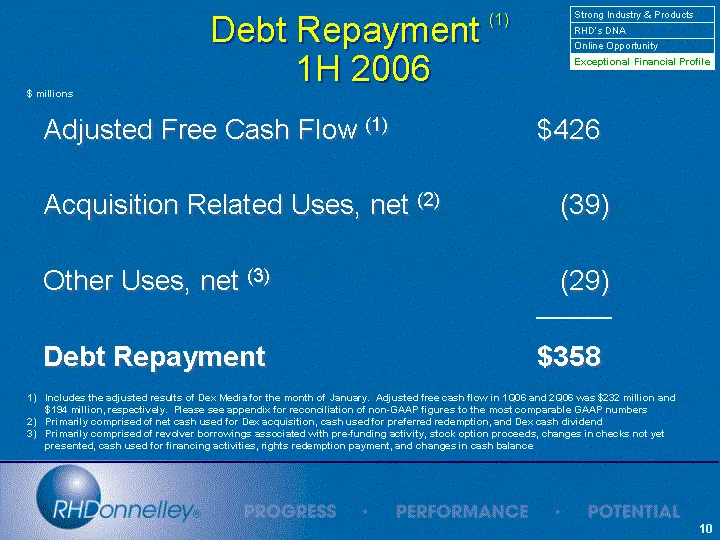
Debt Repayment (1) 1H 2006 $ millions Includes the adjusted results of Dex Media for the month of January. Adjusted free cash flow in 1Q06 and 2Q06 was $232 million and $194 million, respectively. Please see appendix for reconciliation of non-GAAP figures to the most comparable GAAP numbers Primaril
Slide 12: Capitalization and Expected Leverage
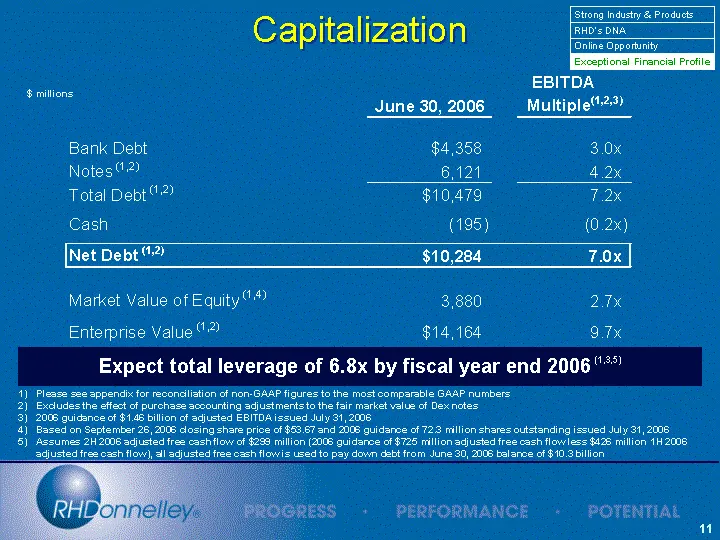
Expect total leverage of 6.8x by fiscal year end 2006 (1,3,5) Capitalization Please see appendix for reconciliation of non-GAAP figures to the most comparable GAAP numbers Excludes the effect of purchase accounting adjustments to the fair market value of Dex notes 2006 guidance of $1.46 billion of a
Slide 13: 2006 Guidance - Updated July 31, 2006
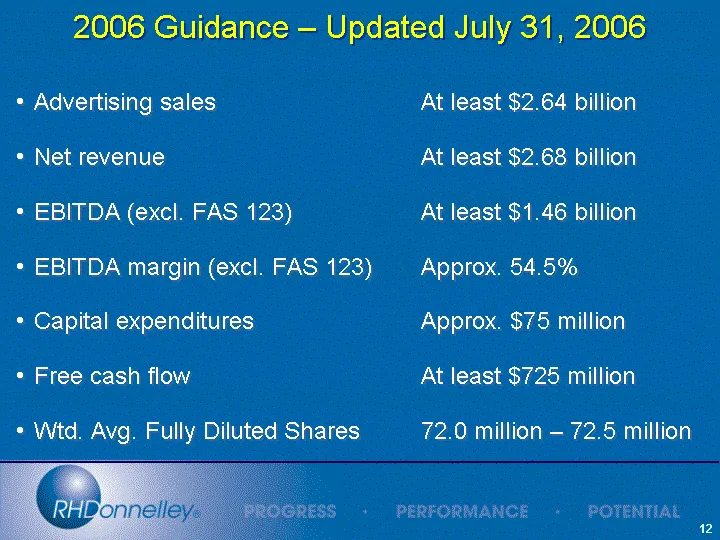
2006 Guidance - Updated July 31, 2006 Advertising sales At least $2.64 billion Net revenue At least $2.68 billion EBITDA (excl. FAS 123) At least $1.46 billion EBITDA margin (excl. FAS 123) Approx. 54.5% Capital expenditures Approx. $75 million Free cash flow At least $725 million Wtd. Avg. Fully Di
Slide 14: Key Themes
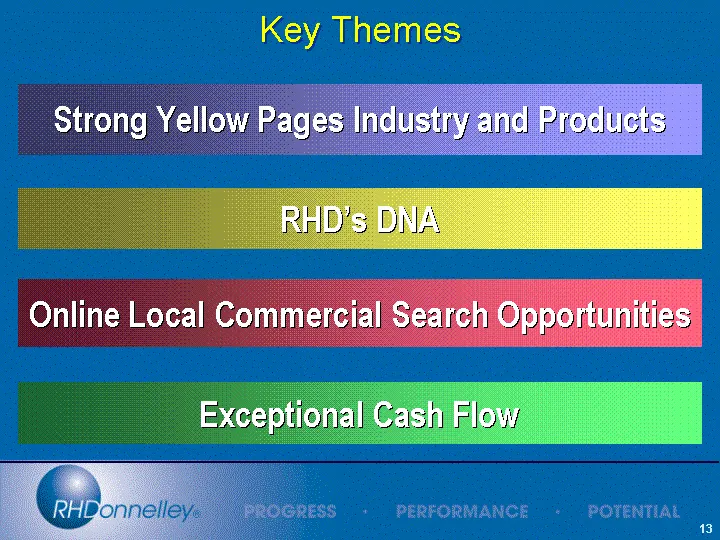
Key Themes Strong Yellow Pages Industry and Products Online Local Commercial Search Opportunities RHD's DNA Exceptional Cash Flow
Slide 15: Appendix
Appendix PERFORMANCE + POTENTIAL
Slide 16: Index of Schedules
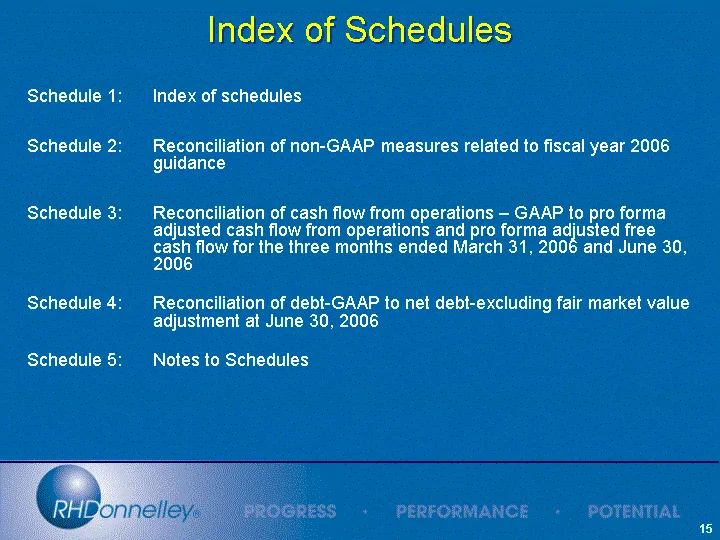
Index of Schedules Schedule 1: Index of schedules Schedule 2: Reconciliation of non-GAAP measures related to fiscal year 2006 guidance Schedule 3: Reconciliation of cash flow from operations - GAAP to pro forma adjusted cash flow from operations and pro forma adjusted free cash flow for the three mo
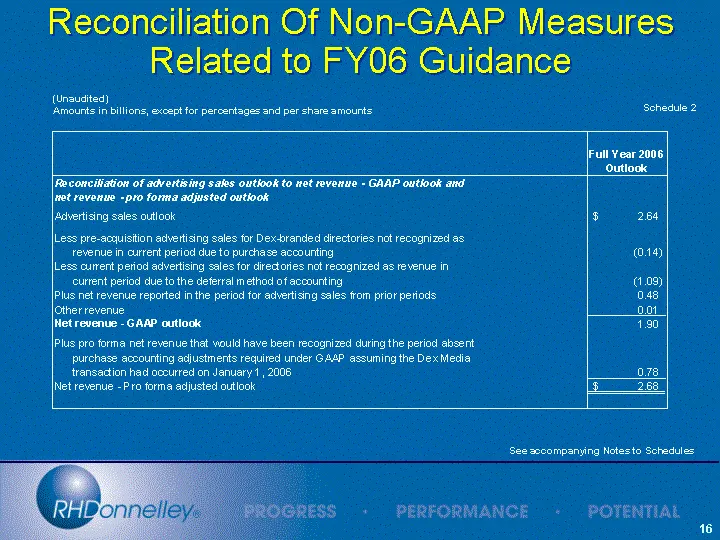
Slide 17: Reconciliation Of Non-GAAP Measures Related to FY06 Guidance
Reconciliation Of Non-GAAP Measures Related to FY06 Guidance (Unaudited) Amounts in billions, except for percentages and per share amounts Schedule 2 See accompanying Notes to Schedules
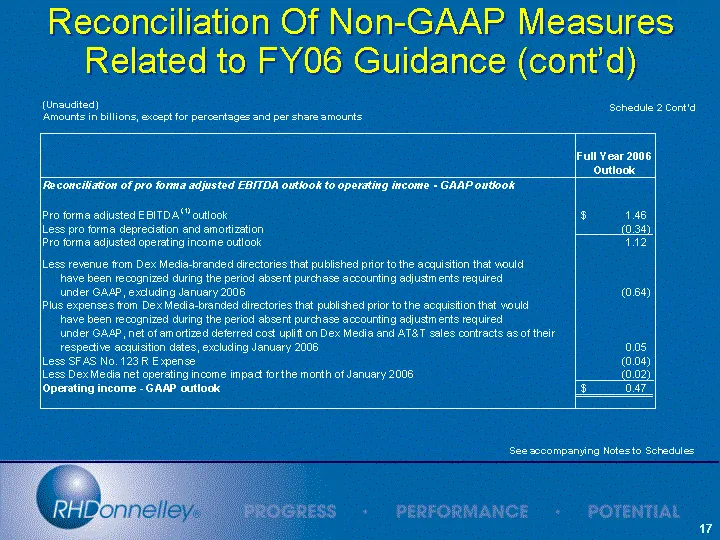
Slide 18: Reconciliation Of Non-GAAP Measures Related to FY06 Guidance (cont'd)
Reconciliation Of Non-GAAP Measures Related to FY06 Guidance (cont'd) (Unaudited) Amounts in billions, except for percentages and per share amounts Schedule 2 Cont'd See accompanying Notes to Schedules
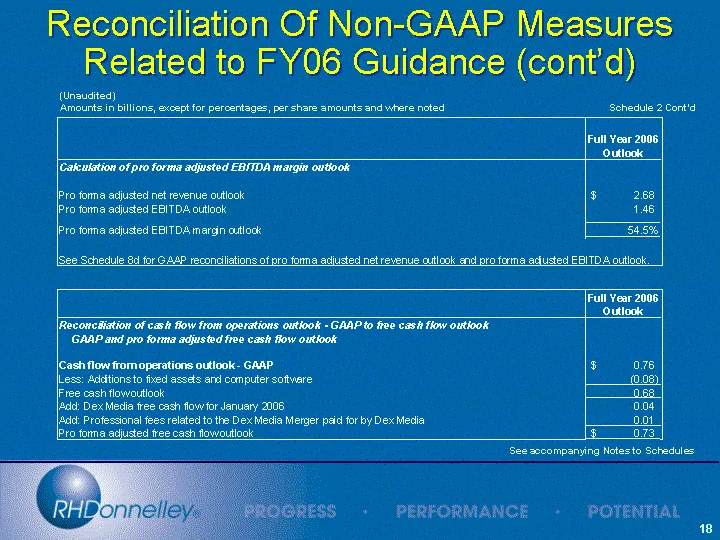
Slide 19: Reconciliation Of Non-GAAP Measures Related to FY06 Guidance (cont'd)
Schedule 2 Cont'd See accompanying Notes to Schedules (Unaudited) Amounts in billions, except for percentages, per share amounts and where noted Reconciliation Of Non-GAAP Measures Related to FY06 Guidance (cont'd)
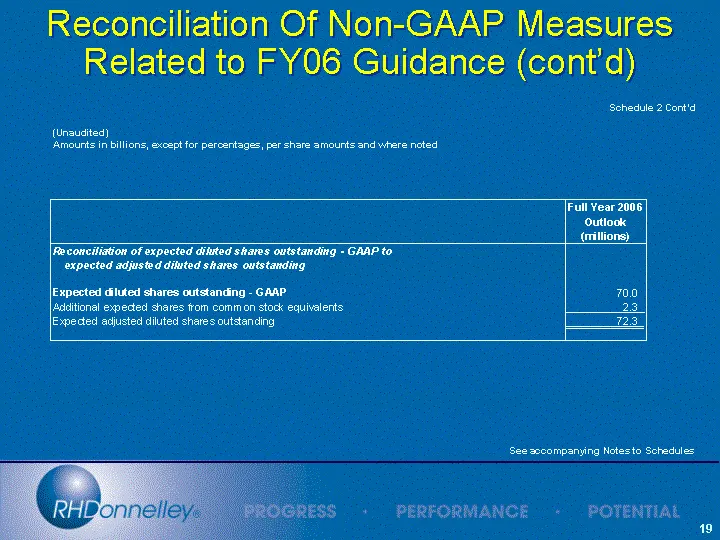
Slide 20: Reconciliation Of Non-GAAP Measures Related to FY06 Guidance (cont'd)
(Unaudited) Amounts in billions, except for percentages, per share amounts and where noted Schedule 2 Cont'd See accompanying Notes to Schedules Reconciliation Of Non-GAAP Measures Related to FY06 Guidance (cont'd)
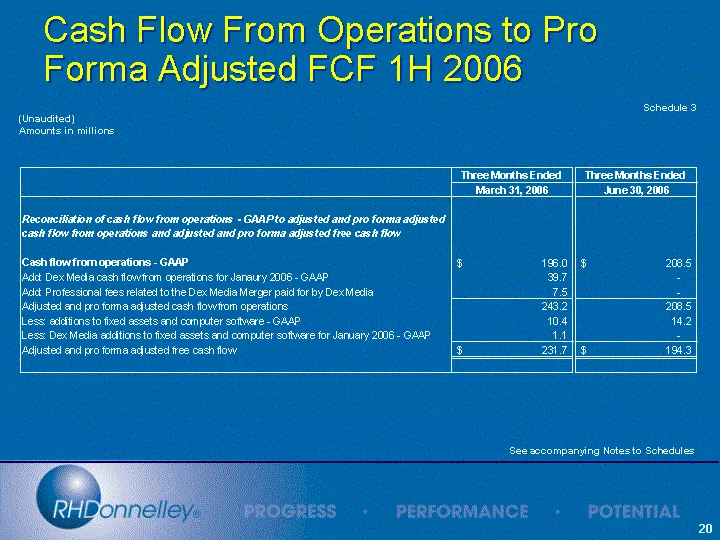
Slide 21: Cash Flow From Operations to Pro Forma Adjusted FCF
(Unaudited) Amounts in millions Schedule 3 Cash Flow From Operations to Pro Forma Adjusted FCF 1H 2006 See accompanying Notes to Schedules
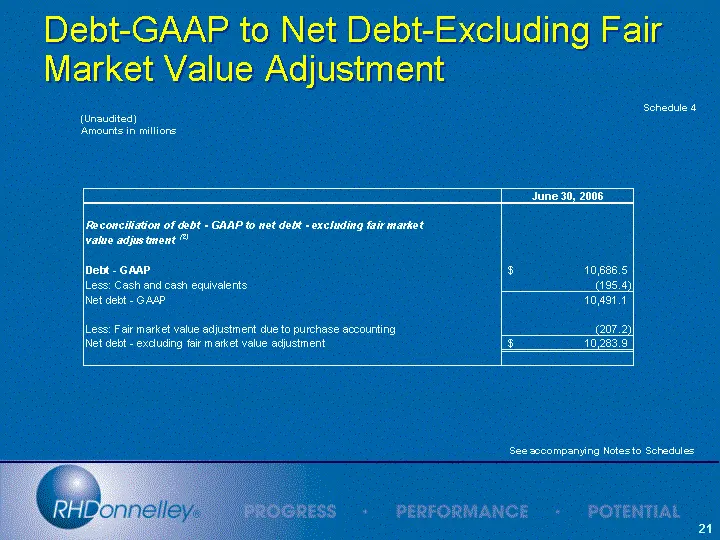
Slide 22: Debt-GAAP to Net Debt-Excluding Fair Market Value Adjustment
(Unaudited) Amounts in millions Schedule 4 Debt-GAAP to Net Debt-Excluding Fair Market Value Adjustment See accompanying Notes to Schedules
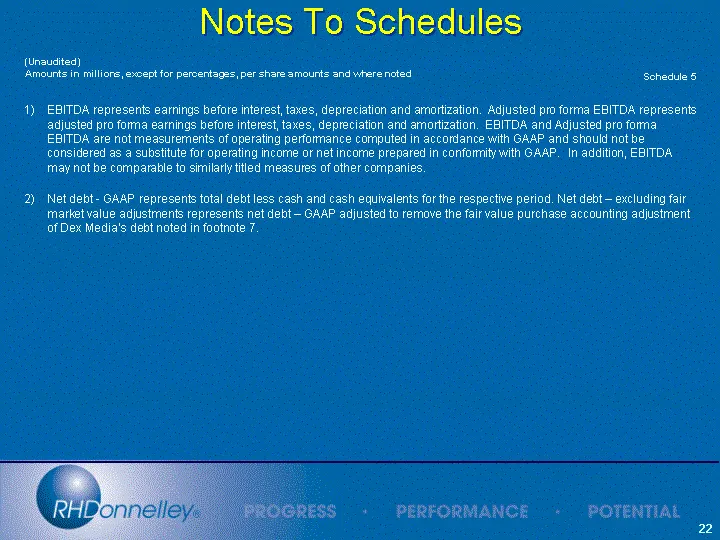
Slide 23: Notes To Schedules
Notes To Schedules (Unaudited) Amounts in millions, except for percentages, per share amounts and where noted Schedule 5 EBITDA represents earnings before interest, taxes, depreciation and amortization. Adjusted pro forma EBITDA represents adjusted pro forma earnings before interest, taxes, deprecia
Source: SEC EDGAR · 8-K filed Oct 4, 2006
More decks from DEX ONE Corp
 Q4 2012 Earnings Presentation17 slides · Mar 18, 2013
 Merger or Acquisition (December 2012)42 slides · Dec 6, 2012
 Merger or Acquisition (September 2012)51 slides · Sep 18, 2012
 Merger or Acquisition (August 2012)15 slides · Aug 21, 2012
 Q2 2012 Earnings Presentation16 slides · Jul 25, 2012
 Q1 2012 Earnings Presentation17 slides · Apr 26, 2012