Premier Financial — First Defiance Financial — Investor Presentation (February 2019)
34 slides from Premier Financial's investor presentation, Feb 6, 2019
Slide 1: Investor Update February 2019
Investor Update February 2019 Donald P. Hileman President & CEO Kevin T. Thompson Executive Vice President & CFO Paul D. Nungester Executive Vice President Finance & Accounting
Slide 2: Forward Looking Statements
Forward Looking Statements The issuer has filed a registration statement including a prospectus, and will file a related supplement with the Securities and Exchange Commission (“SEC”), for the offering to which this communication relates . Before you invest, you should read the prospectus, the prosp

Slide 3: Company Overview
Company PV ‘ Overview SUCCESS THROUGH FOCUS
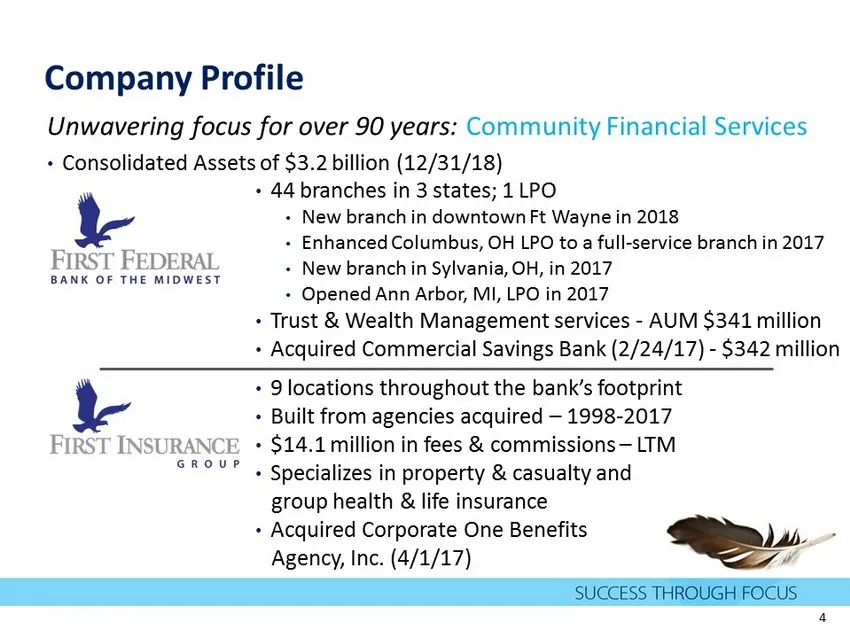
Slide 4: Company Profile
Company Profile Unwavering focus for over 90 years: Community Financial Services • Consolidated Assets of $3.2 billion (12/31/18) • 44 branches in 3 states; 1 LPO • New branch in downtown Ft Wayne in 2018 • Enhanced Columbus, OH LPO to a full - service branch in 2017 • New branch in Sylvania, OH, in
Slide 5: Investment Highlights
Investment Highlights • Market leader in northwest Ohio deeply rooted in the communities we have served since the 1920s • Growing presence in metro markets • Experienced, disciplined management team • Strong and diversified loan mix and stable deposit base • Historically stable and strong net intere
Slide 6: Executive Leadership
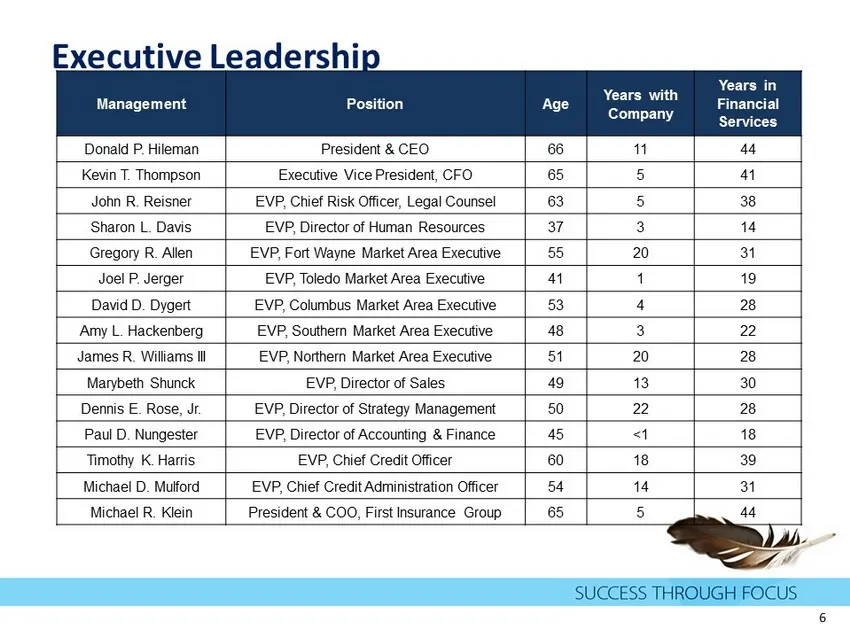
Executive Leadership Management Position Age Years with Company Years in Financial Services Donald P. Hileman President & CEO 66 11 44 Kevin T. Thompson Executive Vice President, CFO 65 5 41 John R. Reisner EVP, Chief Risk Officer, Legal Counsel 63 5 38 Sharon L. Davis EVP, Director of Human Resourc
Slide 7: The First Defiance Market
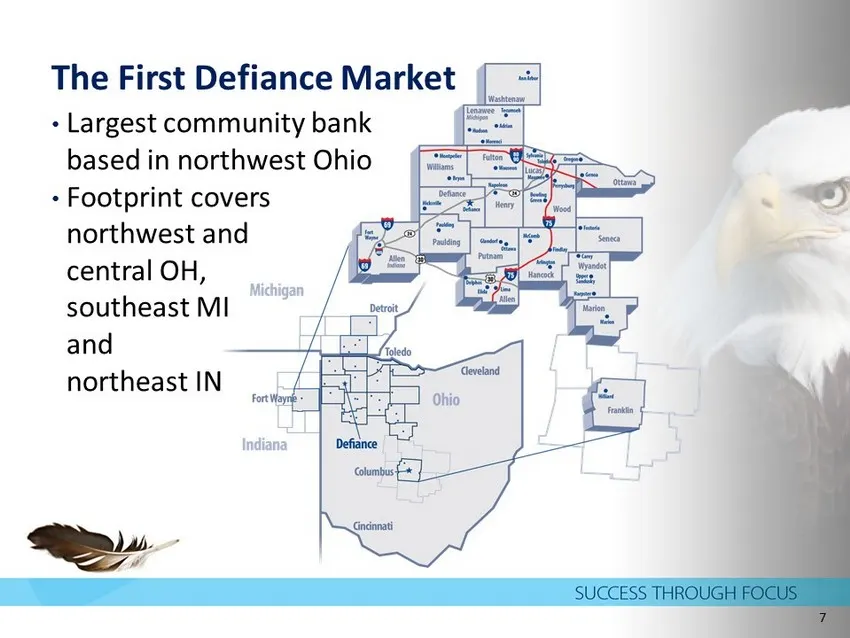
The First Defiance Market • Largest community bank based in northwest Ohio • Footprint covers northwest and c entral OH, southeast MI and northeast IN 7
Slide 8: Our Footprint – Local Economy
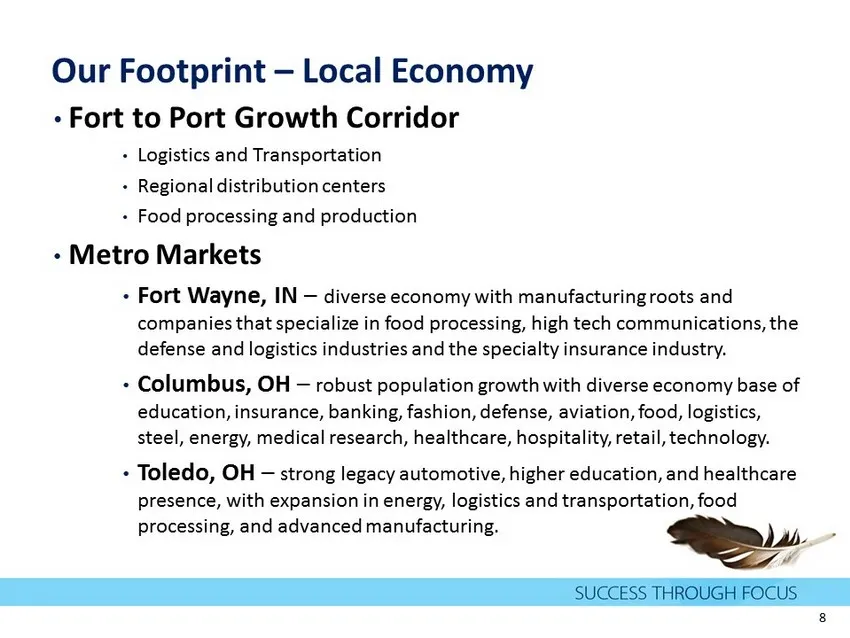
Our Footprint – Local Economy 8 • Fort to Port Growth Corridor • Logistics and Transportation • Regional distribution centers • Food processing and production • Metro Markets • Fort Wayne, IN – diverse economy with manufacturing roots and companies that specialize in food processing, high tech commu
Slide 9: Strategic Focus
Strategic Focus • Profitability • High performance objectives for revenue growth, expense control and maintaining strong asset quality • Growth • Organic and through acquisitions, targeting newer markets, new relationships, enhanced delivery and deeper relationships in more established markets • Sha
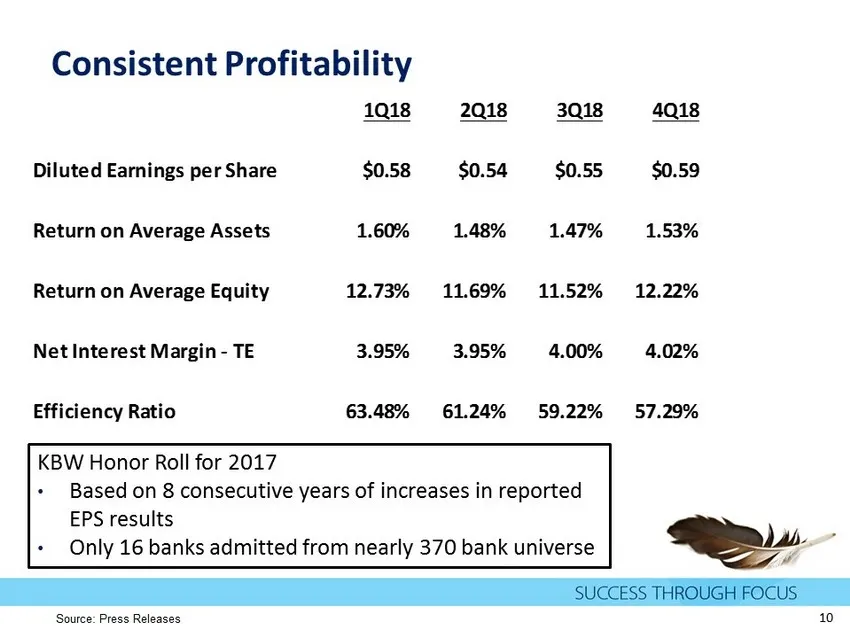
Slide 10: Consistent Profitability
Consistent Profitability Source : Press R eleases 10 KBW Honor Roll for 2017 • Based on 8 consecutive years of increases in reported EPS results • Only 16 banks admitted from nearly 370 bank universe 1Q18 2Q18 3Q18 4Q18 Diluted Earnings per Share $0.58 $0.54 $0.55 $0.59 Return on Average Assets 1.60
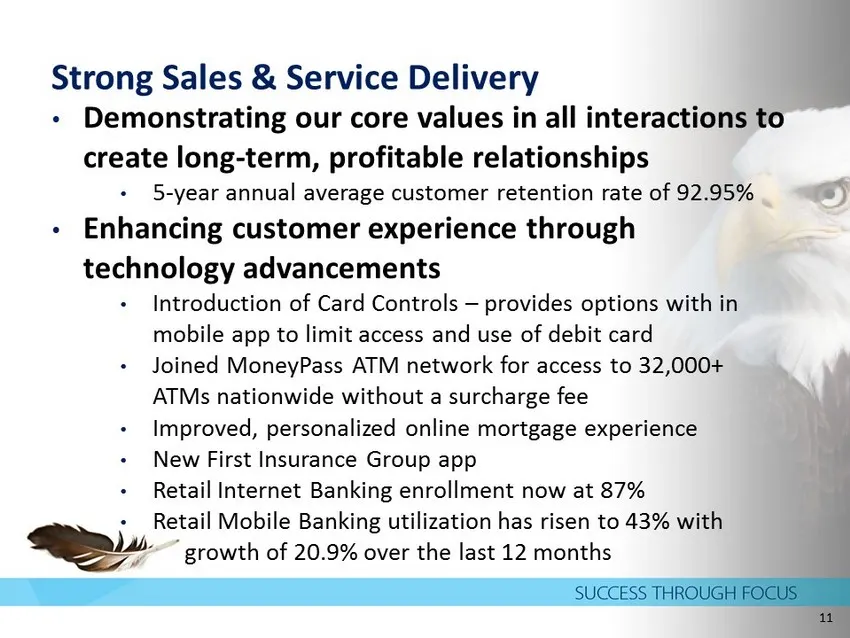
Slide 11: Strong Sales & Service Delivery
Strong Sales & Service Delivery • Demonstrating our core values in all interactions to create long - term, profitable relationships • 5 - year annual average customer retention rate of 92.95% • Enhancing customer experience through technology advancements • Introduction of Card Controls – provides o
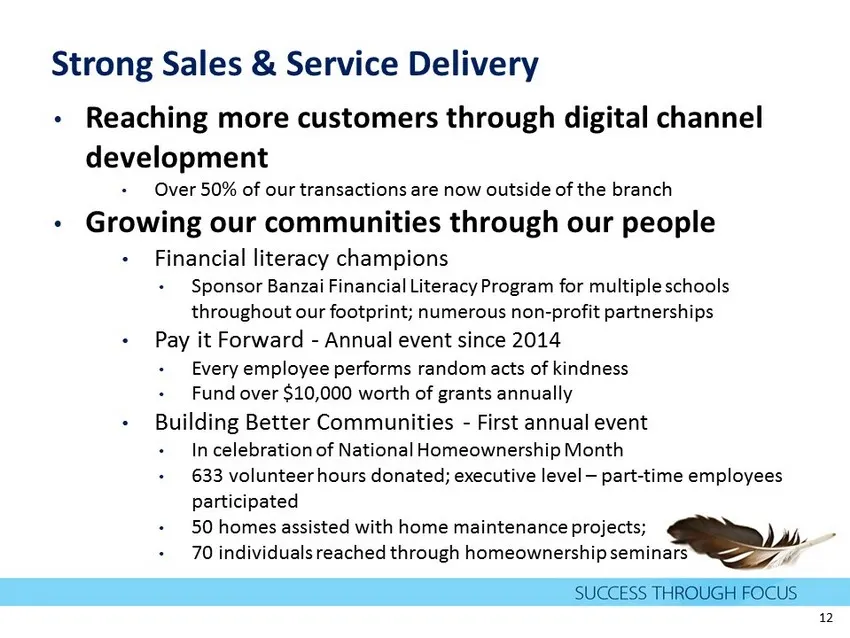
Slide 12: Strong Sales & Service Delivery
Strong Sales & Service Delivery • Reaching more customers through digital channel development • Over 50 % of our transactions are now outside of the branch • Growing our communities through our people • Financial literacy champions • Sponsor Banzai Financial Literacy Program for multiple schools thr
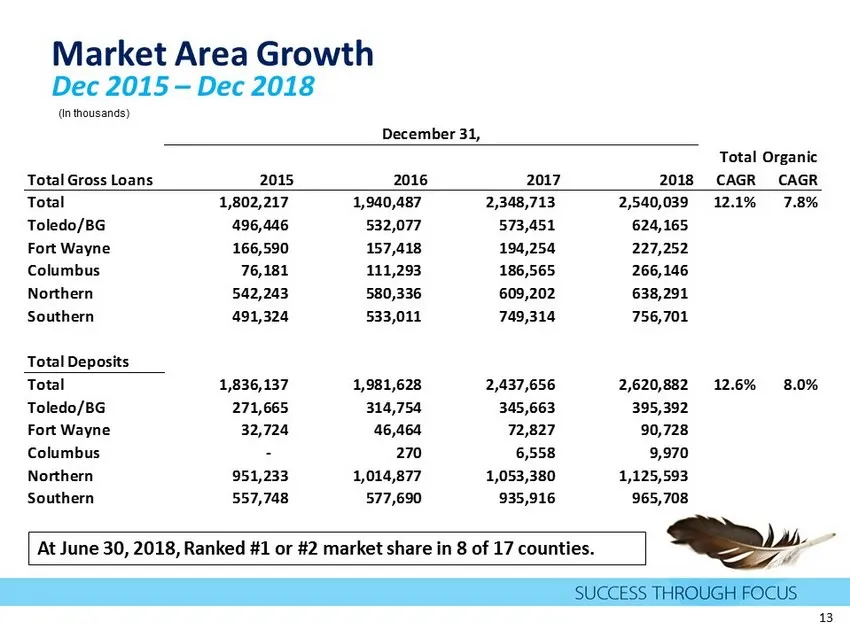
Slide 13: Market Area Growth
Market Area Growth Dec 2015 – Dec 2018 13 (In thousands) At June 30 , 2018 , Ranked # 1 or # 2 market share in 8 of 17 counties . Total Gross Loans 2015 2016 2017 2018 Total CAGR Organic CAGR Total 1,802,217 1,940,487 2,348,713 2,540,039 12.1% 7.8% Toledo/BG 496,446 532,077 573,451 624,165 Fort Wayn
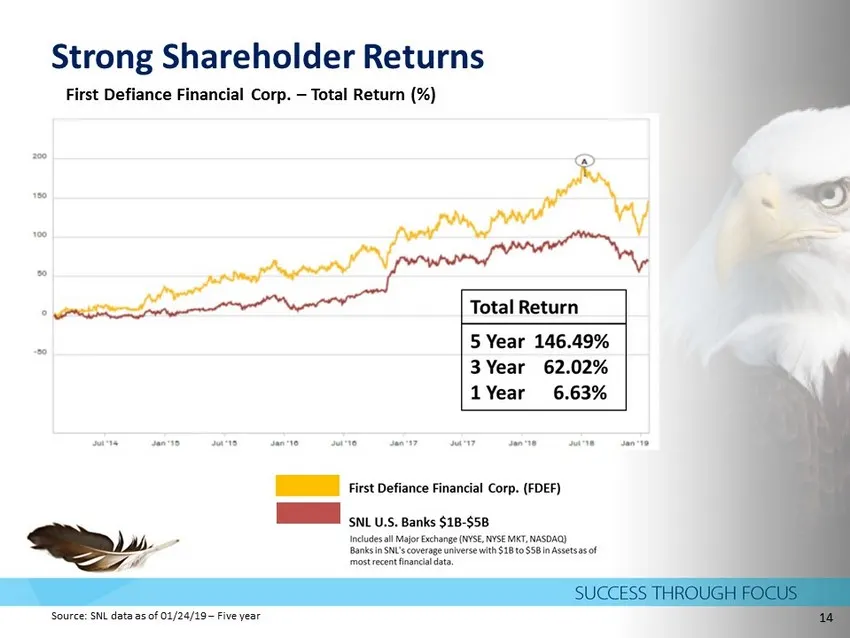
Slide 14: Strong Shareholder Returns
Strong Shareholder Returns First Defiance Financial Corp. – Total Return (%) Source: SNL data as of 01/24/19 – Five year 14
Slide 15: Financial Highlights
Financial PV 4 Highlights é SUCCESS THROUGH FOCUS
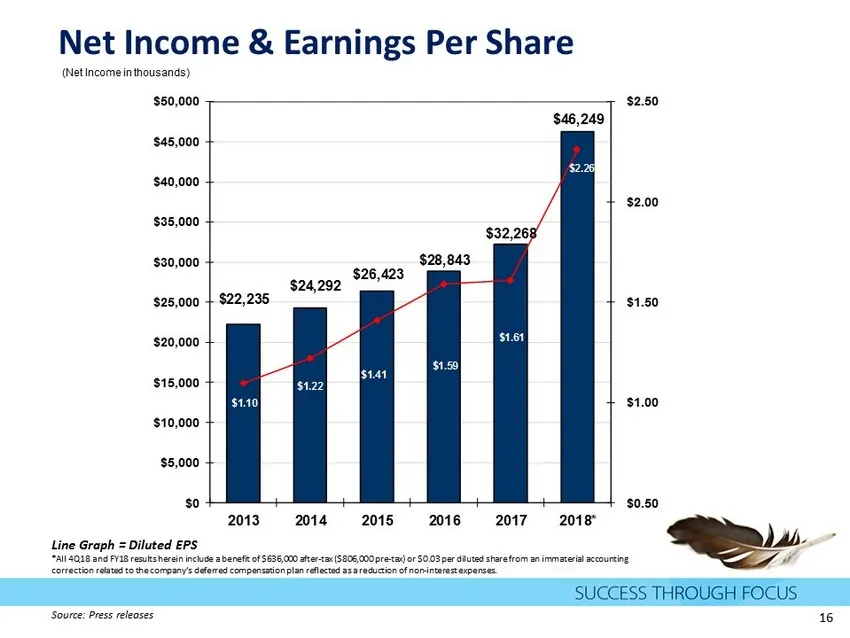
Slide 16: Net Income & Earnings Per Share
Net Income & Earnings Per Share (Net Income in thousands) $22,235 $24,292 $26,423 $28,843 $32,268 $46,249 $1.10 $1.22 $1.41 $1.59 $1.61 $2.26 $0.50 $1.00 $1.50 $2.00 $2.50 $0 $5,000 $10,000 $15,000 $20,000 $25,000 $30,000 $35,000 $40,000 $45,000 $50,000 2013 2014 2015 2016 2017 2018* Line Graph = Di
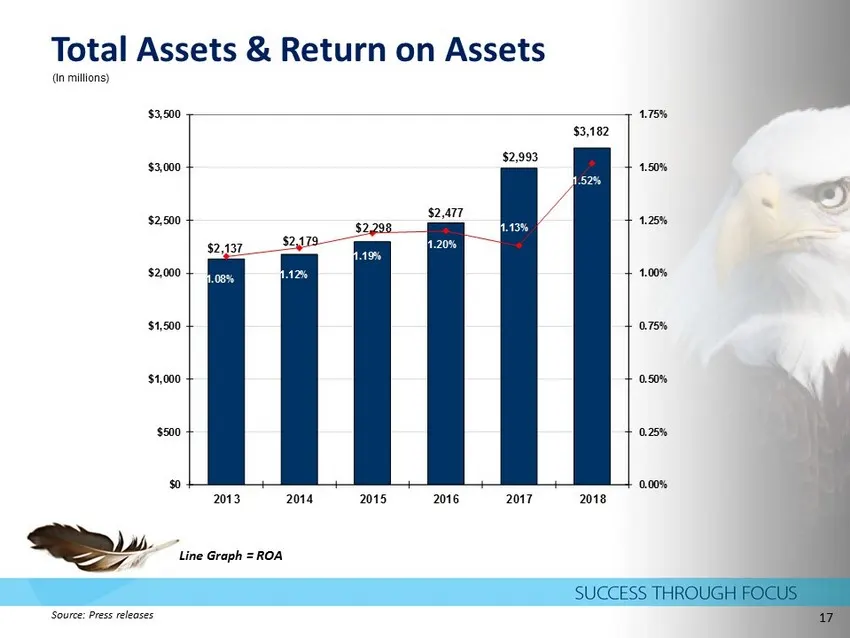
Slide 17: Total Assets & Return on Assets
Total Assets & Return on Assets (In millions) $2,137 $2,179 $2,298 $2,477 $2,993 $3,182 1.08% 1.12% 1.19% 1.20% 1.13% 1.52% 0.00% 0.25% 0.50% 0.75% 1.00% 1.25% 1.50% 1.75% $0 $500 $1,000 $1,500 $2,000 $2,500 $3,000 $3,500 2013 2014 2015 2016 2017 2018 Source : Press r eleases 17 Line Graph = ROA
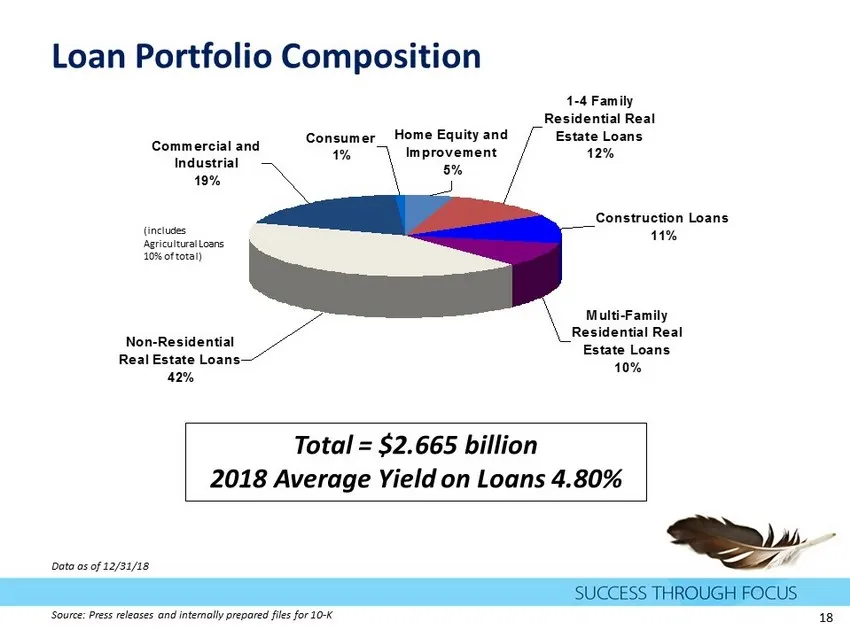
Slide 18: Loan Portfolio Composition
Loan Portfolio Composition Commercial and Industrial 19% Non-Residential Real Estate Loans 42% Multi-Family Residential Real Estate Loans 10% Consumer 1% Construction Loans 11% 1-4 Family Residential Real Estate Loans 12% Home Equity and Improvement 5% Total = $2.665 billion 2018 Average Yield on Lo
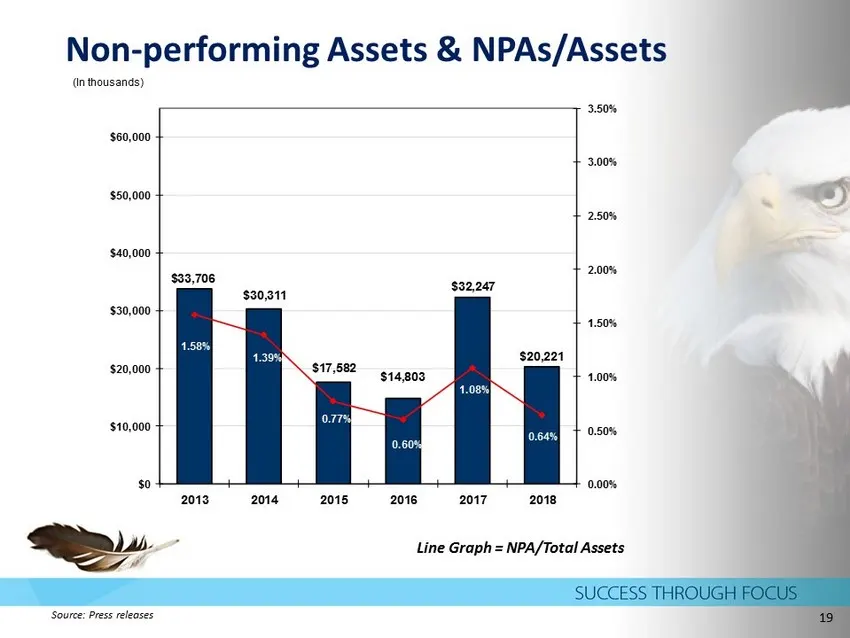
Slide 19: Non-performing Assets & NPAs/Assets
Non - performing Assets & NPAs/Assets (In thousands) $33,706 $30,311 $17,582 $14,803 $32,247 $20,221 1.58% 1.39% 0.77% 0.60% 1.08% 0.64% 0.00% 0.50% 1.00% 1.50% 2.00% 2.50% 3.00% 3.50% $0 $10,000 $20,000 $30,000 $40,000 $50,000 $60,000 2013 2014 2015 2016 2017 2018 Source : Press releases Line Graph
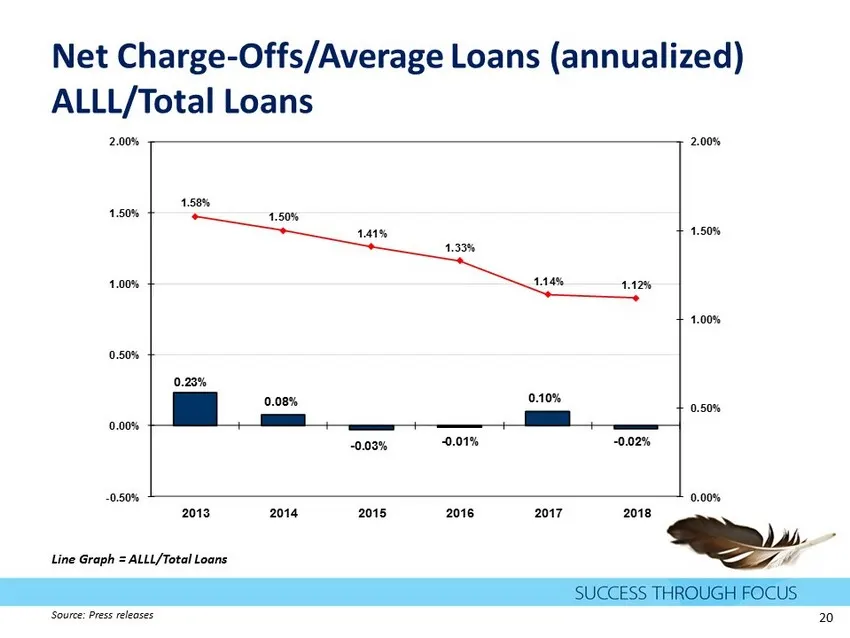
Slide 20: Net Charge-Offs/Average Loans and ALLL/Total Loans
Net Charge - Offs/Average Loans (annualized) ALLL/Total Loans 0.23% 0.08% - 0.03% - 0.01% 0.10% - 0.02% 1.58% 1.50% 1.41% 1.33% 1.14% 1.12% 0.00% 0.50% 1.00% 1.50% 2.00% -0.50% 0.00% 0.50% 1.00% 1.50% 2.00% 2013 2014 2015 2016 2017 2018 Source : Press r eleases Line Graph = ALLL/Total Loans 20
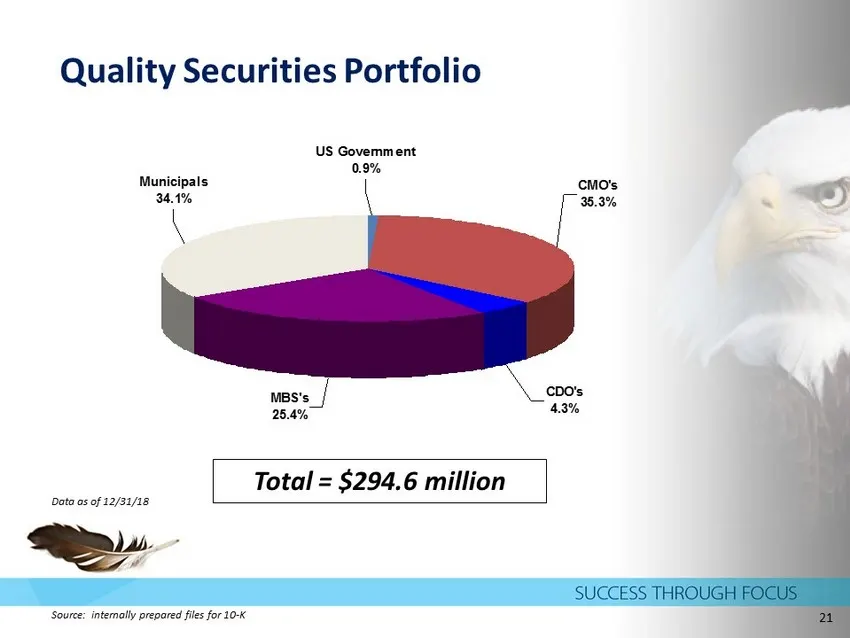
Slide 21: Quality Securities Portfolio
Quality Securities Portfolio US Government 0.9% CMO's 35.3% CDO's 4.3% MBS's 25.4% Municipals 34.1% Total = $294.6 million Source : internally prepared files for 10 - K Data as of 12/31/18 21
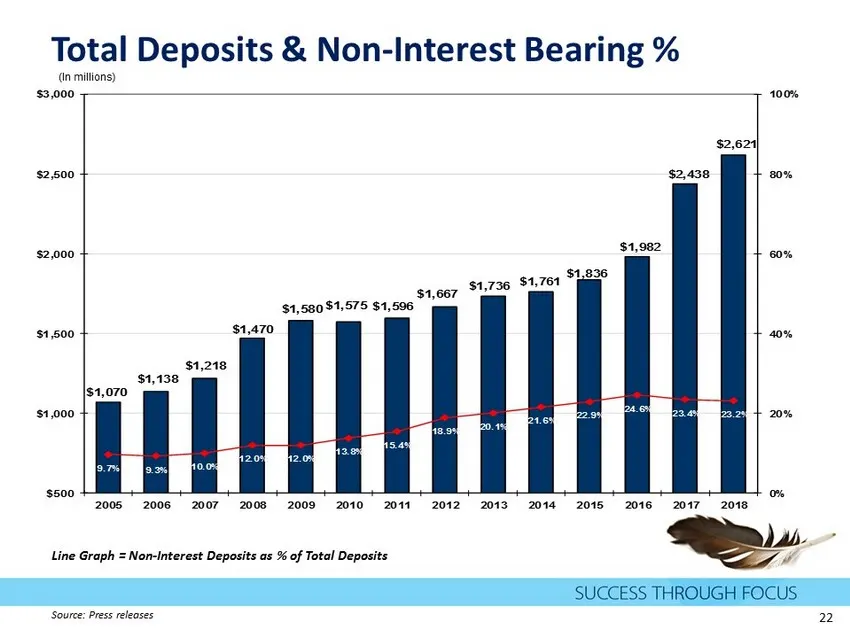
Slide 22: Total Deposits & Non-Interest Bearing %
Total Deposits & Non - Interest Bearing % (In millions) $1,070 $1,138 $1,218 $1,470 $1,580 $1,575 $1,596 $1,667 $1,736 $1,761 $1,836 $1,982 $2,438 $2,621 9.7% 9.3% 10.0% 12.0% 12.0% 13.8% 15.4% 18.9% 20.1% 21.6% 22.9% 24.6% 23.4% 23.2% 0% 20% 40% 60% 80% 100% $500 $1,000 $1,500 $2,000 $2,500 $3,000
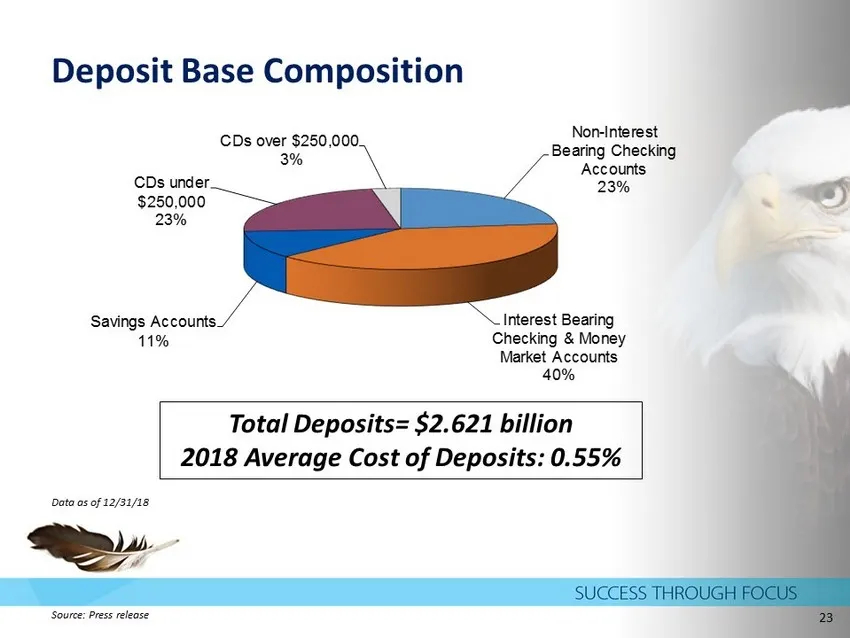
Slide 23: Deposit Base Composition
Deposit Base Composition Non - Interest Bearing Checking Accounts 23% Interest Bearing Checking & Money Market Accounts 40% Savings Accounts 11% CDs under $250,000 23% CDs over $250,000 3% Total Deposits= $2.621 billion 2018 Average Cost of Deposits: 0.55% Source : Press release Data as of 12/31/18
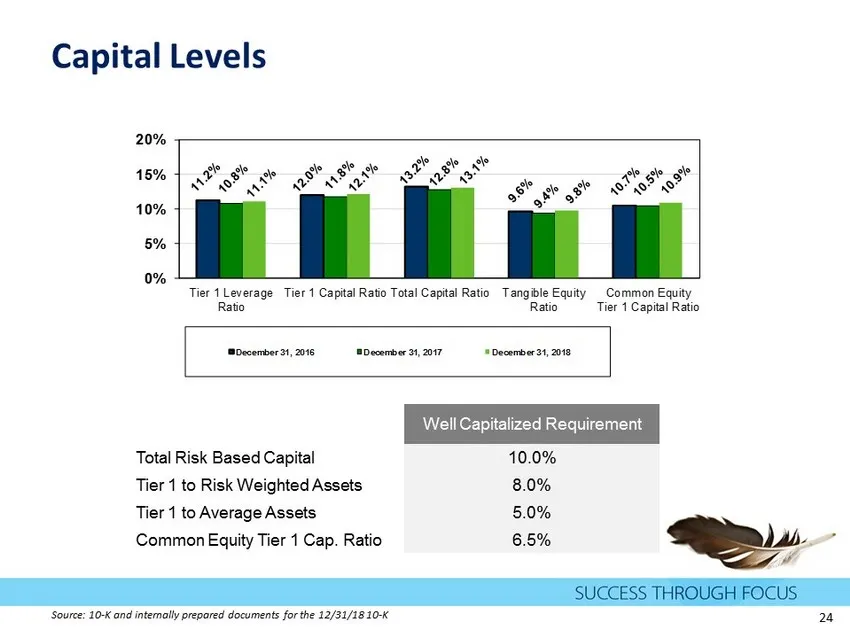
Slide 24: Capital Levels
Capital Levels 0% 5% 10% 15% 20% Tier 1 Leverage Ratio Tier 1 Capital Ratio Total Capital Ratio Tangible Equity Ratio Common Equity Tier 1 Capital Ratio December 31, 2016 December 31, 2017 December 31, 2018 Well Capitalized Requirement Total Risk Based Capital 10.0% Tier 1 to Risk Weighted Assets 8.
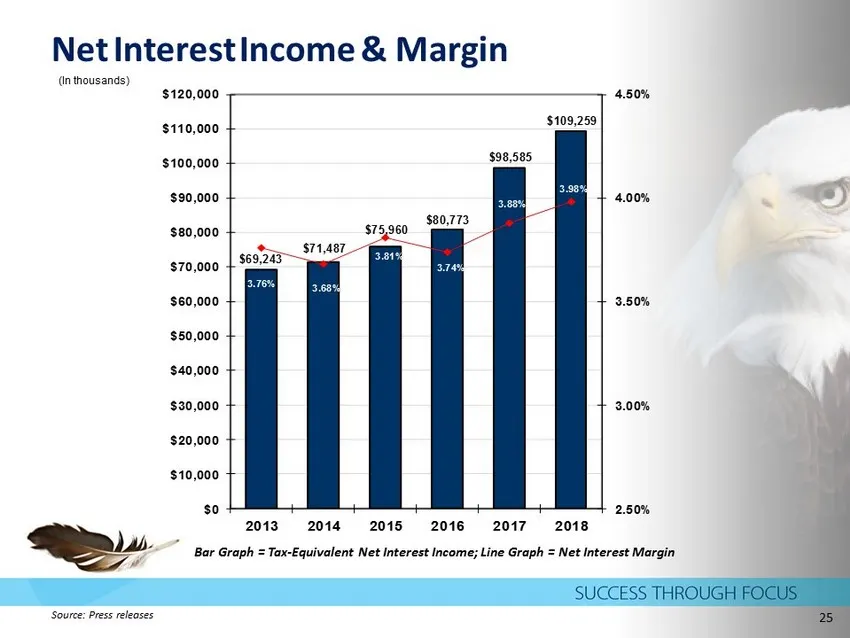
Slide 25: Net Interest Income & Margin
Net Interest Income & Margin (In thousands) $69,243 $71,487 $75,960 $80,773 $98,585 $109,259 3.76% 3.68% 3.81% 3.74% 3.88% 3.98% 2.50% 3.00% 3.50% 4.00% 4.50% $0 $10,000 $20,000 $30,000 $40,000 $50,000 $60,000 $70,000 $80,000 $90,000 $100,000 $110,000 $120,000 2013 2014 2015 2016 2017 2018 Bar Graph
Slide 26: Non-Interest Income & Percent of Total Revenue
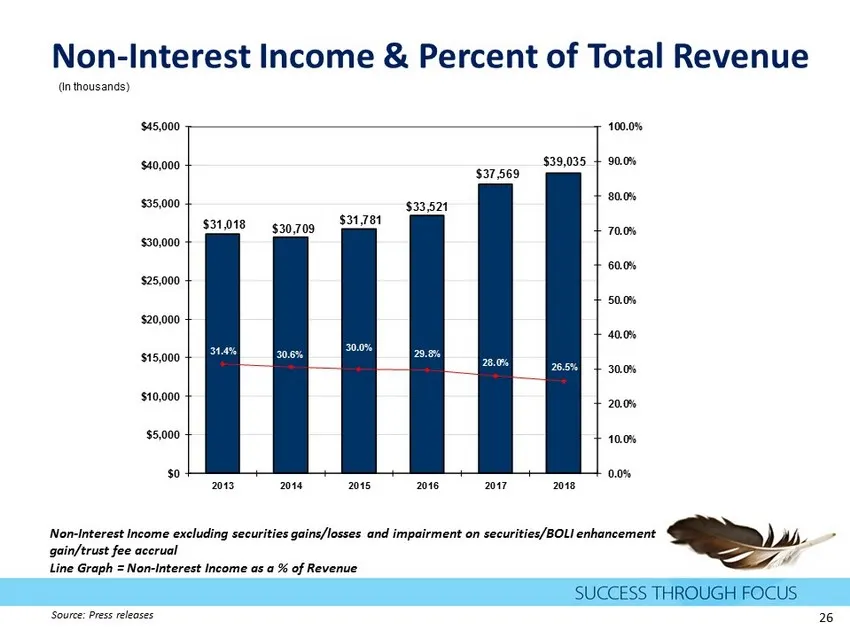
Non - Interest Income & Percent of Total Revenue (In thousands) $31,018 $30,709 $31,781 $33,521 $37,569 $39,035 31.4% 30.6% 30.0% 29.8% 28.0% 26.5% 0.0% 10.0% 20.0% 30.0% 40.0% 50.0% 60.0% 70.0% 80.0% 90.0% 100.0% $0 $5,000 $10,000 $15,000 $20,000 $25,000 $30,000 $35,000 $40,000 $45,000 2013 2014 20
Slide 27: Non-Interest Expense & Efficiency Ratio
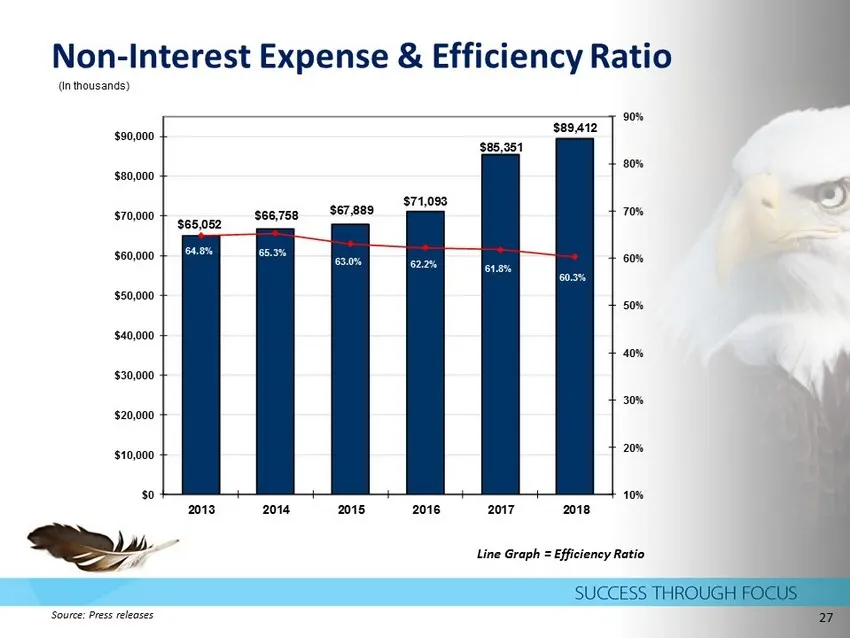
Non - Interest Expense & Efficiency Ratio (In thousands) $65,052 $66,758 $67,889 $71,093 $85,351 $89,412 64.8% 65.3% 63.0% 62.2% 61.8% 60.3% 10% 20% 30% 40% 50% 60% 70% 80% 90% $0 $10,000 $20,000 $30,000 $40,000 $50,000 $60,000 $70,000 $80,000 $90,000 2013 2014 2015 2016 2017 2018 Line Graph = Effic
Slide 28: Return On Equity & ROTE
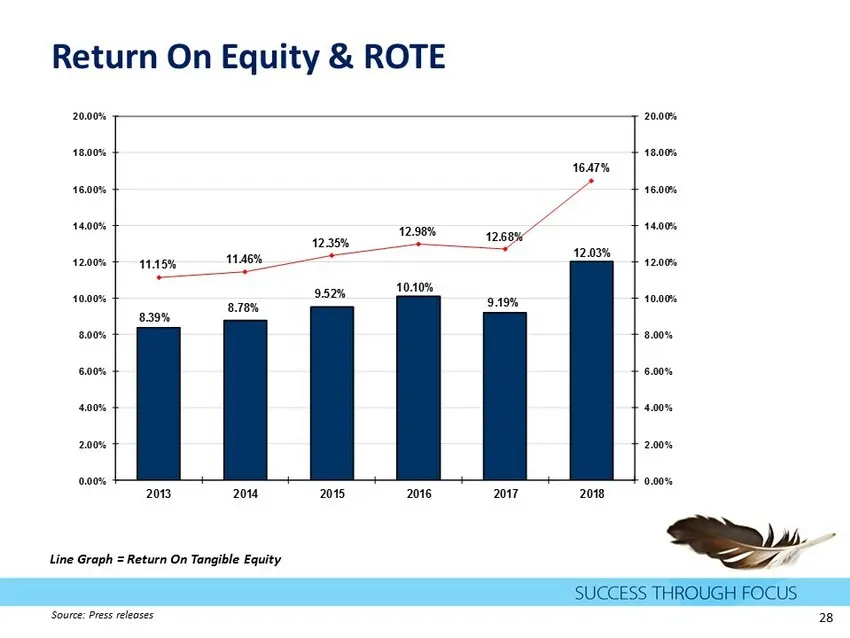
Return On Equity & ROTE 8.39% 8.78% 9.52% 10.10% 9.19% 12.03% 11.15% 11.46% 12.35% 12.98% 12.68% 16.47% 0.00% 2.00% 4.00% 6.00% 8.00% 10.00% 12.00% 14.00% 16.00% 18.00% 20.00% 0.00% 2.00% 4.00% 6.00% 8.00% 10.00% 12.00% 14.00% 16.00% 18.00% 20.00% 2013 2014 2015 2016 2017 2018 Line Graph = Return On
Slide 29: Shareholder Value
Shareholder ‘ Value 3 SUCCESS THROUGH FOCUS
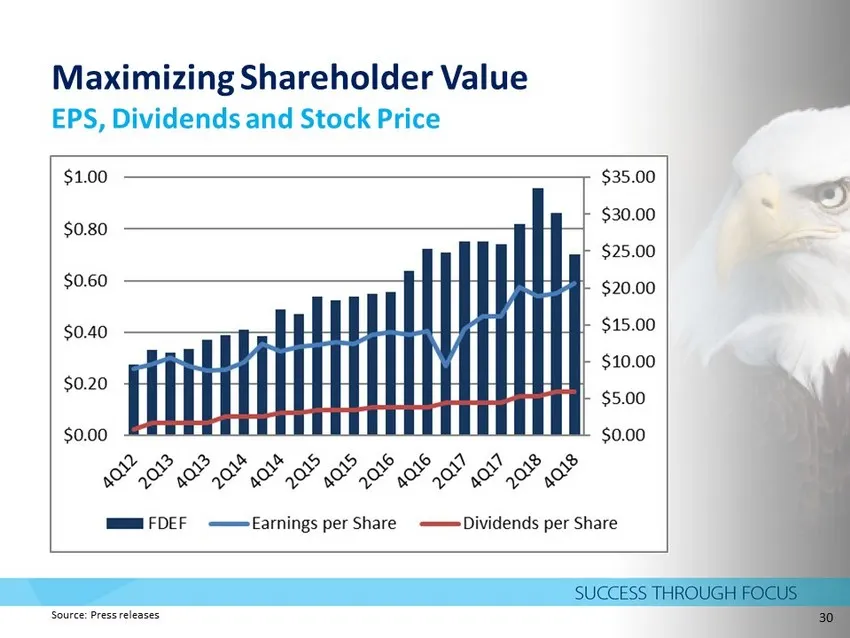
Slide 30: Maximizing Shareholder Value: EPS, Dividends and Stock Price
Maximizing Shareholder Value EPS, Dividends and Stock Price Source: Press releases 30
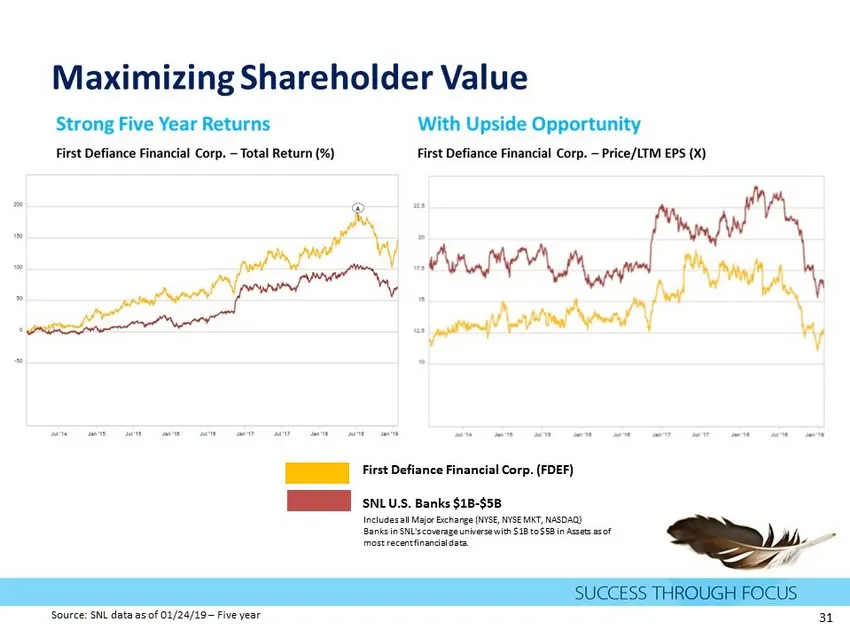
Slide 31: Maximizing Shareholder Value
Maximizing Shareholder Value First Defiance Financial Corp. (FDEF) SNL U.S. Banks $1B - $5B Includes all Major Exchange (NYSE, NYSE MKT, NASDAQ) Banks in SNL's coverage universe with $1B to $5B in Assets as of most recent financial data. Source: SNL data as of 01/24/19 – Five year 31
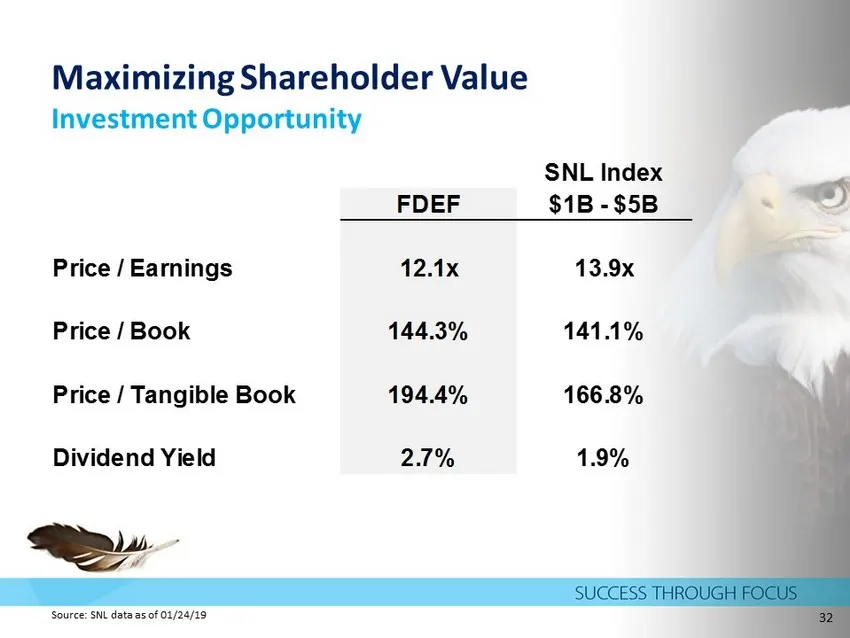
Slide 32: Maximizing Shareholder Value: Investment Opportunity
Maximizing Shareholder Value Investment Opportunity Source: SNL data as of 01/24/19 32 SNL Index FDEF $1B - $5B Price / Earnings 12.1x 13.9x Price / Book 144.3% 141.1% Price / Tangible Book 194.4% 166.8% Dividend Yield 2.7% 1.9%
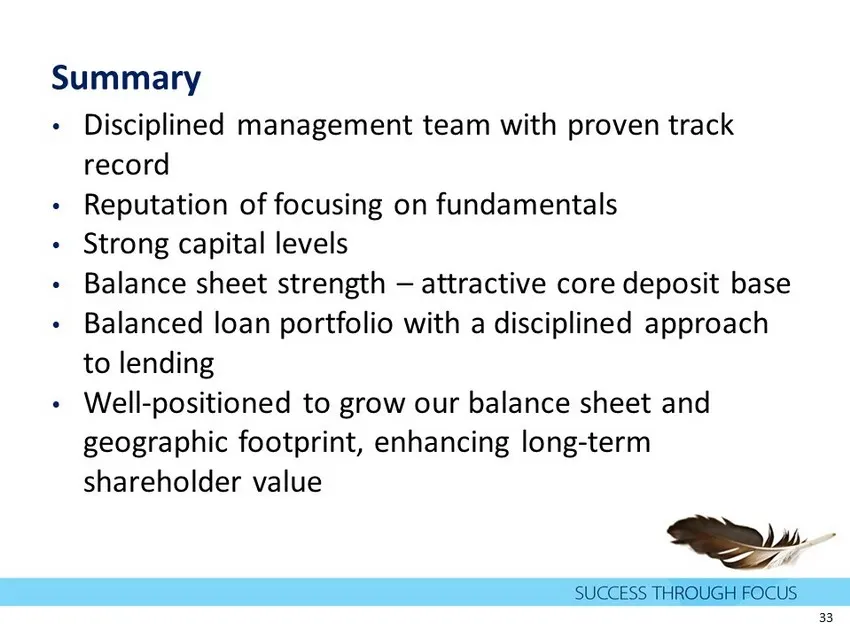
Slide 33: Summary
• Disciplined management team with proven track record • Reputation of focusing on fundamentals • Strong capital levels • Balance sheet strength – attractive core deposit base • Balanced loan portfolio with a disciplined approach to lending • Well - positioned to grow our balance sheet and geographi

Slide 34: Thank you.
Thank you. Donald P. Hileman | President & CEO 419 - 785 - 2210 | dhileman@first - fed.com Kevin T. Thompson | EVP & CFO 419 - 783 - 1098 | kthompson@first - fed.com Paul D. Nungester | EVP F&A 419 - 785 - 8700 | pnungester@first - fed.com 34
Source: SEC EDGAR · 8-K filed Feb 6, 2019
More decks from Premier Financial Corp
 Investor Presentation (February 2025)51 slides · Feb 10, 2025
 Q4 2024 Earnings Presentation23 slides · Jan 22, 2025
 Q3 2024 Earnings Presentation50 slides · Nov 6, 2024
 Q3 2024 Earnings Presentation22 slides · Oct 23, 2024
 Investor Presentation (August 2024)54 slides · Aug 30, 2024
 Merger or Acquisition (July 2024)39 slides · Jul 26, 2024