Virgin America — Non-Deal Roadshow (May 2015)
26 slides from Virgin America's roadshow presentation, May 18, 2015
Slide 1: Virgin America
Exhibit 99.1 Virgin America May 18-19, 2015
Slide 2: Disclaimer
Disclaimer This presentation includes forward-looking statements that are subject to many risks and uncertainties. These forward- looking statements, such as our statements about our short-term and long-term growth strategies, can sometimes be identified by our use of terms such as “intend,” “expect
Slide 3: Key Investment Highlights
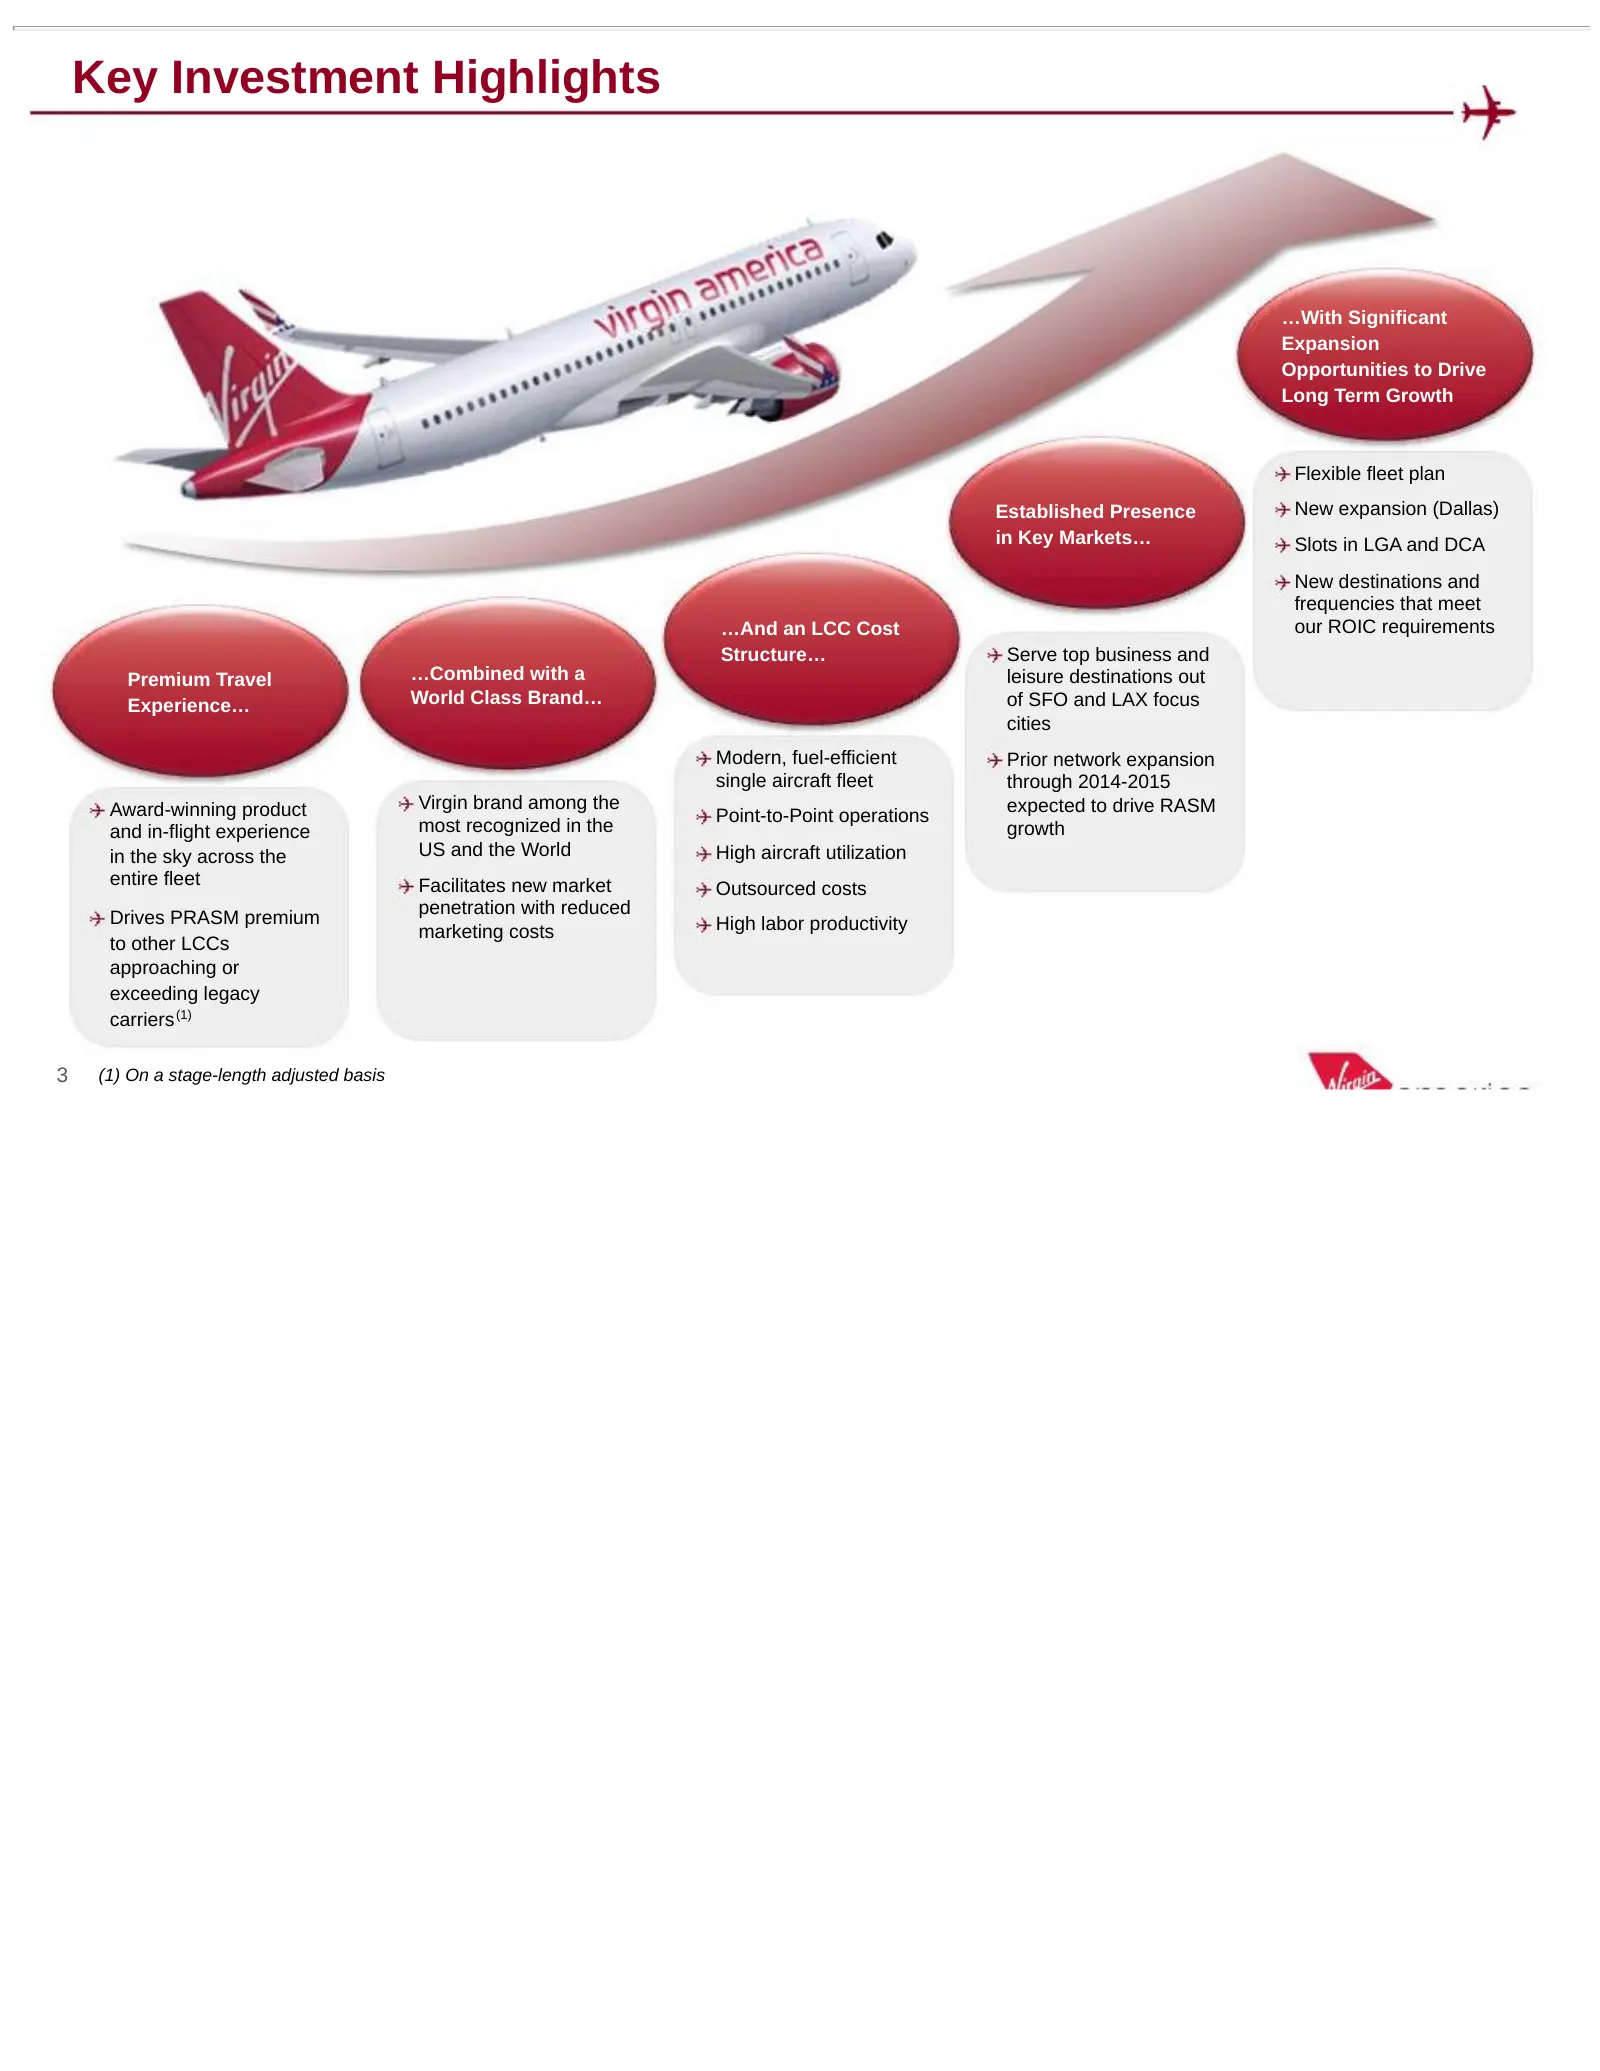
Key Investment Highlights …With Significant Expansion Opportunities to Drive Long Term Growth Flexible fleet plan Established Presence New expansion (Dallas) in Key Markets… Slots in LGA and DCA New destinations and frequencies that meet …And an LCC Cost our ROIC requirements Structure… Serve top bu
Slide 4: A Superior Business Model
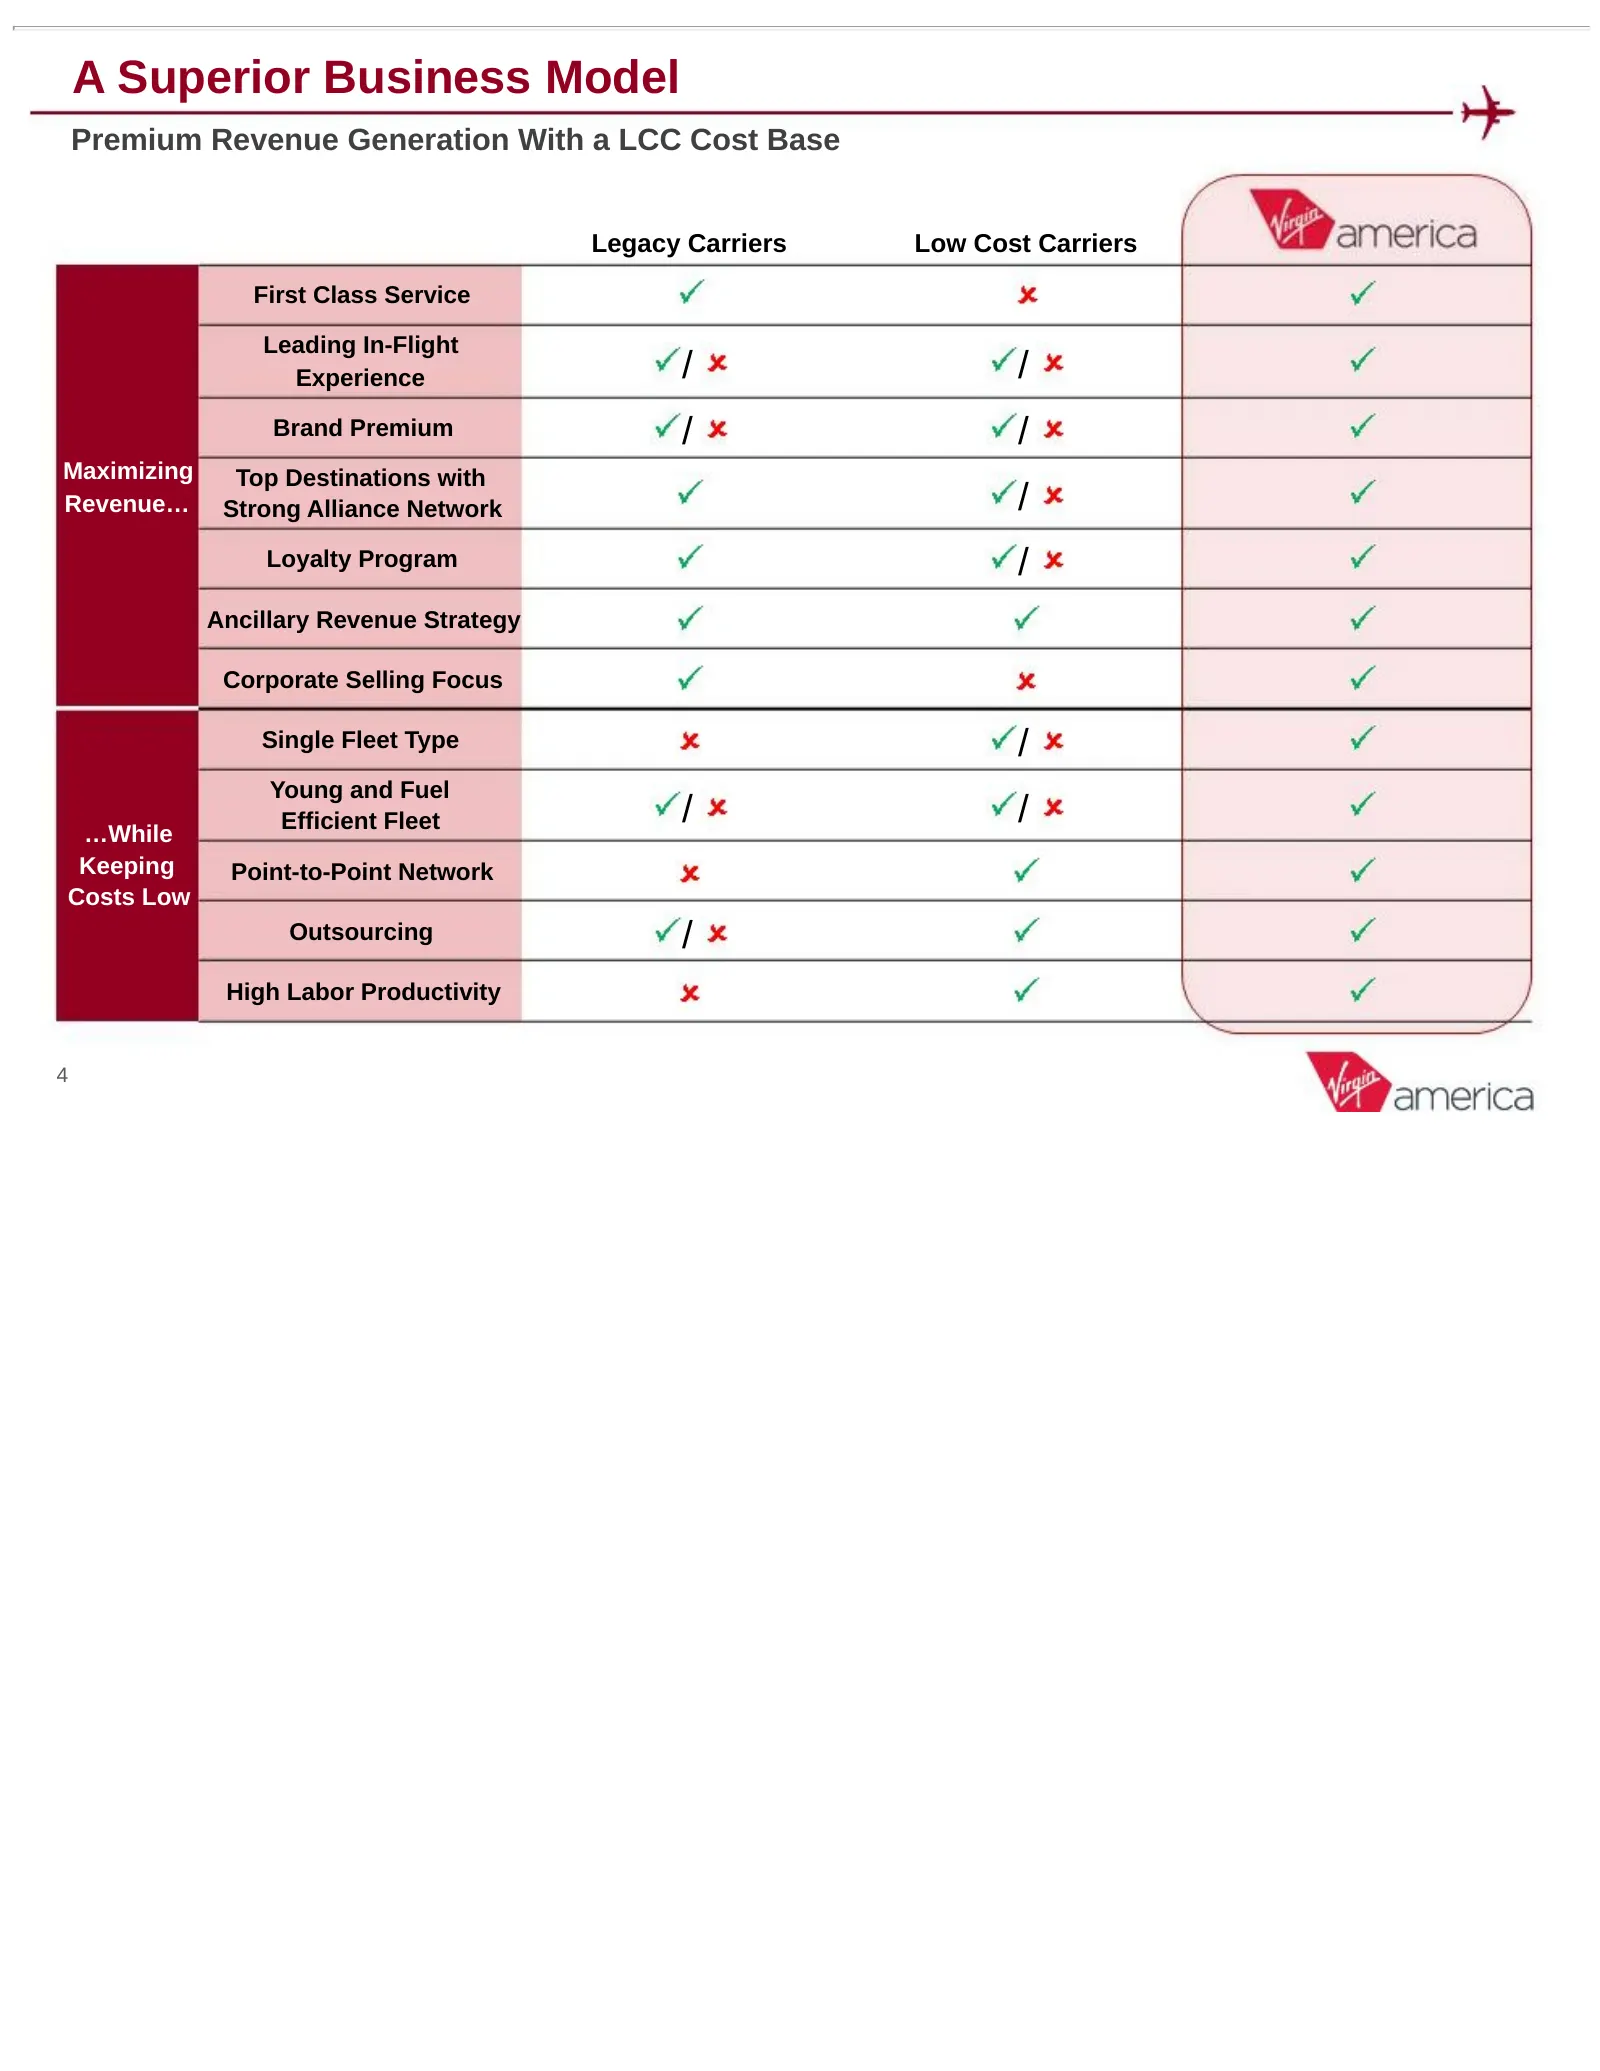
A Superior Business Model Premium Revenue Generation With a LCC Cost Base Legacy Carriers Low Cost Carriers First Class Service Leading In-Flight Experience / / Brand Premium / / Maximizing Top Destinations with Revenue… Strong Alliance Network / Loyalty Program / Ancillary Revenue Strategy Corporat
Slide 5: Virgin America at a Glance
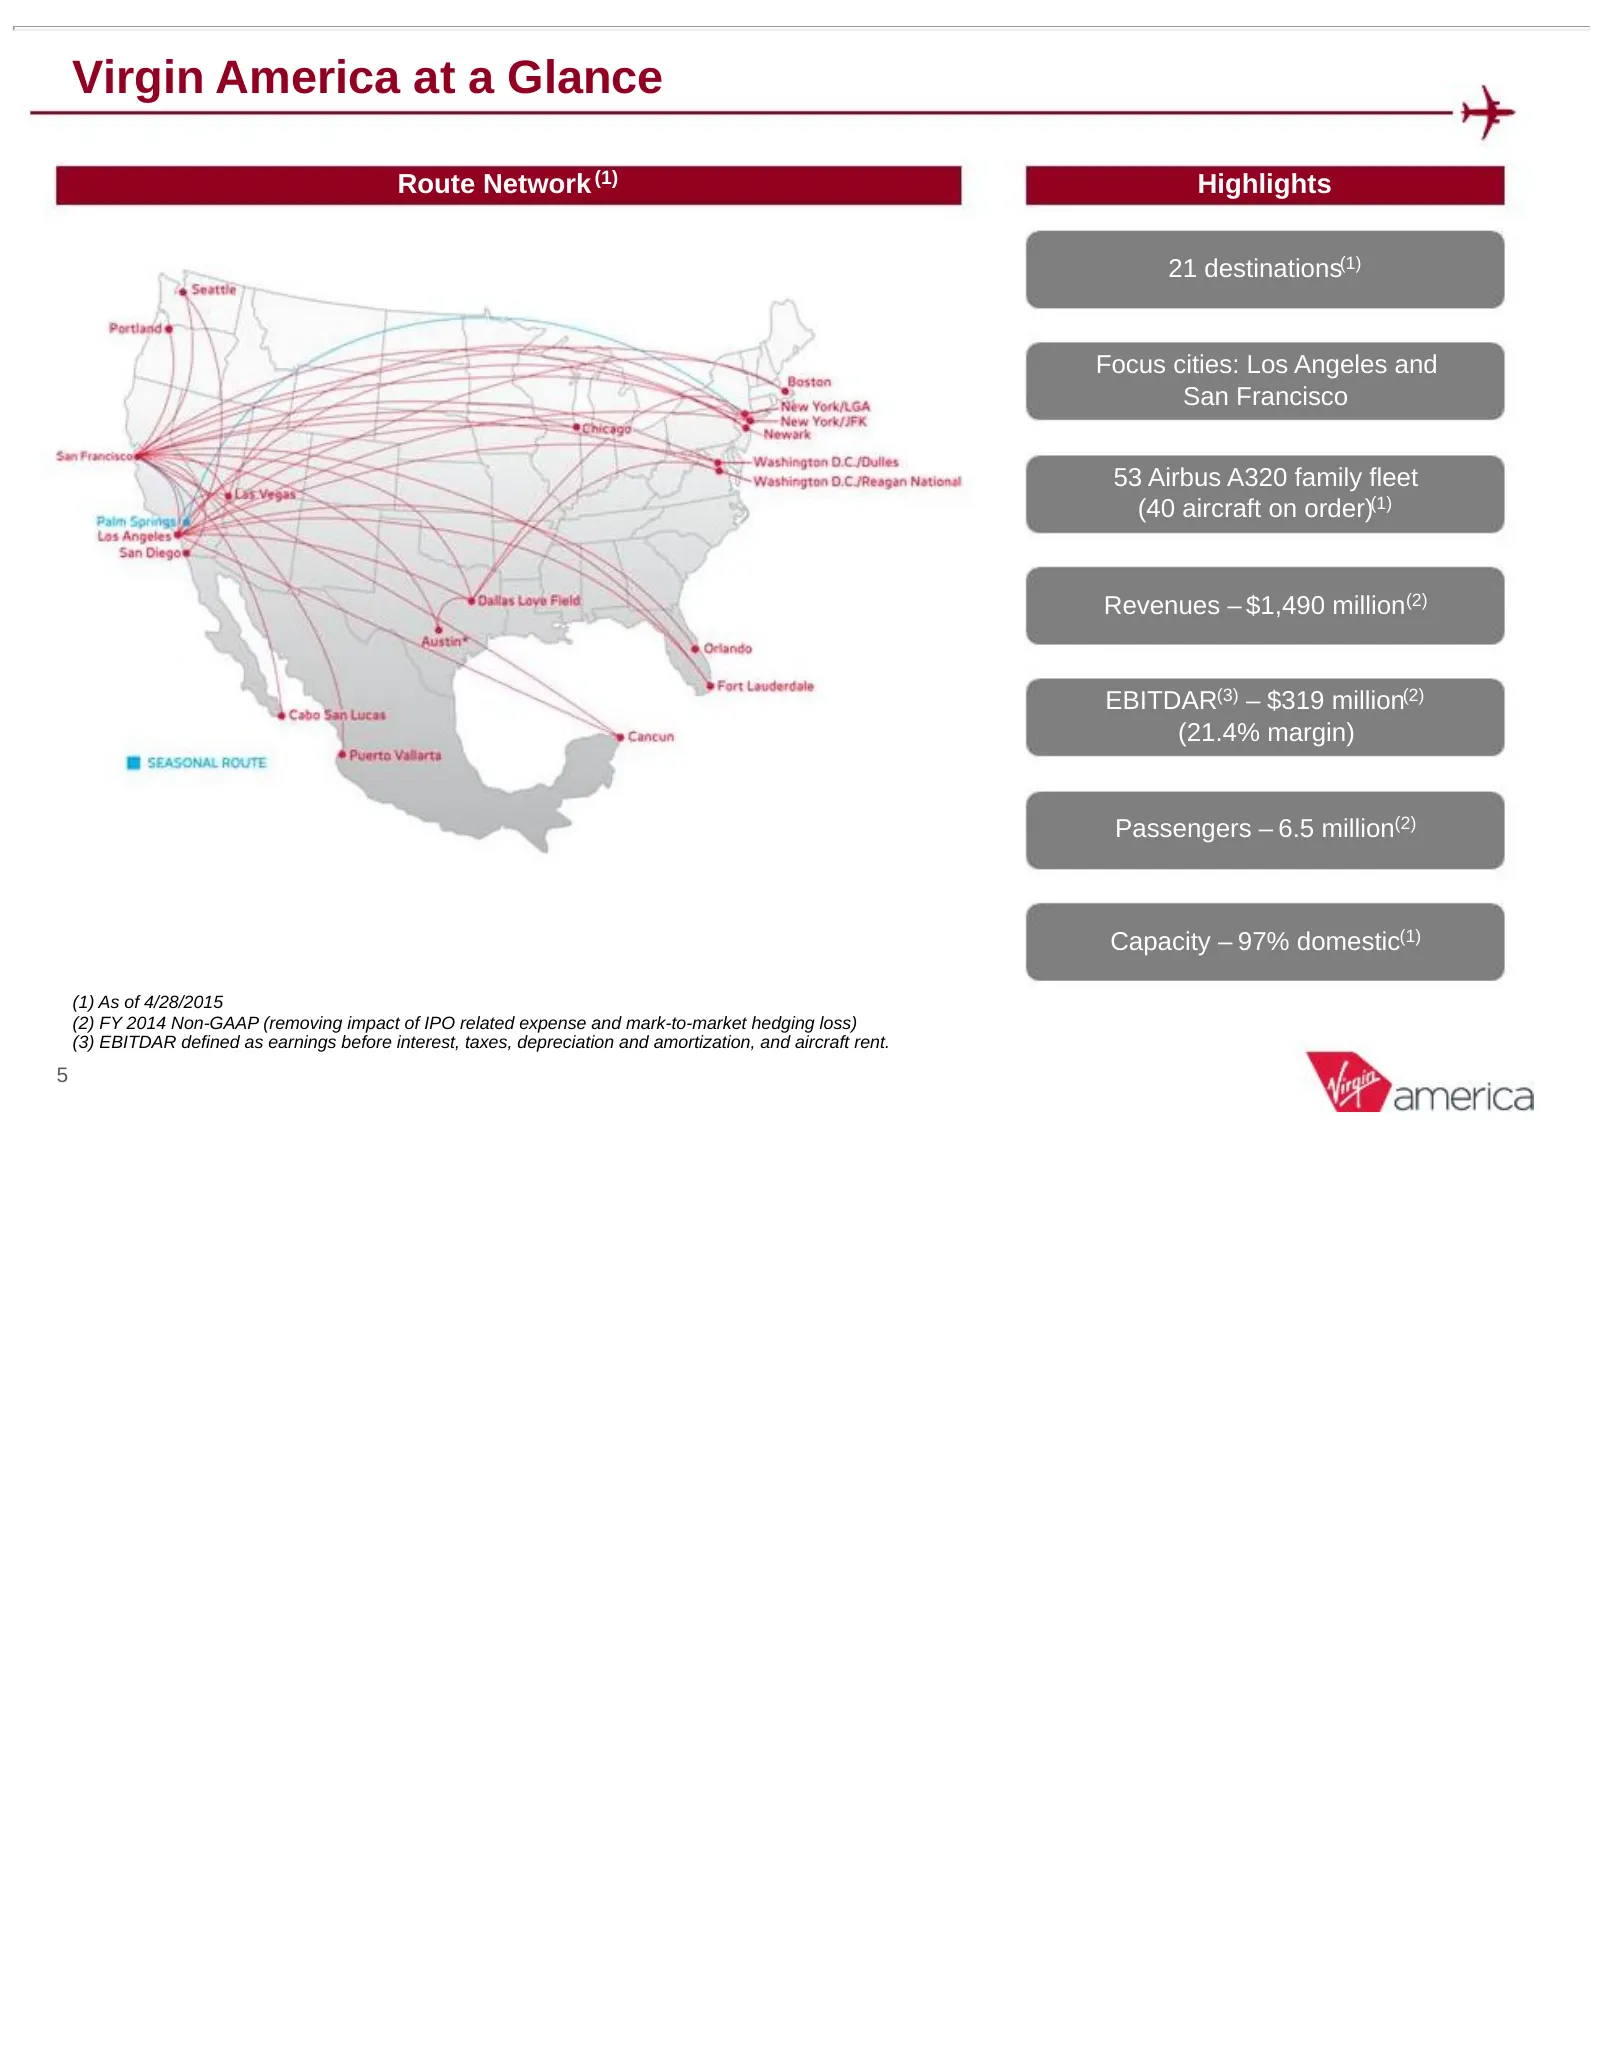
Virgin America at a Glance Route Network (1) Highlights 21 destinations(1) Focus cities: Los Angeles and San Francisco 53 Airbus A320 family fleet (40 aircraft on order)(1) Revenues – $1,490 million(2) EBITDAR(3) – $319 million(2) (21.4% margin) Passengers – 6.5 million(2) Capacity – 97% domestic(1)
Slide 6: Premium In-Flight Experience
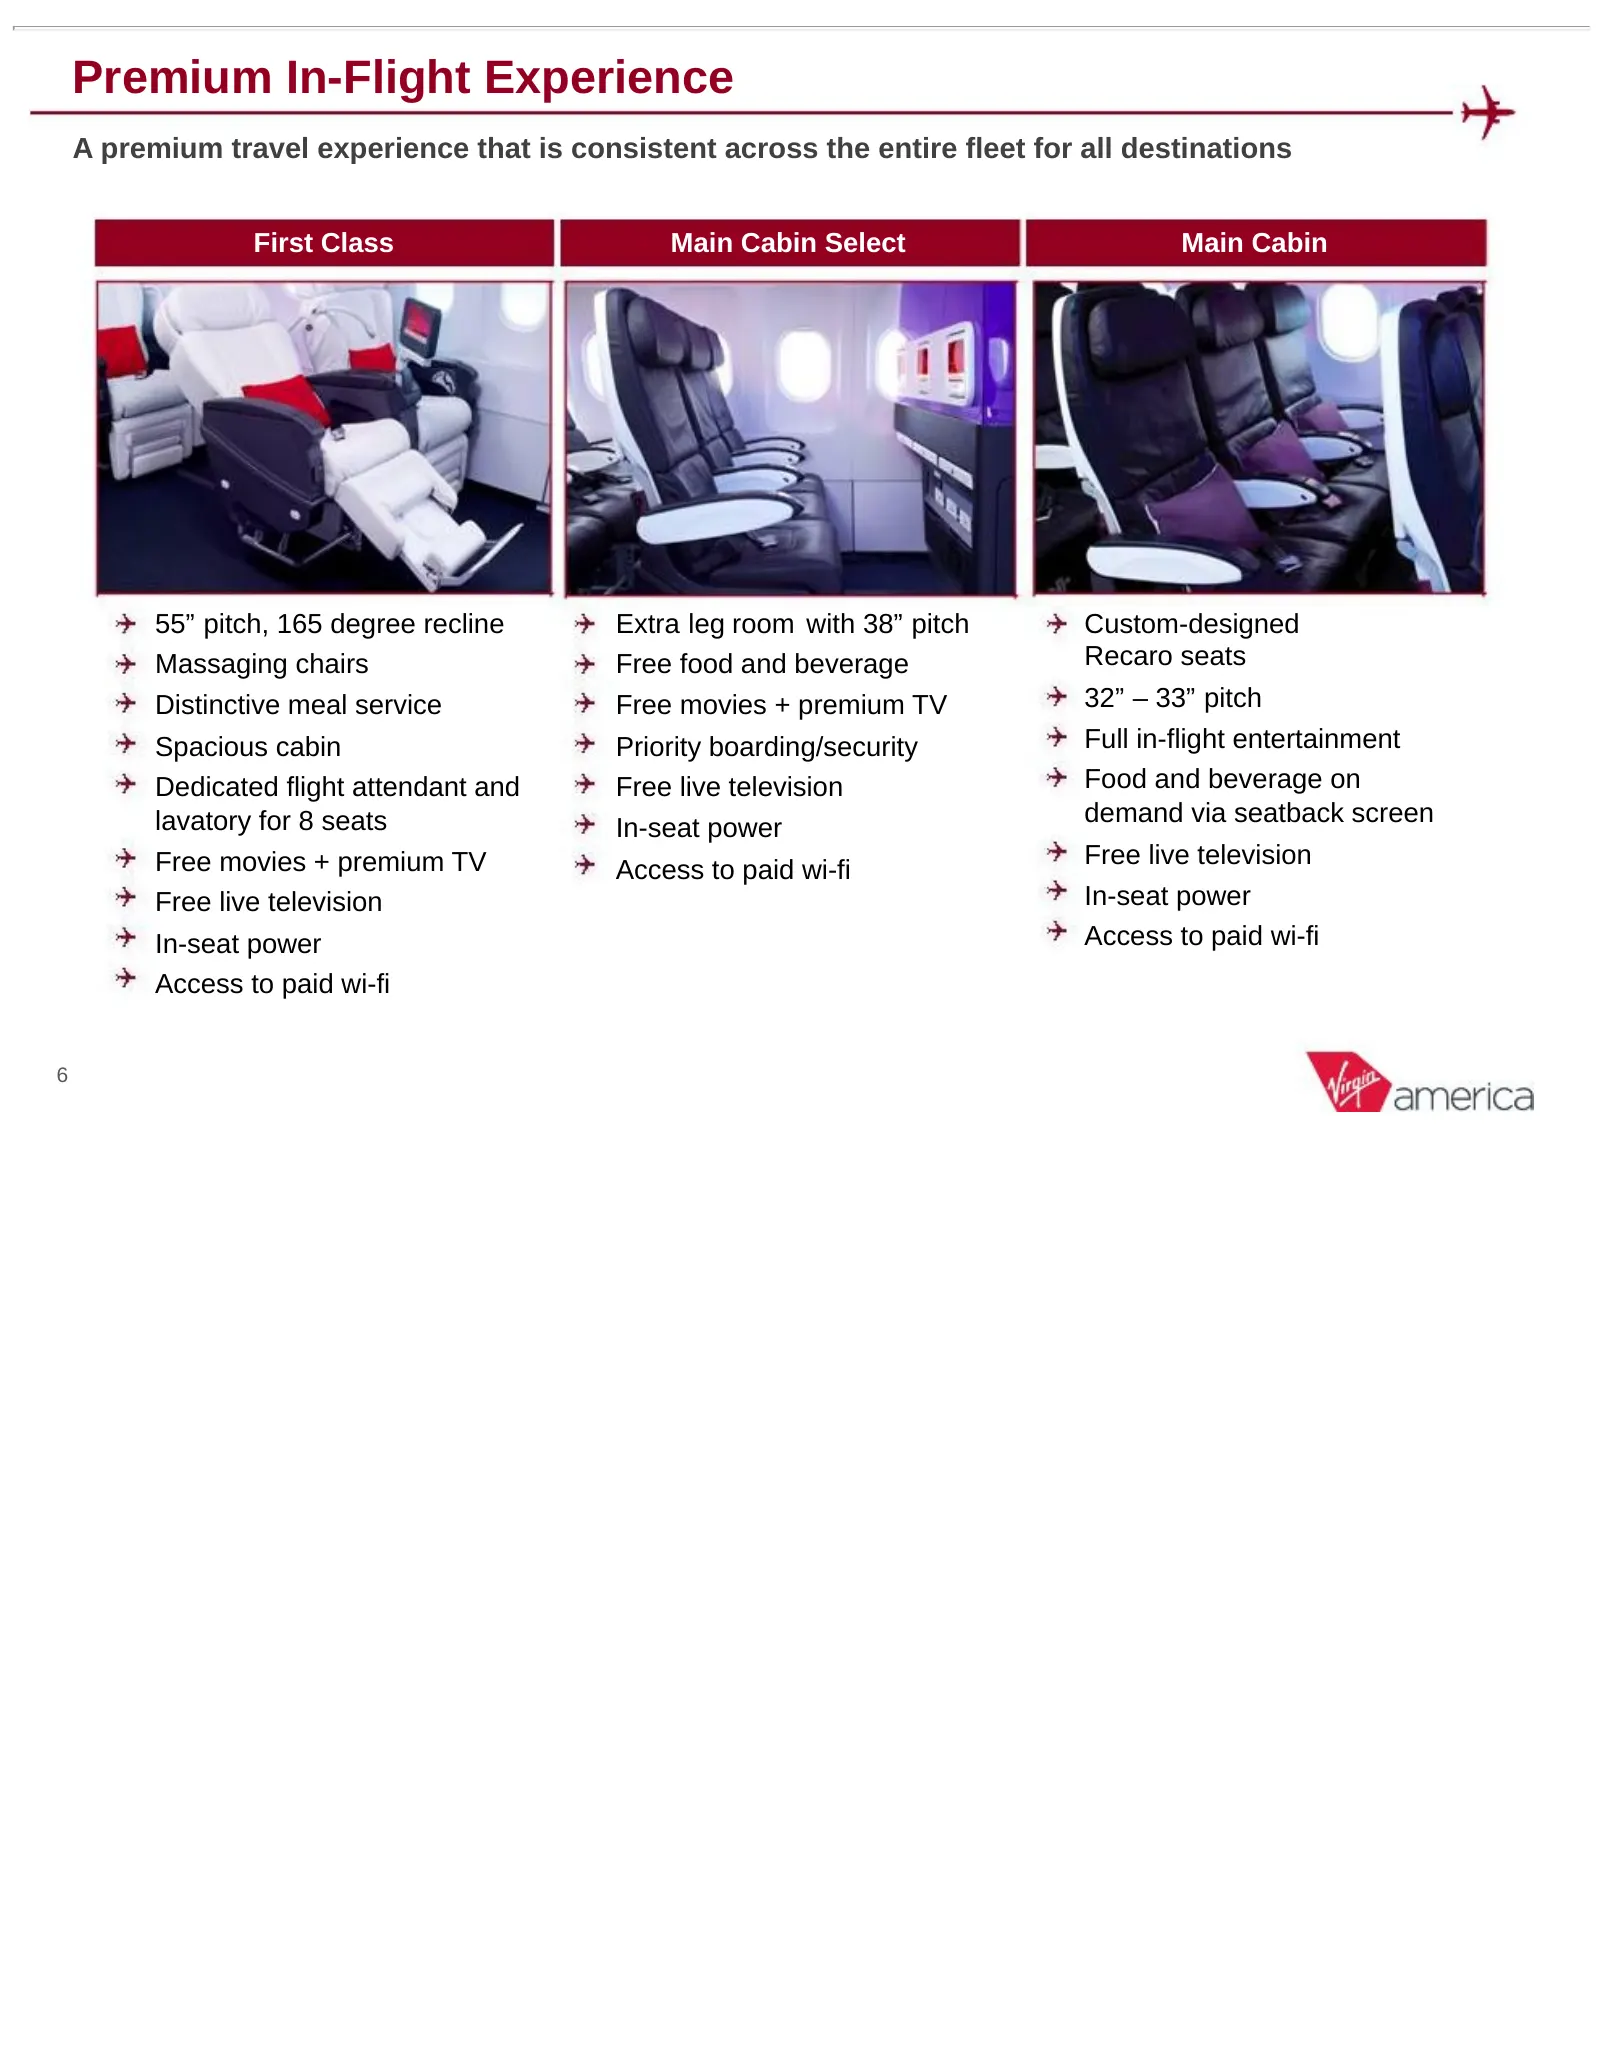
Premium In-Flight Experience A premium travel experience that is consistent across the entire fleet for all destinations First Class Main Cabin Select Main Cabin 55” pitch, 165 degree recline Extra leg room with 38” pitch Custom-designed Massaging chairs Free food and beverage Recaro seats Distincti
Slide 7: Award Winning Product
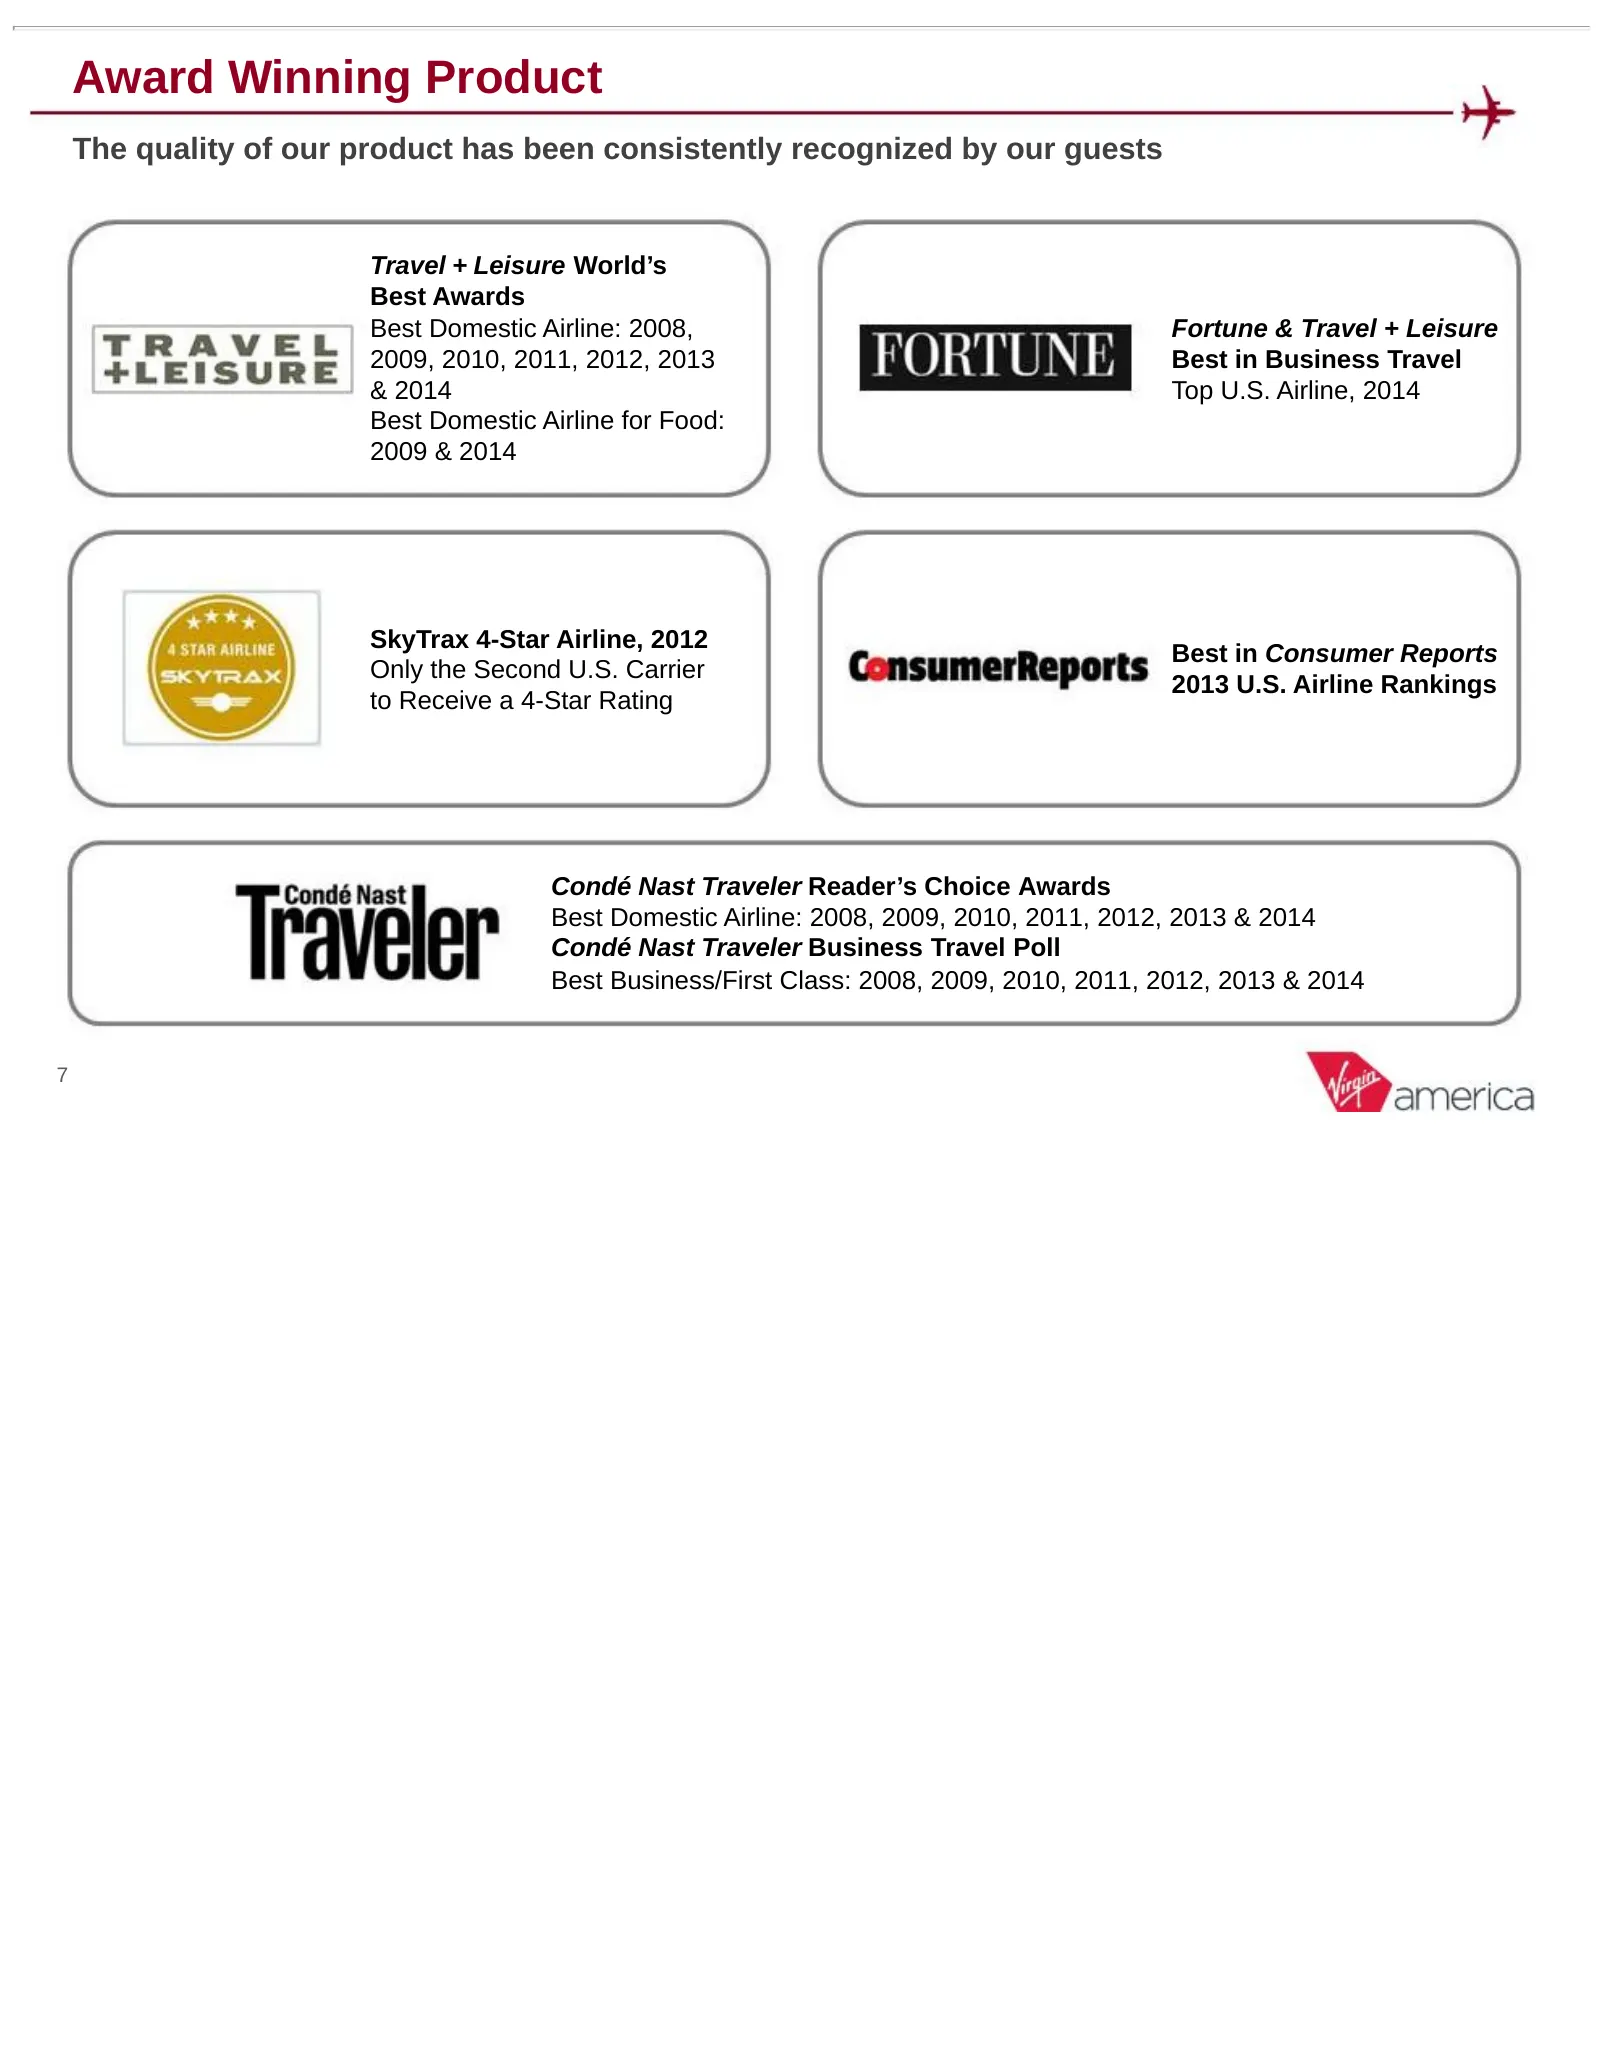
Award Winning Product The quality of our product has been consistently recognized by our guests Travel + Leisure World’s Best Awards Best Domestic Airline: 2008, Fortune & Travel + Leisure 2009, 2010, 2011, 2012, 2013 Best in Business Travel & 2014 Top U.S. Airline, 2014 Best Domestic Airline for Fo
Slide 8: PRASM Premium by Market
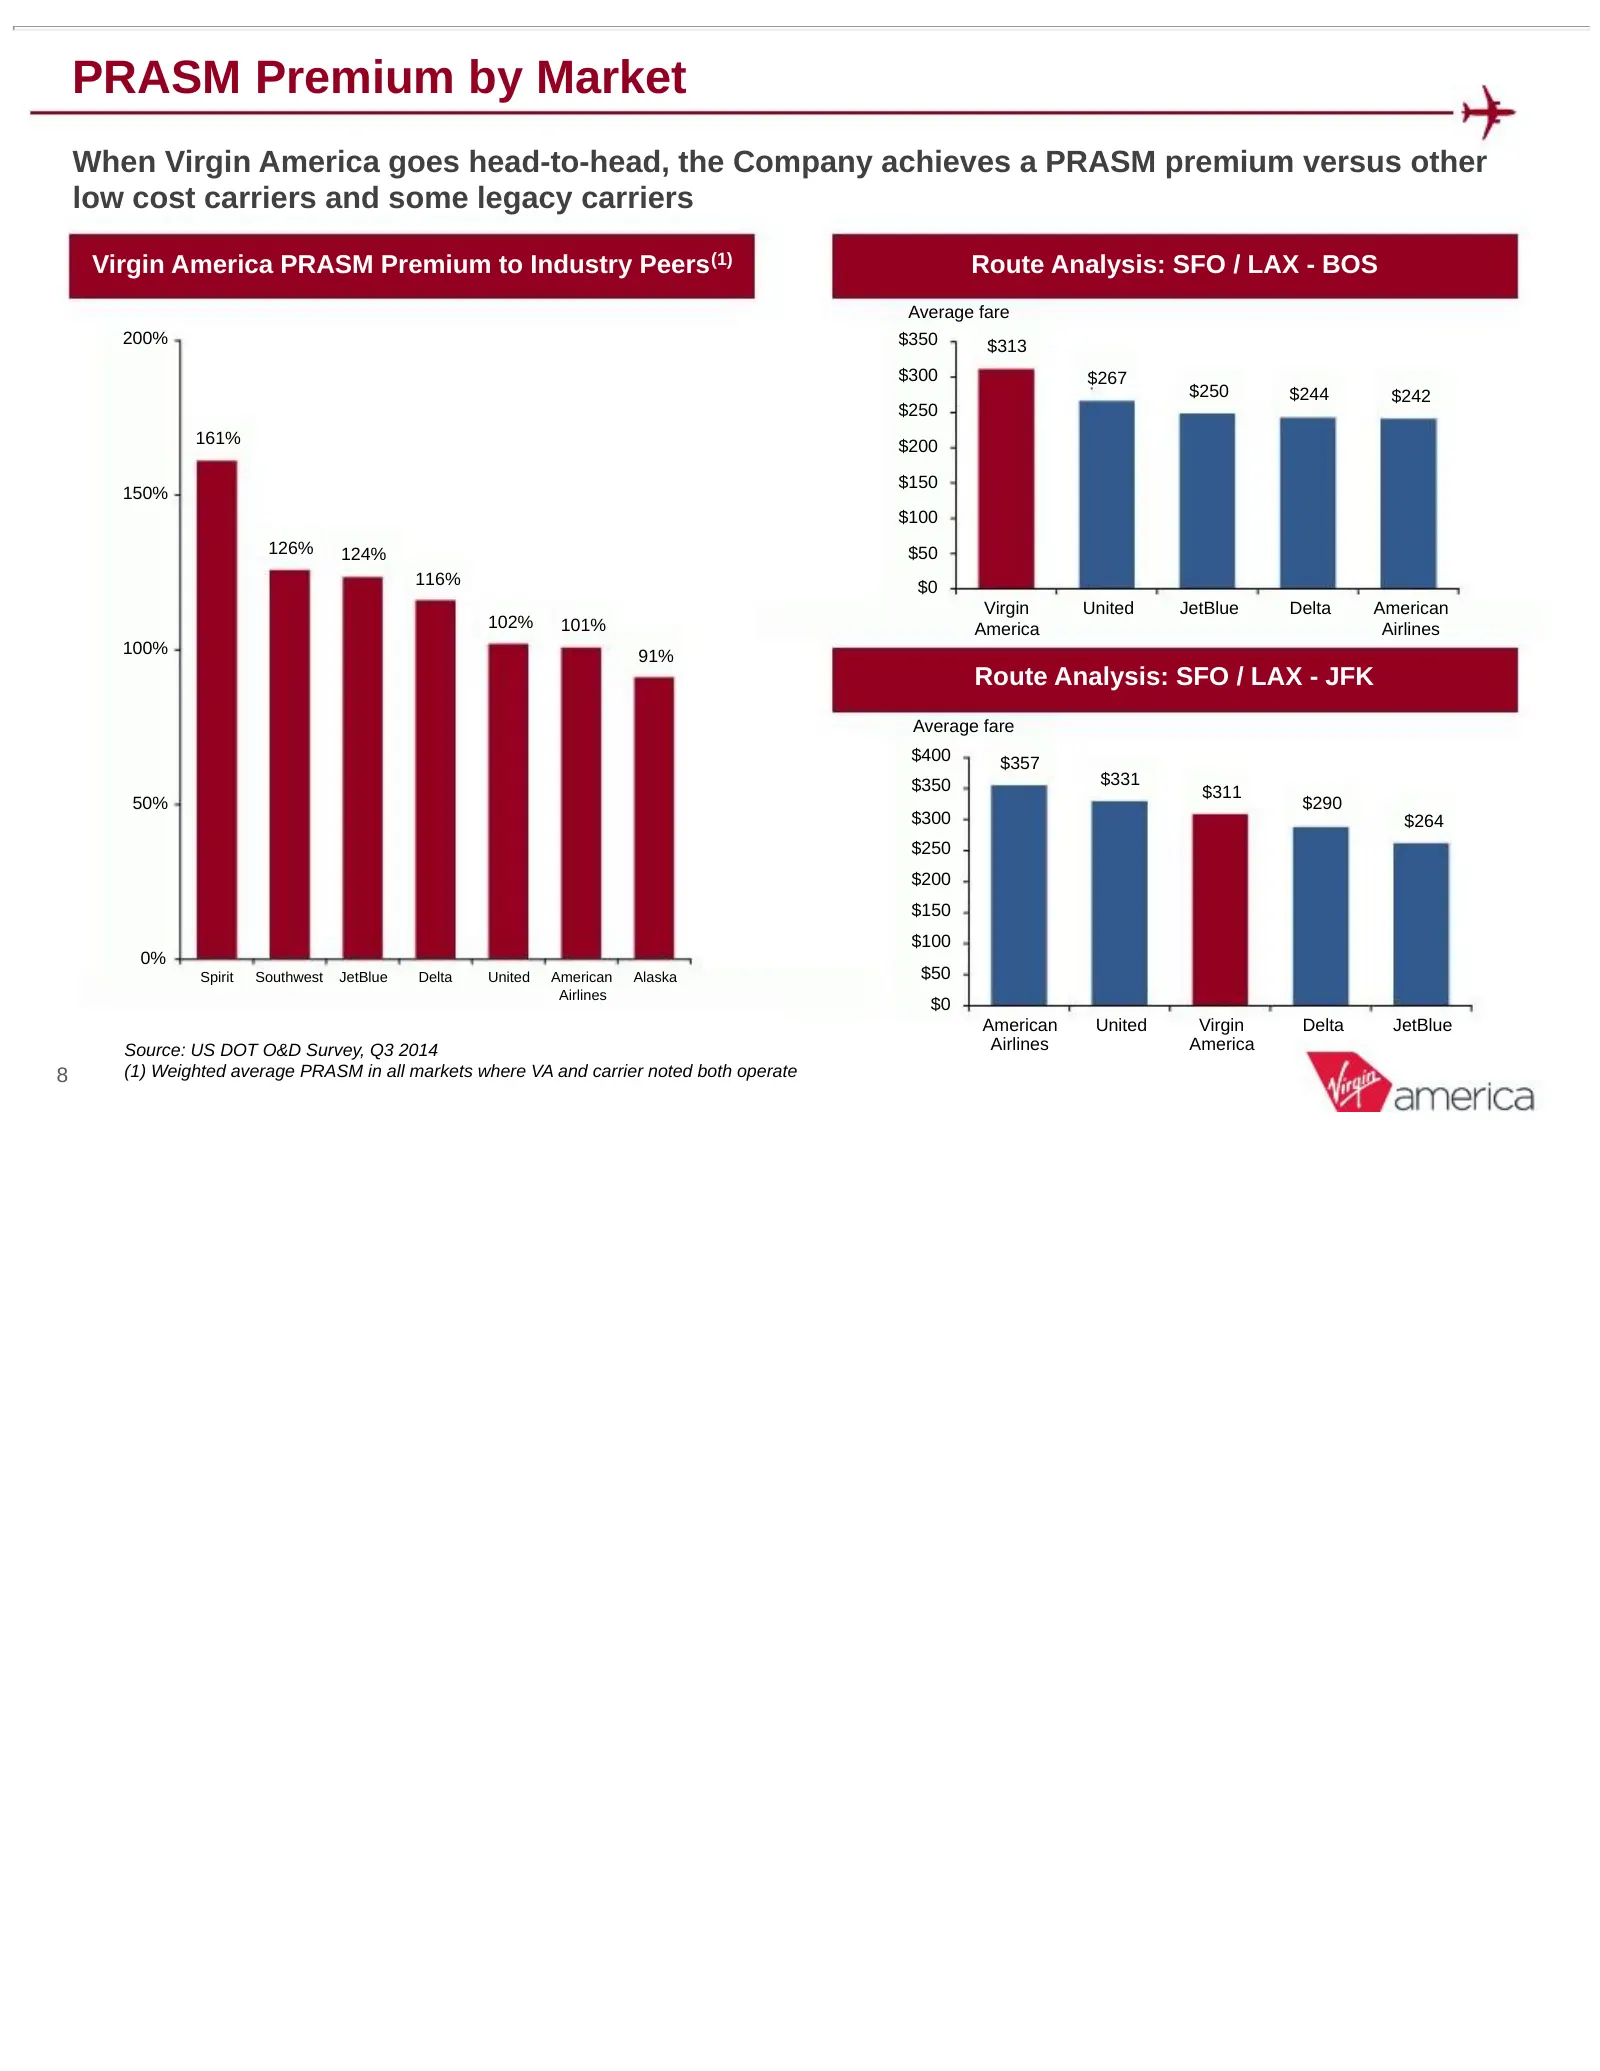
PRASM Premium by Market When Virgin America goes head-to-head, the Company achieves a PRASM premium versus other low cost carriers and some legacy carriers Virgin America PRASM Premium to Industry Peers (1) Route Analysis: SFO / LAX - BOS Average fare 200% $350 $313 $300 $267 $250 $244 $242 $250 161
Slide 9: New Markets Lead to Strong PRASM Performance
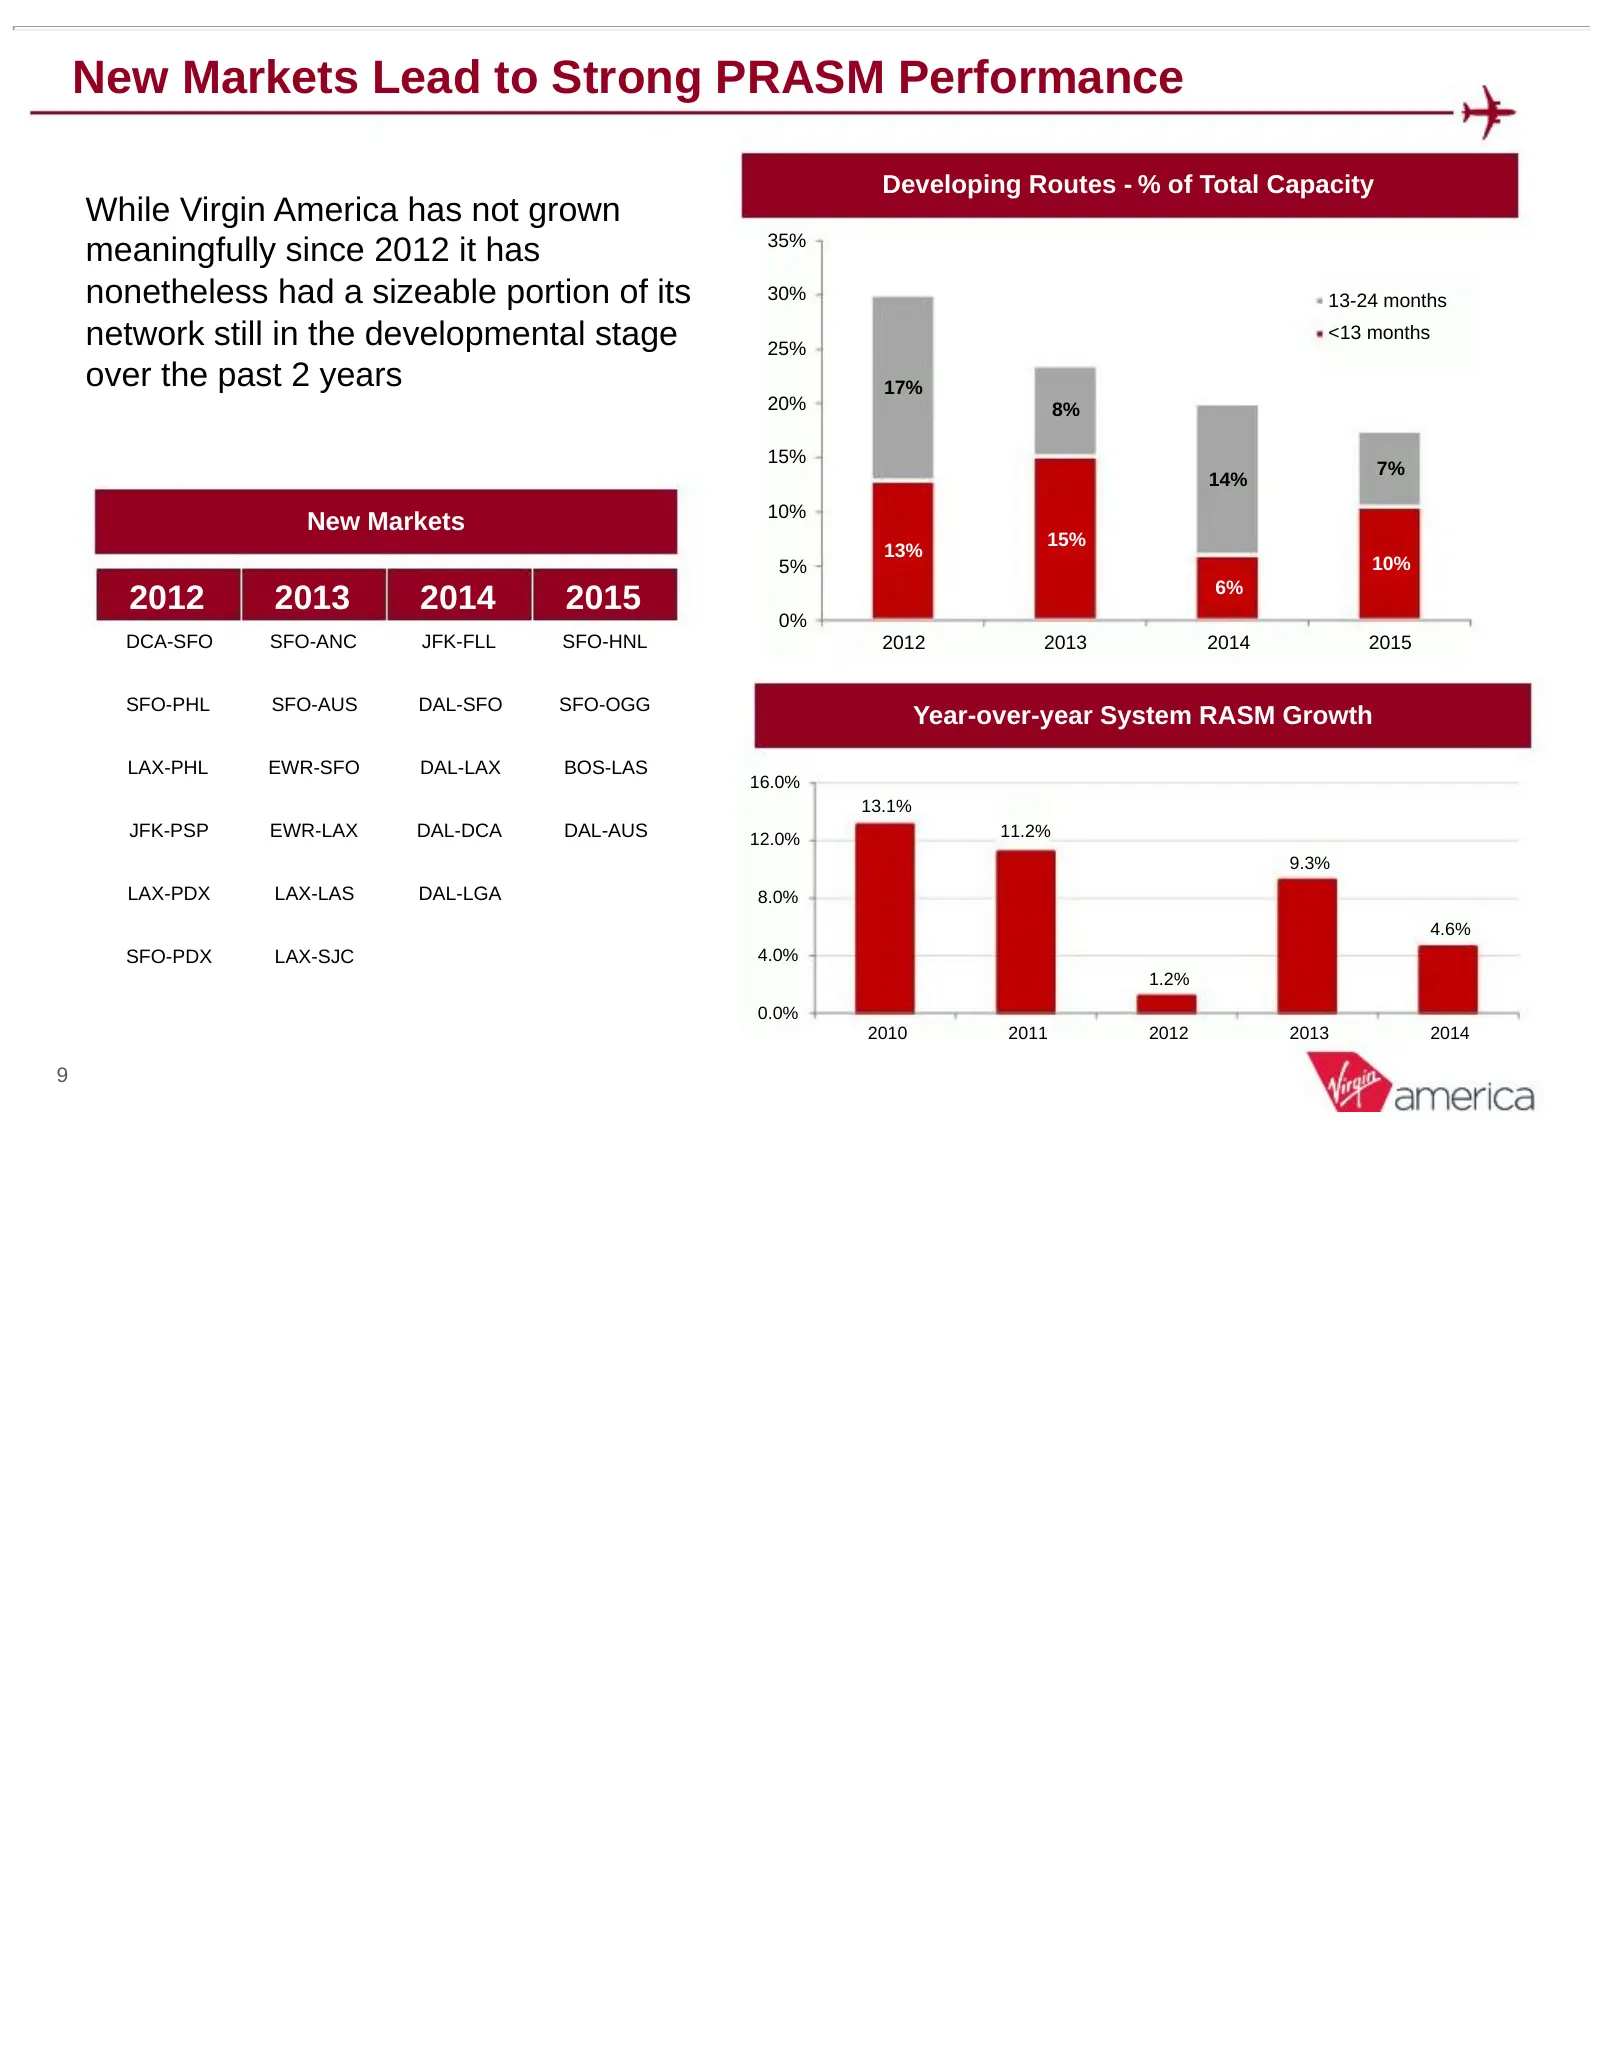
New Markets Lead to Strong PRASM Performance Developing Routes - % of Total Capacity While Virgin America has not grown 35% meaningfully since 2012 it has nonetheless had a sizeable portion of its 30% 13-24 months network still in the developmental stage 25% <13 months over the past 2 years 17% 20%
Slide 10: Accelerating Ancillary Revenue
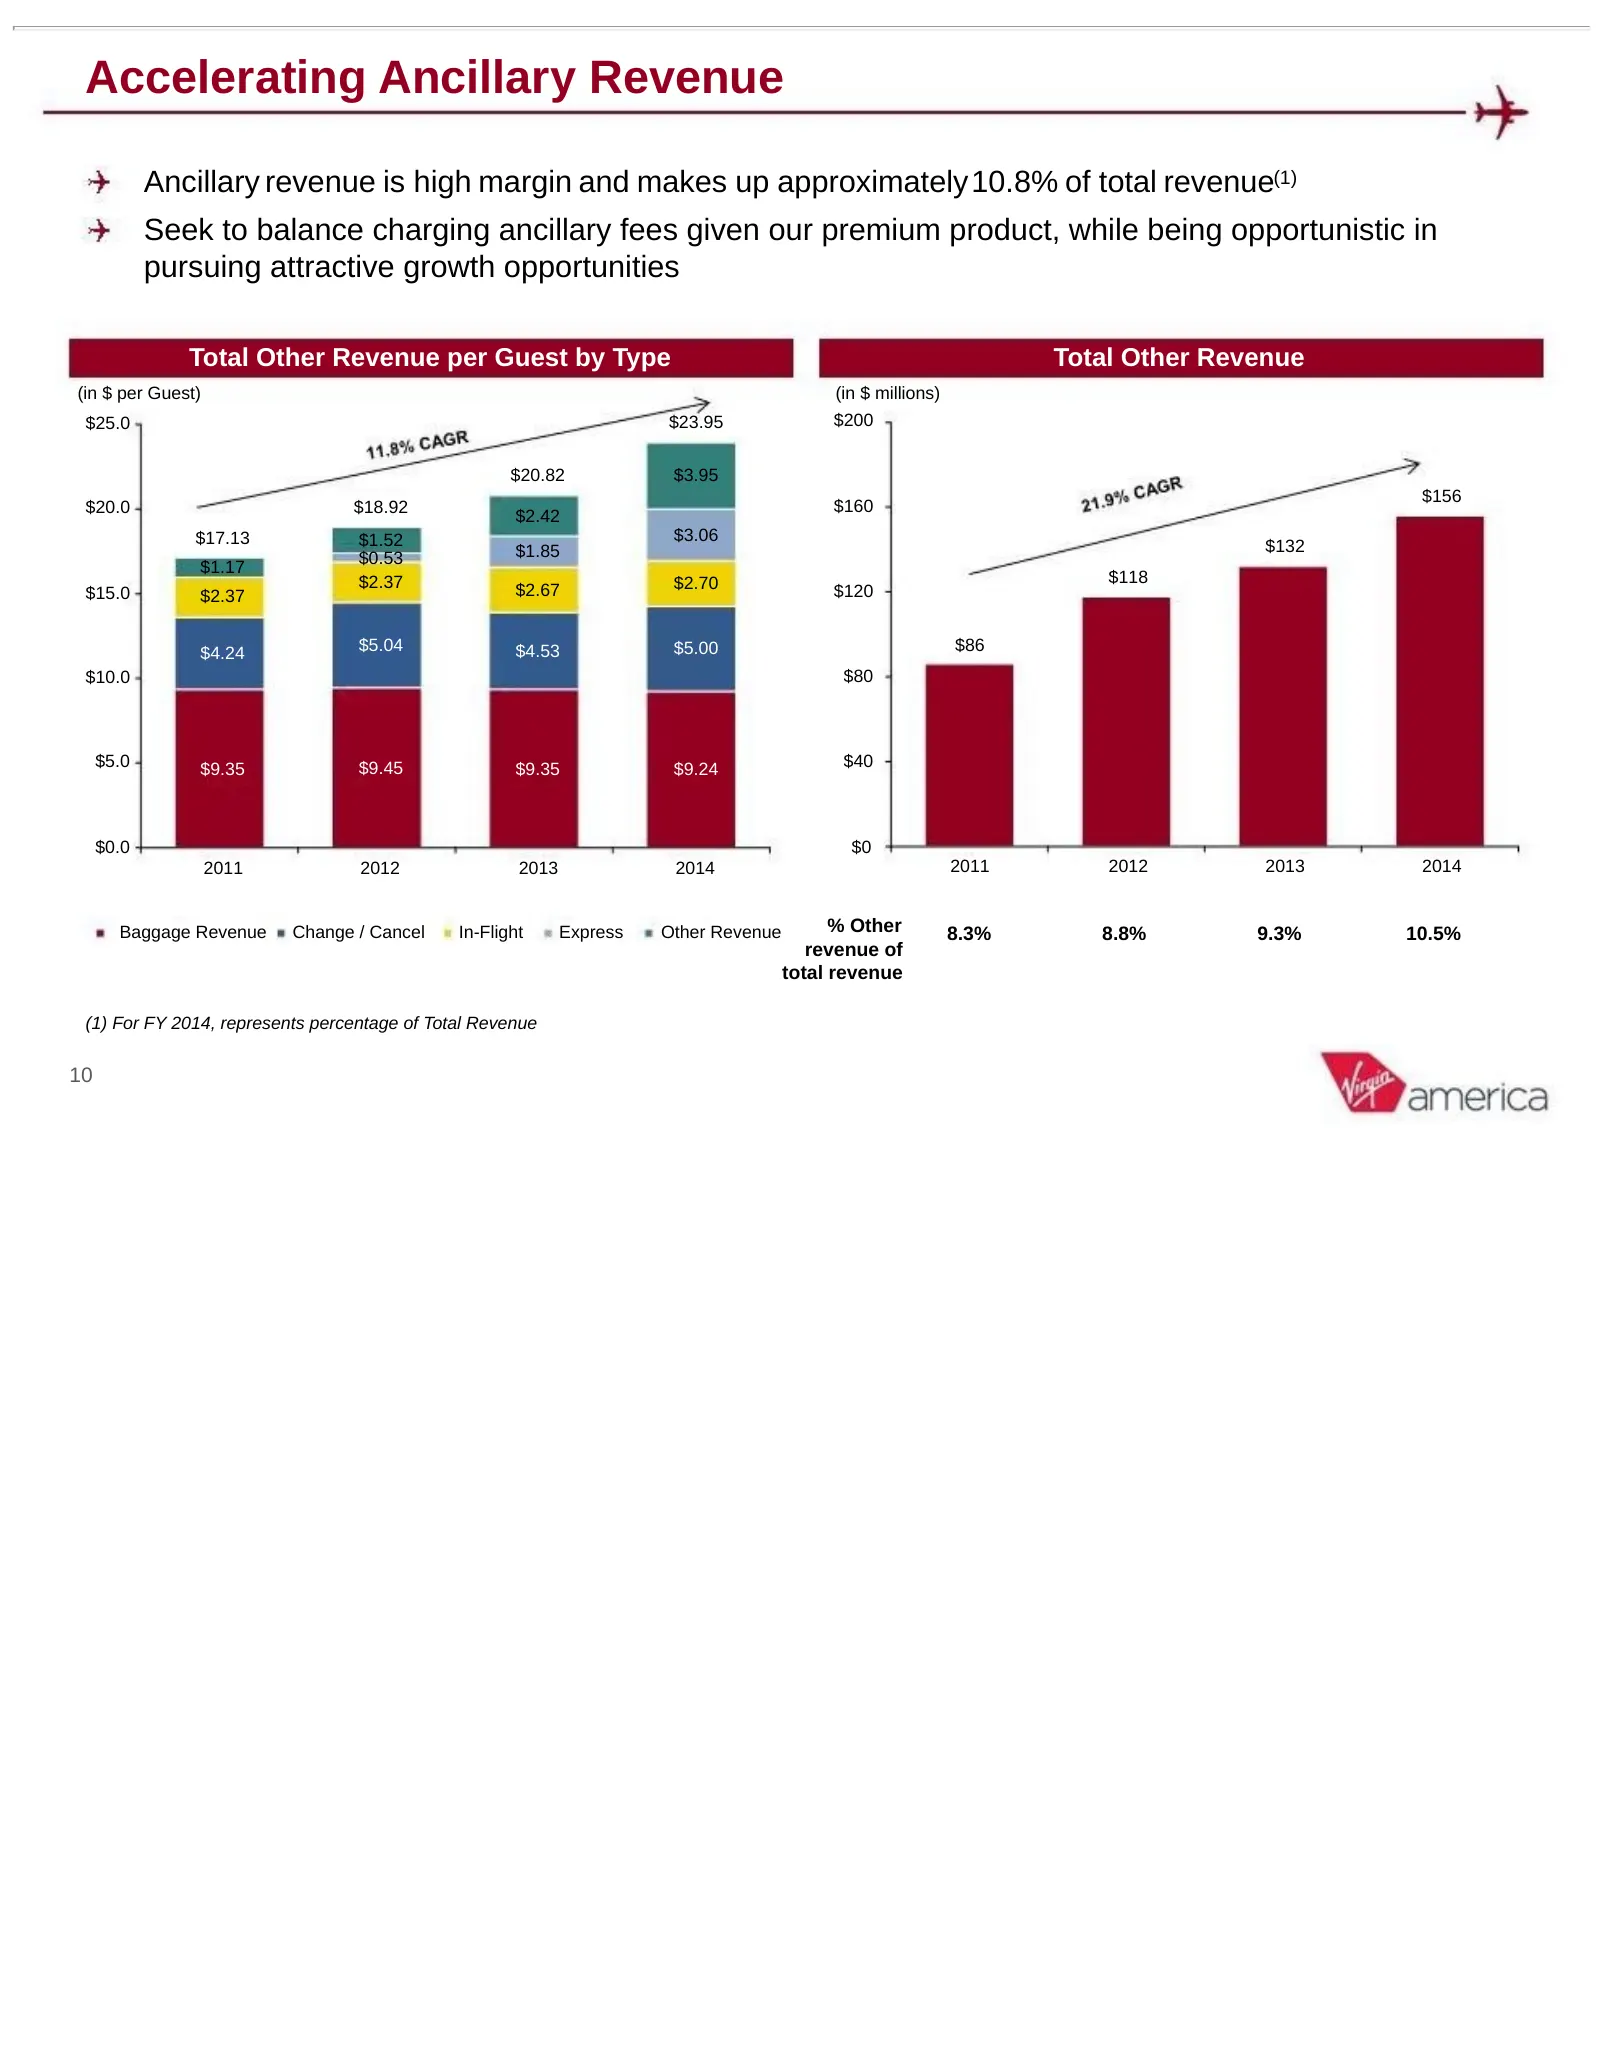
Accelerating Ancillary Revenue Ancillary revenue is high margin and makes up approximately10.8% of total revenue(1) Seek to balance charging ancillary fees given our premium product, while being opportunistic in pursuing attractive growth opportunities Total Other Revenue per Guest by Type Total Oth
Slide 11: Unit Costs Competitive with Other LCCs
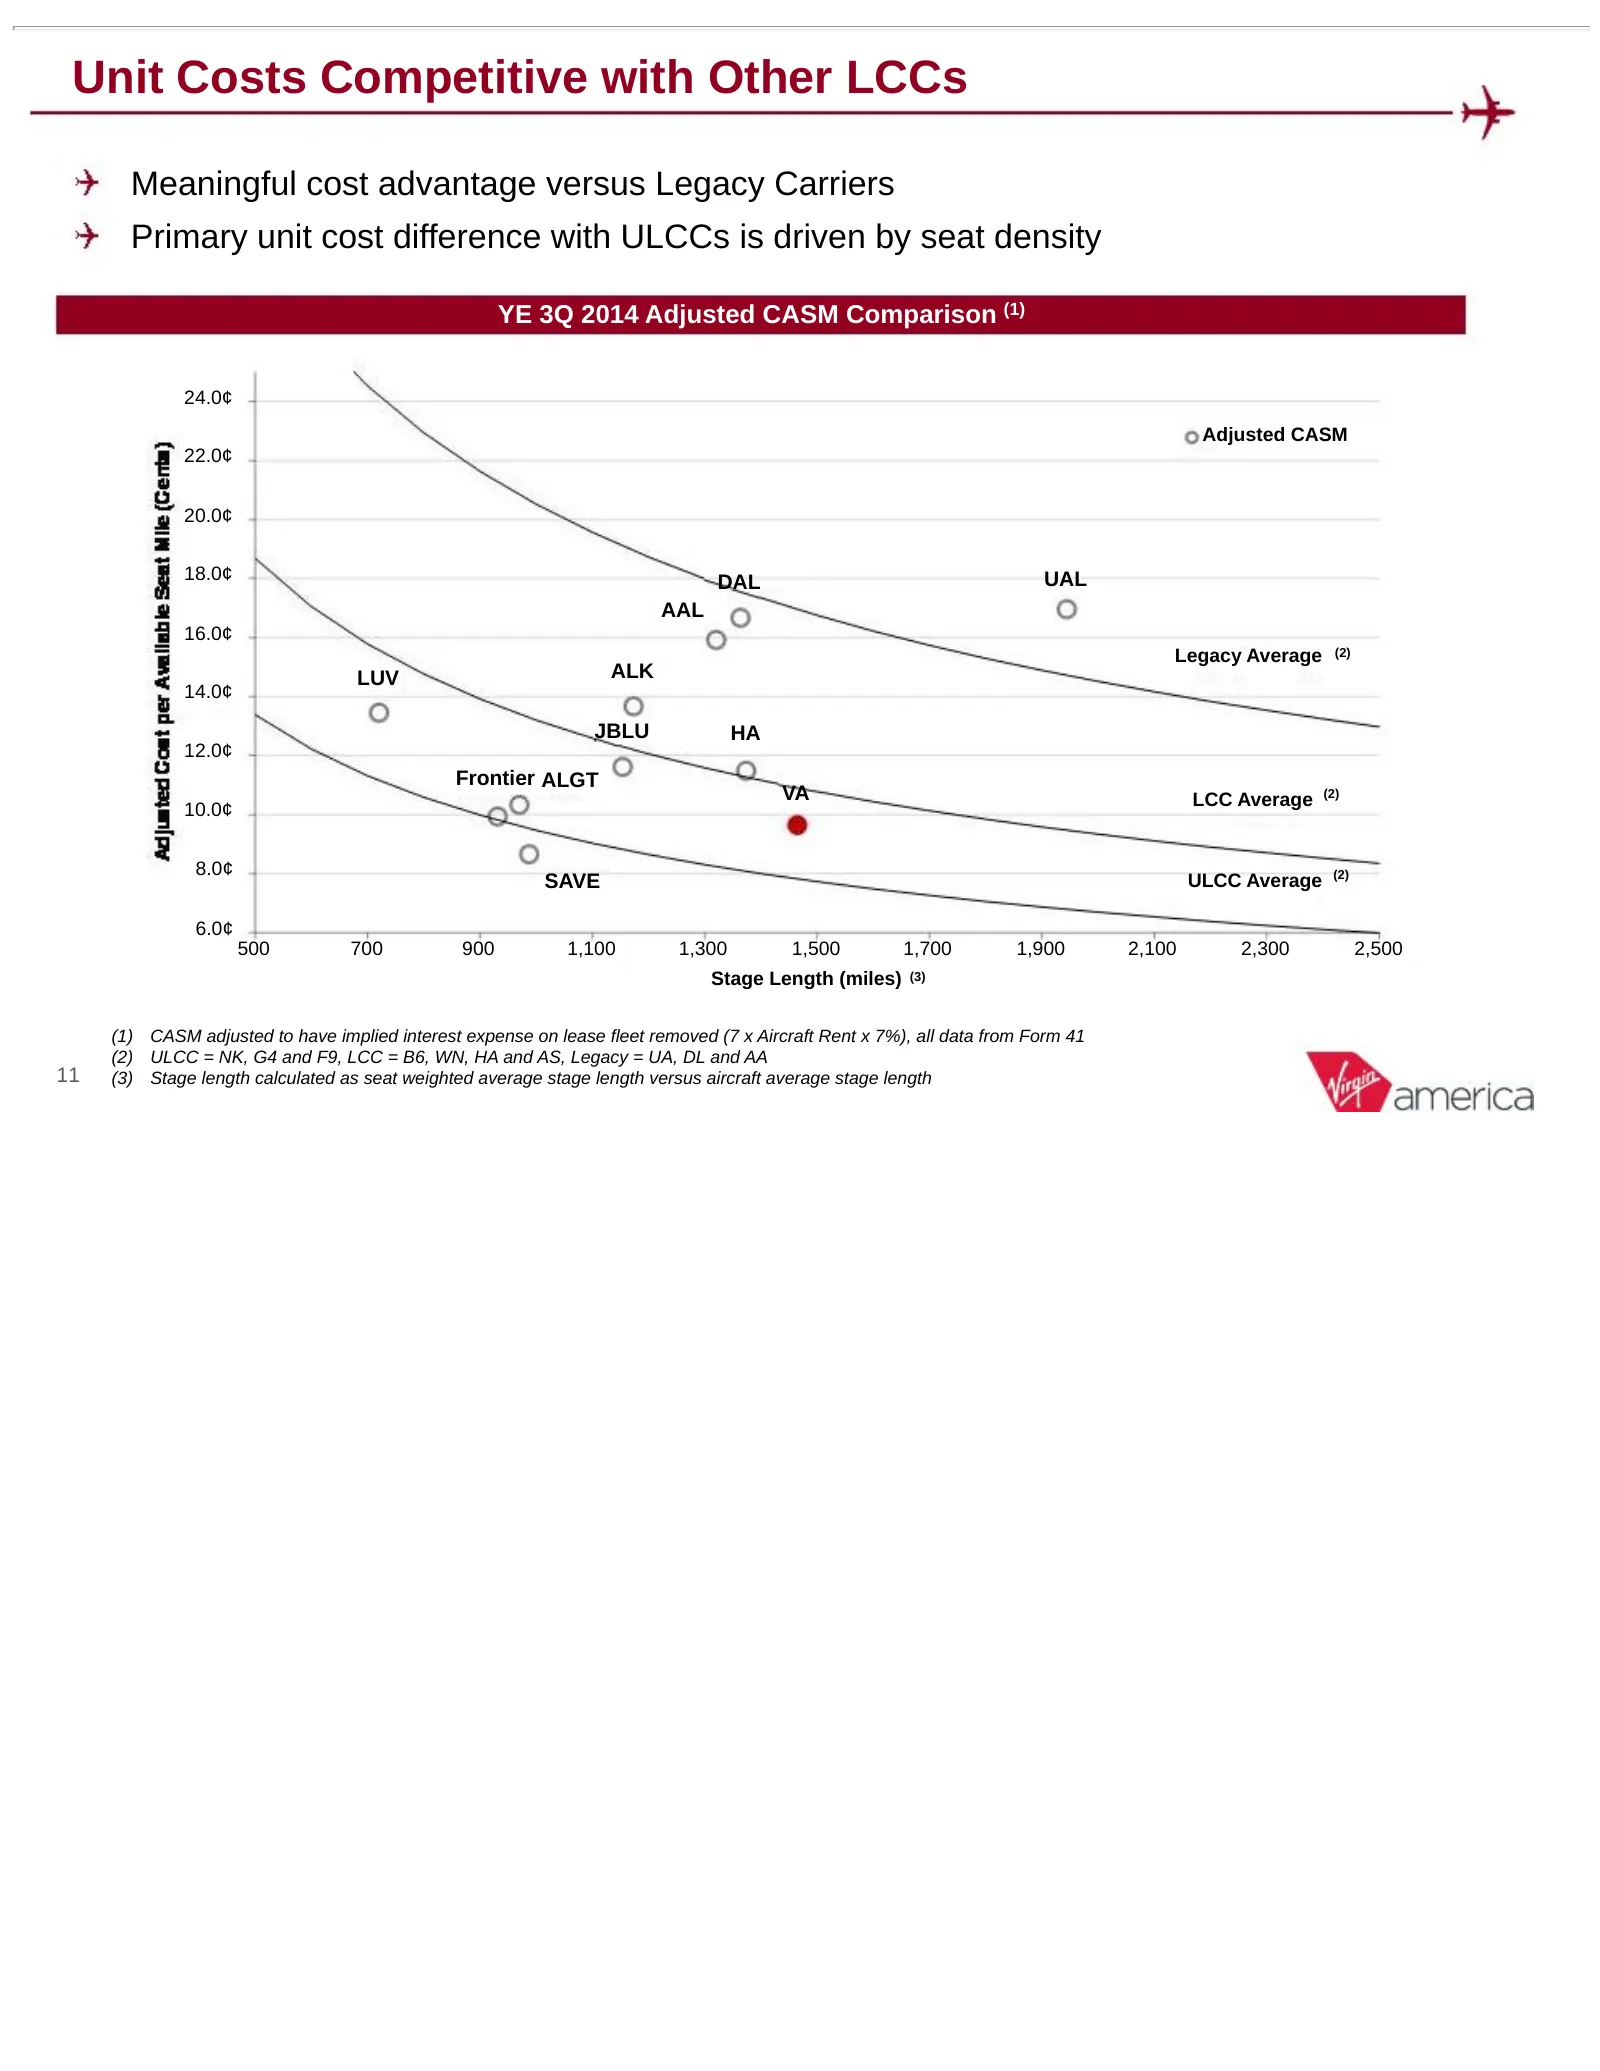
Unit Costs Competitive with Other LCCs Meaningful cost advantage versus Legacy Carriers Primary unit cost difference with ULCCs is driven by seat density YE 3Q 2014 Adjusted CASM Comparison (1) 24.0¢ Adjusted CASM 22.0¢ 20.0¢ 18.0¢ UAL DAL AAL 16.0¢ Legacy Average (2) LUV ALK 14.0¢ JBLU HA 12.0¢ Fro
Slide 12: Young Single Fleet Type and Point-to-Point Network Supports Low Costs
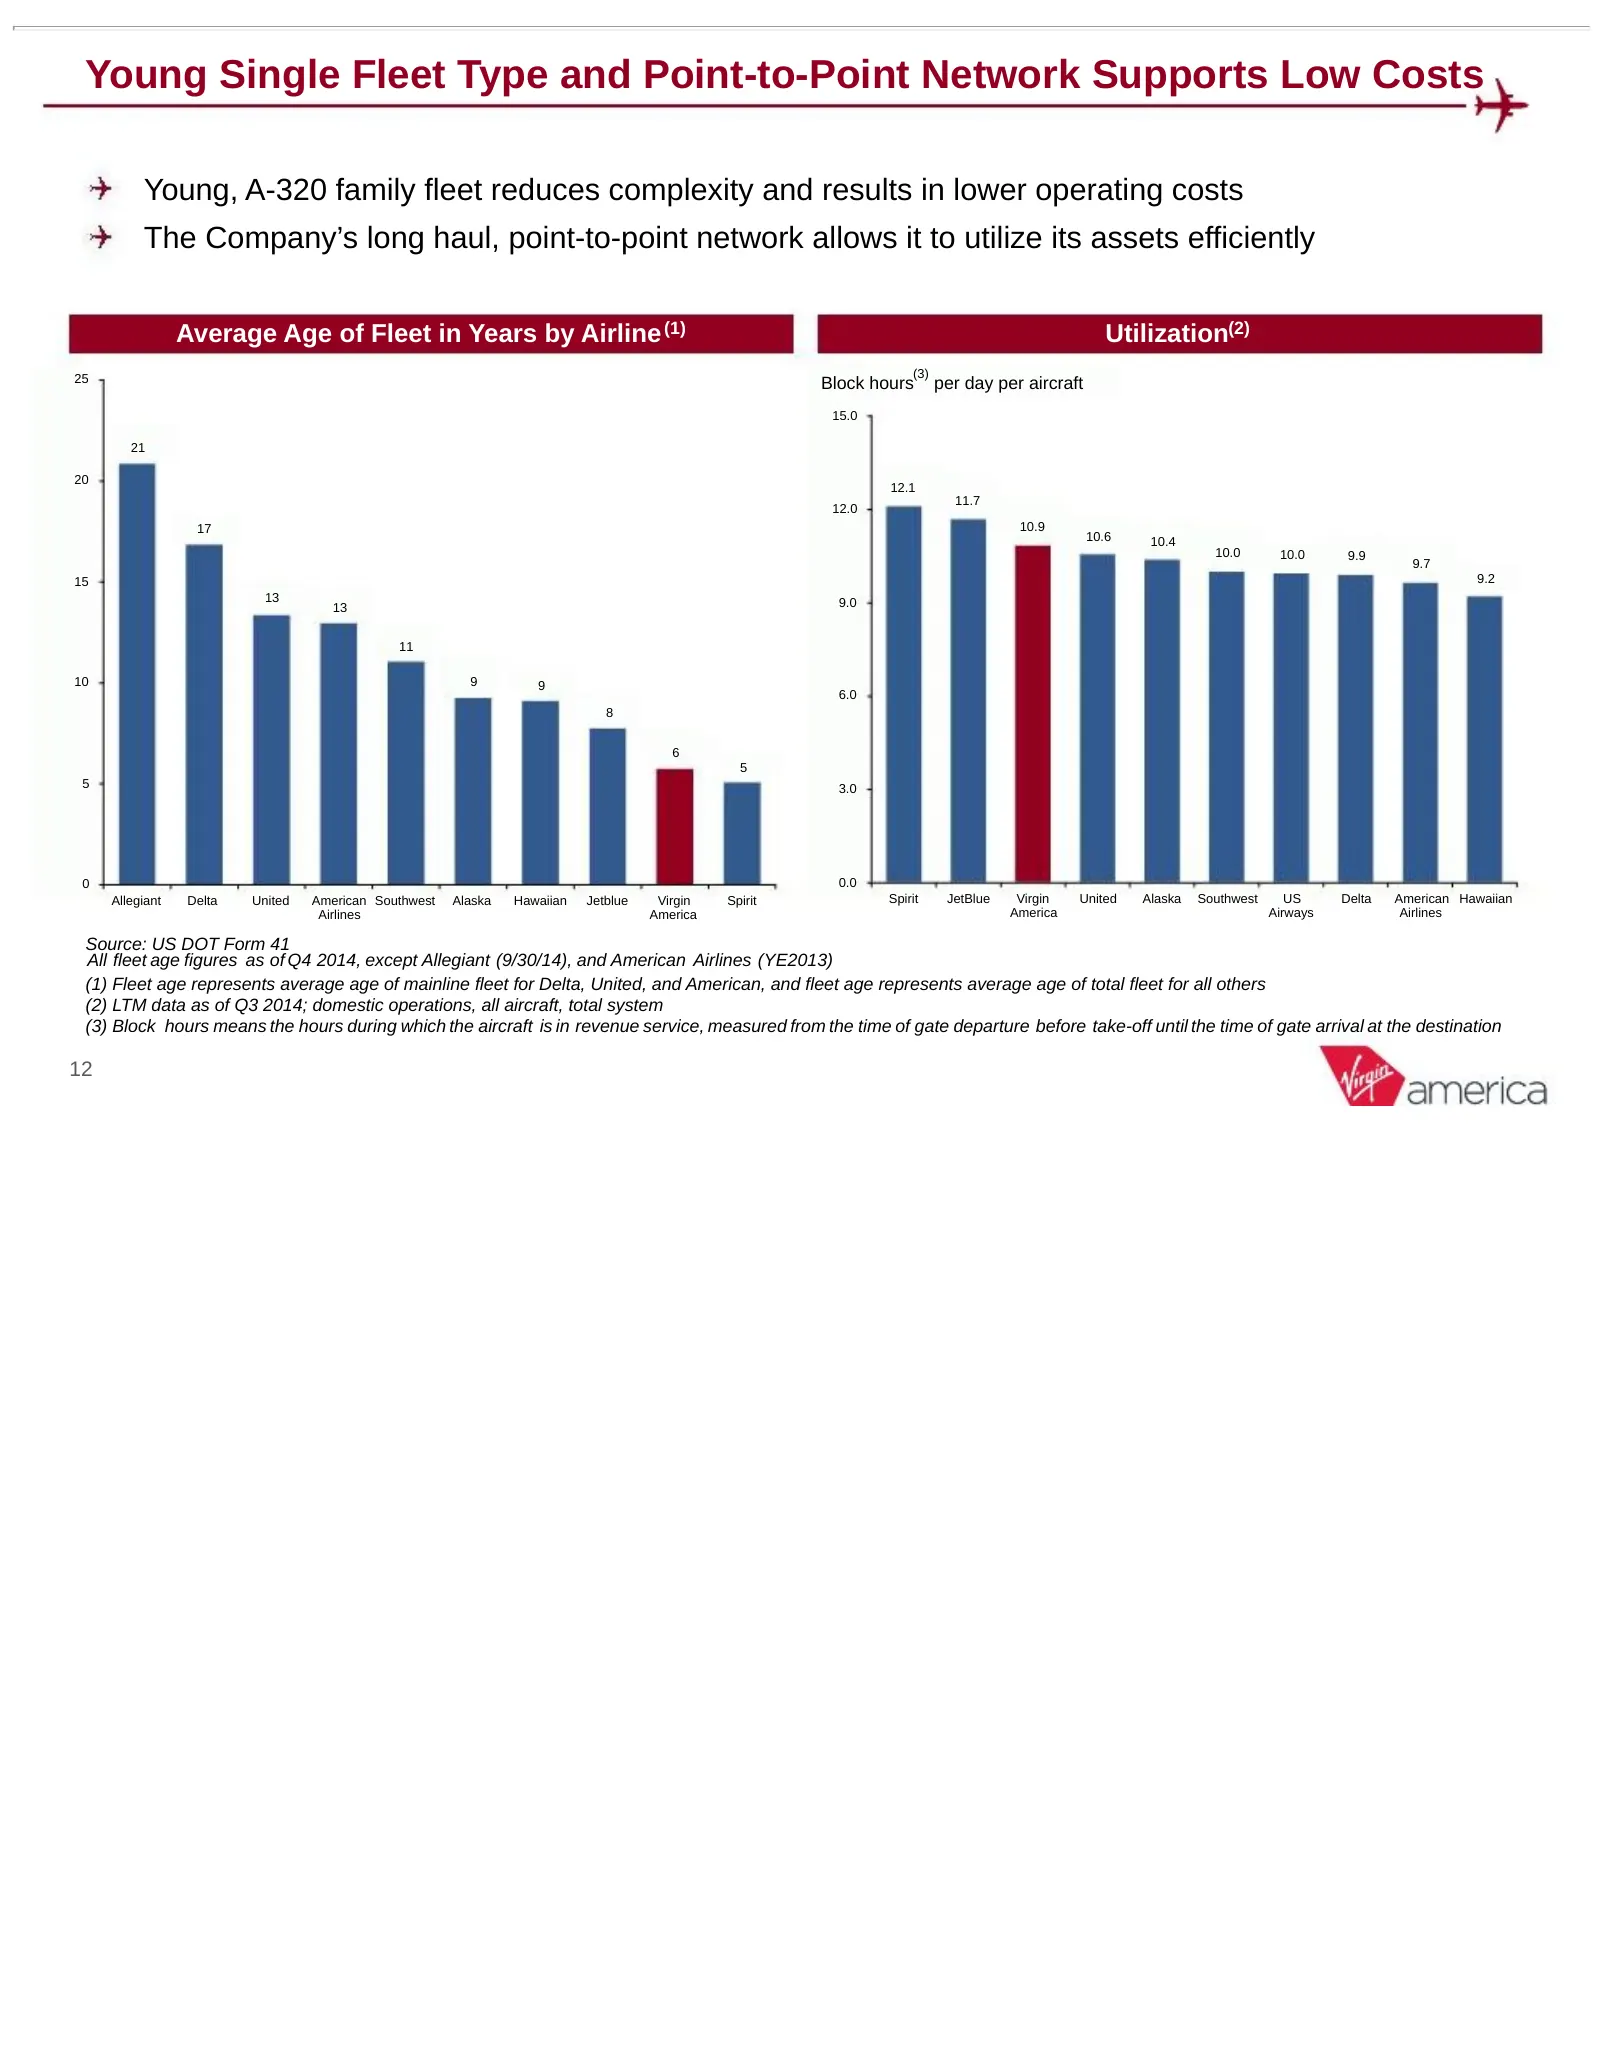
Young Single Fleet Type and Point-to-Point Network Supports Low Costs Young, A-320 family fleet reduces complexity and results in lower operating costs The Company’s long haul, point-to-point network allows it to utilize its assets efficiently Average Age of Fleet in Years by Airline (1) Utilization
Slide 13: High Labor Productivity
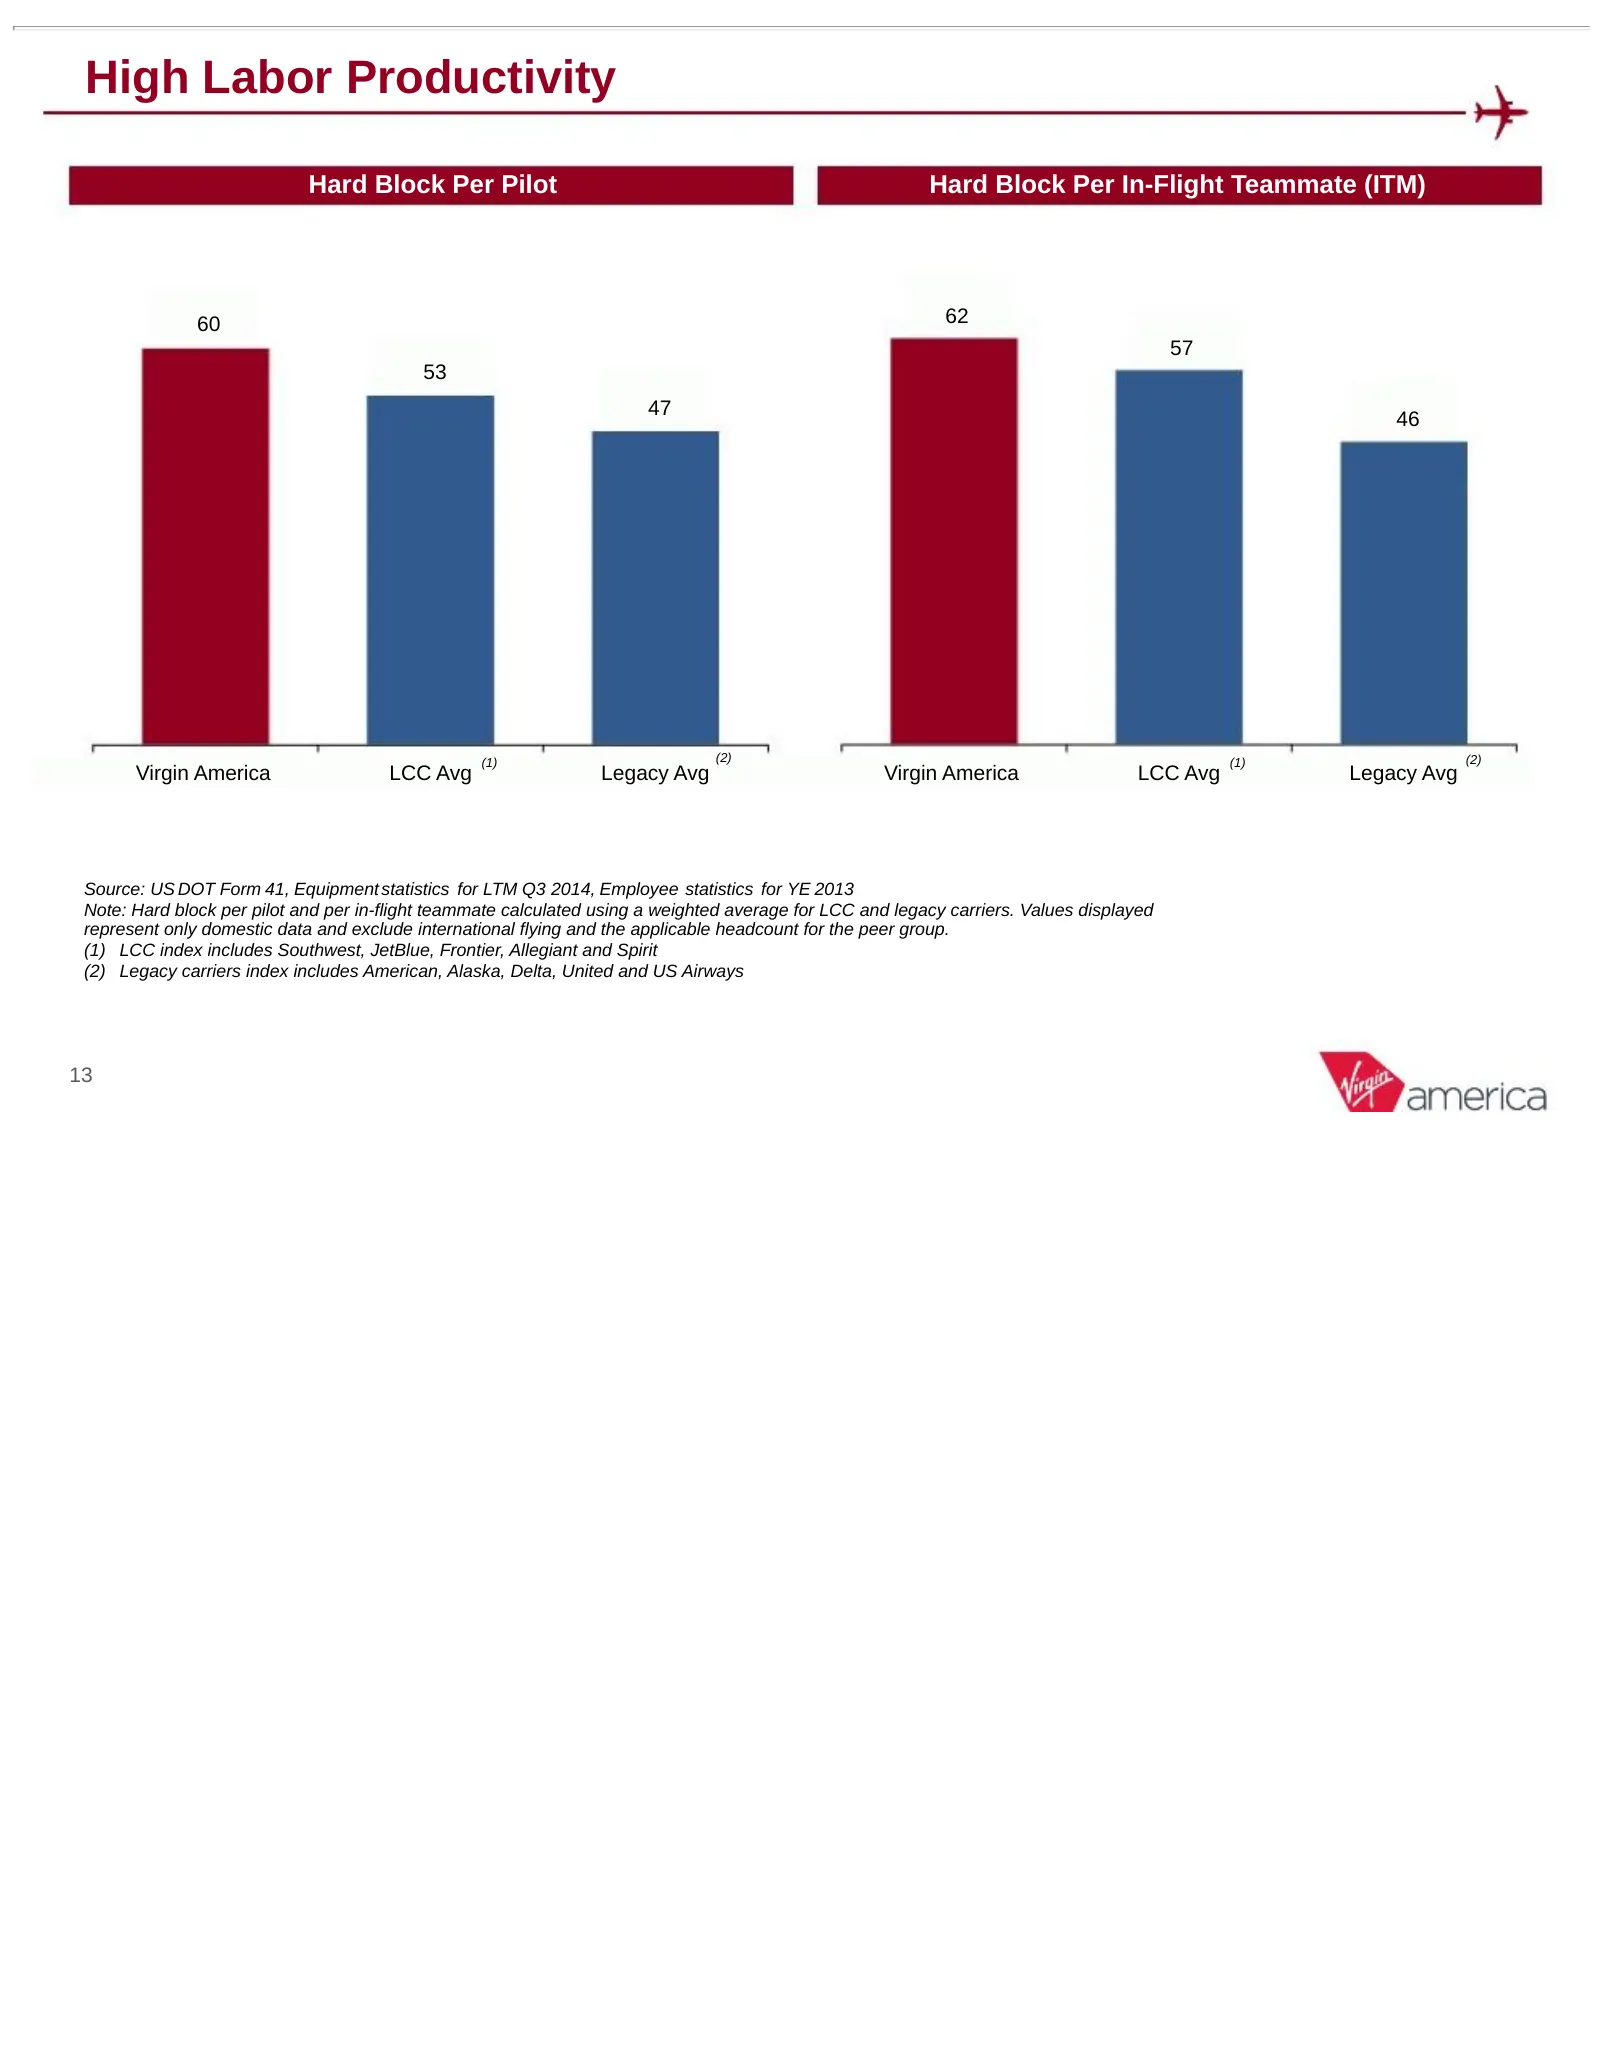
High Labor Productivity Hard Block Per Pilot Hard Block Per In-Flight Teammate (ITM) 60 62 57 53 47 46 (1) (2) (1) (2) Virgin America LCC Avg Legacy Avg Virgin America LCC Avg Legacy Avg Source: US DOT Form 41, Equipment statistics for LTM Q3 2014, Employee statistics for YE 2013 Note: Hard block pe
Slide 14: Outsourcing Provides Lower Costs and Increased Flexibility
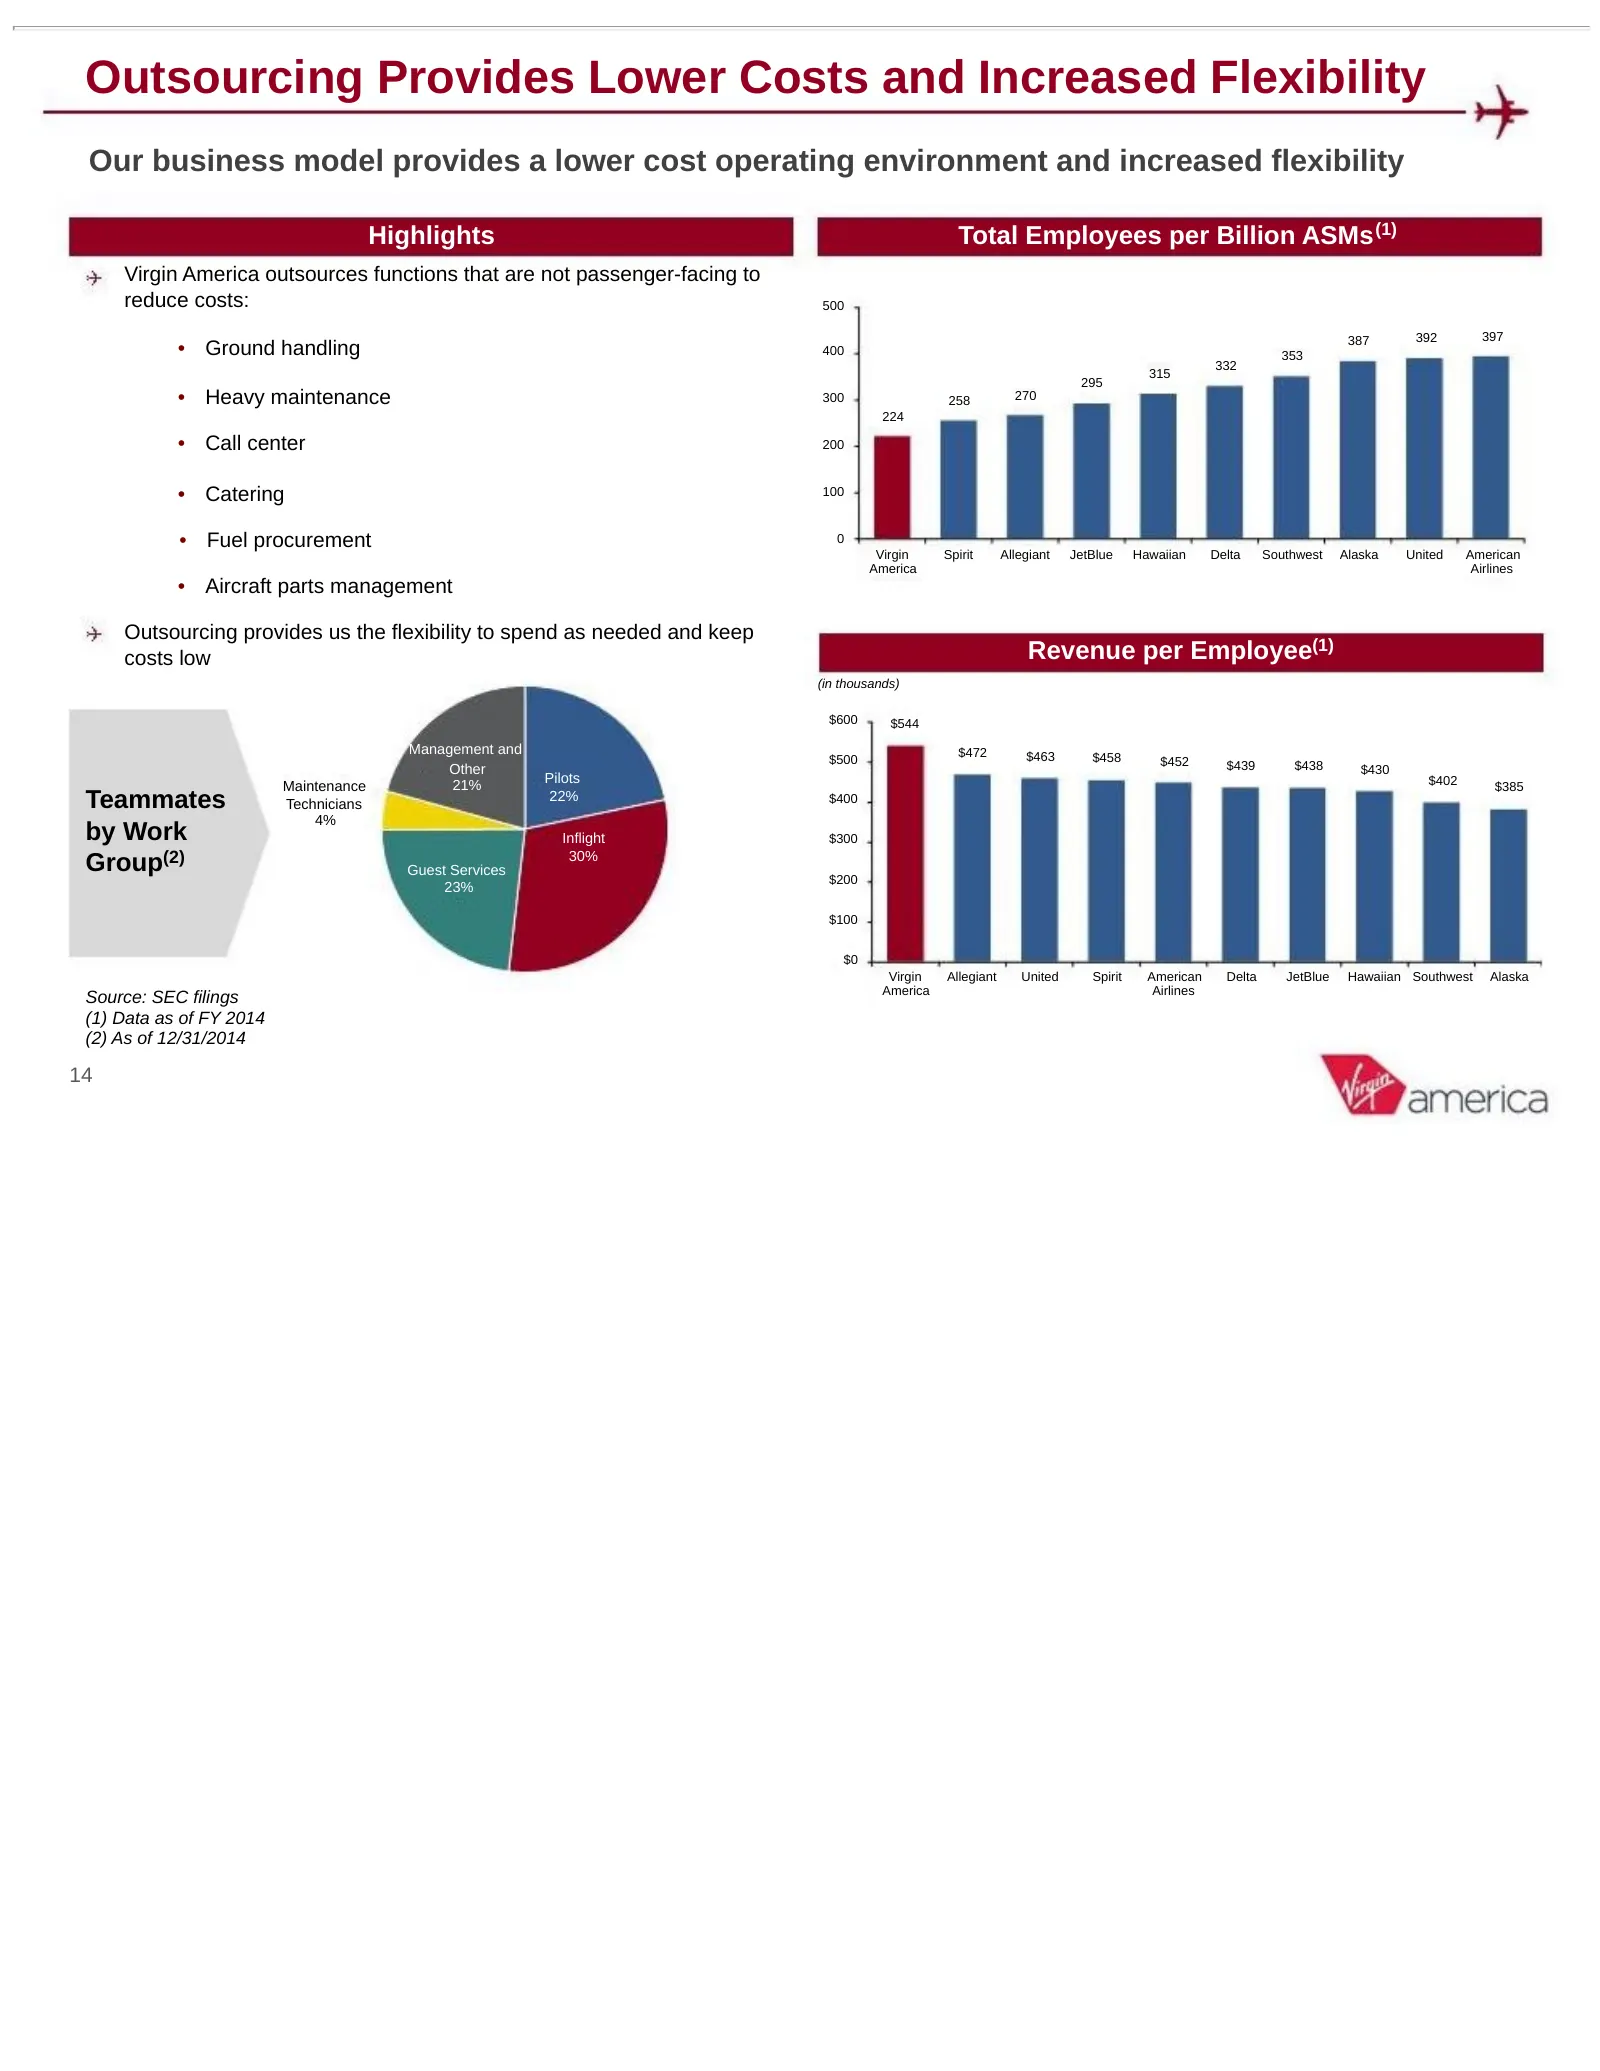
Outsourcing Provides Lower Costs and Increased Flexibility Our business model provides a lower cost operating environment and increased flexibility Highlights Total Employees per Billion ASMs (1) Virgin America outsources functions that are not passenger-facing to reduce costs: 500 387 392 397 • Gro
Slide 15: Disciplined Approach to Planning and Investing in Growth
Disciplined Approach to Planning and Investing in Growth Growth in existing markets undertaken when margins and load factors are high and VA does not have a dominant position (avoid cannibalization) Identify new markets where our product competes effectively • Large markets • Generally, fragmented c
Slide 16: DAL Growth Diversifies our Network
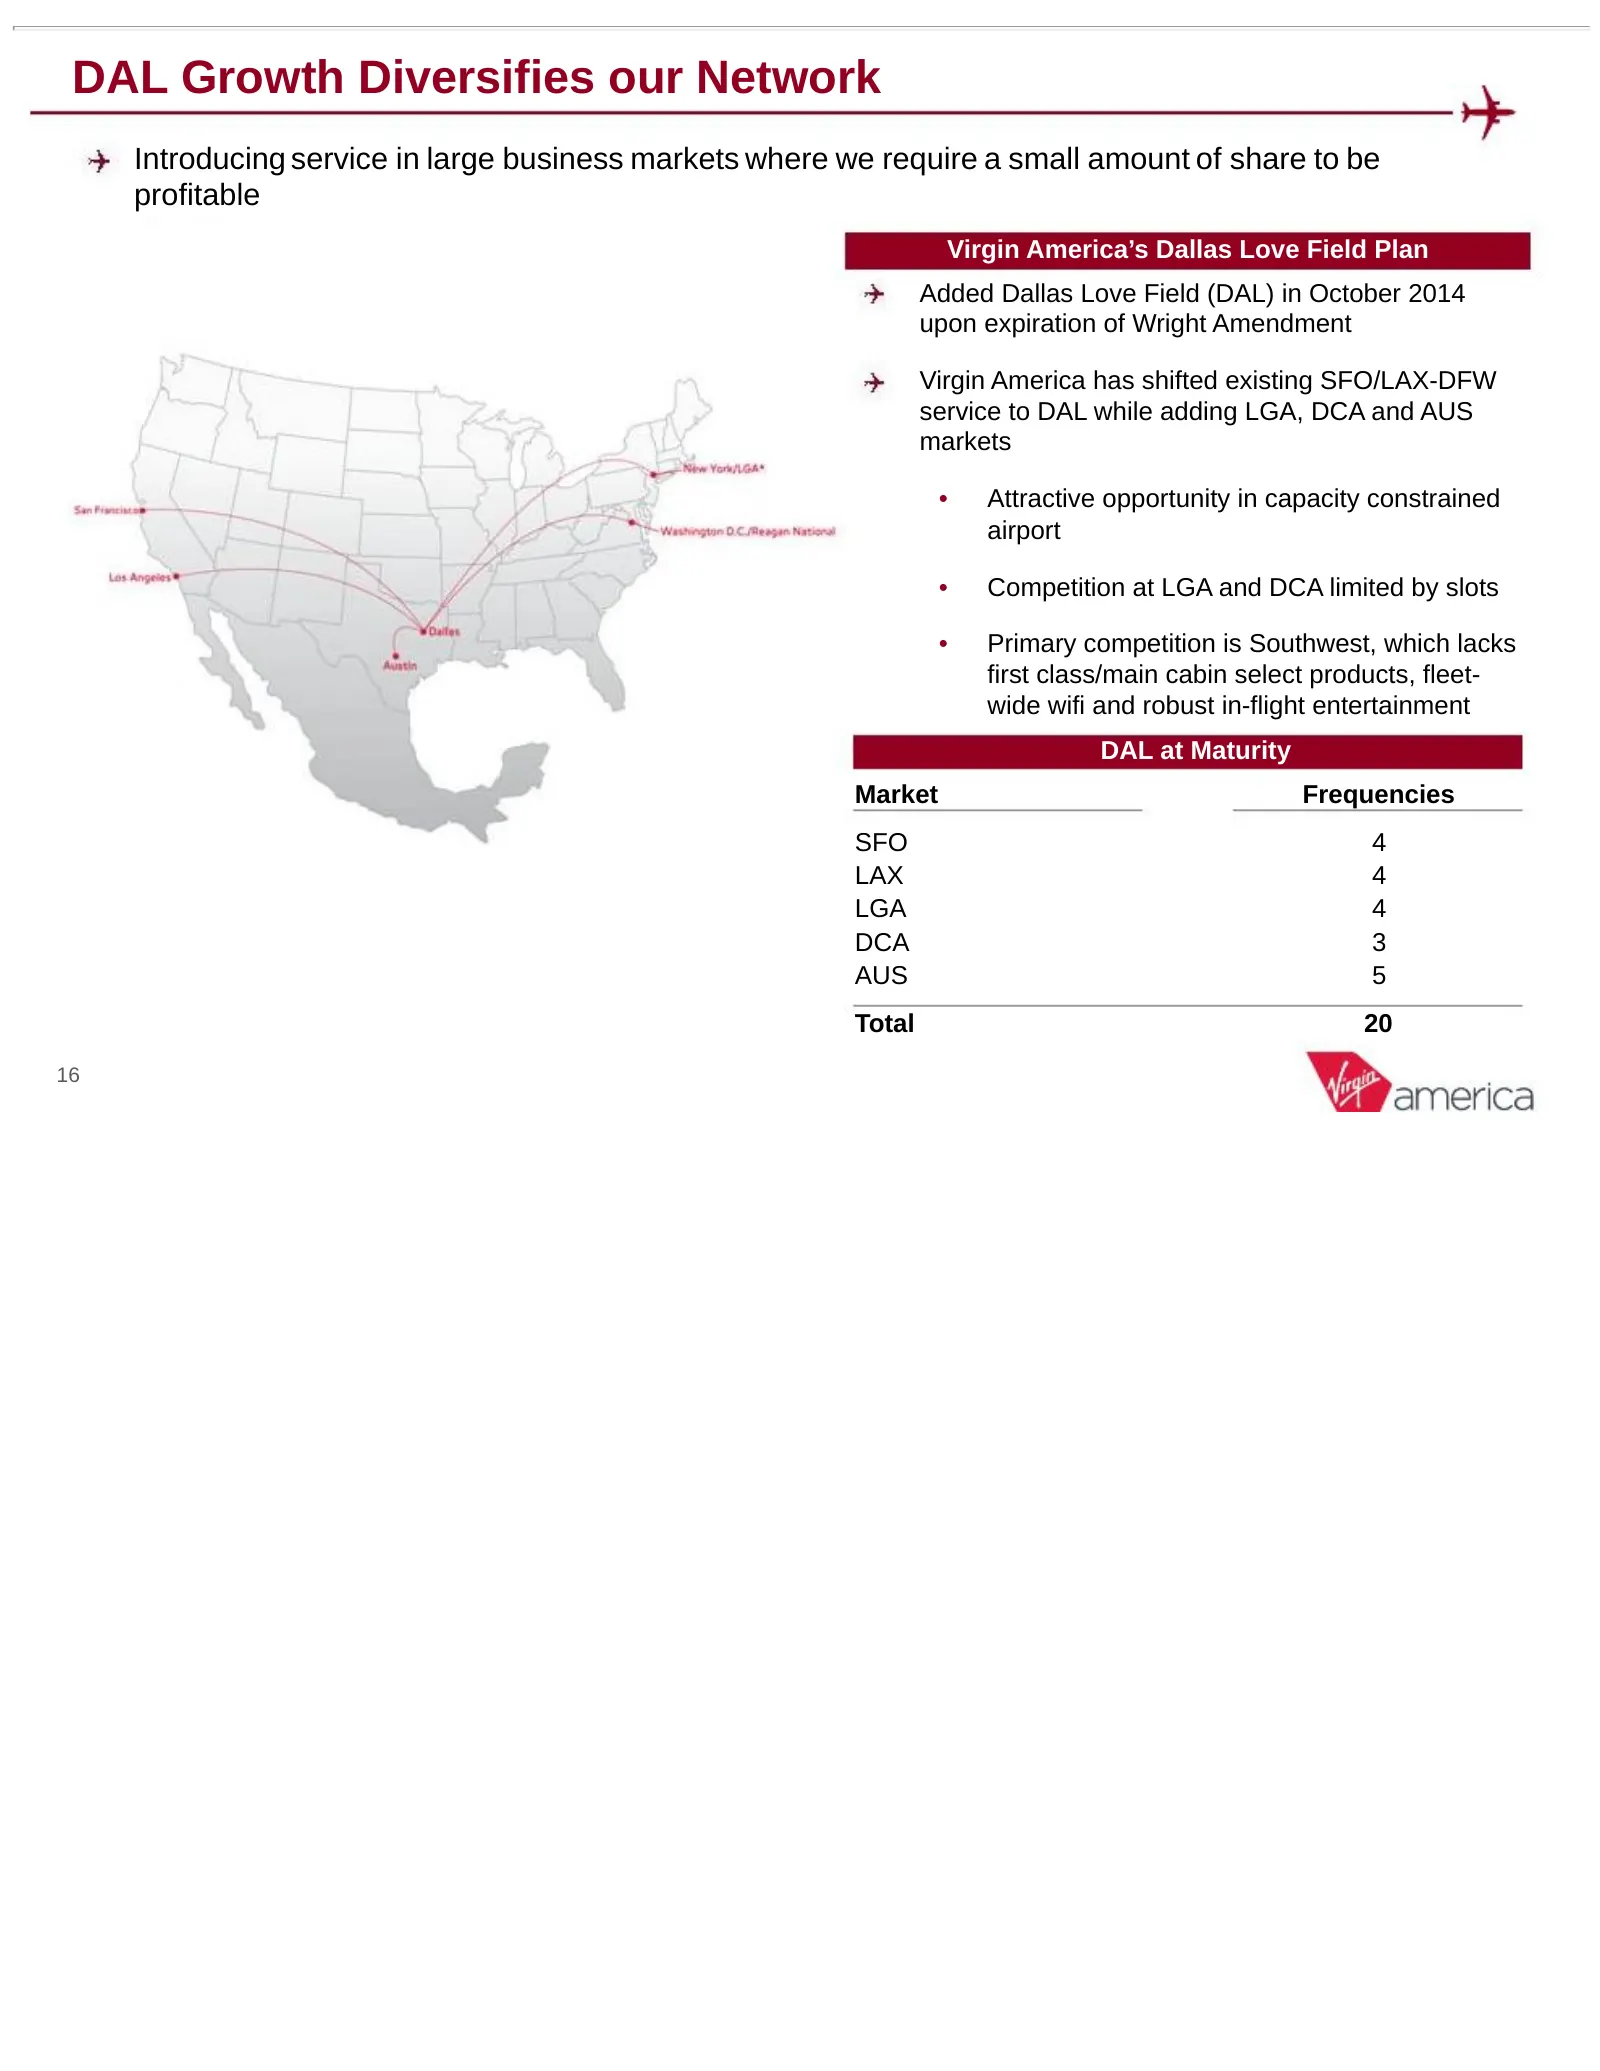
DAL Growth Diversifies our Network Introducing service in large business markets where we require a small amount of share to be profitable Virgin America’s Dallas Love Field Plan Added Dallas Love Field (DAL) in October 2014 upon expiration of Wright Amendment Virgin America has shifted existing SFO
Slide 17: Growth Opportunities in SFO and LAX
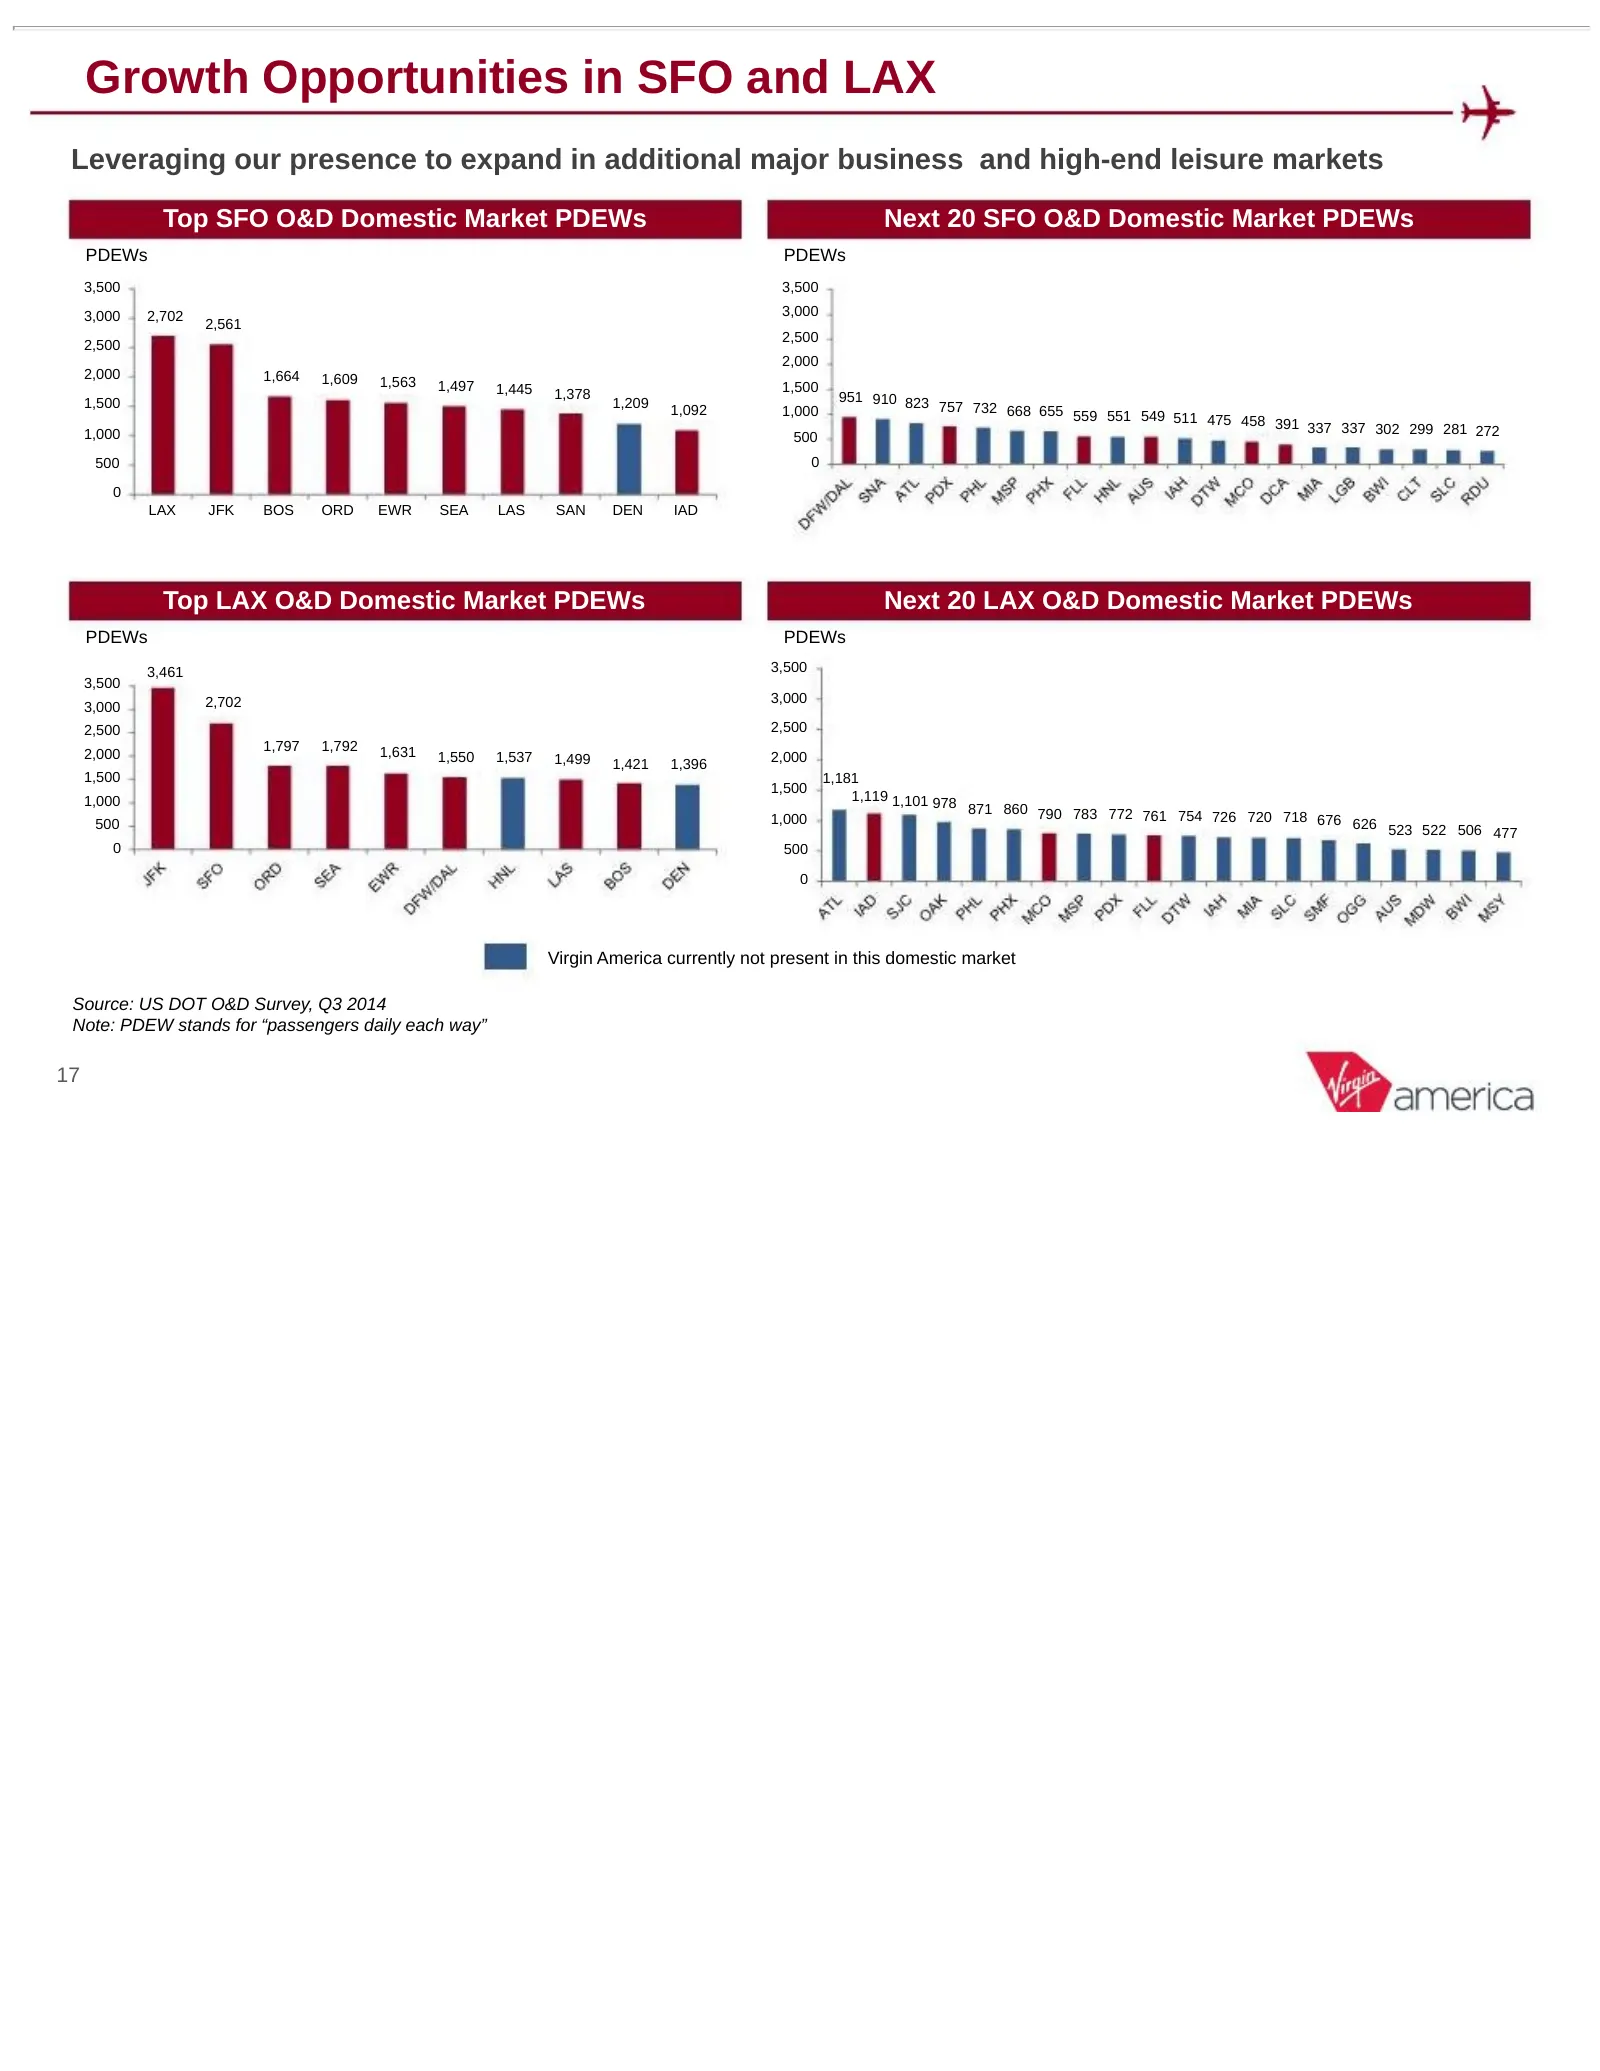
Growth Opportunities in SFO and LAX Leveraging our presence to expand in additional major business and high-end leisure markets Top SFO O&D Domestic Market PDEWs Next 20 SFO O&D Domestic Market PDEWs PDEWs PDEWs 3,500 3,500 3,000 2,702 3,000 2,561 2,500 2,500 2,000 2,000 1,664 1,609 1,563 1,497 1,44
Slide 18: Hawaii – An Attractive Opportunity for California and Beyond
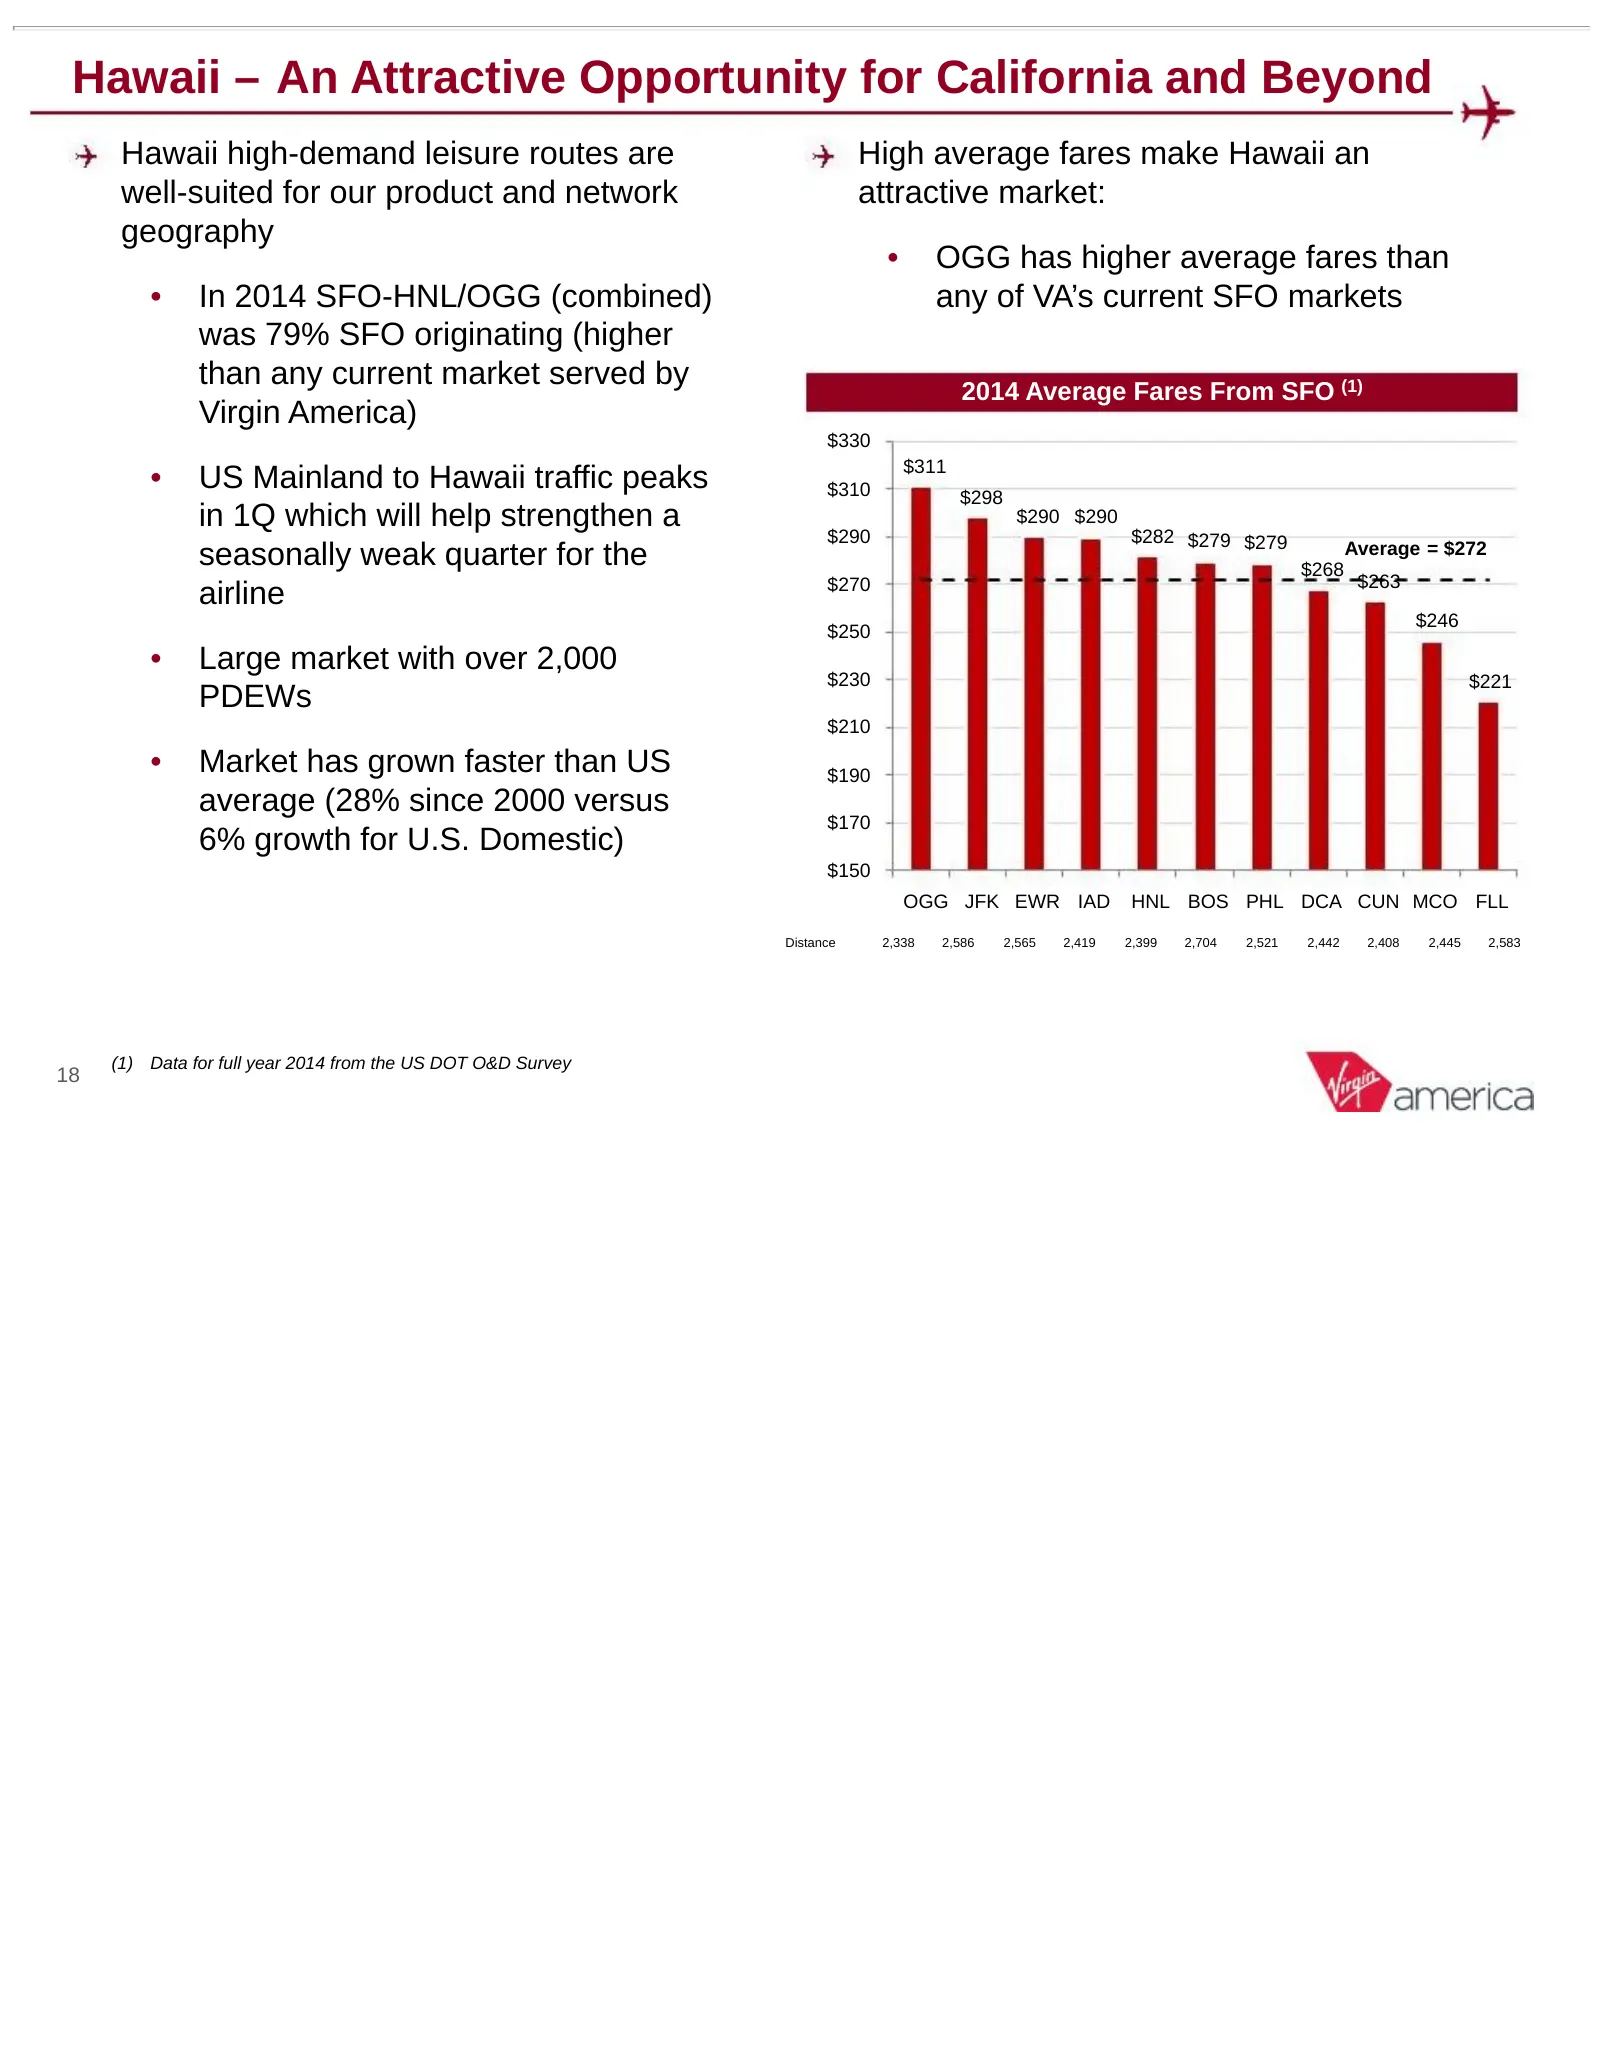
Hawaii – An Attractive Opportunity for California and Beyond Hawaii high-demand leisure routes are High average fares make Hawaii an well-suited for our product and network attractive market: geography • OGG has higher average fares than • In 2014 SFO-HNL/OGG (combined) any of VA’s current SFO marke
Slide 19: Intra-California Markets Represent Untapped Potential
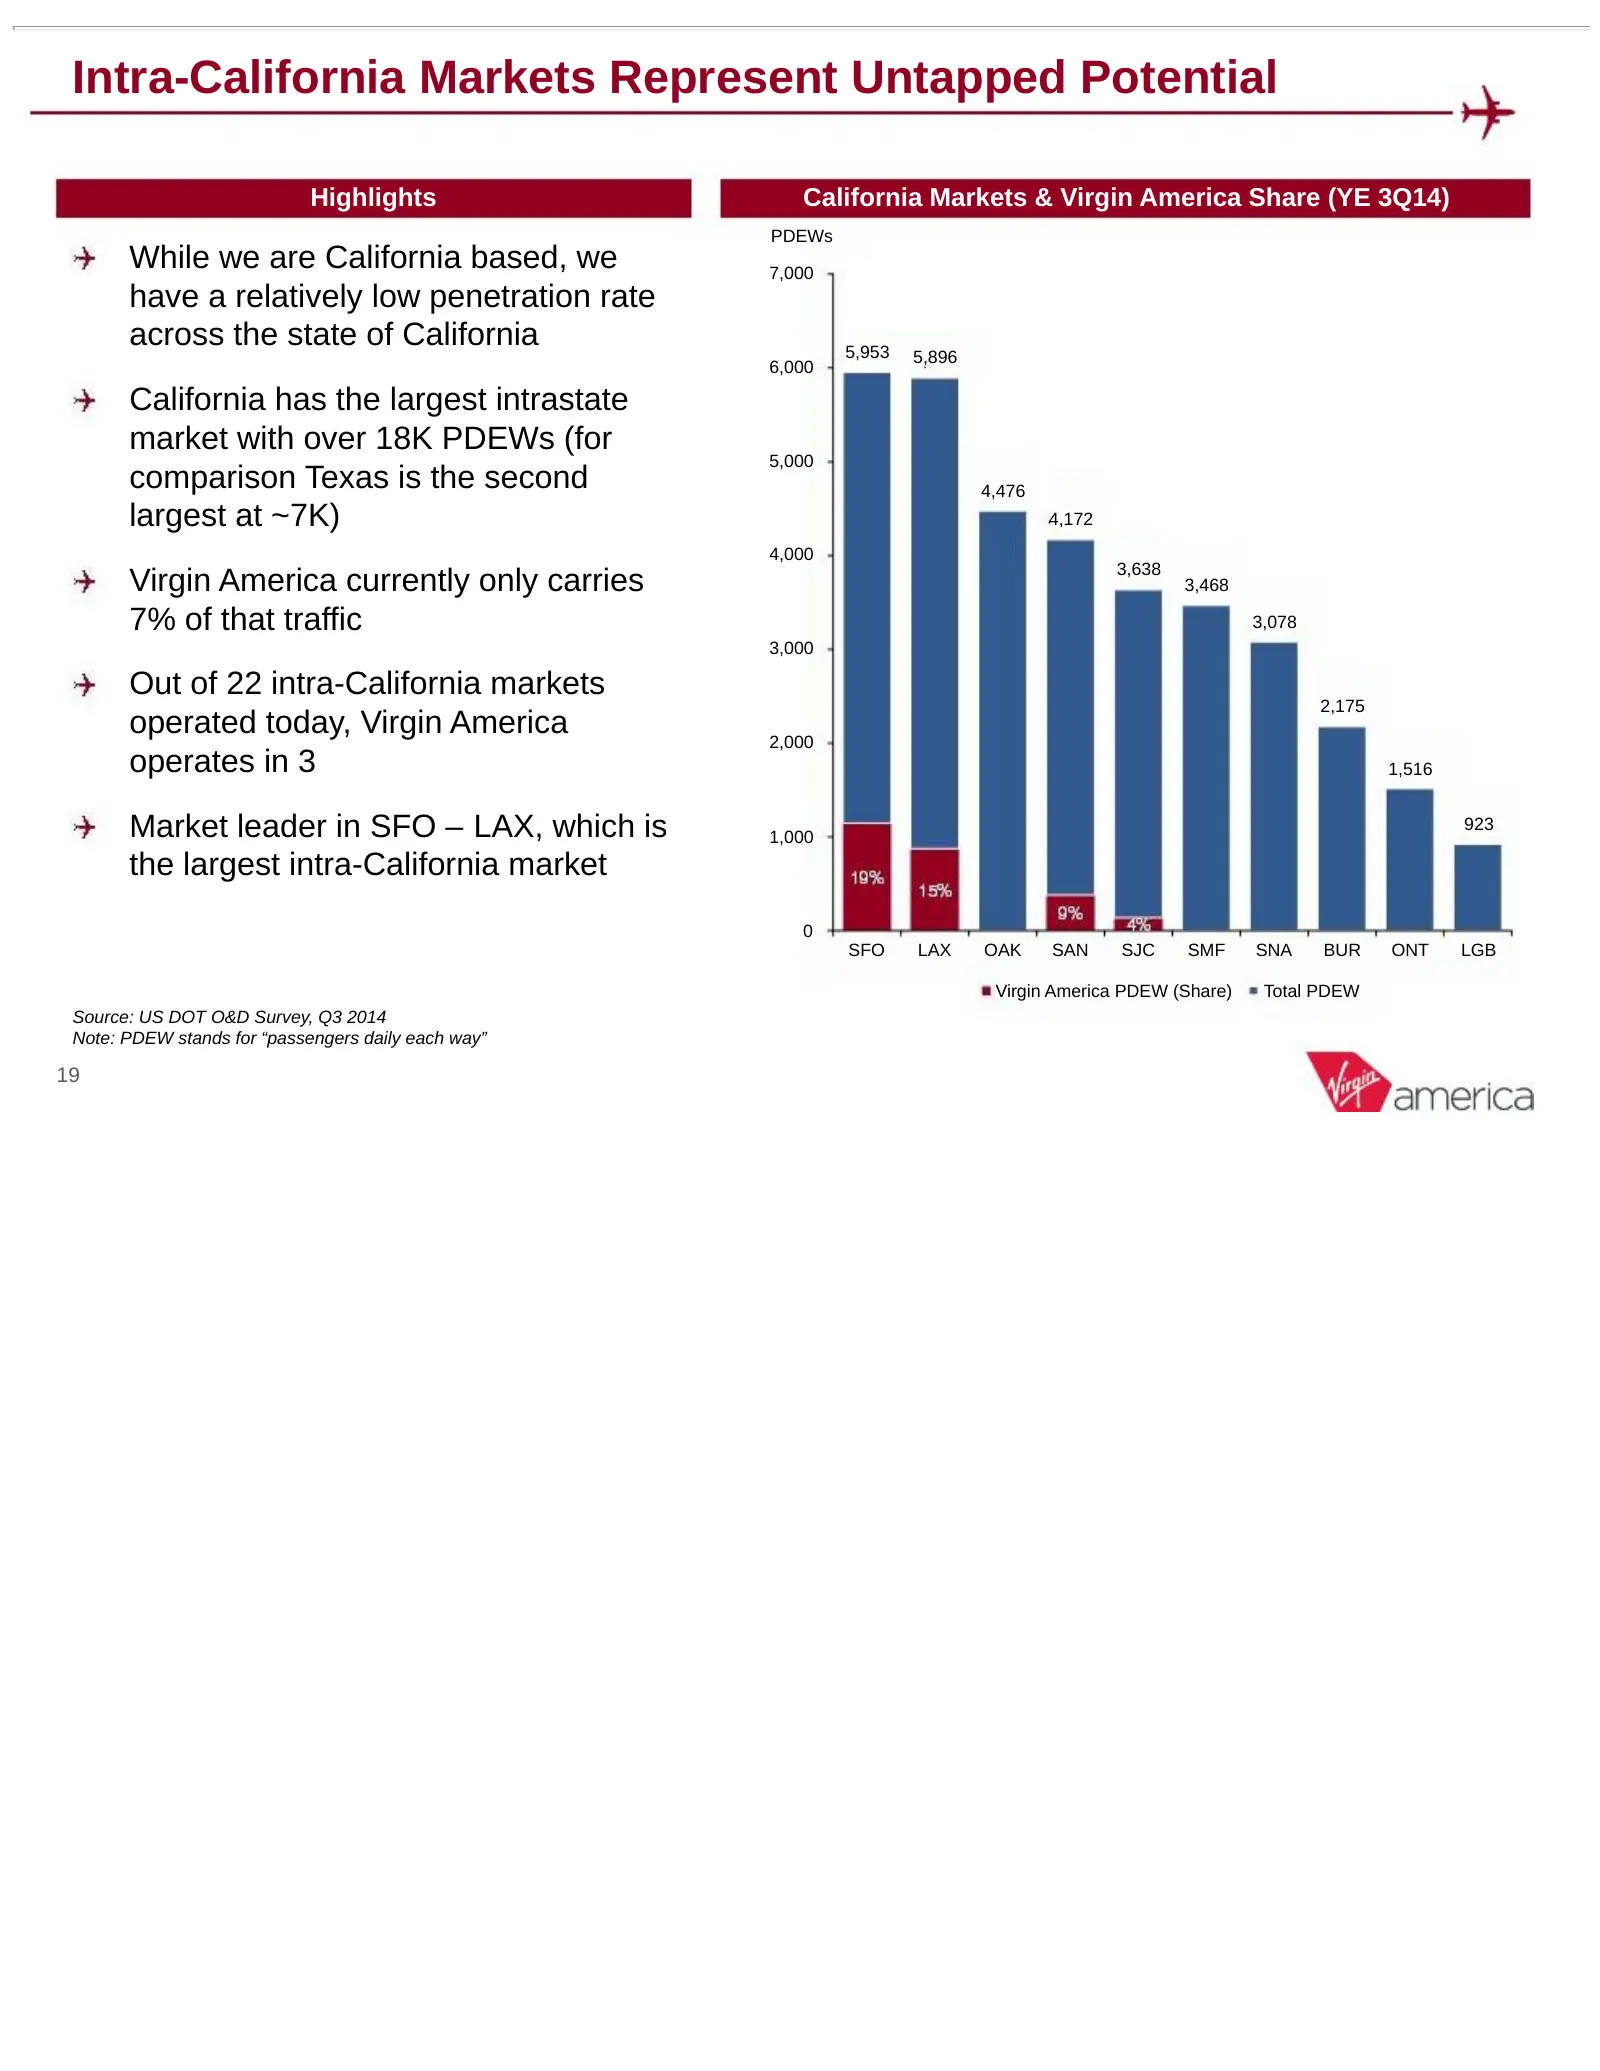
Intra-California Markets Represent Untapped Potential Highlights California Markets & Virgin America Share (YE 3Q14) PDEWs While we are California based, we 7,000 have a relatively low penetration rate across the state of California 5,953 5,896 6,000 California has the largest intrastate market with
Slide 20: Strong Momentum in Financial Performance
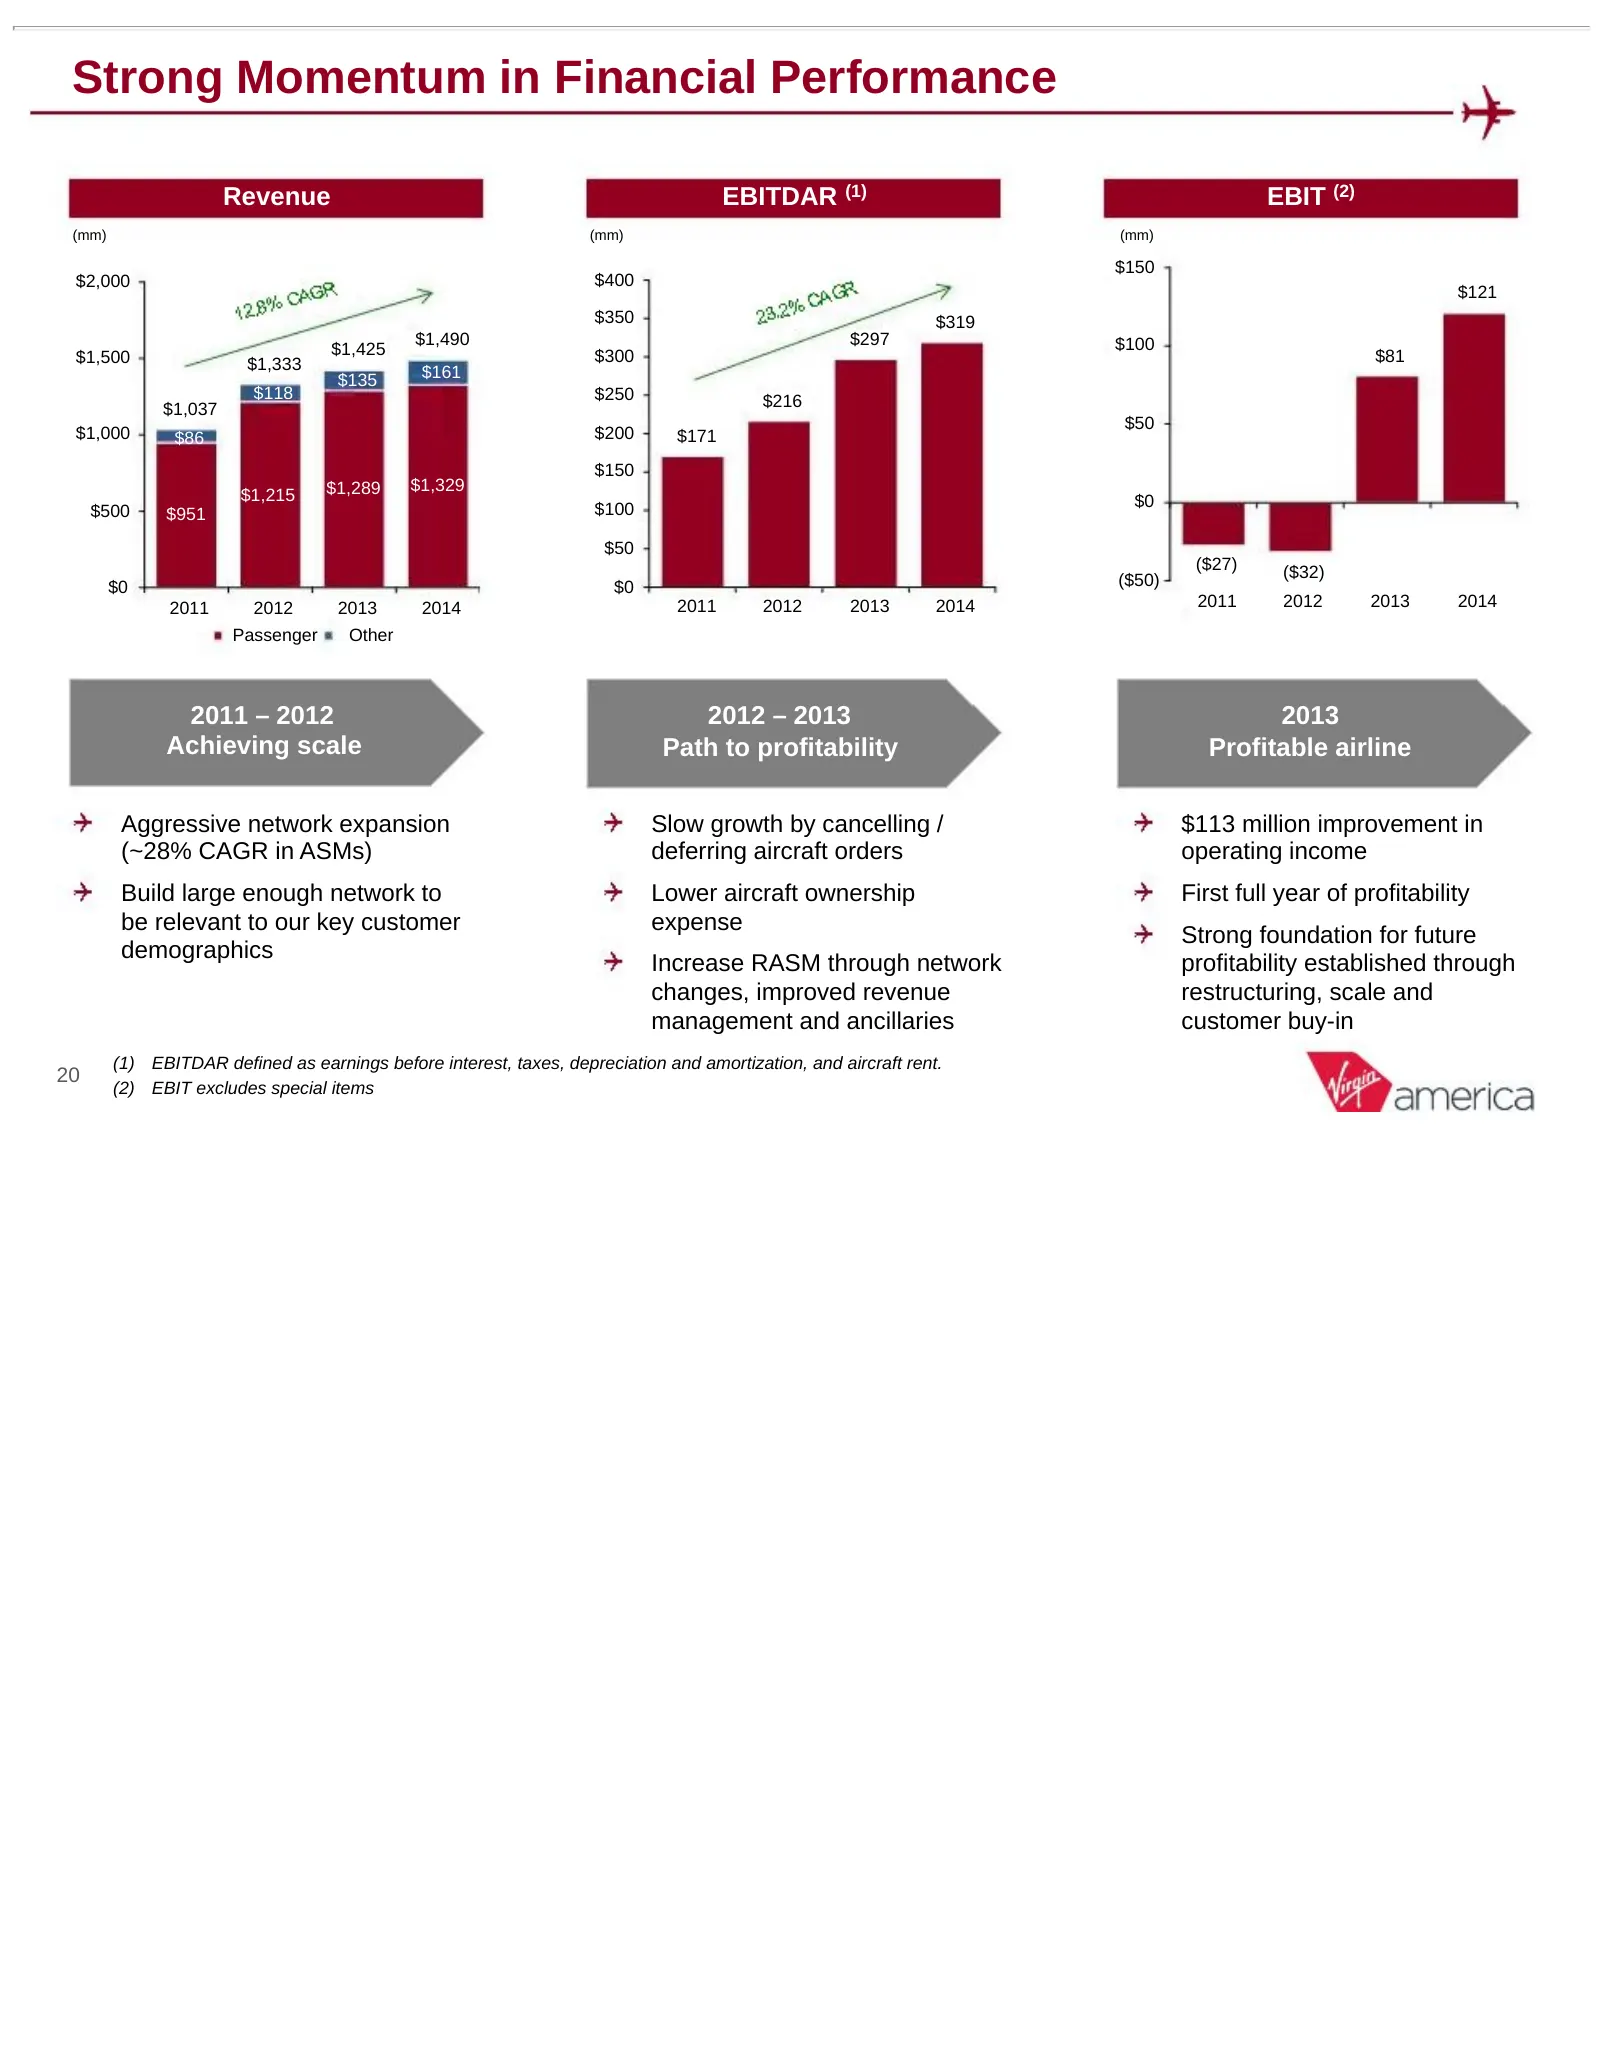
Strong Momentum in Financial Performance Revenue EBITDAR (1) EBIT (2) (mm) (mm) (mm) $150 $2,000 $400 $121 $350 $319 $1,490 $297 $100 $1,500 $1,425 $300 $81 $1,333 $161 $135 $118 $250 $216 $1,037 $50 $1,000 $86 $200 $171 $150 $1,289 $1,329 $1,215 $0 $500 $951 $100 $50 ($27) ($32) $0 $0 ($50) 2011 20
Slide 21: Strong Balance Sheet Positioned for Future Growth
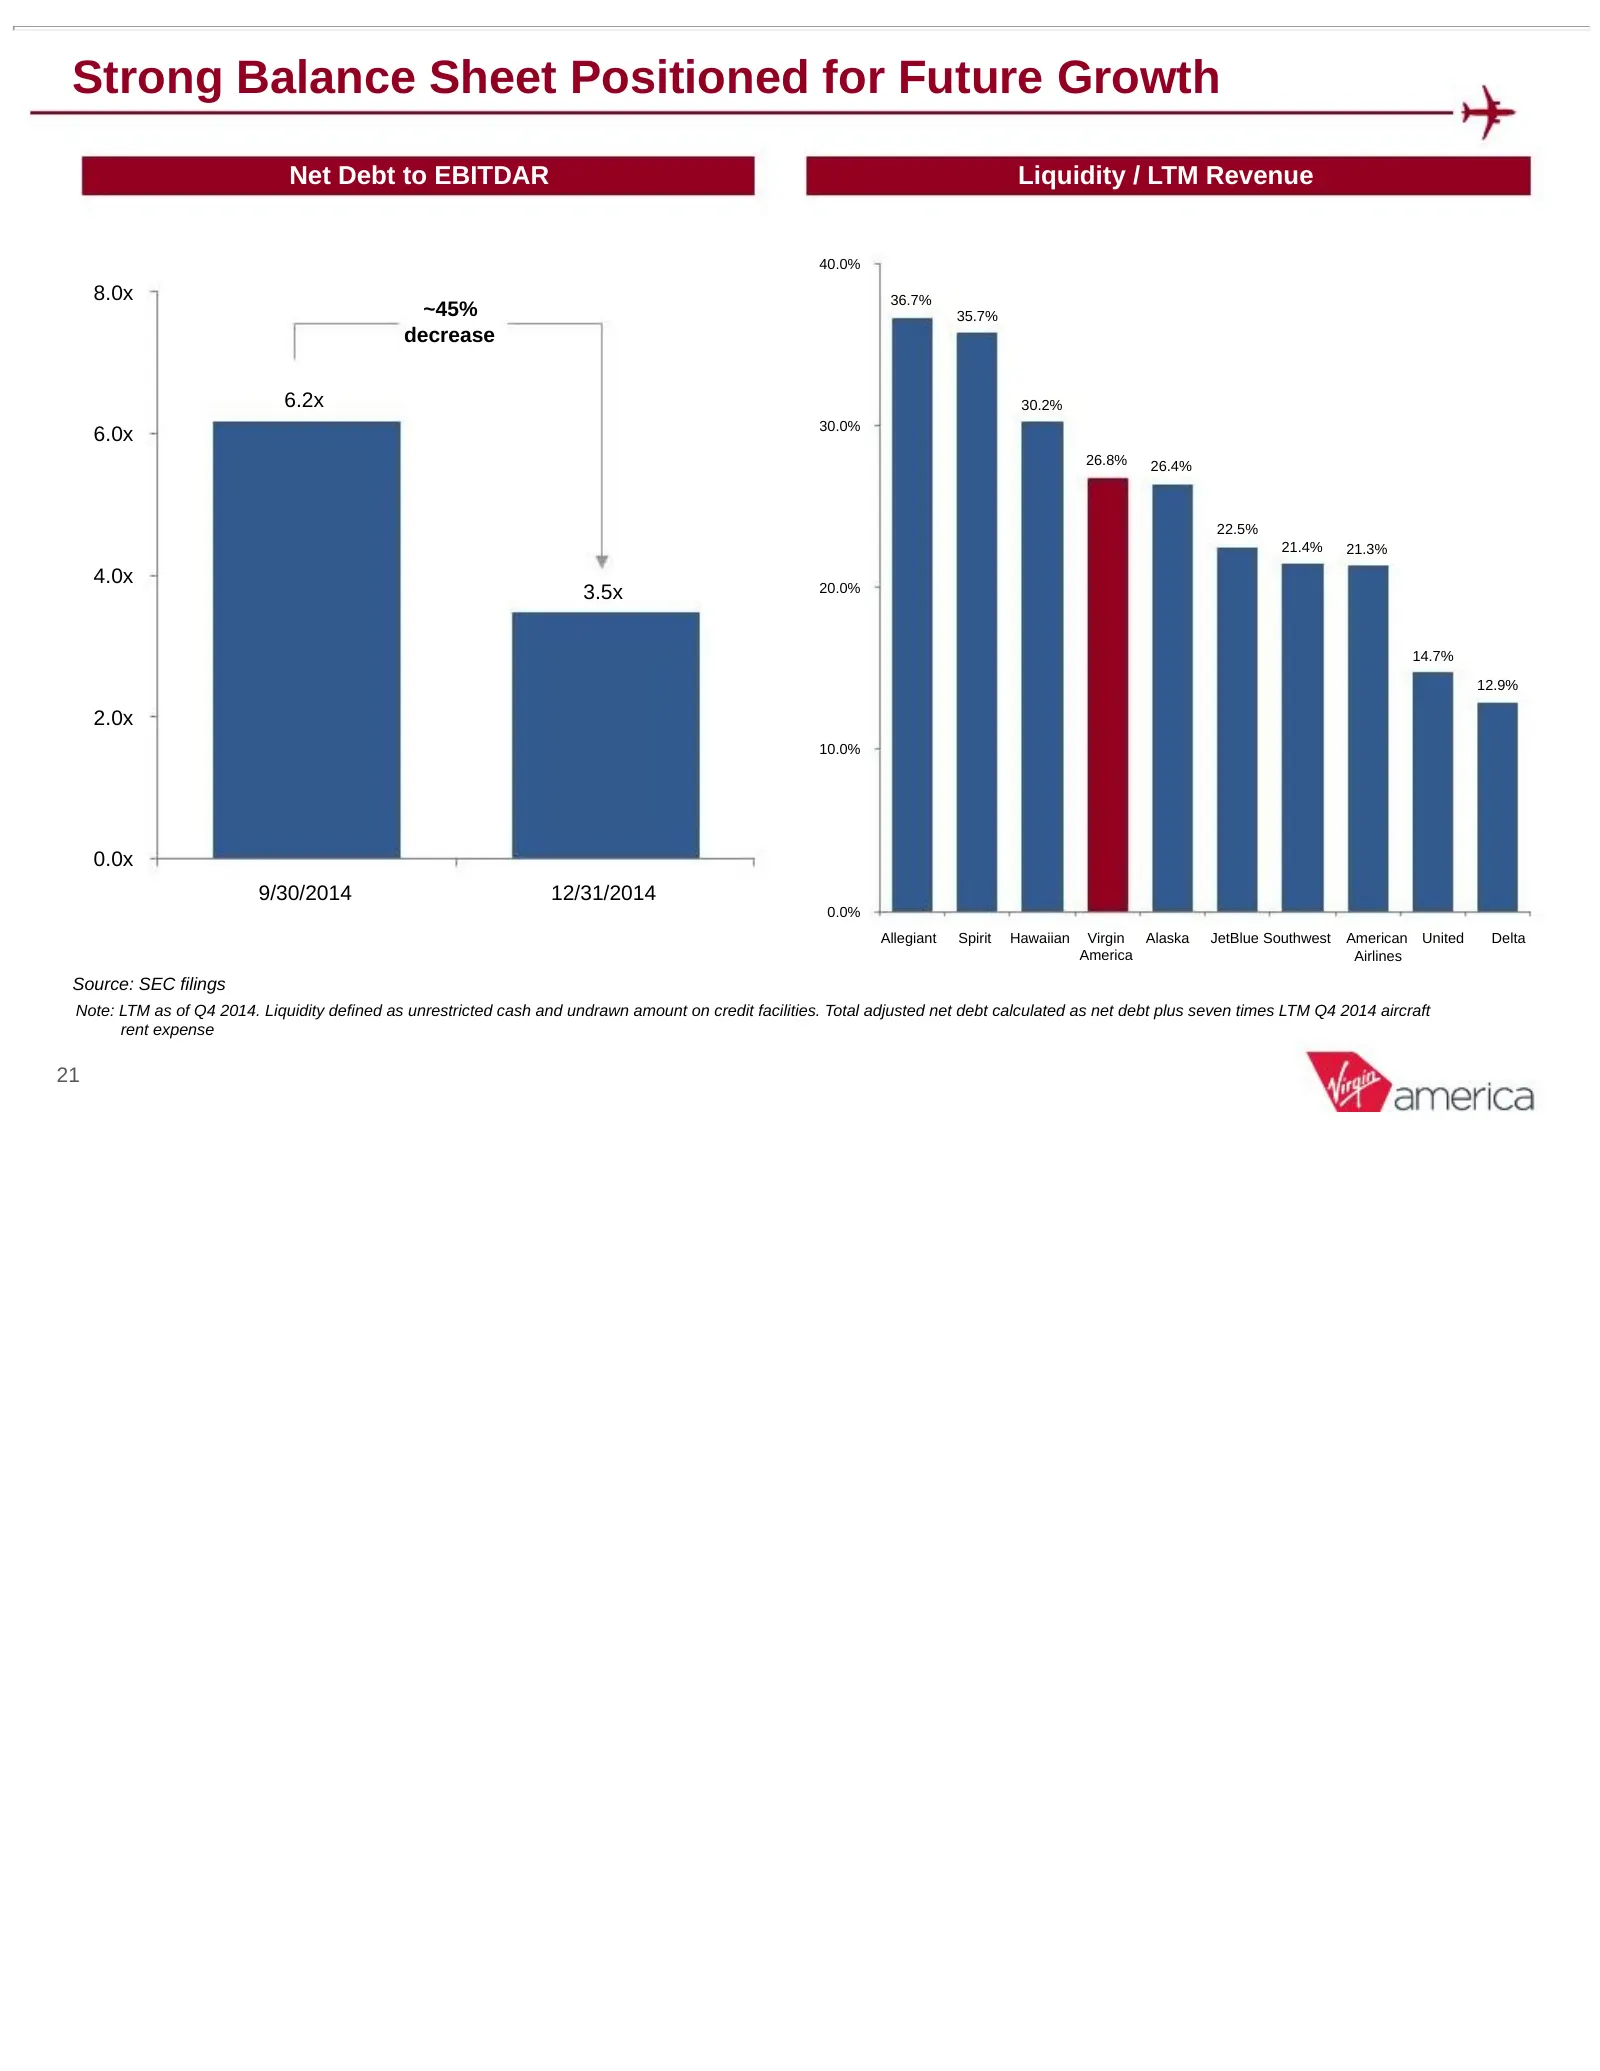
Strong Balance Sheet Positioned for Future Growth Net Debt to EBITDAR Liquidity / LTM Revenue 40.0% 8.0x 36.7% ~45% 35.7% decrease 6.2x 30.2% 30.0% 6.0x 26.8% 26.4% 22.5% 21.4% 21.3% 4.0x 20.0% 3.5x 14.7% 12.9% 2.0x 10.0% 0.0x 9/30/2014 12/31/2014 0.0% Allegiant Spirit Hawaiian Virgin Alaska JetBlue
Slide 22: Return on Invested Capital
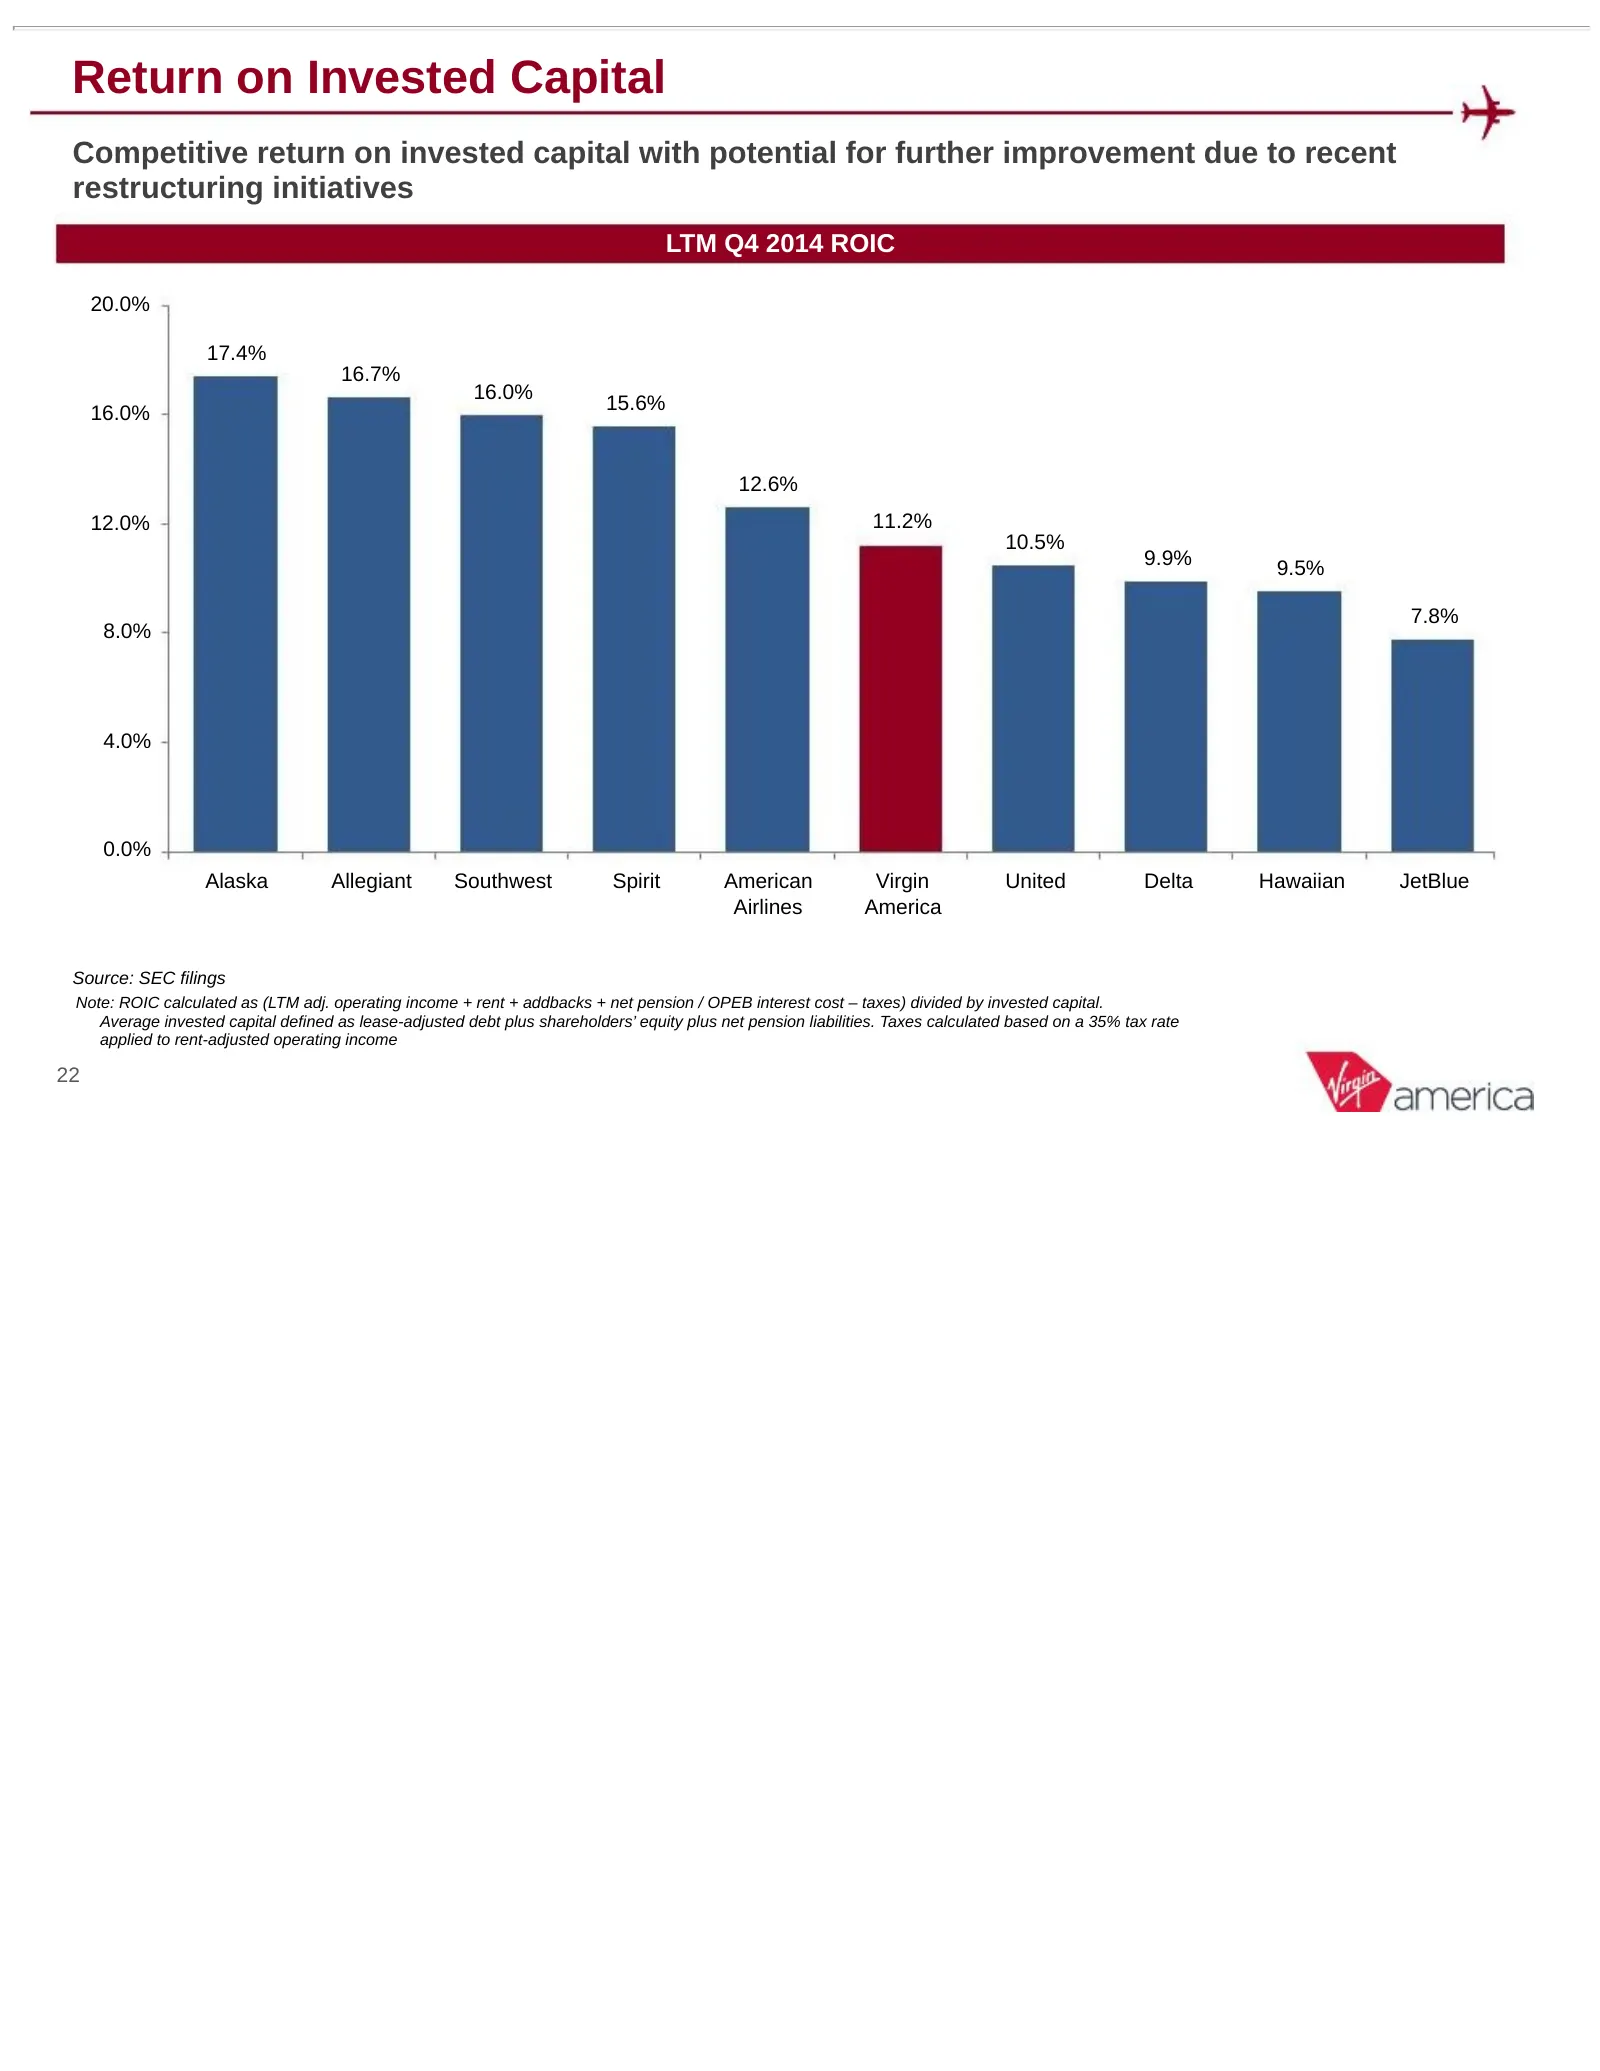
Return on Invested Capital Competitive return on invested capital with potential for further improvement due to recent restructuring initiatives LTM Q4 2014 ROIC 20.0% 17.4% 16.7% 16.0% 16.0% 15.6% 12.6% 12.0% 11.2% 10.5% 9.9% 9.5% 7.8% 8.0% 4.0% 0.0% Alaska Allegiant Southwest Spirit American Virgi
Slide 23: Key Investment Highlights
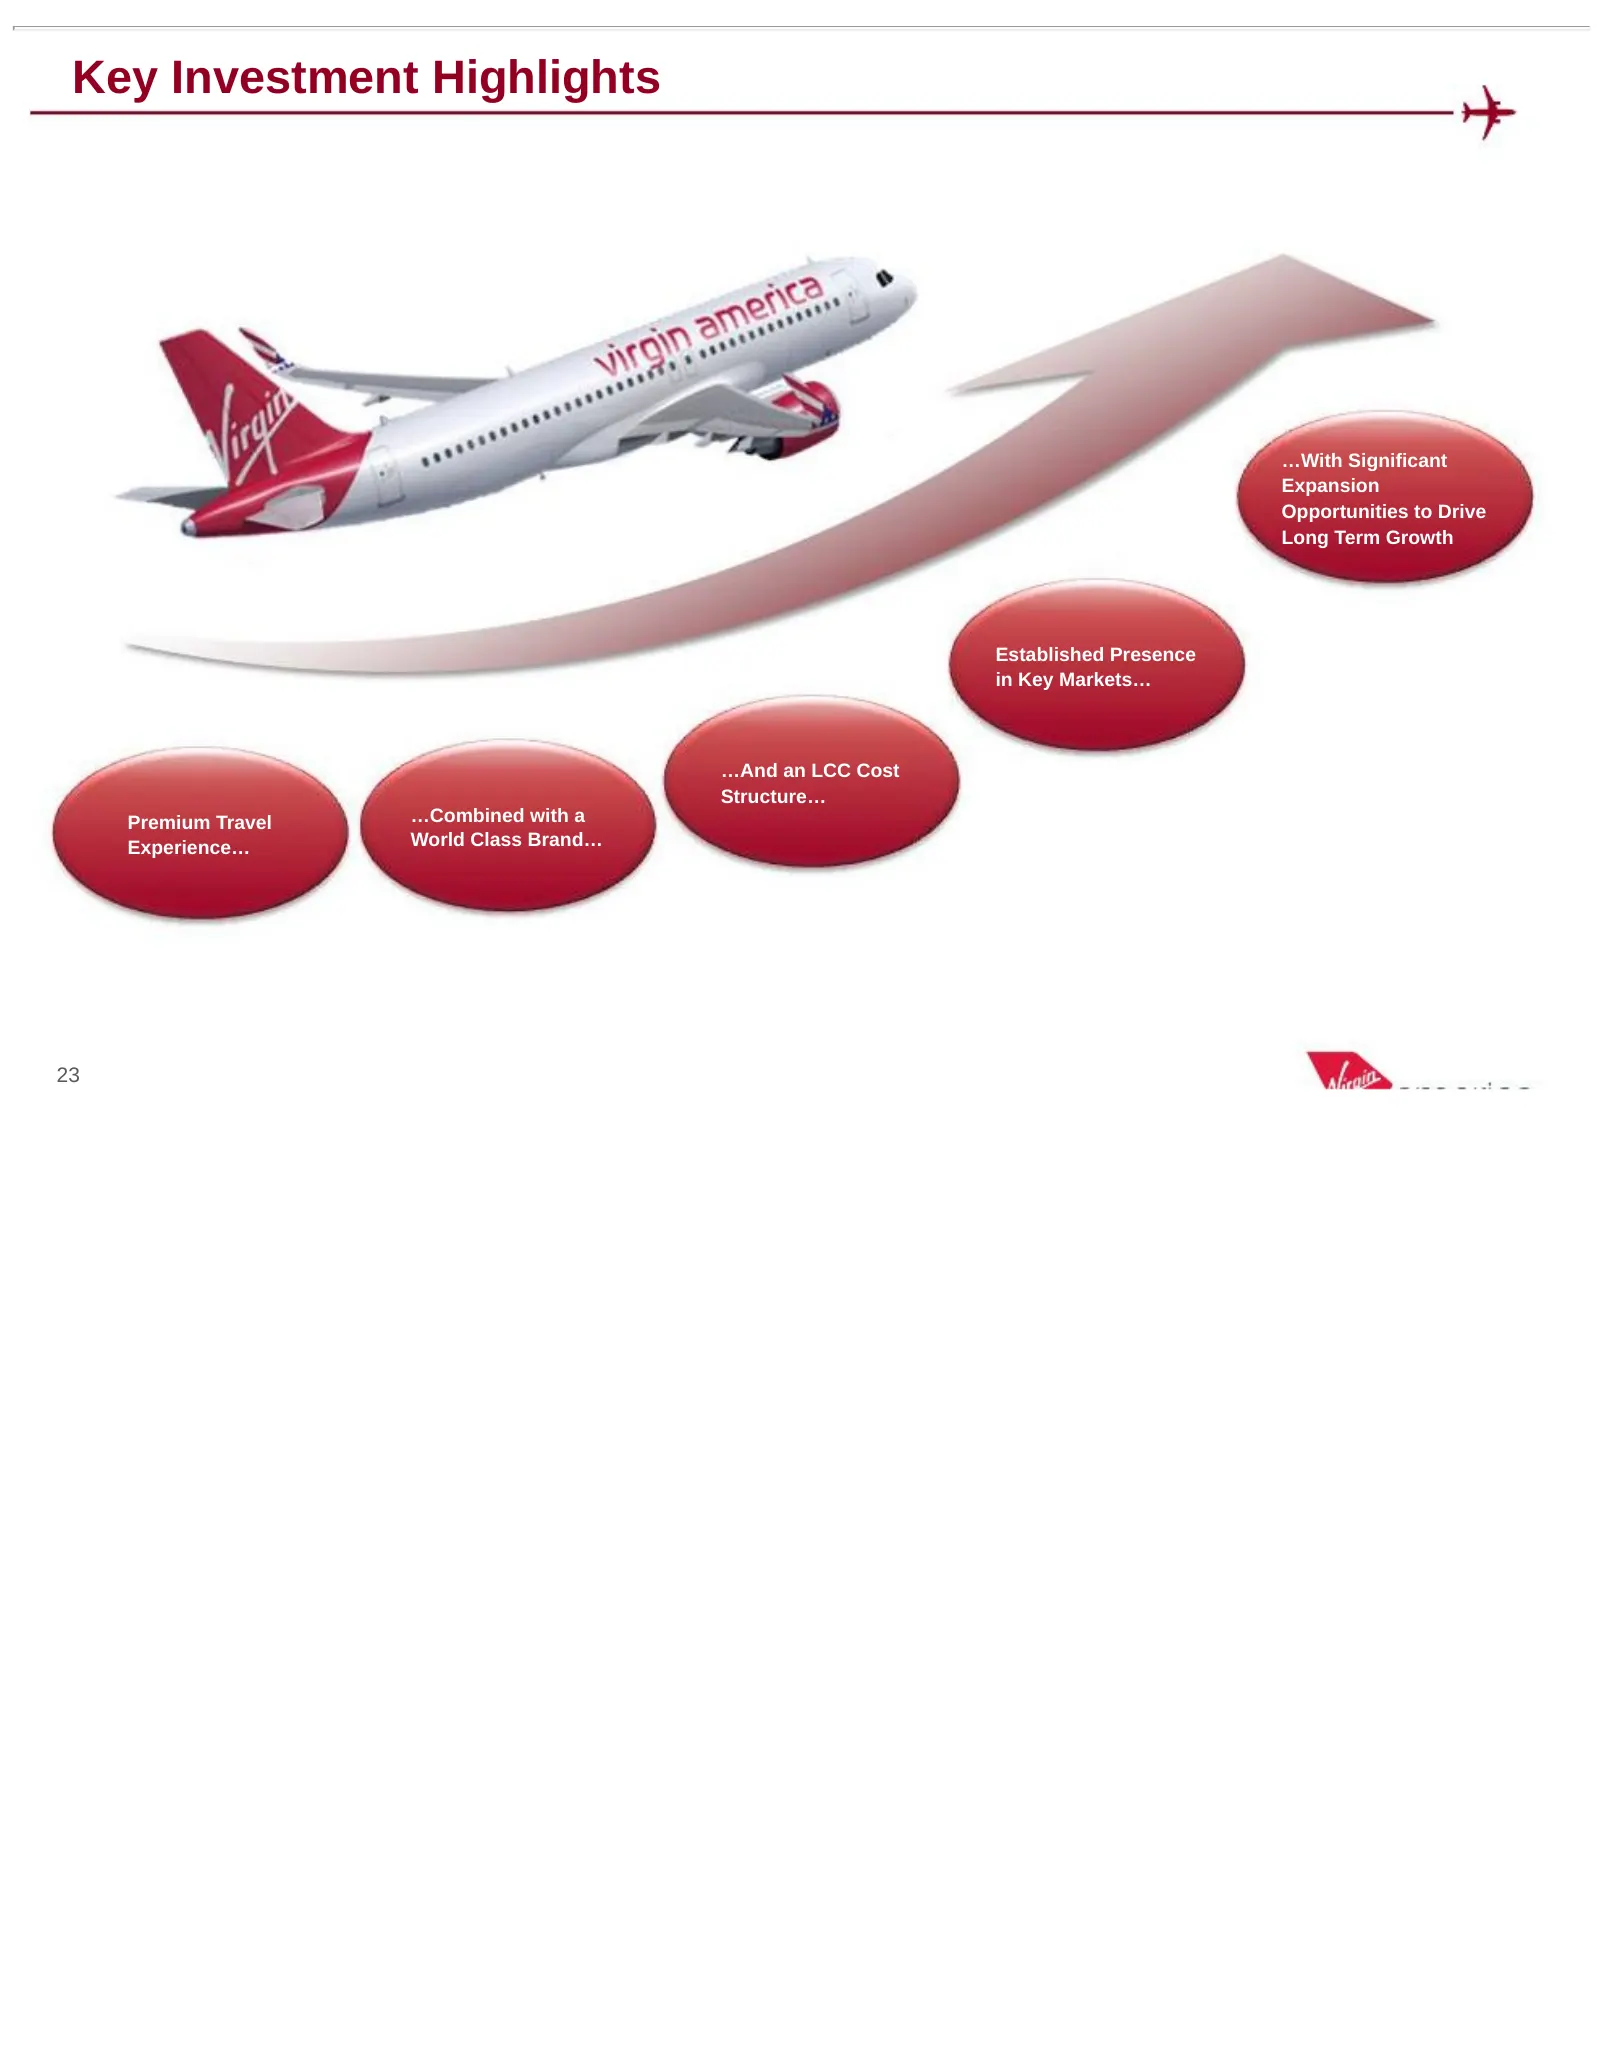
Key Investment Highlights …With Significant Expansion Opportunities to Drive Long Term Growth Established Presence in Key Markets… …And an LCC Cost Structure… Premium Travel …Combined with a Experience… World Class Brand… 23
Slide 24: Appendix
Appendix Confidential Presentation
Slide 25: Fleet Plan Overview
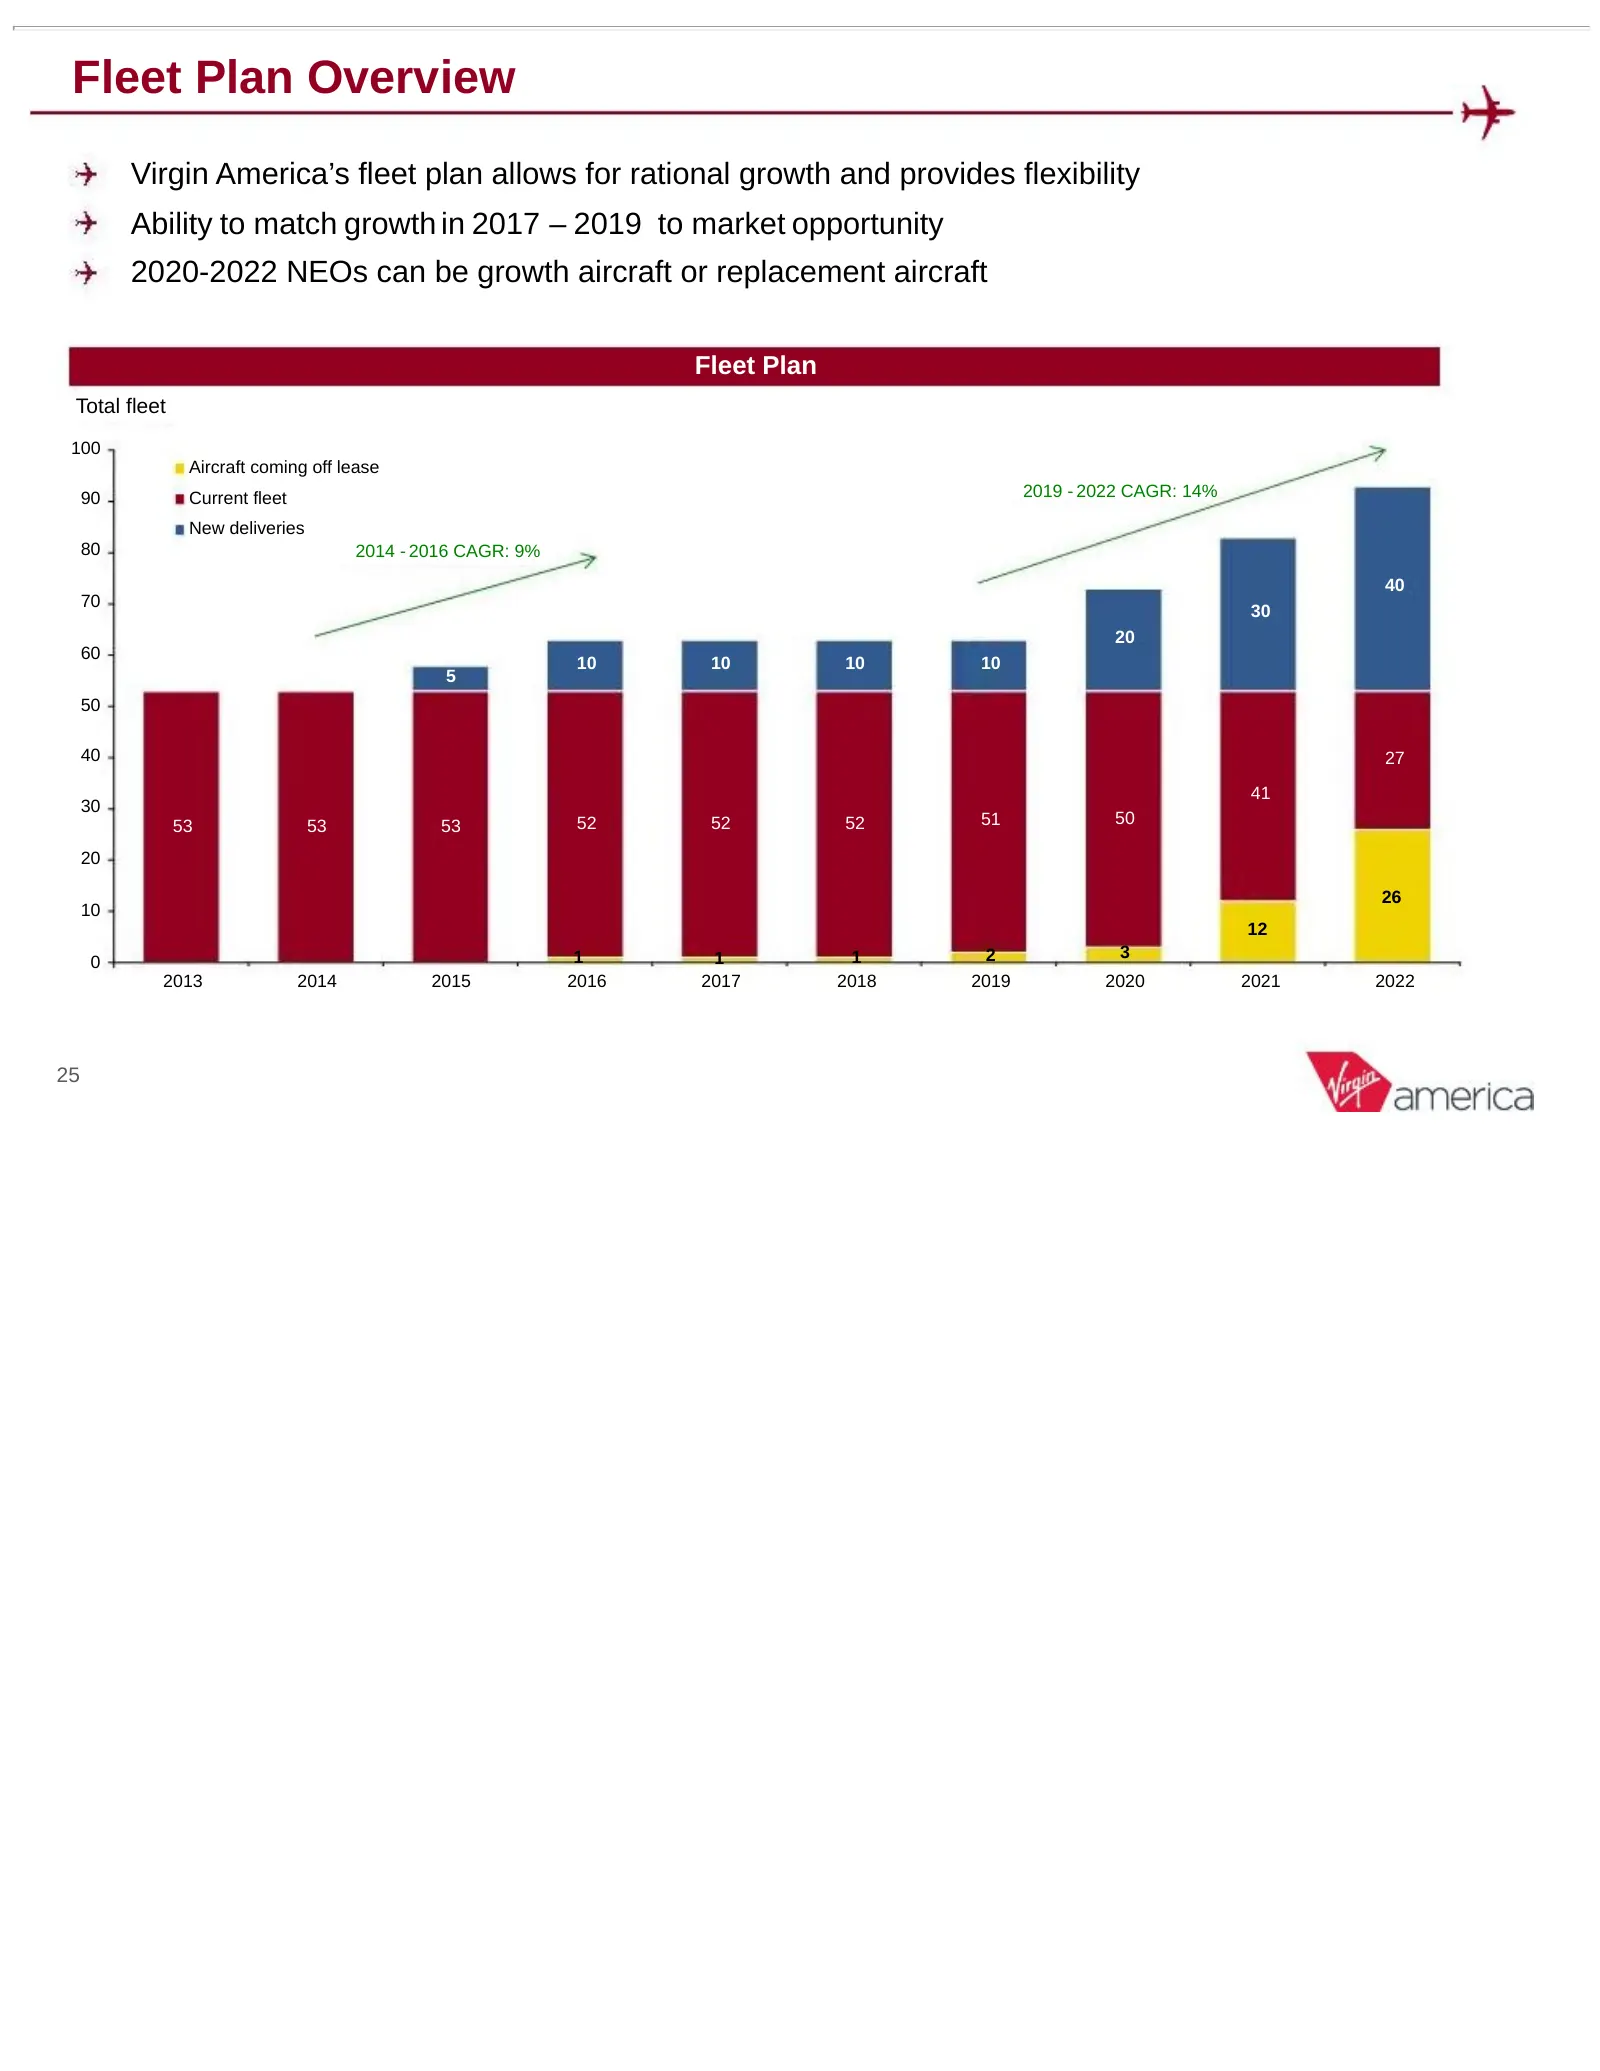
Fleet Plan Overview Virgin America’s fleet plan allows for rational growth and provides flexibility Ability to match growth in 2017 – 2019 to market opportunity 2020-2022 NEOs can be growth aircraft or replacement aircraft Fleet Plan Total fleet 100 Aircraft coming off lease 90 Current fleet 2019 -
Slide 26: GAAP to Non-GAAP Reconciliations
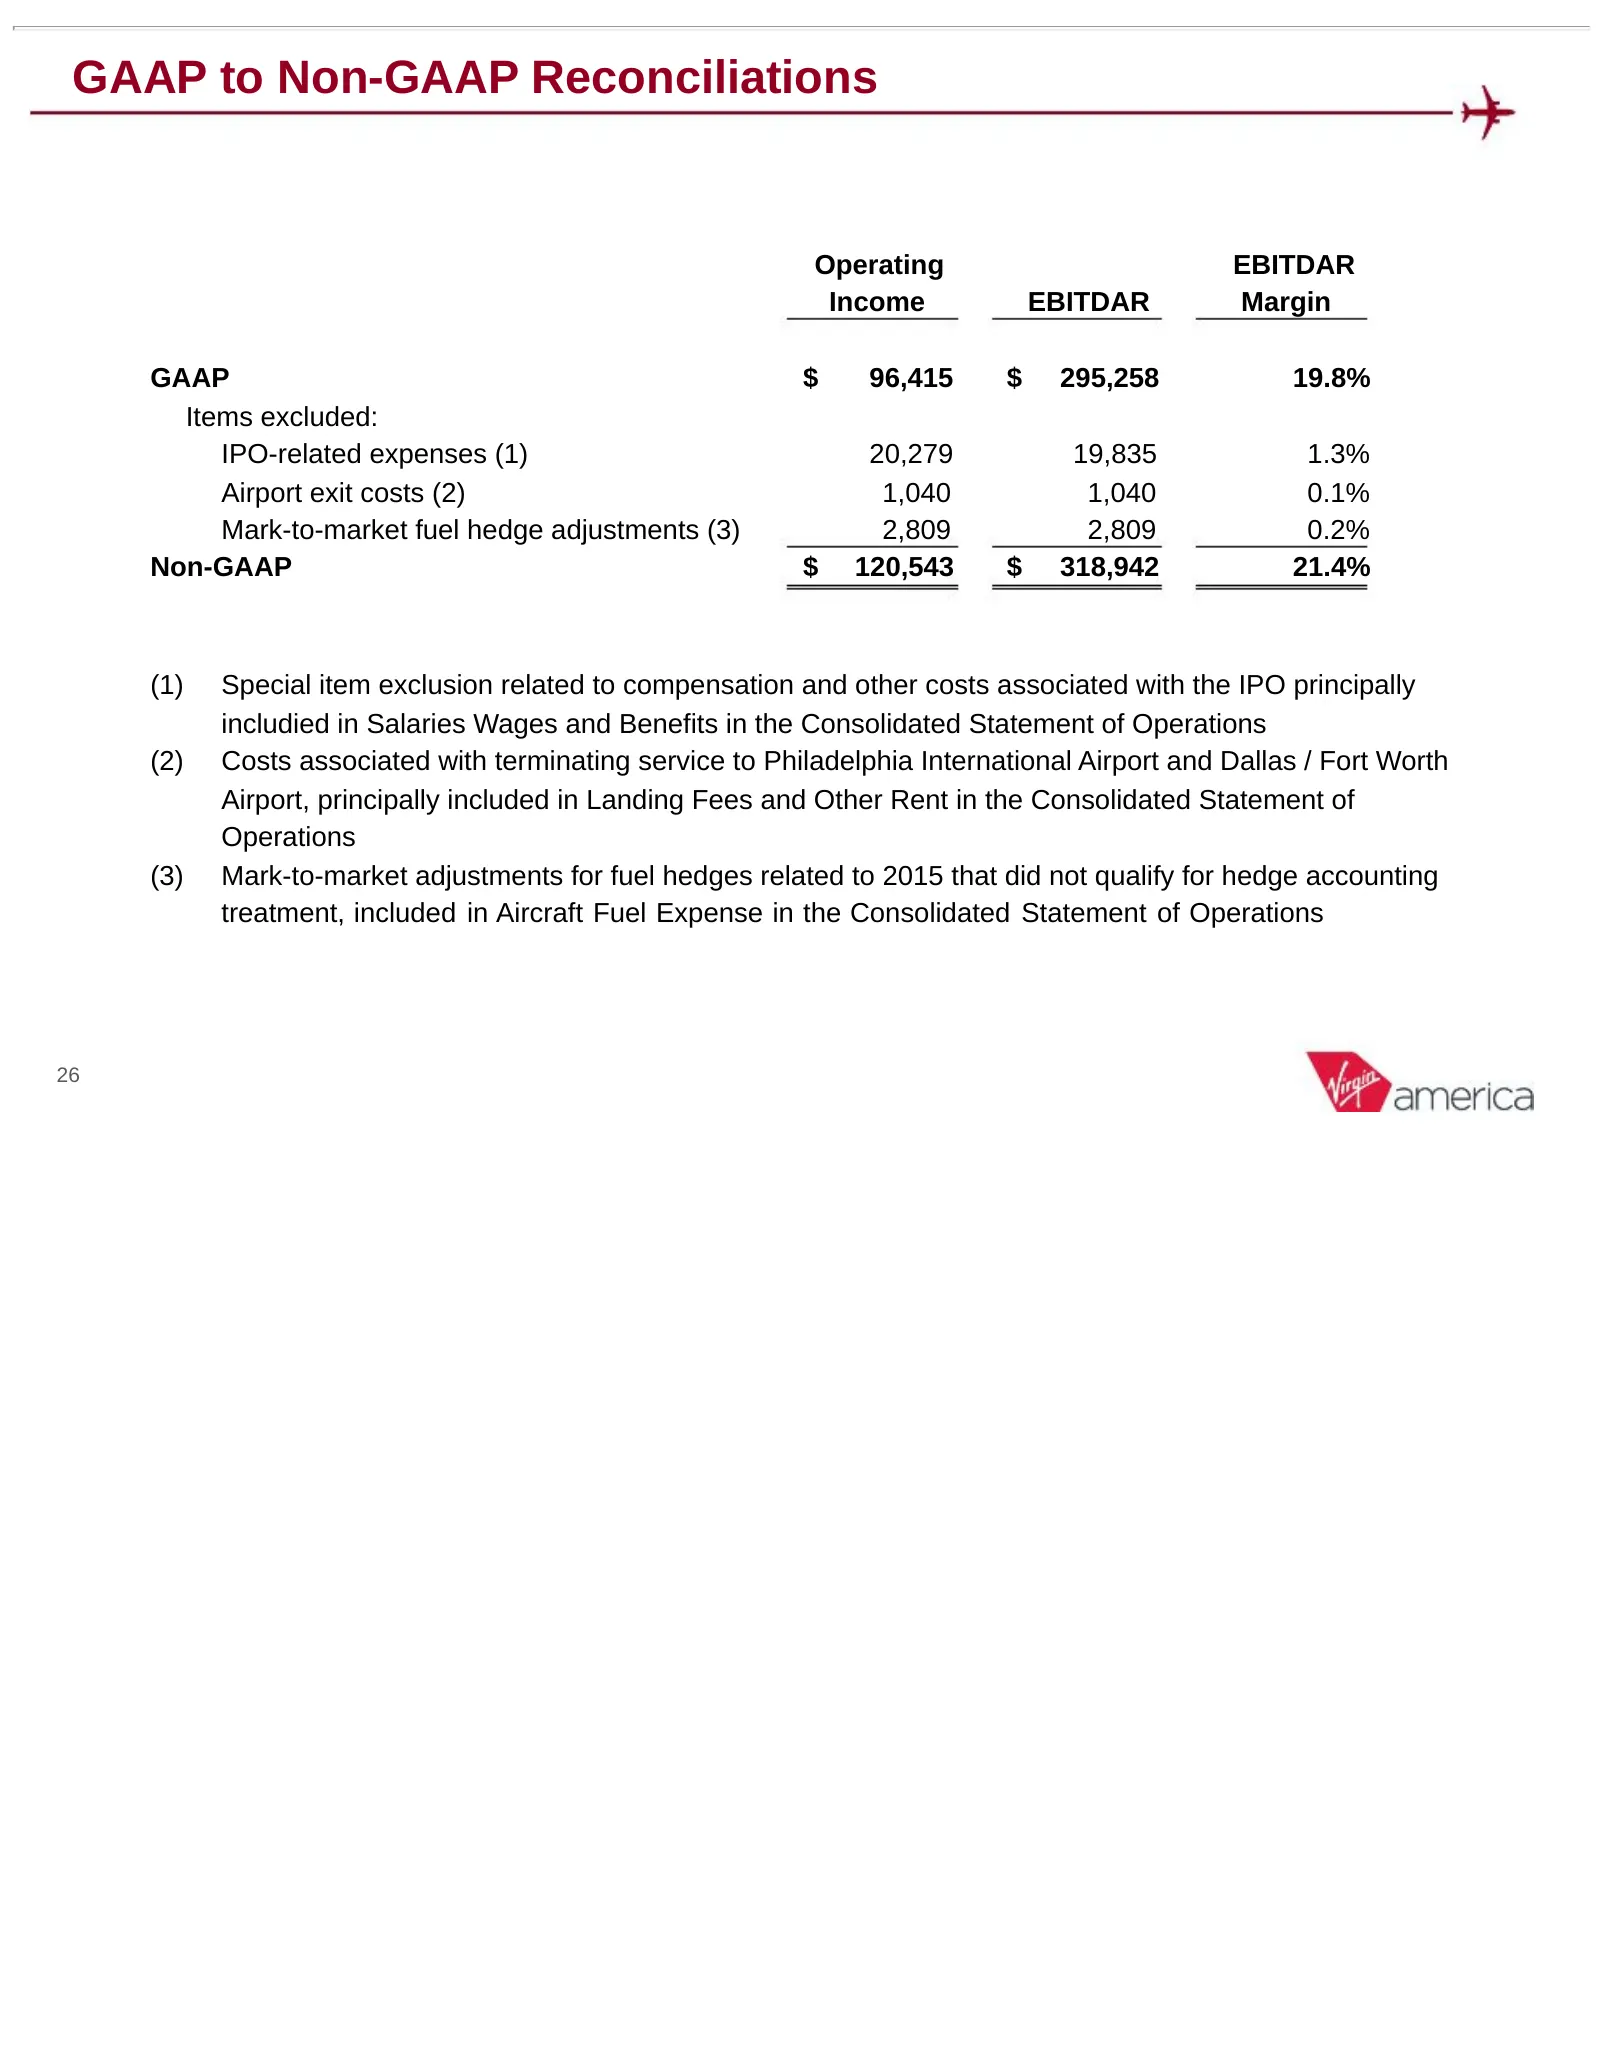
GAAP to Non-GAAP Reconciliations Operating EBITDAR Income EBITDAR Margin GAAP $ 96,415 $ 295,258 19.8% Items excluded: IPO-related expenses (1) 20,279 19,835 1.3% Airport exit costs (2) 1,040 1,040 0.1% Mark-to-market fuel hedge adjustments (3) 2,809 2,809 0.2% Non-GAAP $ 120,543 $ 318,942 21.4% (1)
Source: SEC EDGAR · 8-K filed May 18, 2015
More decks from Virgin America Inc
 Merger or Acquisition (May 2016)41 slides · May 13, 2016
 Merger or Acquisition (April 2016)37 slides · Apr 13, 2016
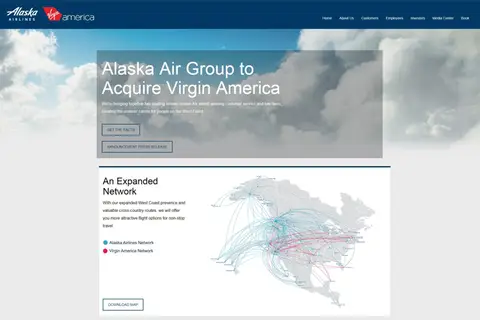 Merger or Acquisition (April 2016)20 slides · Apr 5, 2016
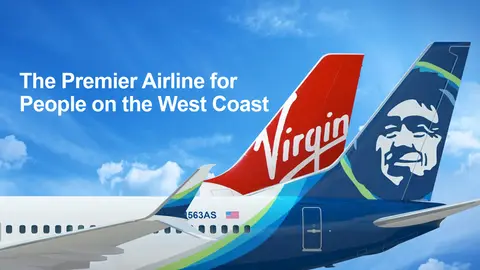 Merger or Acquisition (April 2016)50 slides · Apr 4, 2016
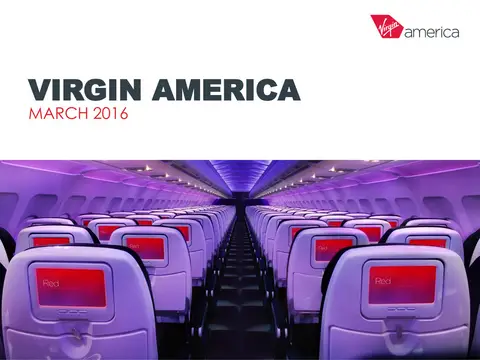 Investor Presentation (March 2016)29 slides · Mar 8, 2016
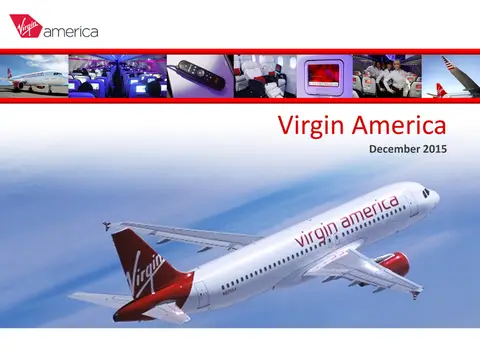 Investor Presentation (December 2015)27 slides · Dec 2, 2015