Infrastructure and Energy Alternatives Inc
Infrastructure and Energy Alternatives — Seaport Global Energy & Industrials Conference 2018
20 slides from Infrastructure and Energy Alternatives's conference presentation, Aug 27, 2018

Slide 1: Seaport Global Energy & Industrials Conference August 28, 2018
SEAPORT GLOBAL ENERGY & INDUSTRIALS CONFERENCE AUGUST 28, 2018
Slide 2: Disclaimer
DISCLAIMER This presentation includes “forward looking statements” (within the meaning of the “safe harbor” provisions of the United States Private Securities Litigation Reform Act of 1995), including but not limited to those regarding the proposed acquisitions by Infrastructure and Energy Alternati
Slide 3: IEA Company Overview
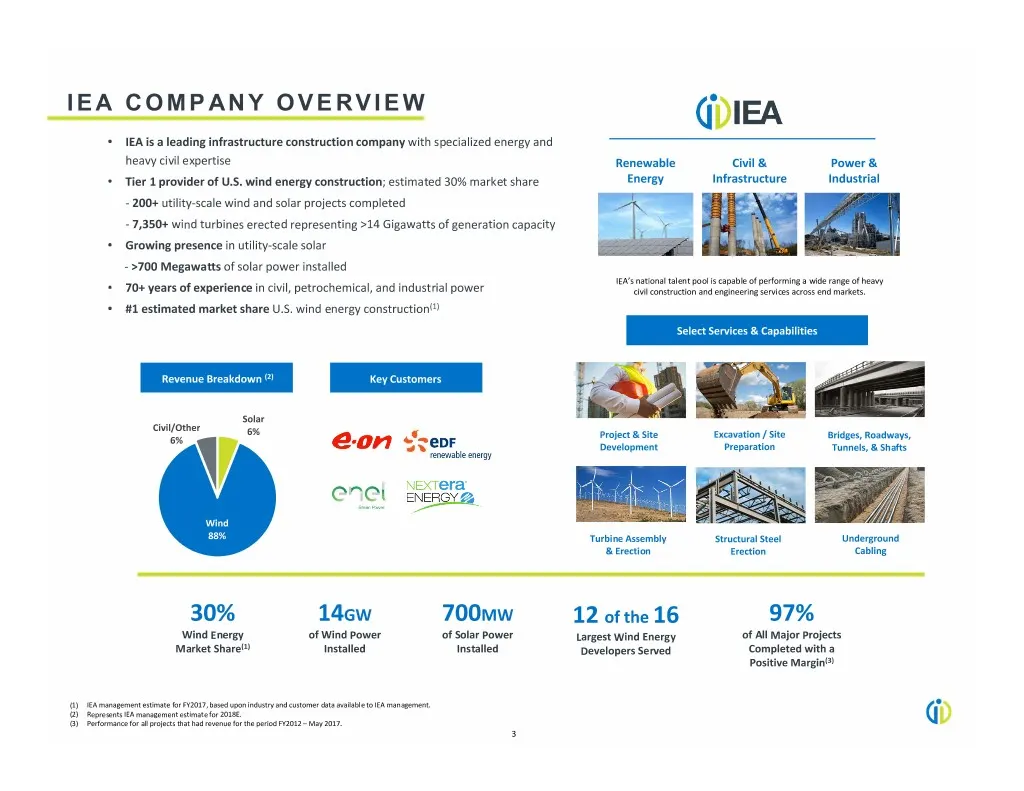
IEA COMPANY OVERVIEW • IEA is a leading infrastructure construction company with specialized energy and heavy civil expertise Renewable Civil & Power & • Tier 1 provider of U.S. wind energy construction; estimated 30% market share Energy Infrastructure Industrial ‐ 200+ utility‐scale wind and solar
Slide 4: Investment Highlights
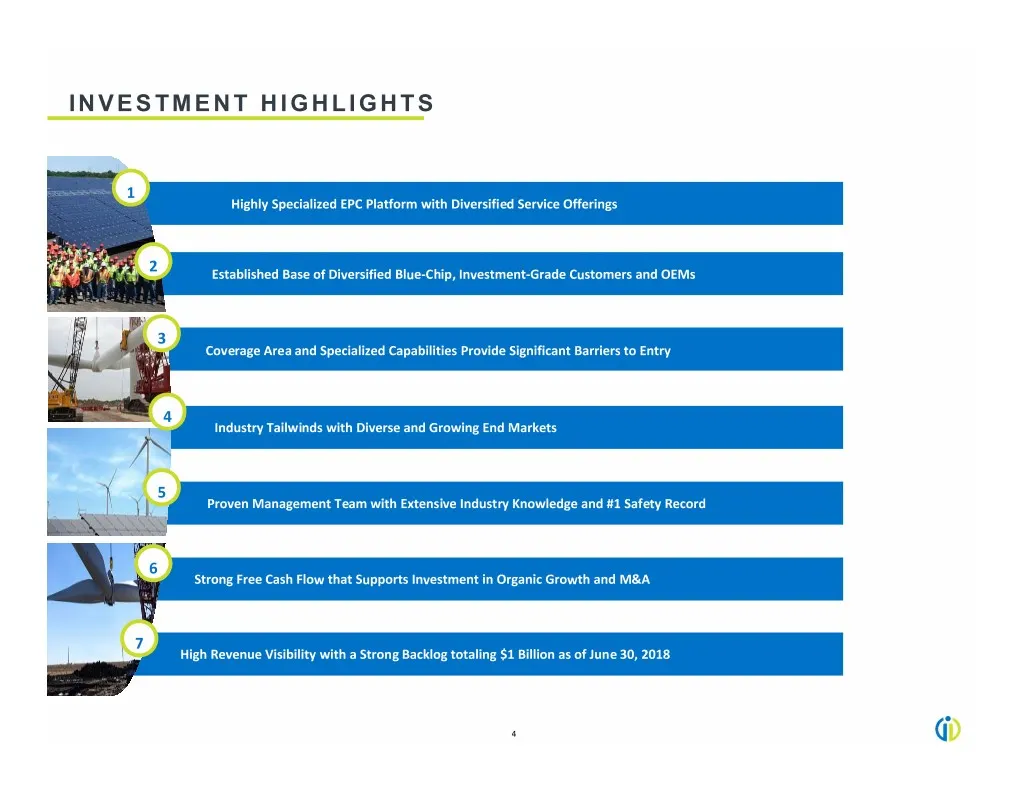
INVESTMENT HIGHLIGHTS 1 Highly Specialized EPC Platform with Diversified Service Offerings 2 Established Base of Diversified Blue‐Chip, Investment‐Grade Customers and OEMs 3 Coverage Area and Specialized Capabilities Provide Significant Barriers to Entry 4 Industry Tailwinds with Diverse and Growing
Slide 5: Multiple Levers to Drive Growth
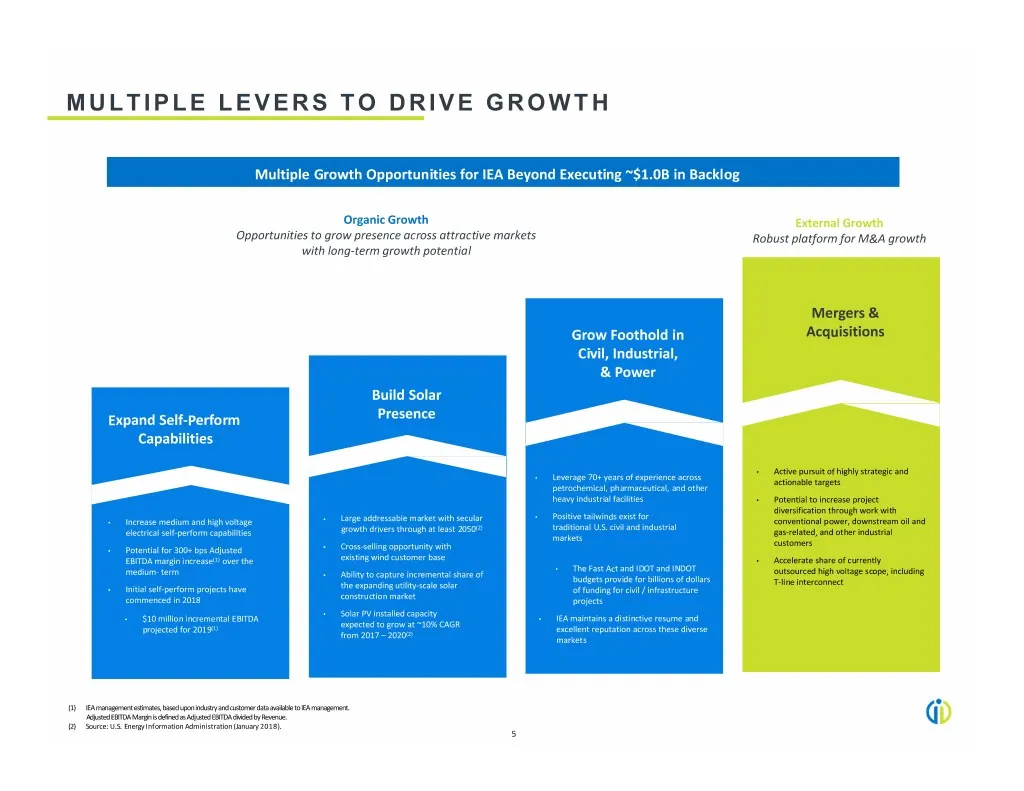
MULTIPLE LEVERS TO DRIVE GROWTH Multiple Growth Opportunities for IEA Beyond Executing ~$1.0B in Backlog Organic Growth External Growth Opportunities to grow presence across attractive markets Robust platform for M&A growth with long‐term growth potential Mergers & Grow Foothold in Acquisitions Civi
Slide 6: Strong M&A Pipeline in Place to Accelerate Growth
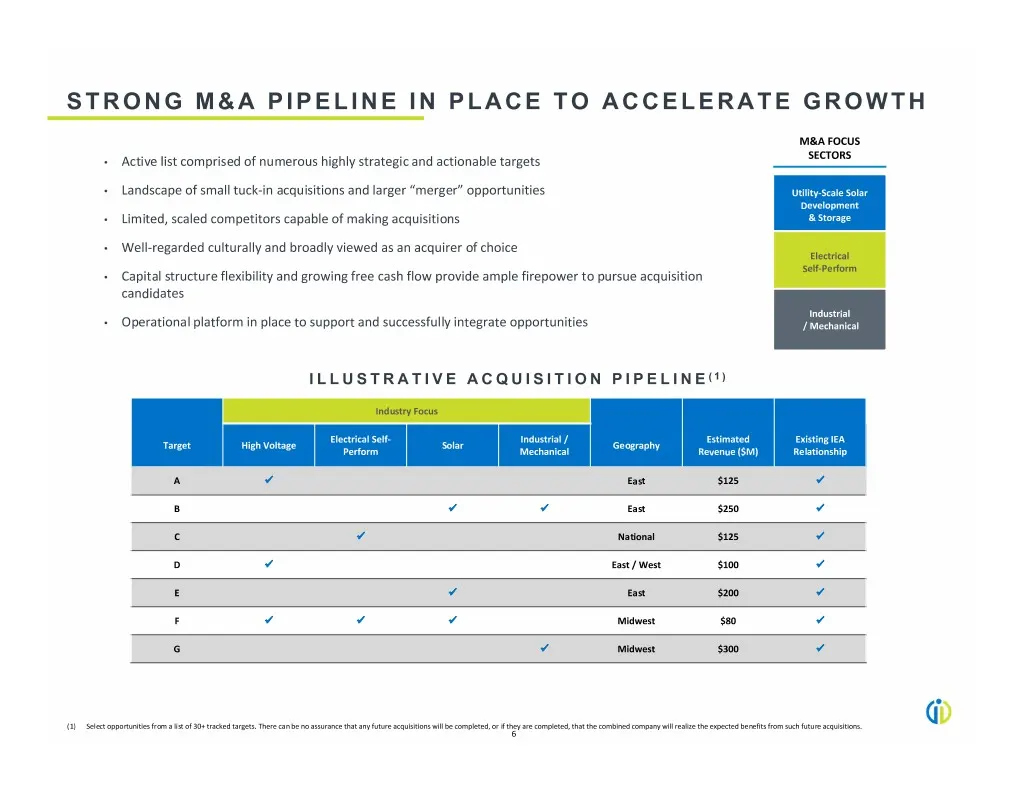
STRONG M&A PIPELINE IN PLACE TO ACCELERATE GROWTH M&A FOCUS SECTORS • Active list comprised of numerous highly strategic and actionable targets • Landscape of small tuck‐in acquisitions and larger “merger” opportunities Utility‐Scale Solar Development • Limited, scaled competitors capable of making
Slide 7: Acquisition of Saiia & The ACC Companies
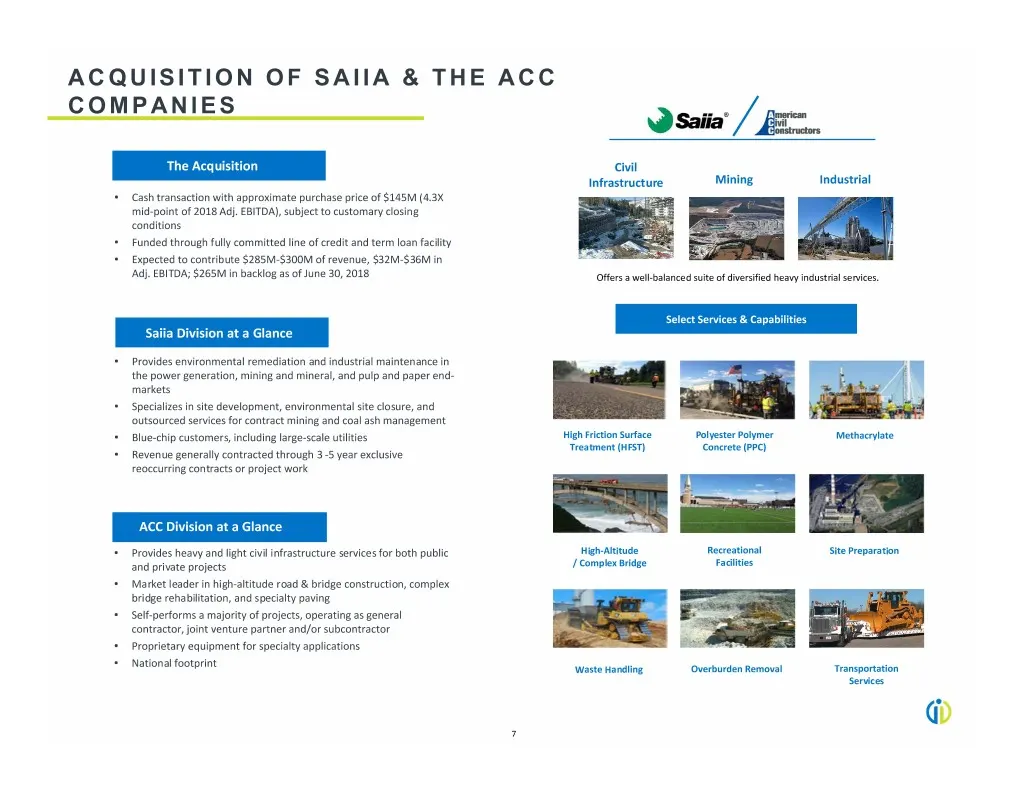
ACQUISITION OF SAIIA & THE ACC COMPANIES The Acquisition Civil Infrastructure Mining Industrial • Cash transaction with approximate purchase price of $145M (4.3X mid‐point of 2018 Adj. EBITDA), subject to customary closing conditions • Funded through fully committed line of credit and term loan faci
Slide 8: Strategic Rationale for Acquisition
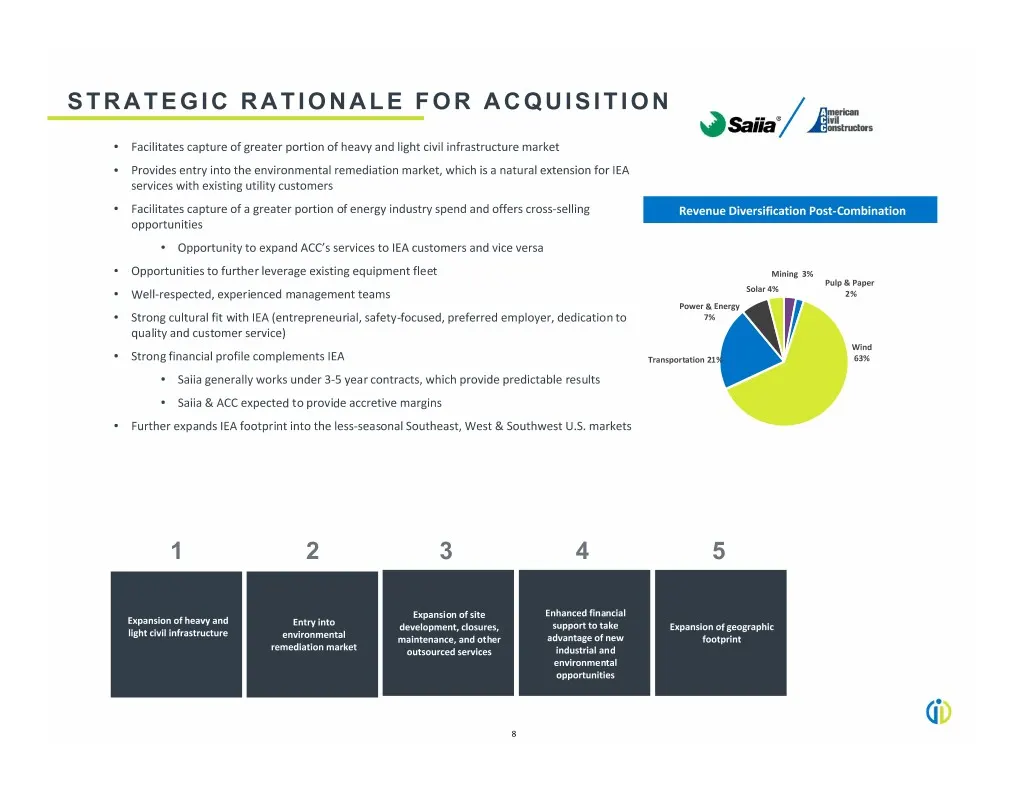
STRATEGIC RATIONALE FOR ACQUISITION • Facilitates capture of greater portion of heavy and light civil infrastructure market • Provides entry into the environmental remediation market, which is a natural extension for IEA services with existing utility customers • Facilitates capture of a greater por
Slide 9: Expansive National Coverage
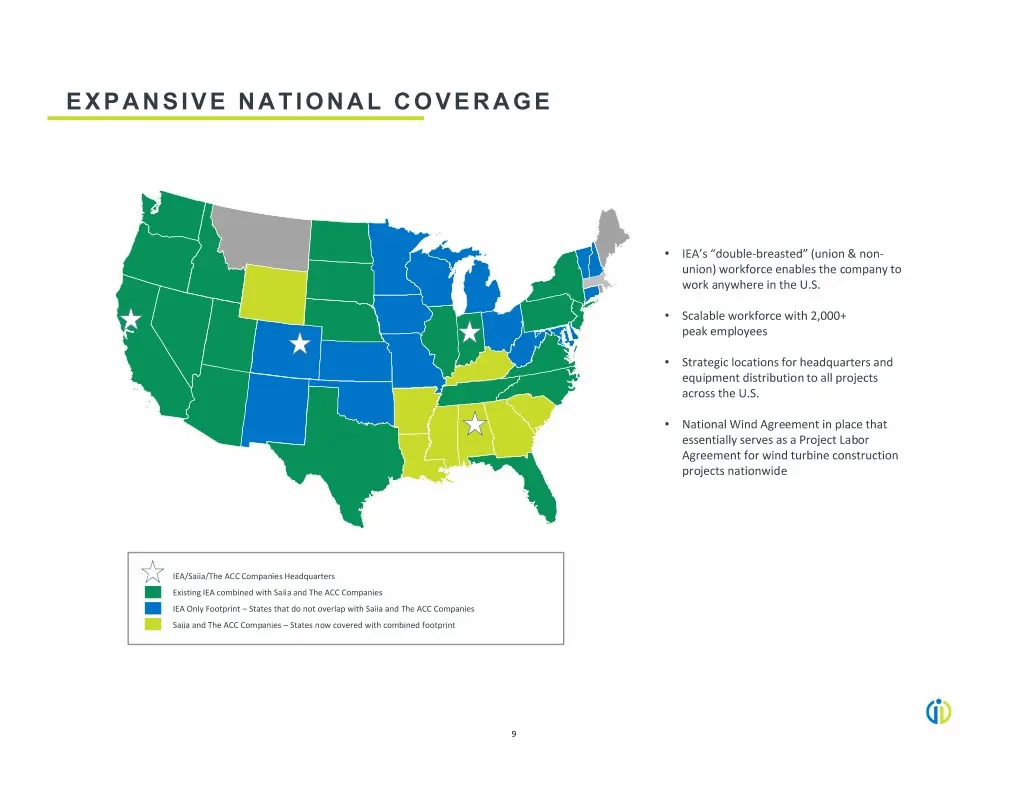
EXPANSIVE NATIONAL COVERAGE • IEA’s “double‐breasted” (union & non‐ union) workforce enables the company to work anywhere in the U.S. • Scalable workforce with 2,000+ peak employees • Strategic locations for headquarters and equipment distribution to all projects across the U.S. • National Wind Agre
Slide 10: Established Base of Diversified, Blue-Chip Customers
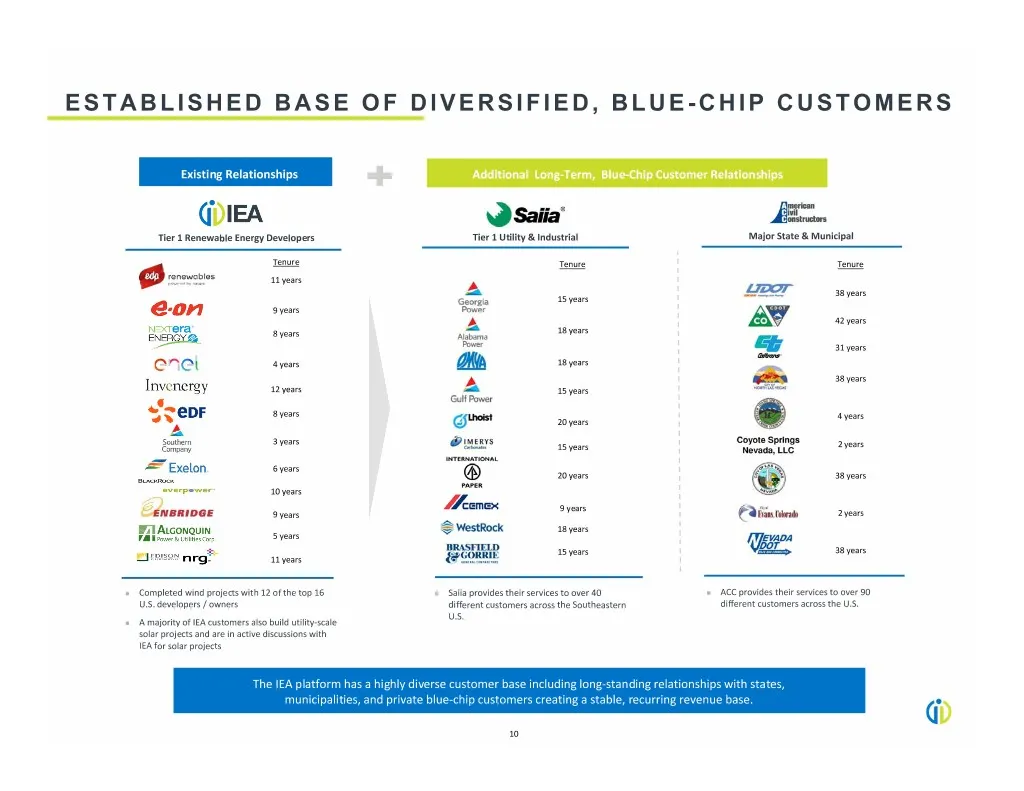
ESTABLISHED BASE OF DIVERSIFIED, BLUE-CHIP CUSTOMERS Existing Relationships Additional Long‐Term, Blue‐Chip Customer Relationships Tier 1 Renewable Energy Developers Tier 1 Utility & Industrial Major State & Municipal Tenure Tenure Tenure 11 years 38 years 15 years 9 years 42 years 8 years 18 years
Slide 11: Renewable Energy Market Overview
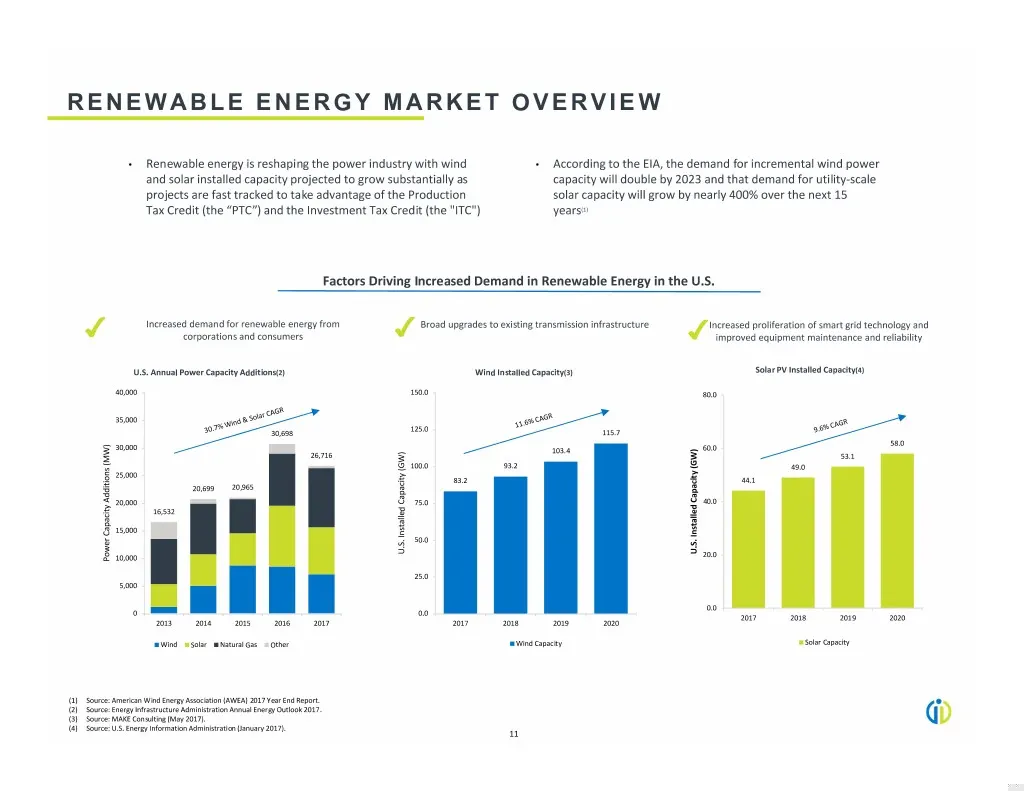
RENEWABLE ENERGY MARKET OVERVIEW • Renewable energy is reshaping the power industry with wind • According to the EIA, the demand for incremental wind power and solar installed capacity projected to grow substantially as capacity will double by 2023 and that demand for utility‐scale projects are fast
Slide 12: Leader in Renewable Energy EPC Industry
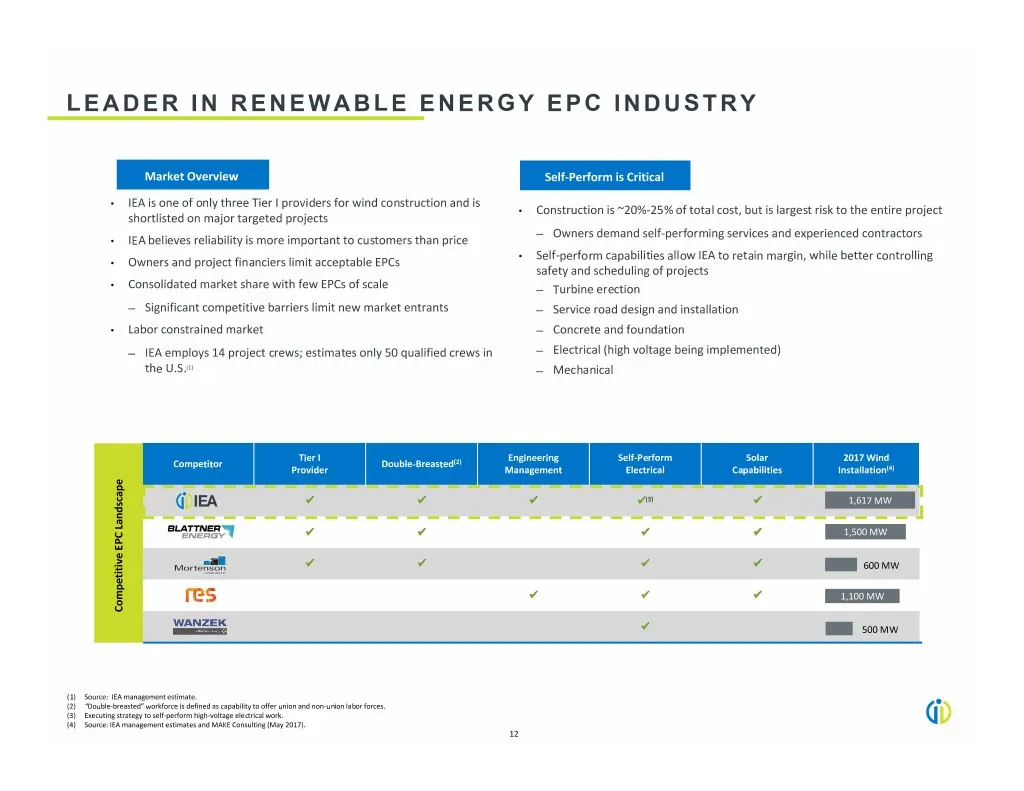
LEADER IN RENEWABLE ENERGY EPC INDUSTRY Market Overview Self‐Perform is Critical • IEA is one of only three Tier I providers for wind construction and is • Construction is ~20%‐25% of total cost, but is largest risk to the entire project shortlisted on major targeted projects — Owners demand self‐pe
Slide 13: U.S. Construction Market Overview
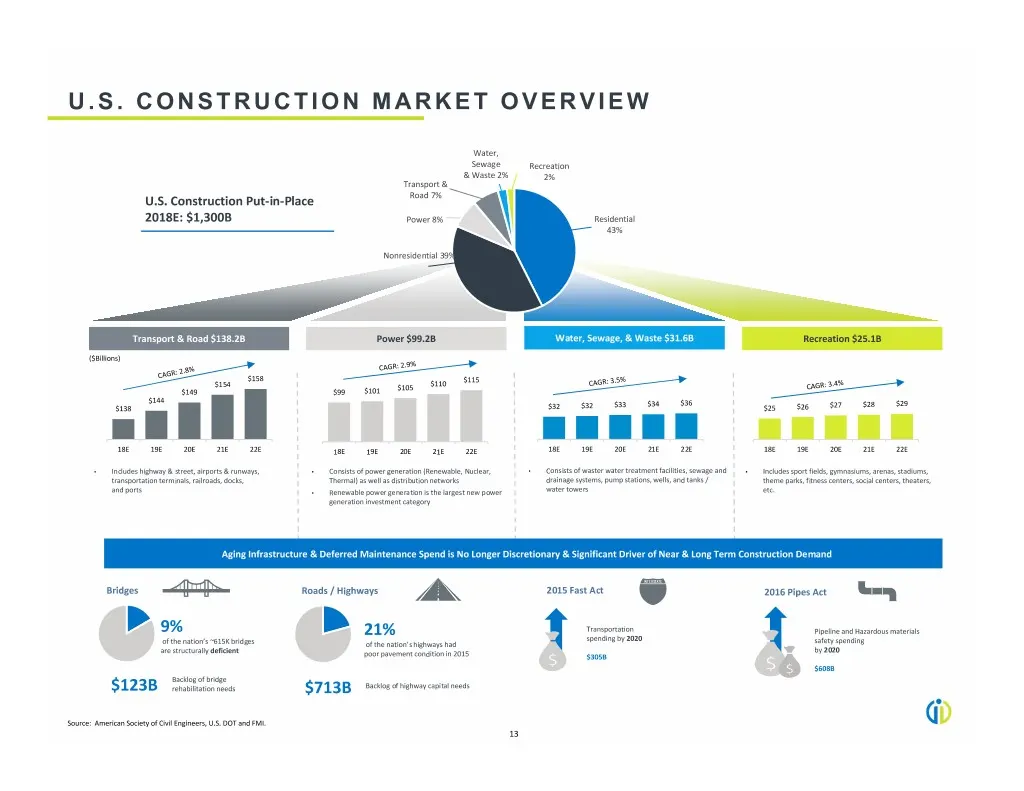
U.S. CONSTRUCTION MARKET OVERVIEW Water, Sewage Recreation & Waste 2% 2% Transport & U.S. Construction Put‐in‐Place Road 7% 2018E: $1,300B Power 8% Residential 43% Nonresidential 39% Transport & Road $138.2B Power $99.2B Water, Sewage, & Waste $31.6B Recreation $25.1B ($Billions) $158 $115 $110 $154
Slide 14: 2018 Financial Guidance
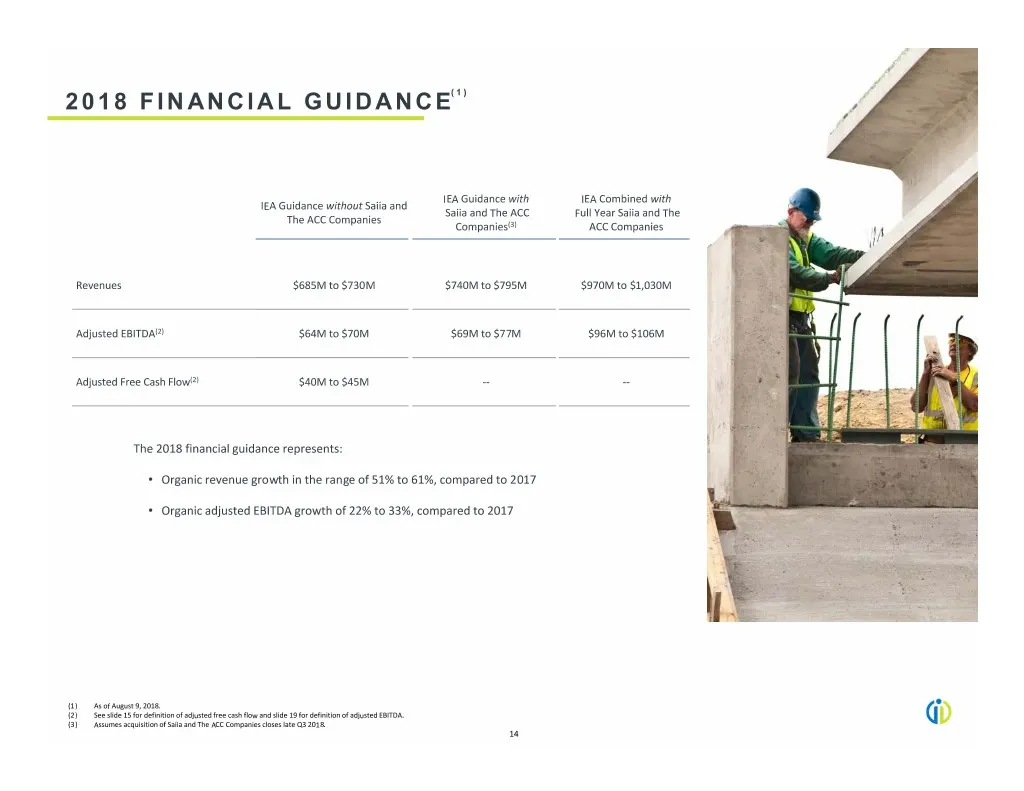
2018 FINANCIAL GUIDANCE(1) IEA Guidance with IEA Combined with IEA Guidance without Saiia and Saiia and The ACC Full Year Saiia and The The ACC Companies Companies(3) ACC Companies Revenues $685M to $730M $740M to $795M $970M to $1,030M Adjusted EBITDA(2) $64M to $70M $69M to $77M $96M to $106M Adju
Slide 15: Financial Performance Continues to Gain Momentum
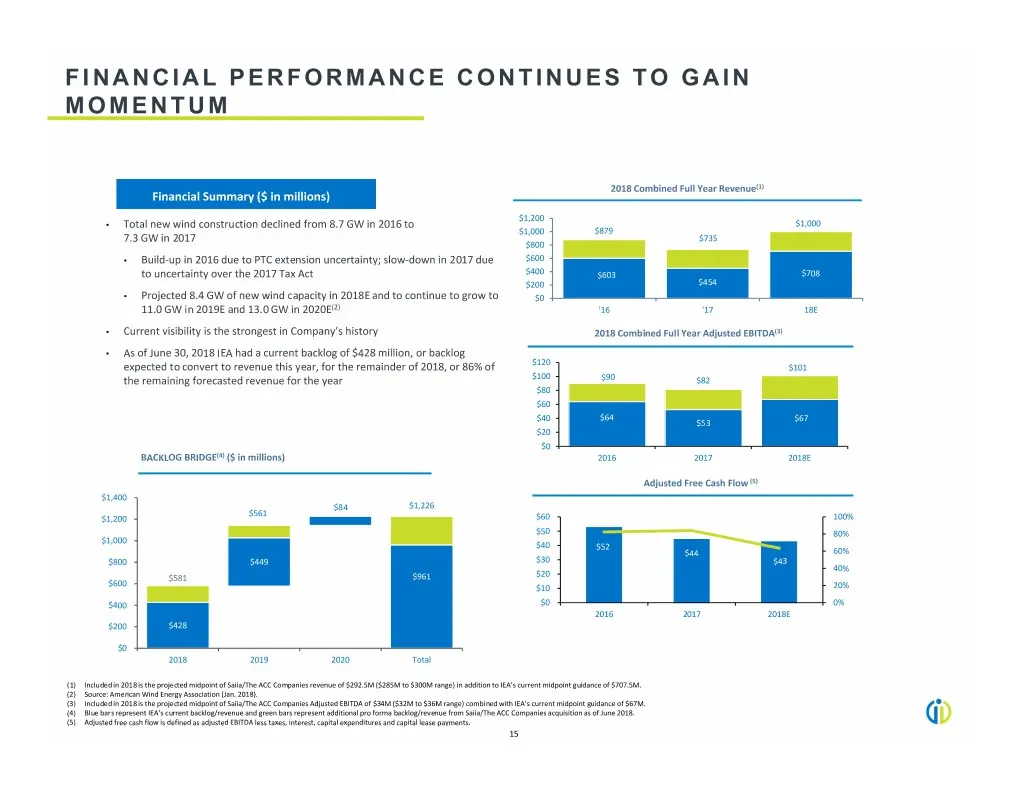
FINANCIAL PERFORMANCE CONTINUES TO GAIN MOMENTUM 2018 Combined Full Year Revenue(1) Financial Summary ($ in millions) $1,200 • Total new wind construction declined from 8.7 GW in 2016 to $1,000 $1,000 $879 7.3 GW in 2017 $735 $800 • Build‐up in 2016 due to PTC extension uncertainty; slow‐down in 201
Slide 16: Appendix
APPENDIX @IEA
Slide 17: SPAC Transaction Overview
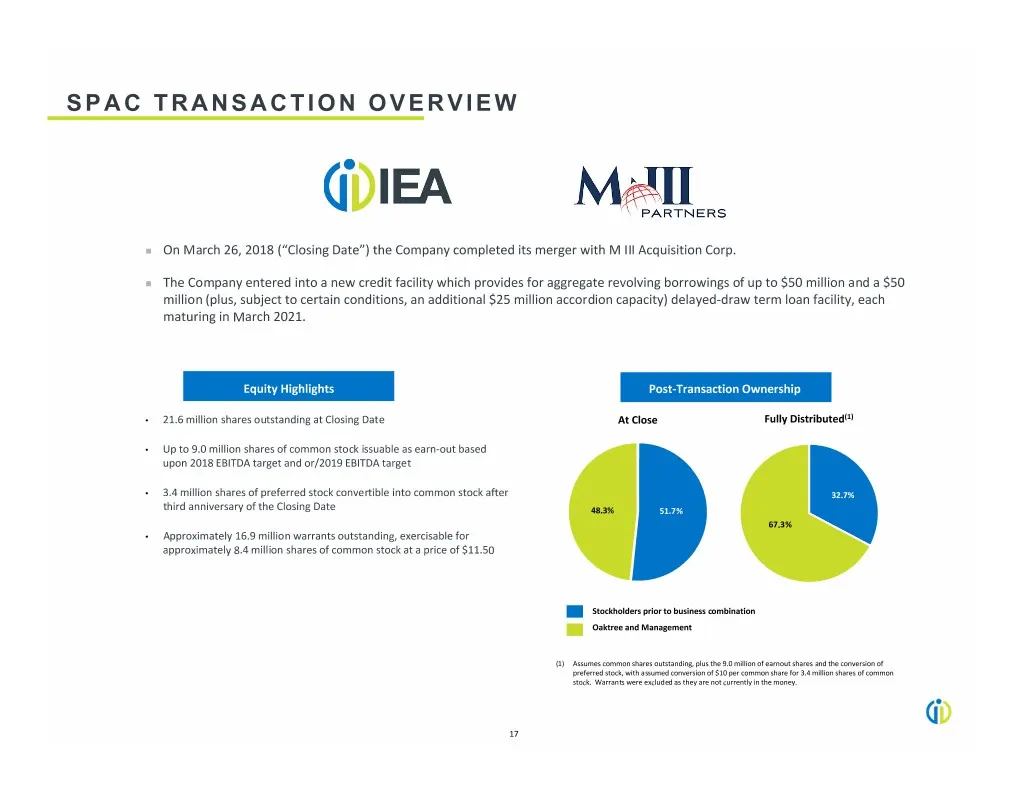
SPAC TRANSACTION OVERVIEW On March 26, 2018 (“Closing Date”) the Company completed its merger with M III Acquisition Corp. The Company entered into a new credit facility which provides for aggregate revolving borrowings of up to $50 million and a $50 million (plus, subject to certain conditions,
Slide 18: Strong Management Team Committed to Client Relationships
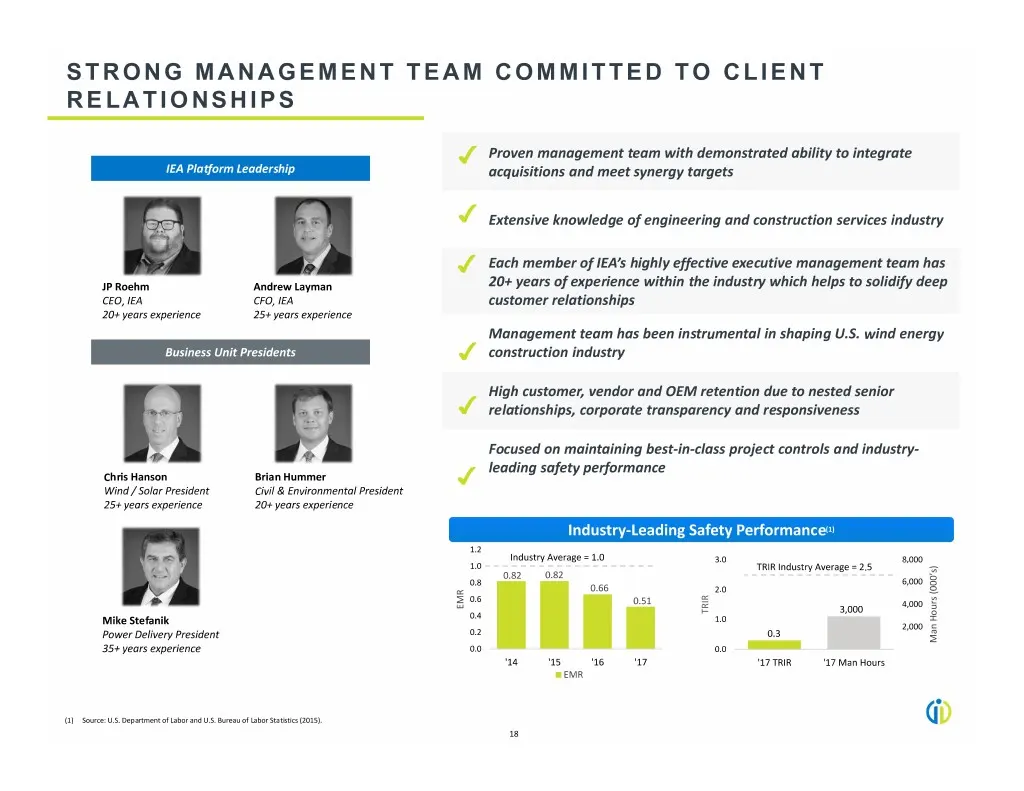
STRONG MANAGEMENT TEAM COMMITTED TO CLIENT RELATIONSHIPS ✔ Proven management team with demonstrated ability to integrate IEA Platform Leadership acquisitions and meet synergy targets ✔ Extensive knowledge of engineering and construction services industry ✔ Each member of IEA’s highly effective execu
Slide 19: EBITDA Adjustments
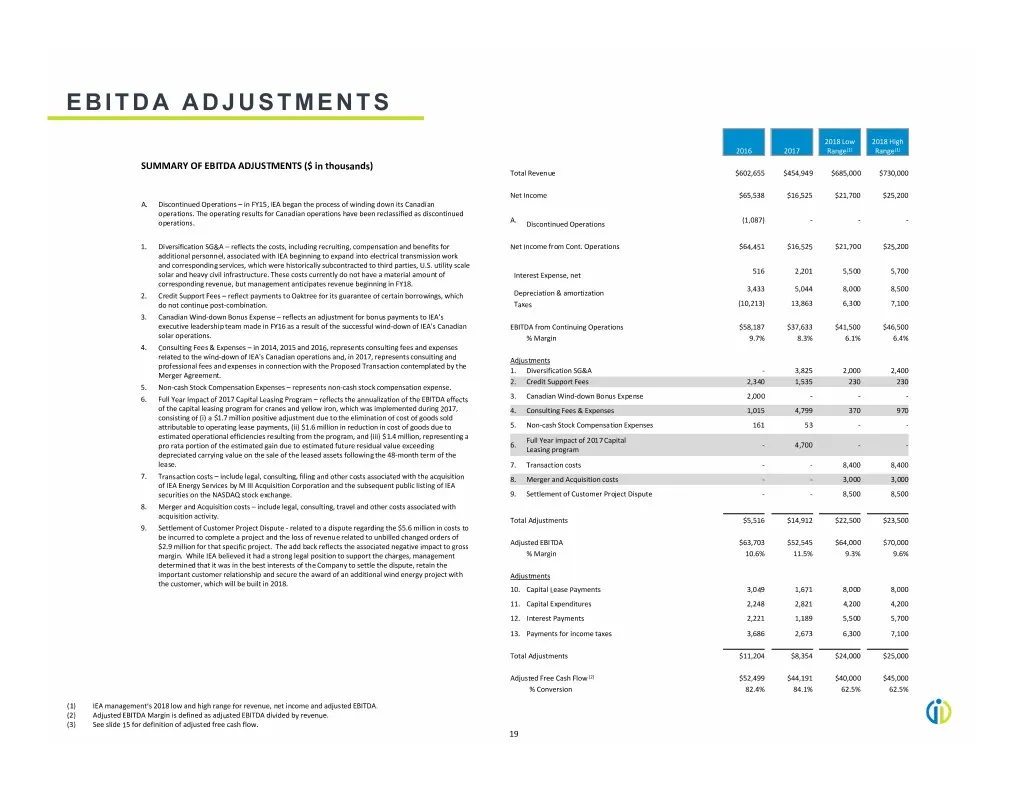
EBITDA ADJUSTMENTS 2018 Low 2018 High 2016 2017 Range(1) Range(1) SUMMARY OF EBITDA ADJUSTMENTS ($ in thousands) Total Revenue $602,655 $454,949 $685,000 $730,000 Net Income $65,538 $16,525 $21,700 $25,200 A. Discontinued Operations – in FY15, IEA began the process of winding down its Canadian opera
Slide 20: Thank You
THANK YOU Investor Relations Contact: Financial Profiles Kimberly Esterkin, Senior Vice President [email protected] 310.622.8235
Source: SEC EDGAR · 8-K filed Aug 27, 2018
More decks from Infrastructure and Energy Alternatives Inc
 Q1 2022 Earnings Presentation23 slides · May 9, 2022
 Q4 2021 Earnings Presentation24 slides · Mar 7, 2022
 FY2020 Earnings Presentation20 slides · Mar 8, 2021
 Q4 2019 Earnings Presentation23 slides · Mar 10, 2020
 Q3 2019 Earnings Presentation19 slides · Nov 12, 2019
 Investor Presentation (October 2019)15 slides · Oct 30, 2019