Mr. Cooper — Nationstar Mortgage Holdings — Investor Presentation (February 2013)
19 slides from Mr. Cooper's investor presentation, Feb 12, 2013
Slide 1: Investor Presentation February 2013
Exhibit 99.1 Investor Presentation February 2013 Financial data as of September 30, 2012
Slide 2: Forward Looking Statements
Forward Looking Statements Anystatementsin thispresentationthat arenothistoricalor currentfactsareforward-looking statements.Forward-looking statementsinclude, without limitation, statements concerning plans, objectives, goals, projections, strategies, future events or performance, and underlying as
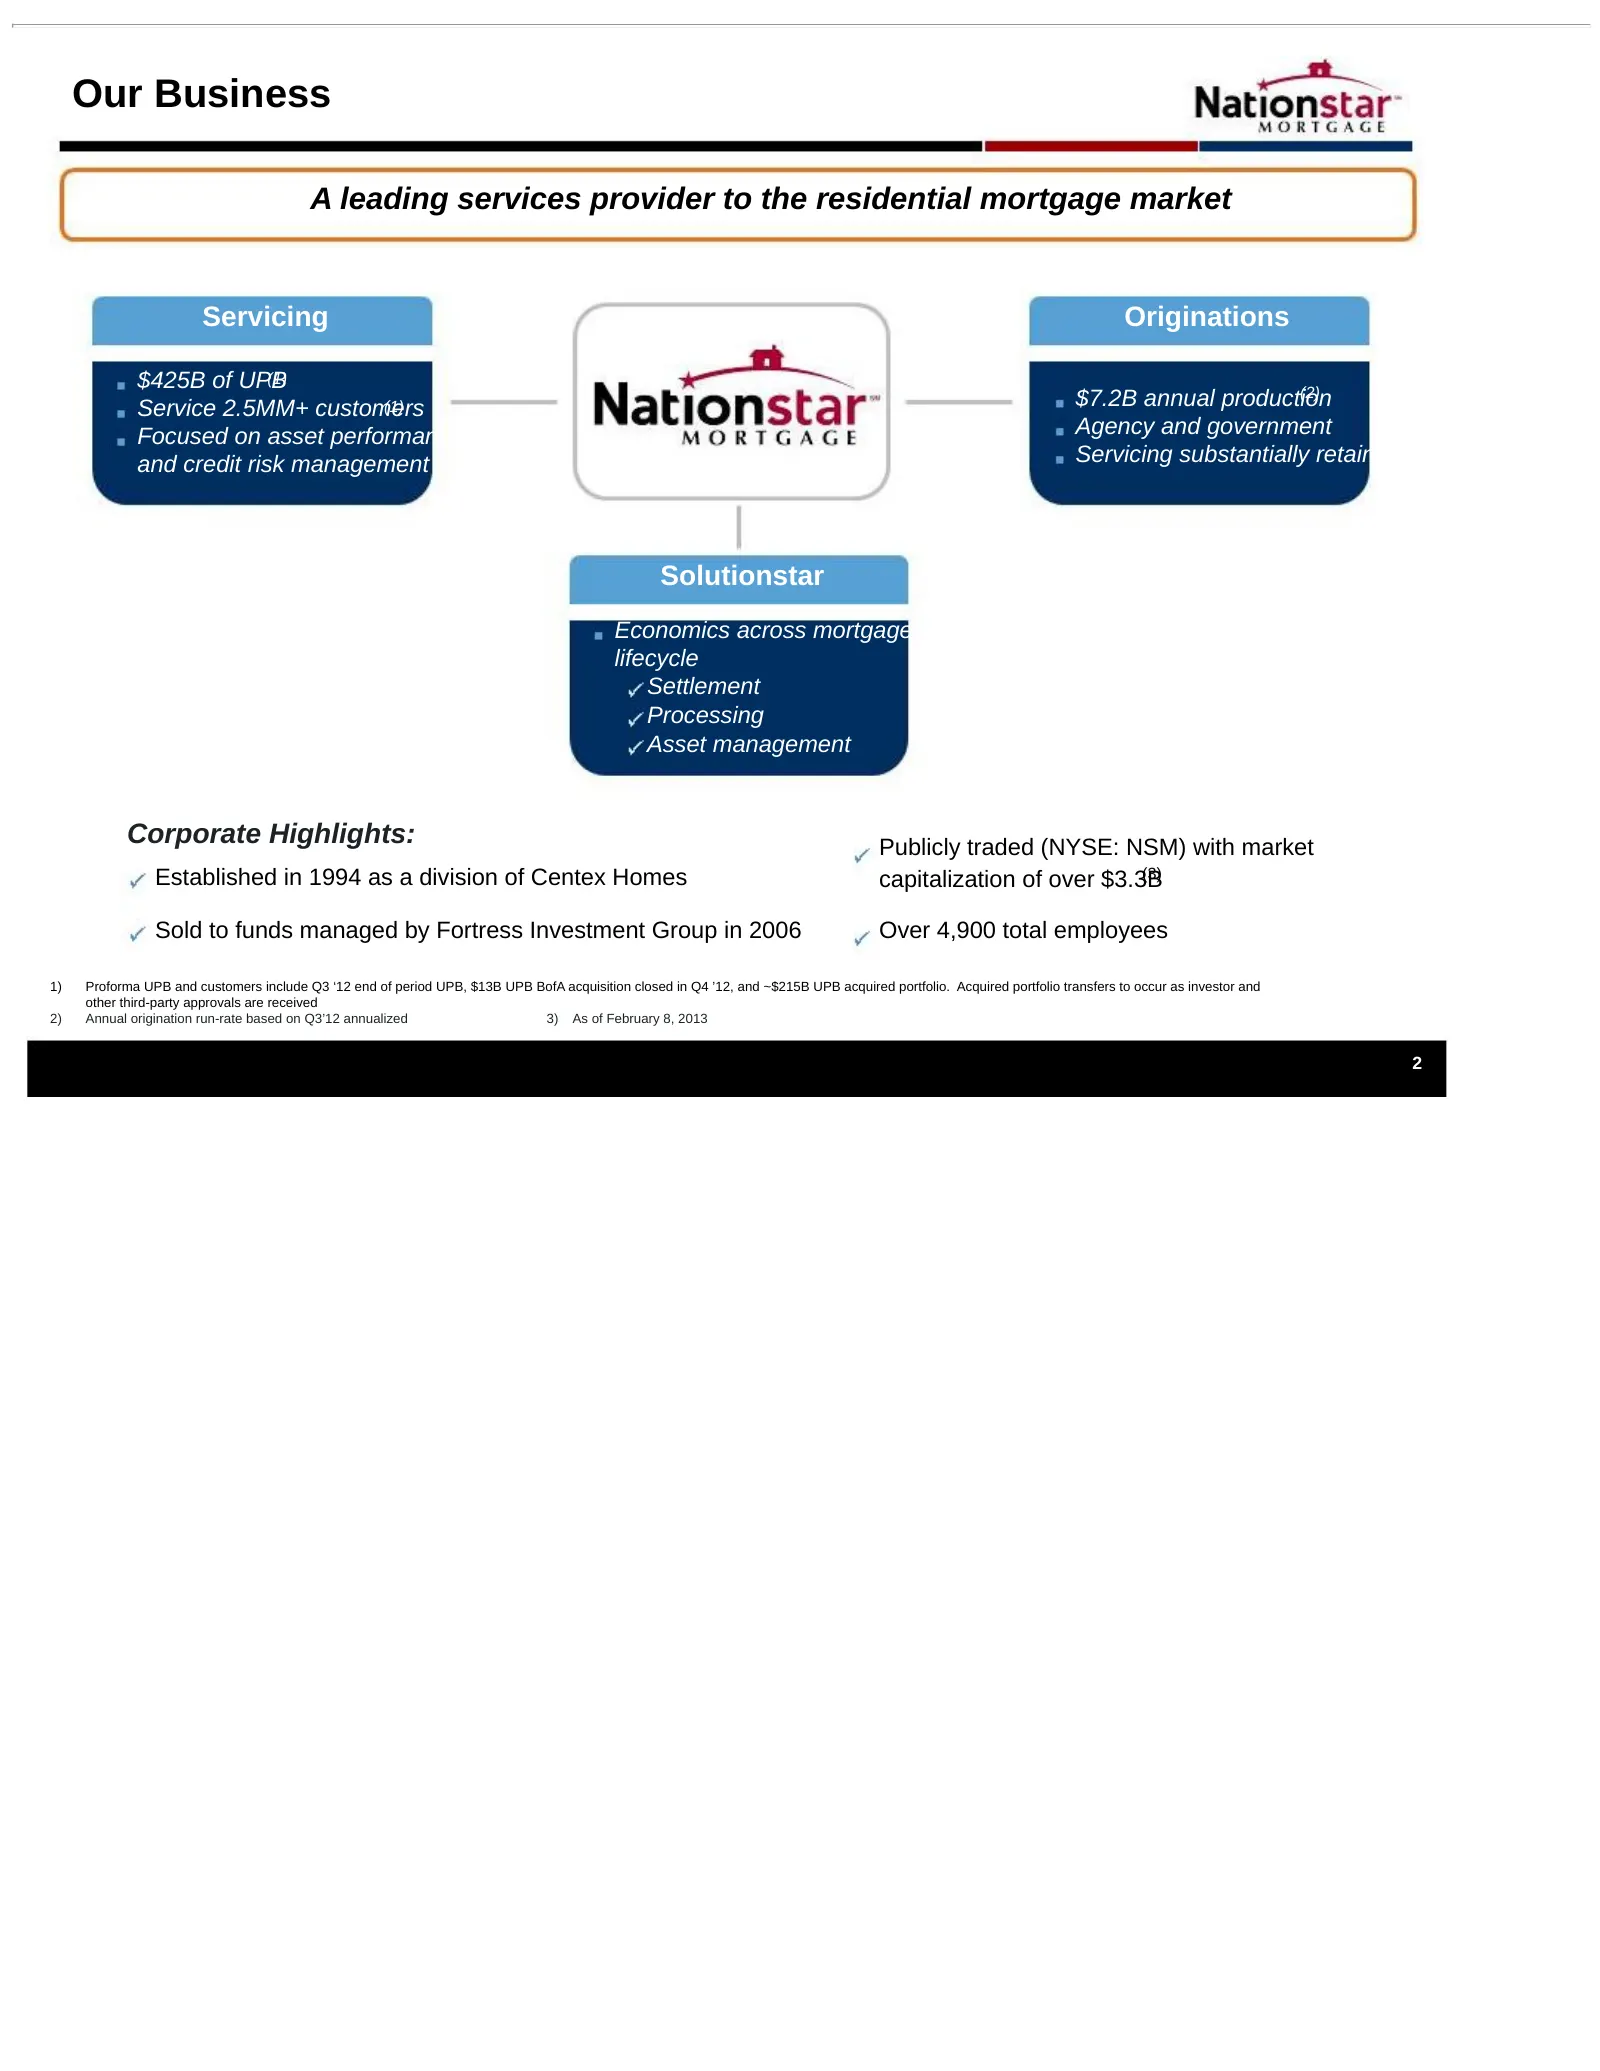
Slide 3: Our Business
Our Business A leading services provider to the residential mortgage market Servicing Originations $425B of UPB (1) (2) Service 2.5MM+ customers (1) $7.2B annual production Focused on asset performance Agency and government and credit risk management Servicing substantially retained Solutionstar Eco
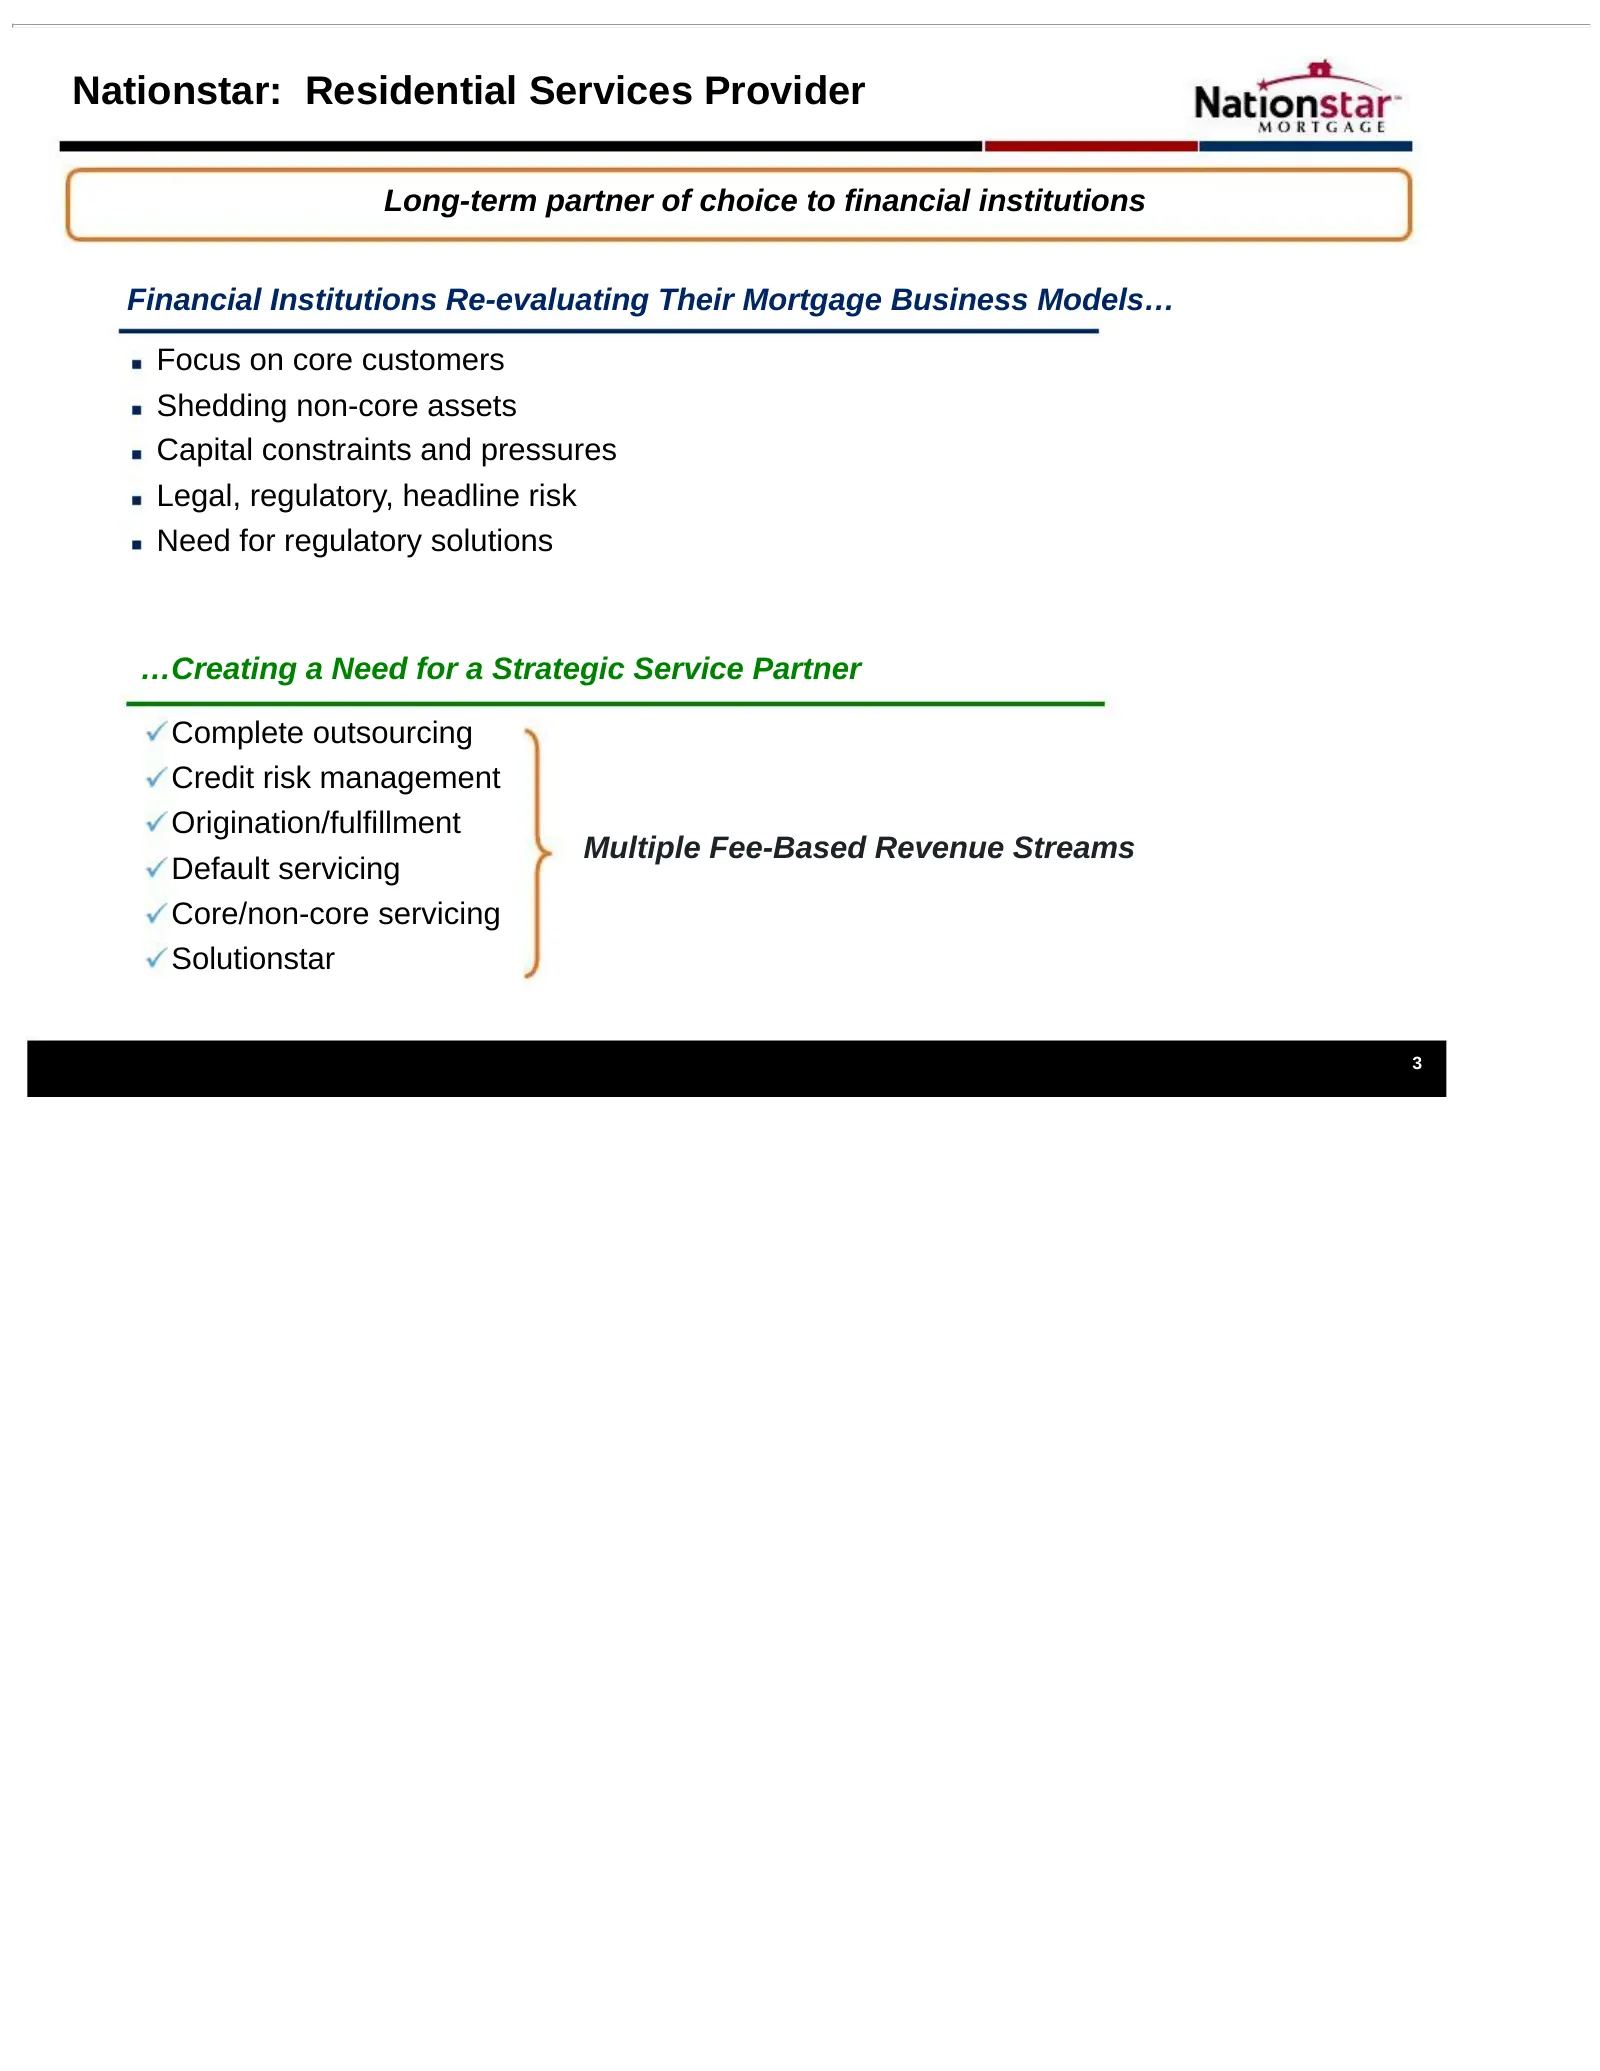
Slide 4: Nationstar: Residential Services Provider
Nationstar: Residential Services Provider Long-term partner of choice to financial institutions Financial Institutions Re-evaluating Their Mortgage Business Models… Focus on core customers Shedding non-core assets Capital constraints and pressures Legal, regulatory, headline risk Need for regulatory
Slide 5: Nationstar: Residential Services Provider
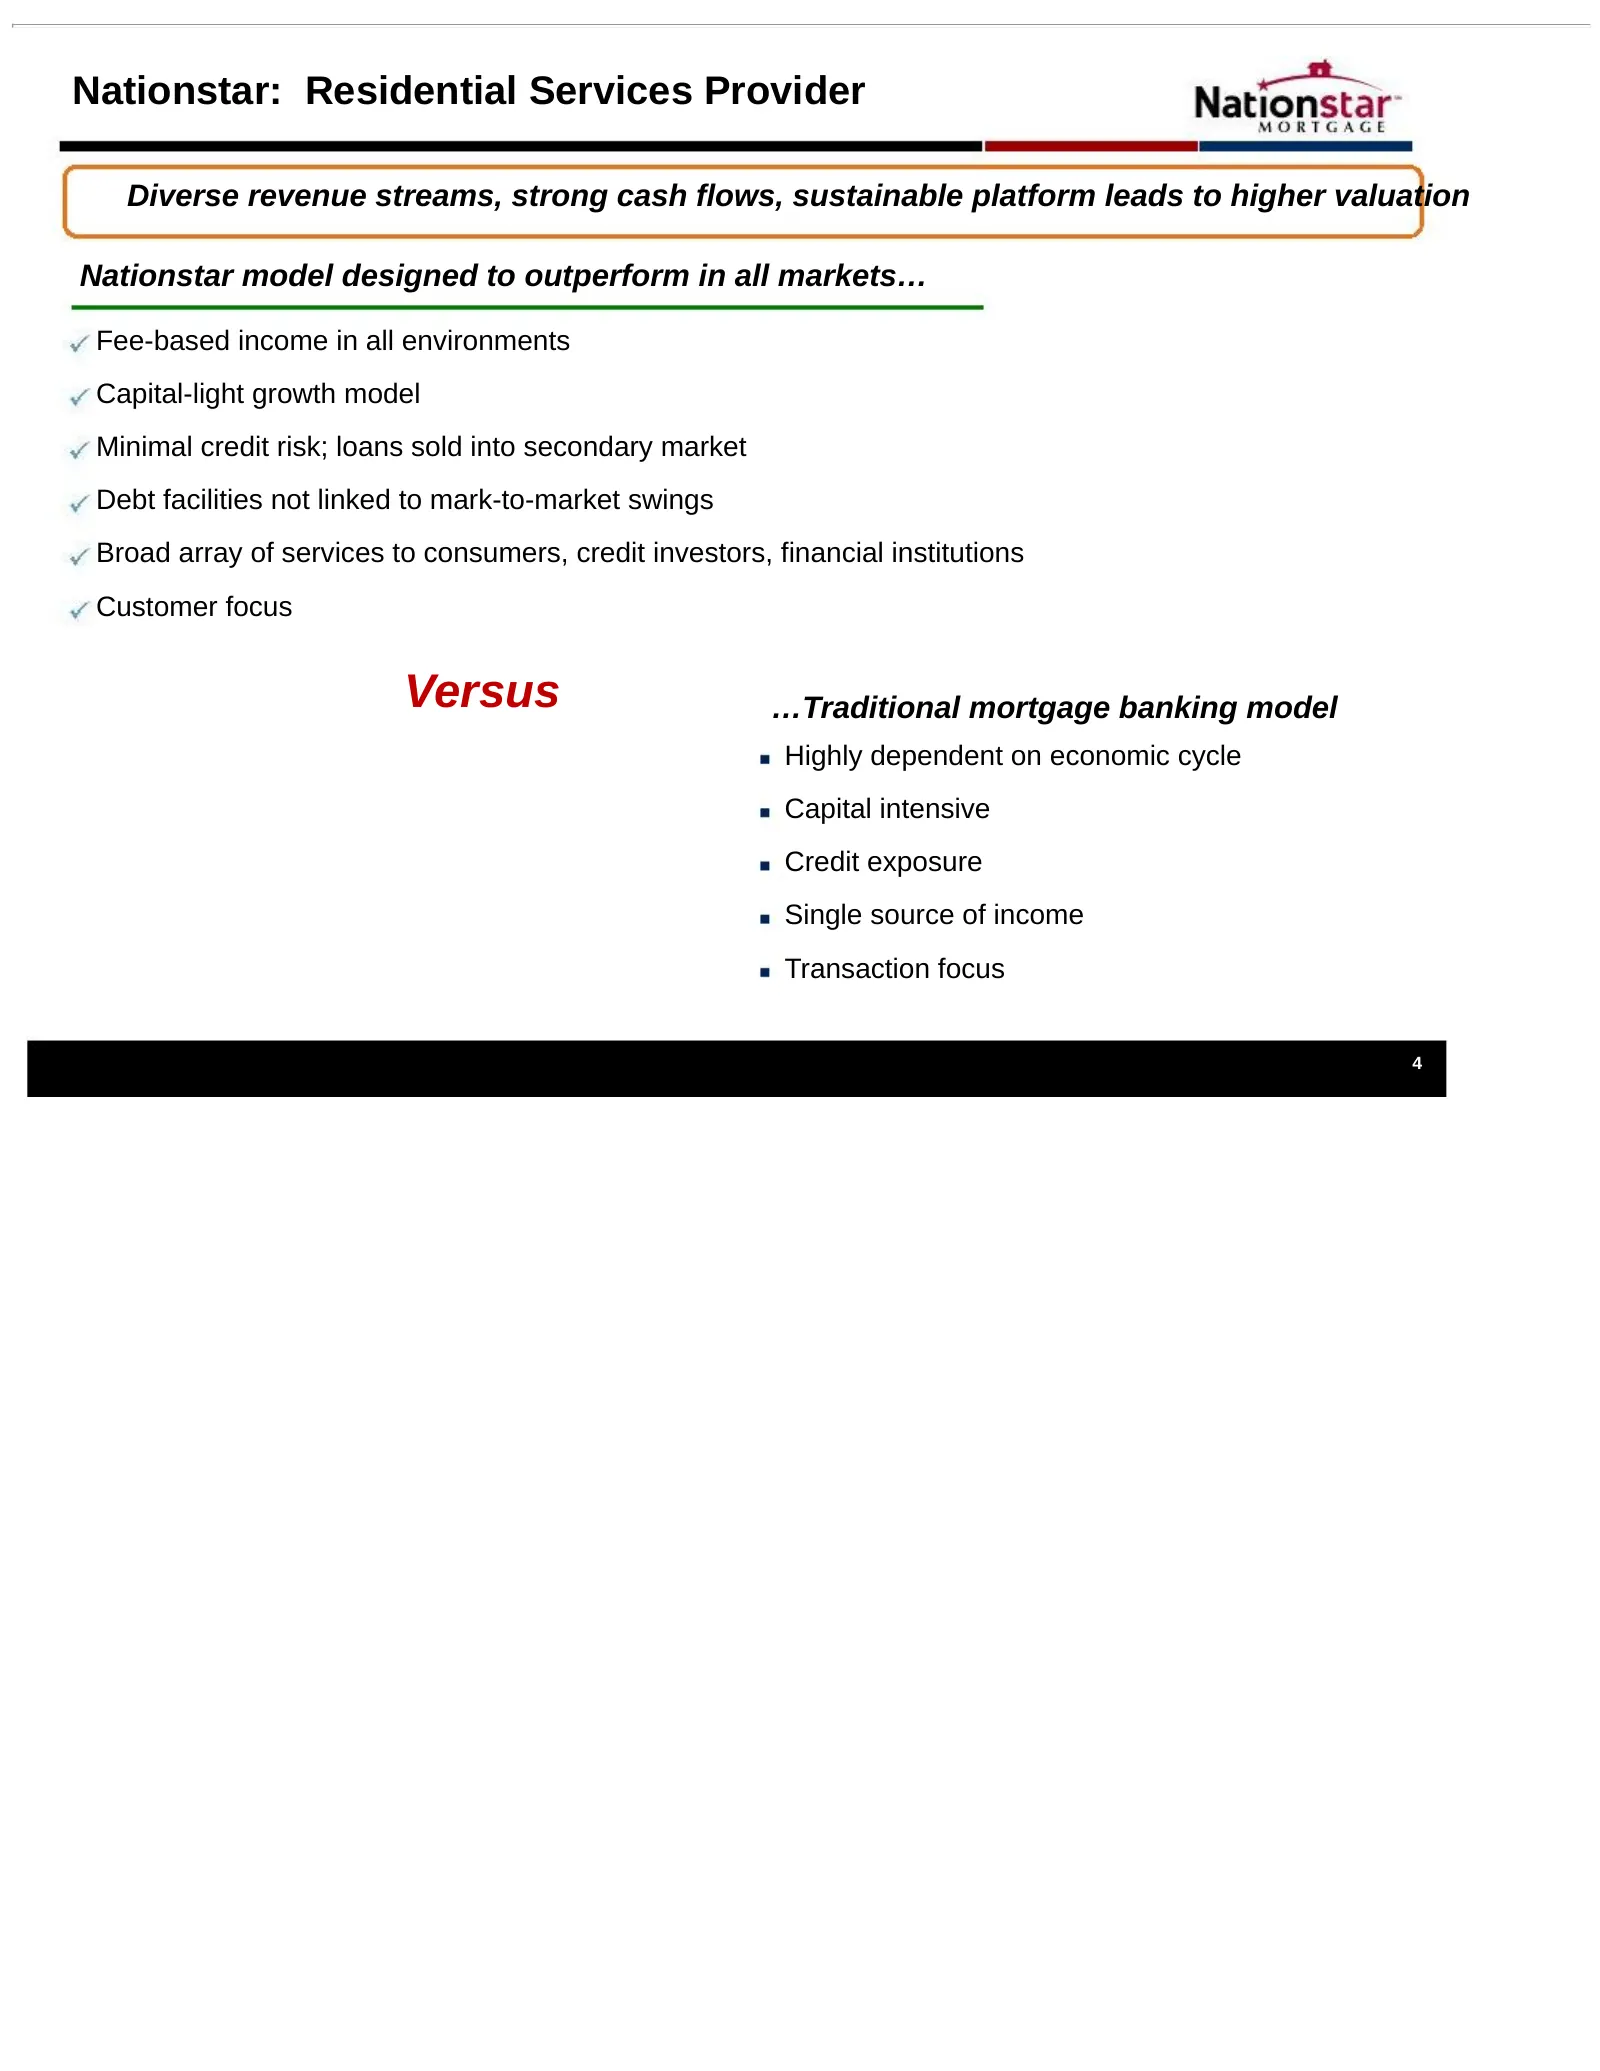
Nationstar: Residential Services Provider Diverse revenue streams, strong cash flows, sustainable platform leads to higher valuation Nationstar model designed to outperform in all markets… Fee-based income in all environments Capital-light growth model Minimal credit risk; loans sold into secondary
Slide 6: BofA Portfolio Acquisition – Landmark Acquisition
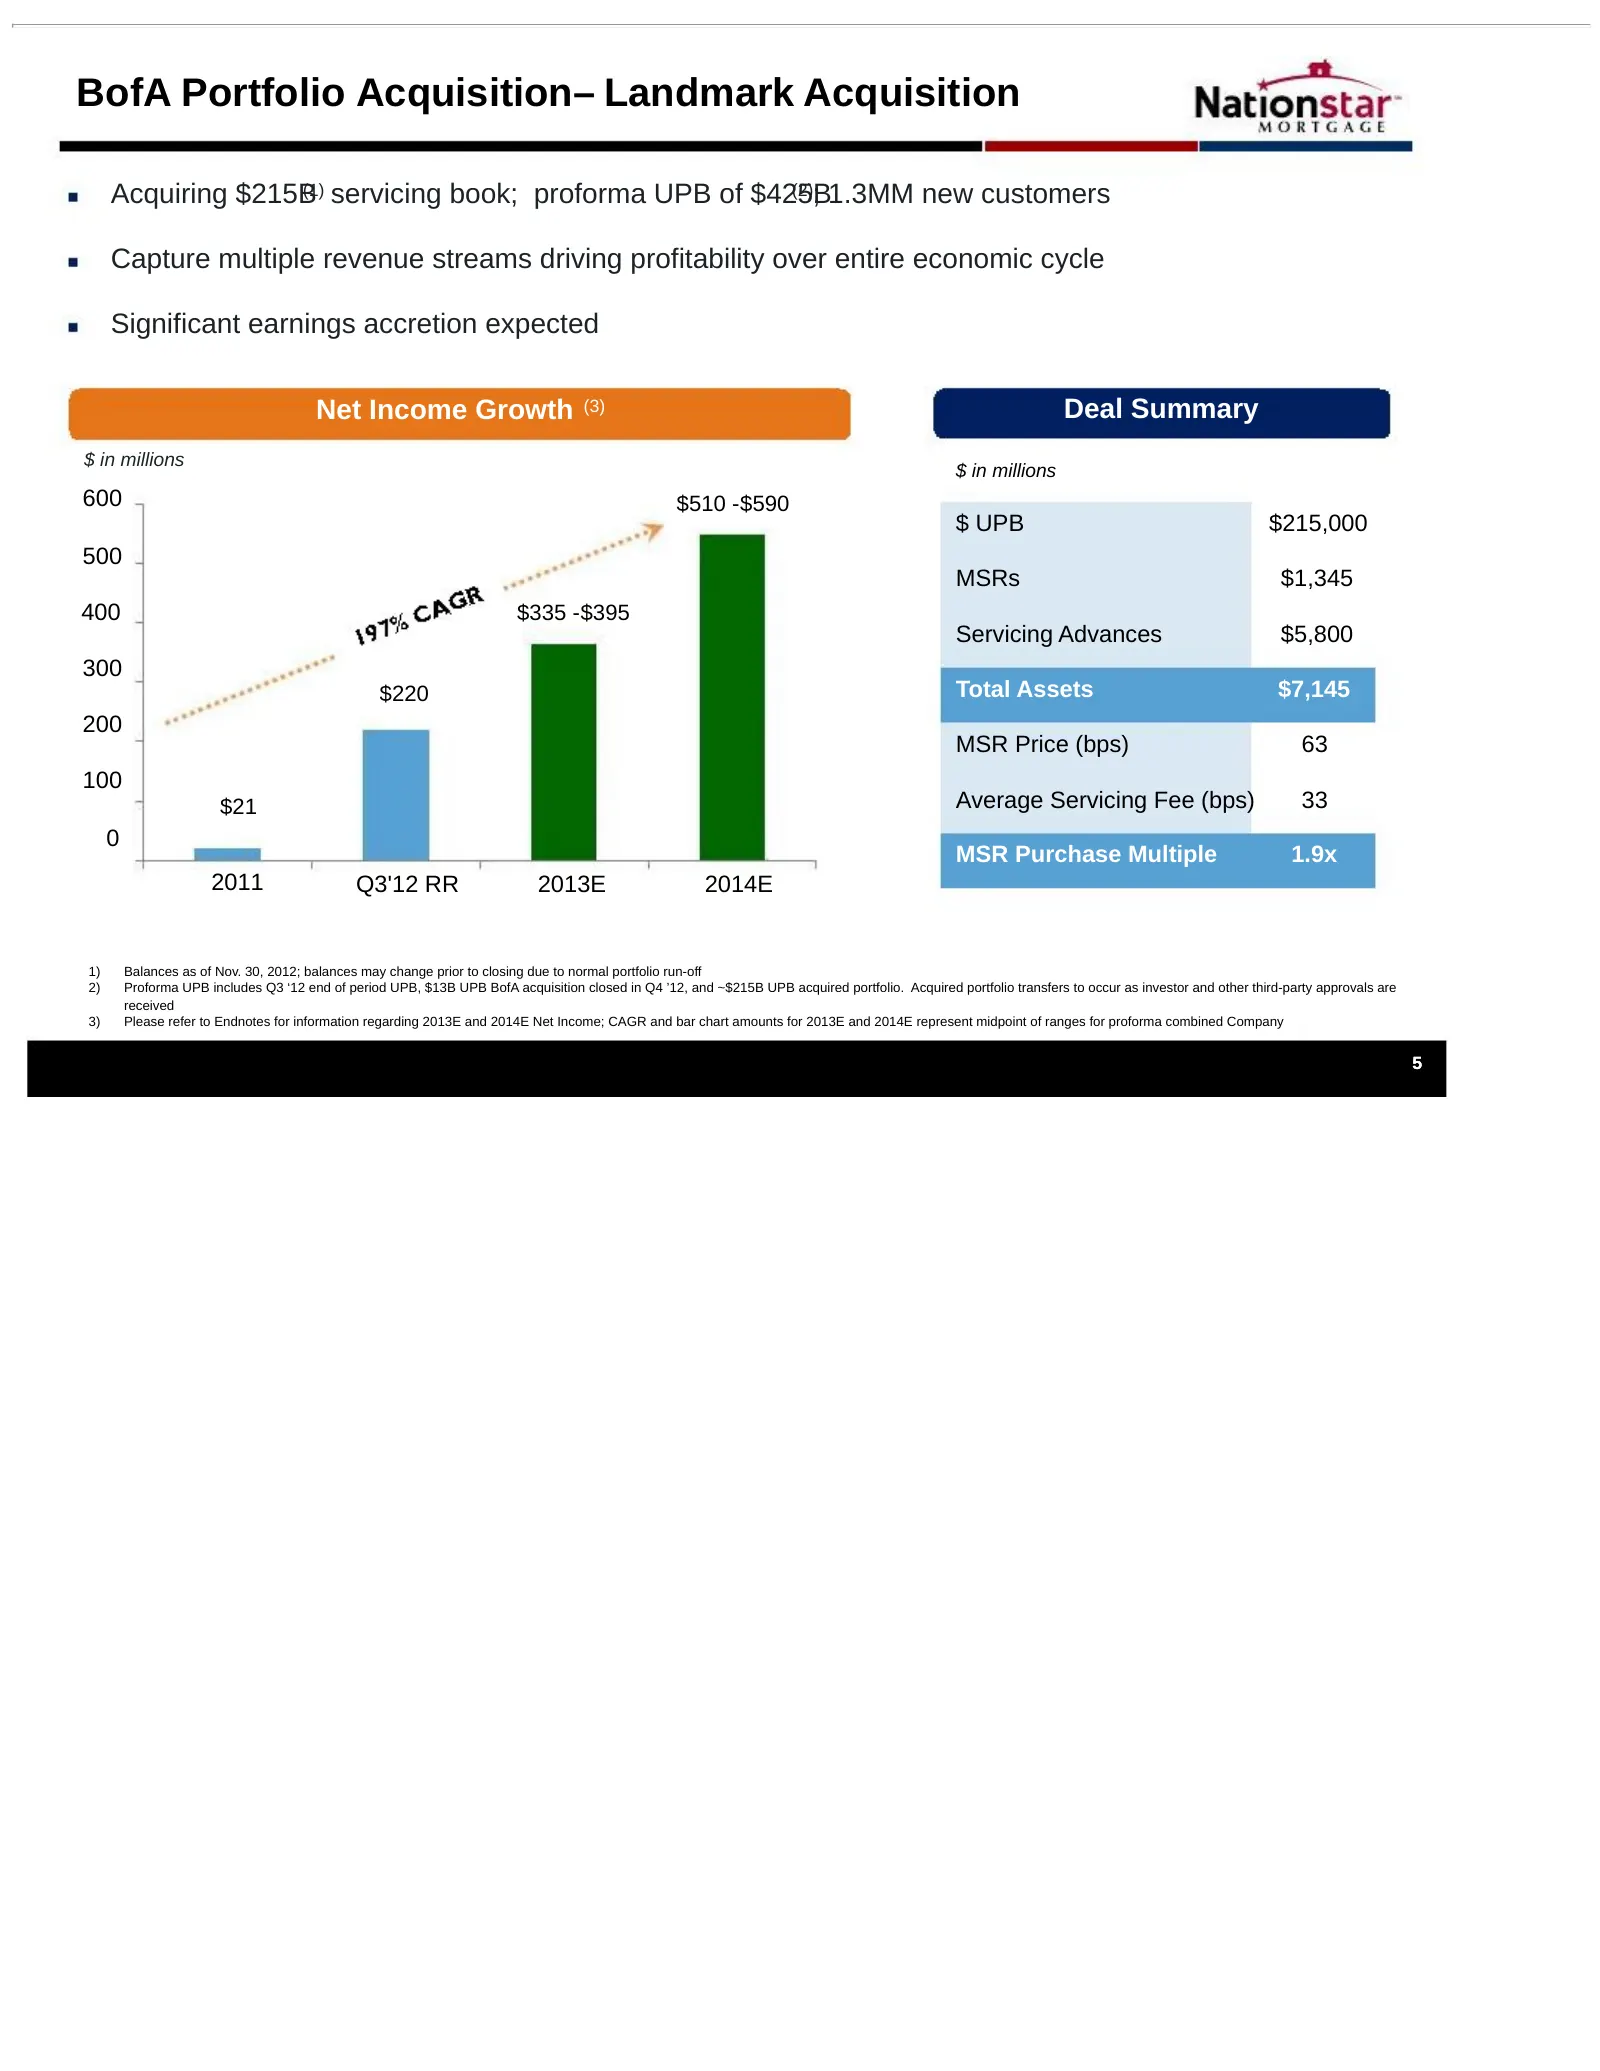
BofA Portfolio Acquisition– Landmark Acquisition Acquiring $215B(1) servicing book; proforma UPB of $425B (2); 1.3MM new customers Capture multiple revenue streams driving profitability over entire economic cycle Significant earnings accretion expected Net Income Growth (3) Deal Summary $ in million
Slide 7: Earnings Estimates
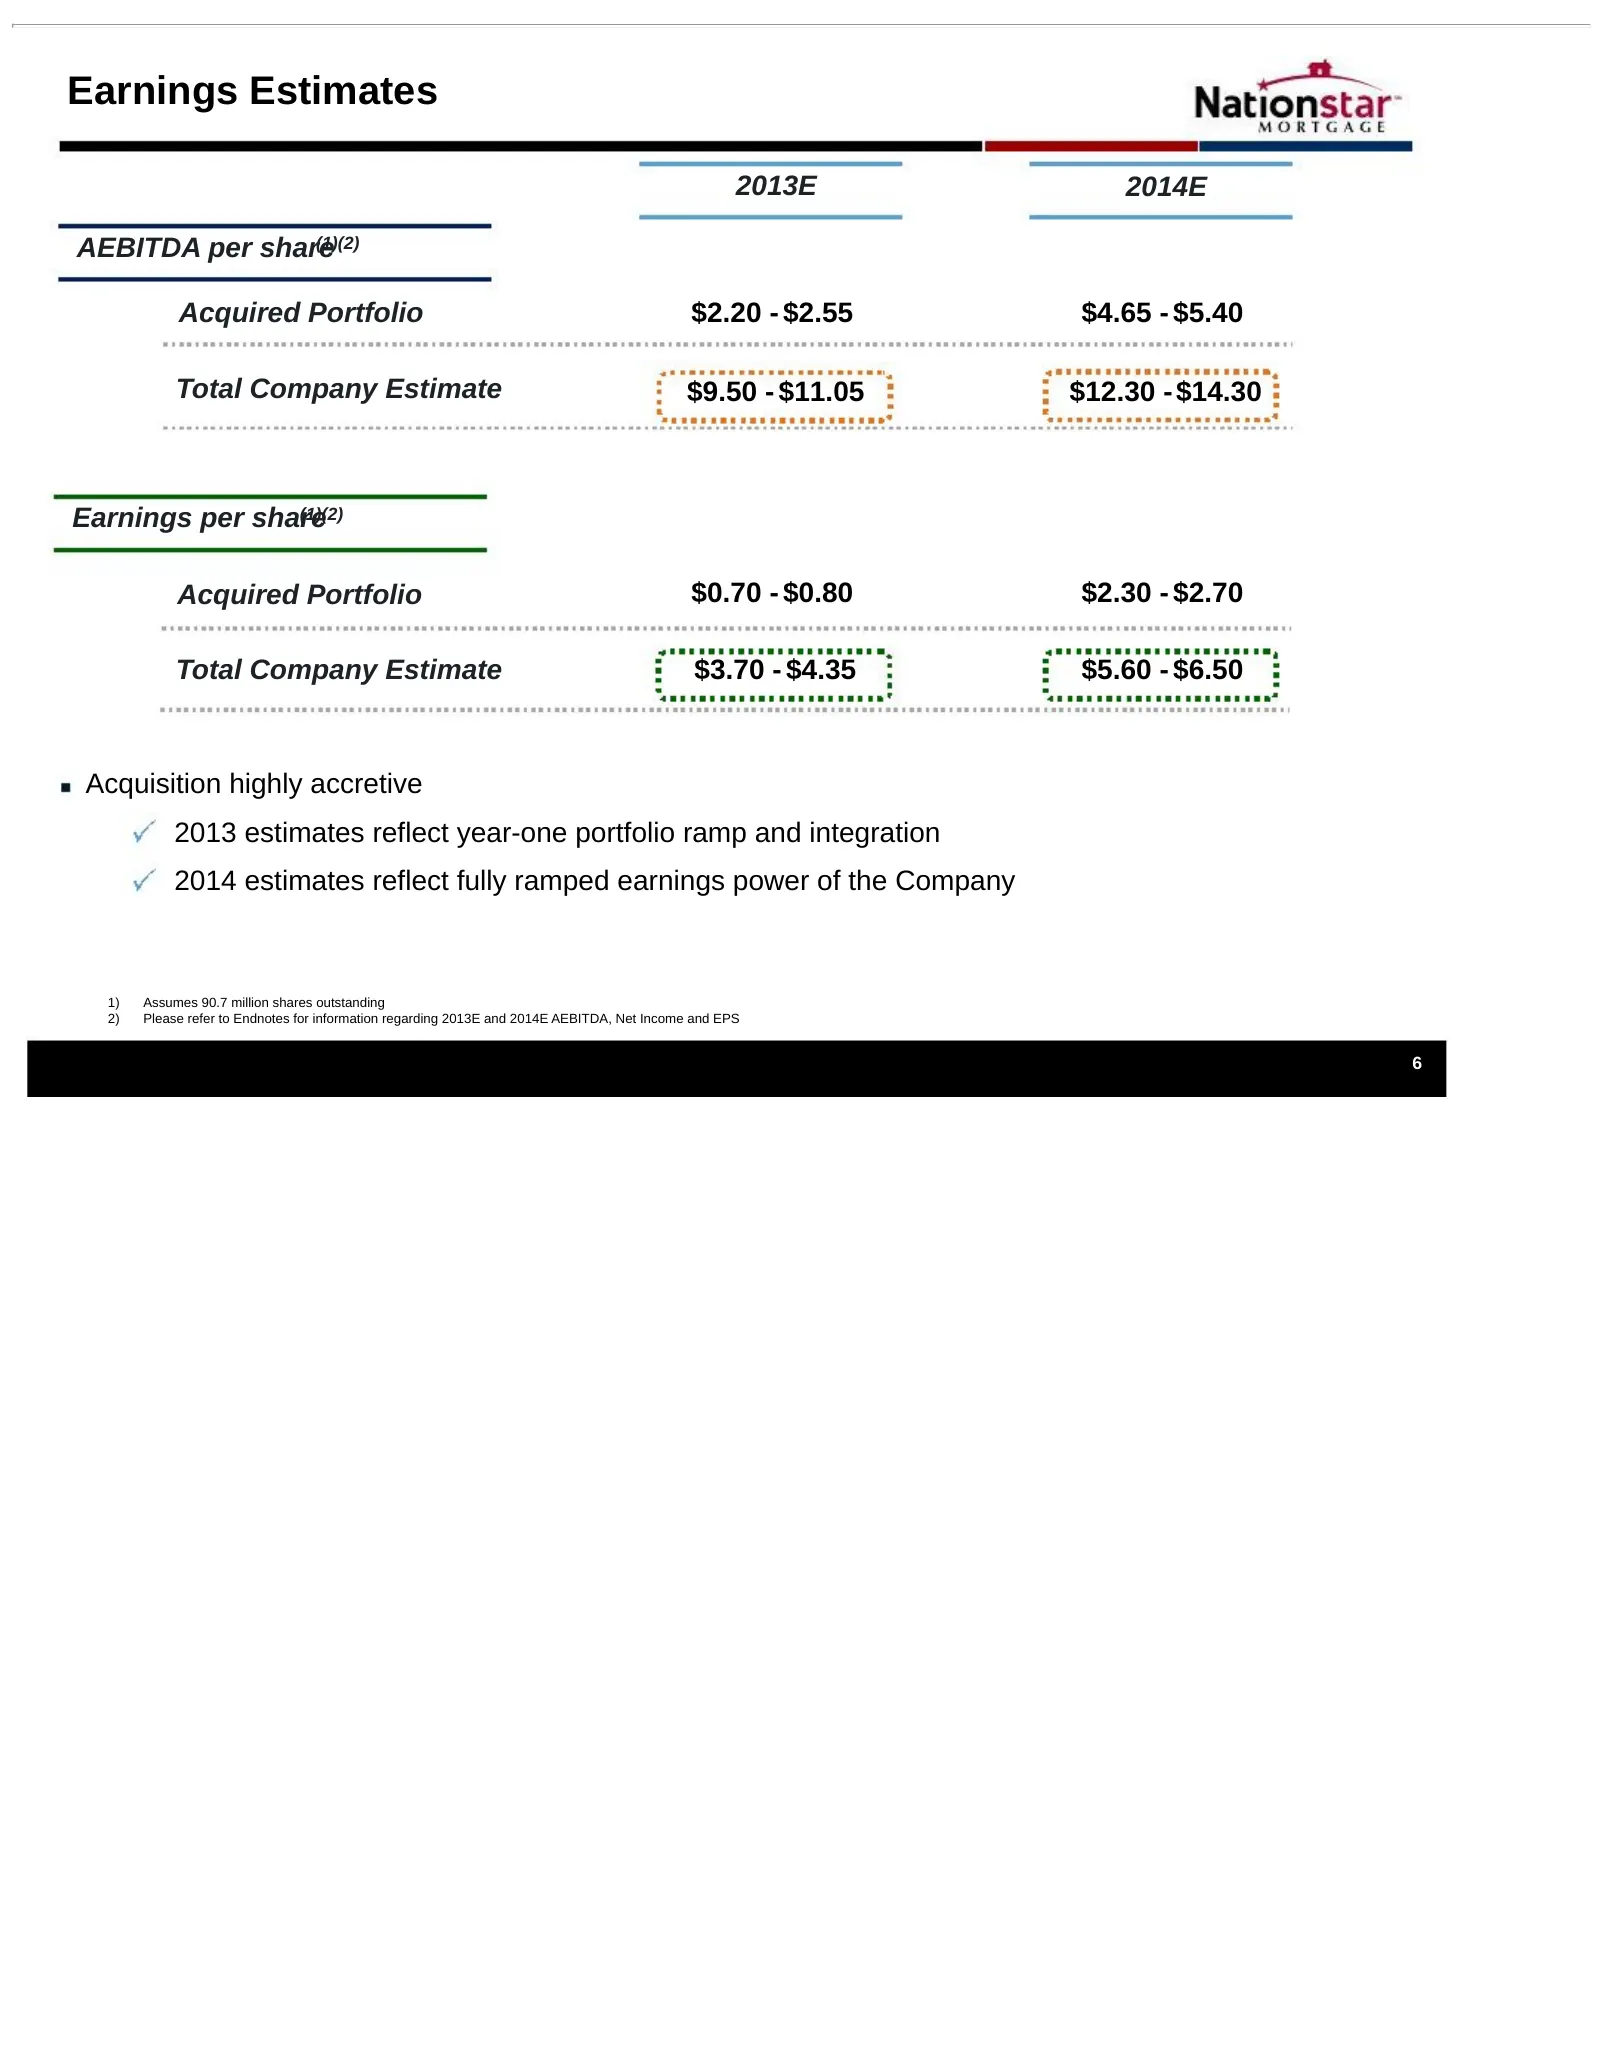
Earnings Estimates 2013E 2014E AEBITDA per share (1)(2) Acquired Portfolio $2.20 - $2.55 $4.65 - $5.40 Total Company Estimate $9.50 - $11.05 $12.30 - $14.30 Earnings per share (1)(2) Acquired Portfolio $0.70 - $0.80 $2.30 - $2.70 Total Company Estimate $3.70 - $4.35 $5.60 - $6.50 Acquisition highly
Slide 8: Future Growth Opportunities
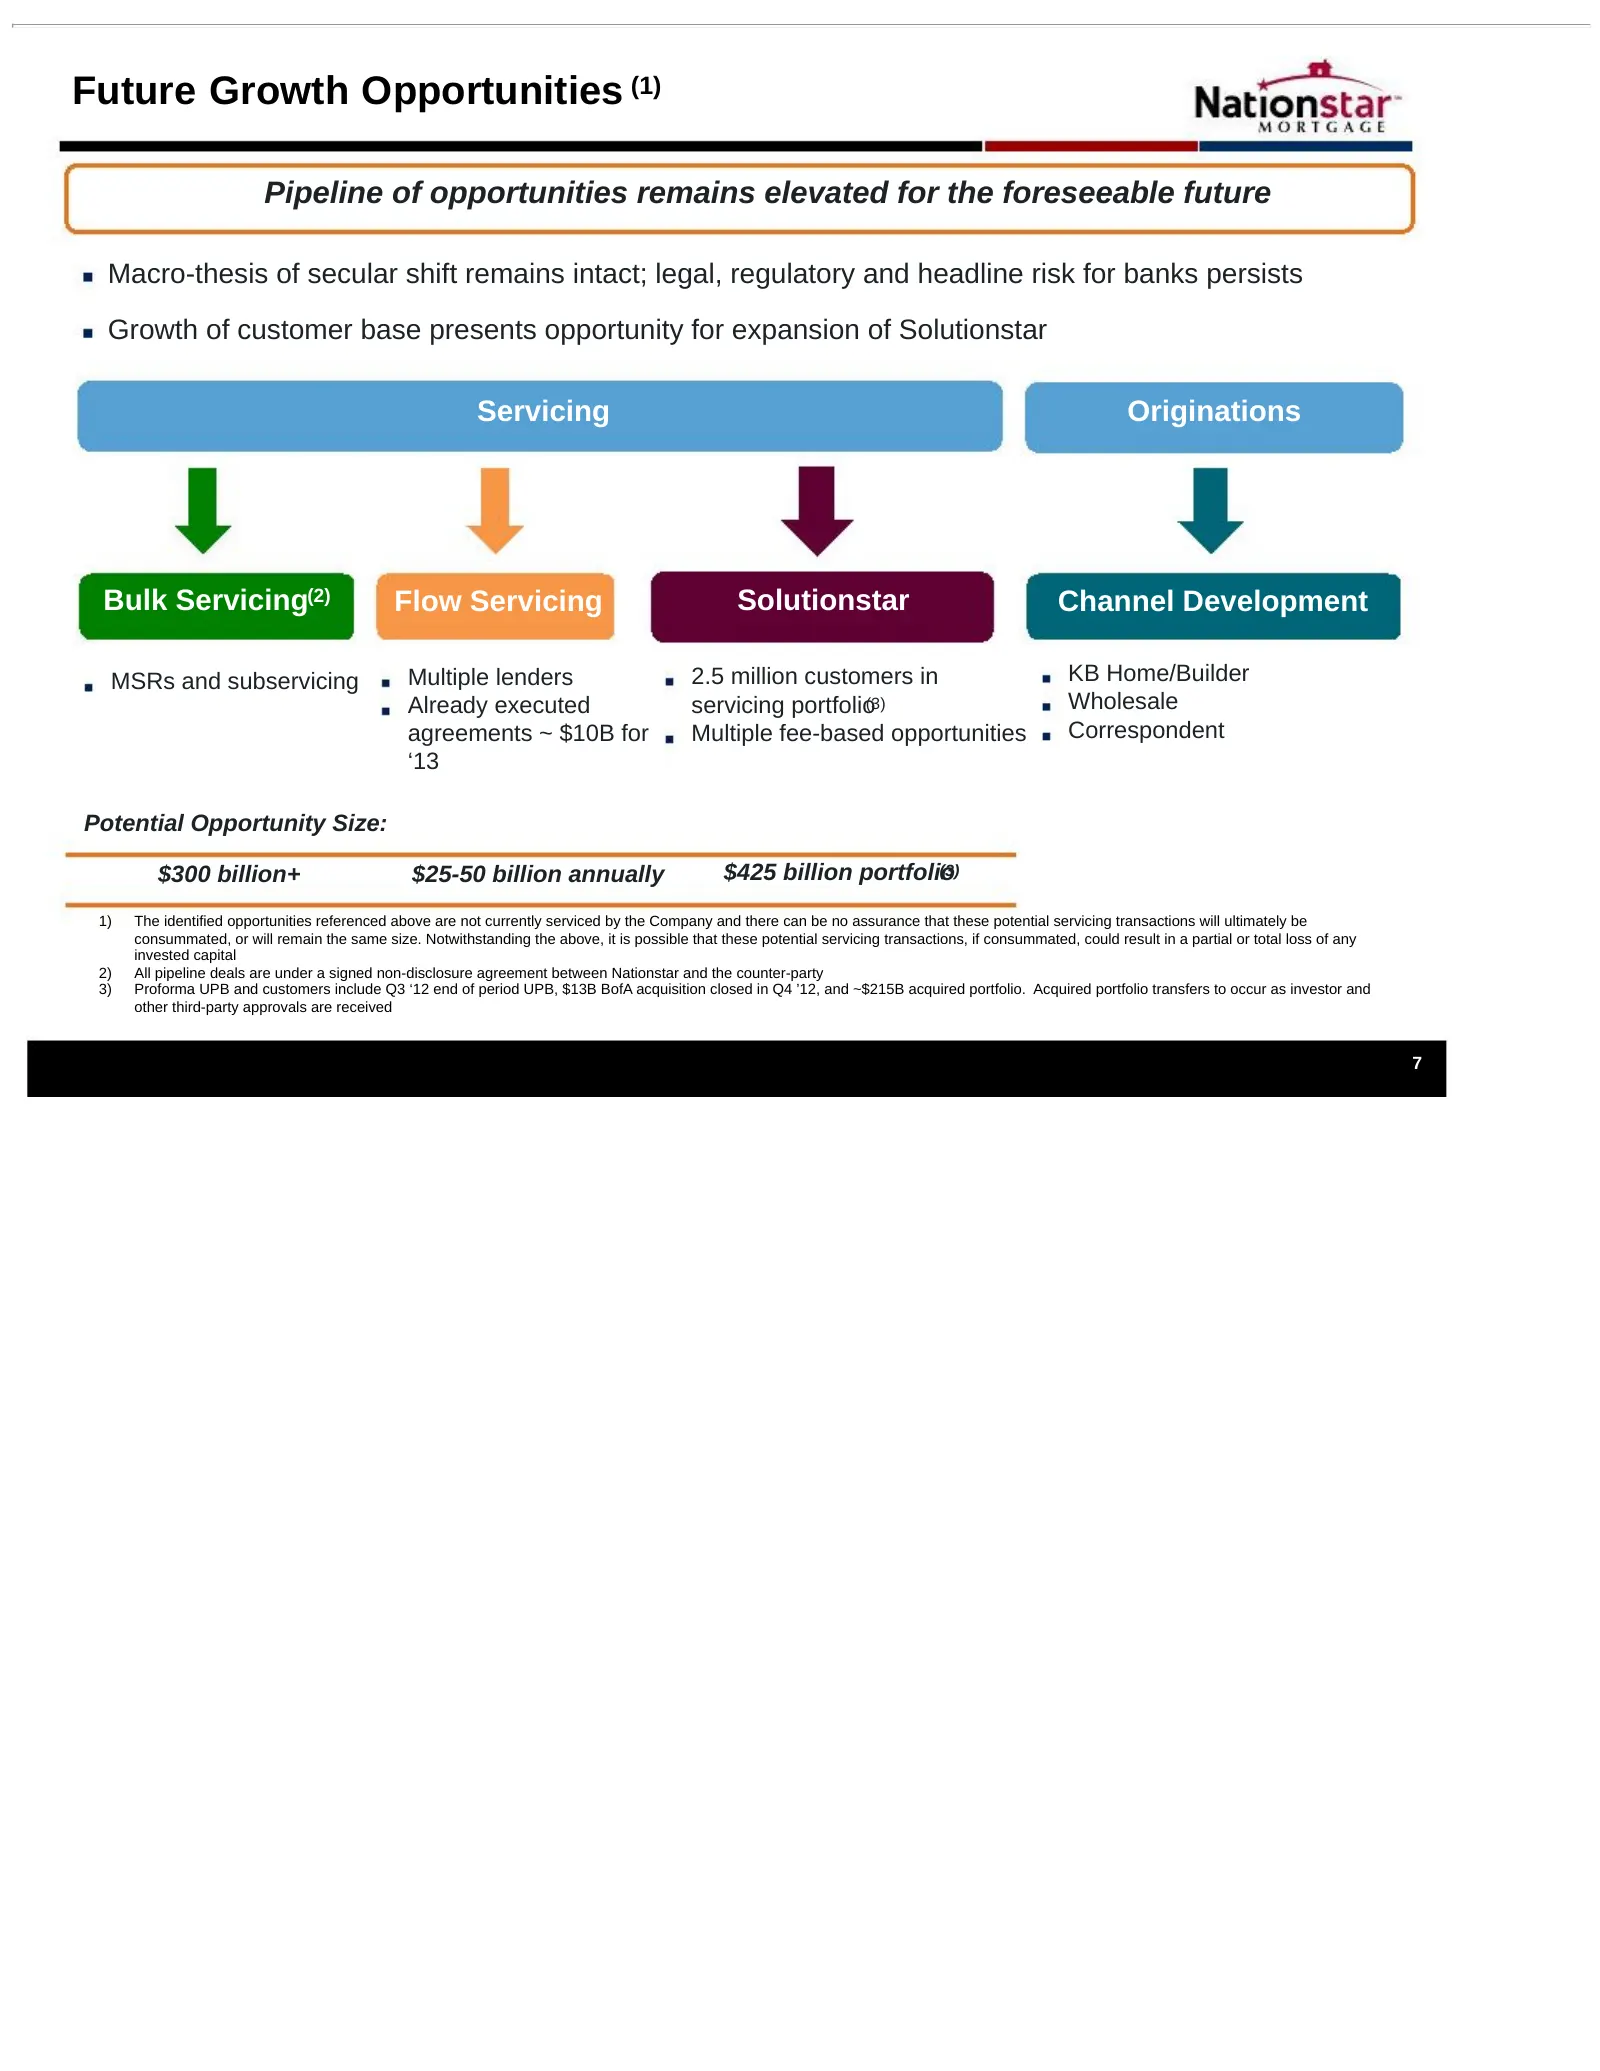
Future Growth Opportunities (1) Pipeline of opportunities remains elevated for the foreseeable future Macro-thesis of secular shift remains intact; legal, regulatory and headline risk for banks persists Growth of customer base presents opportunity for expansion of Solutionstar Servicing Originations
Slide 9: Servicing Profitability Ramp
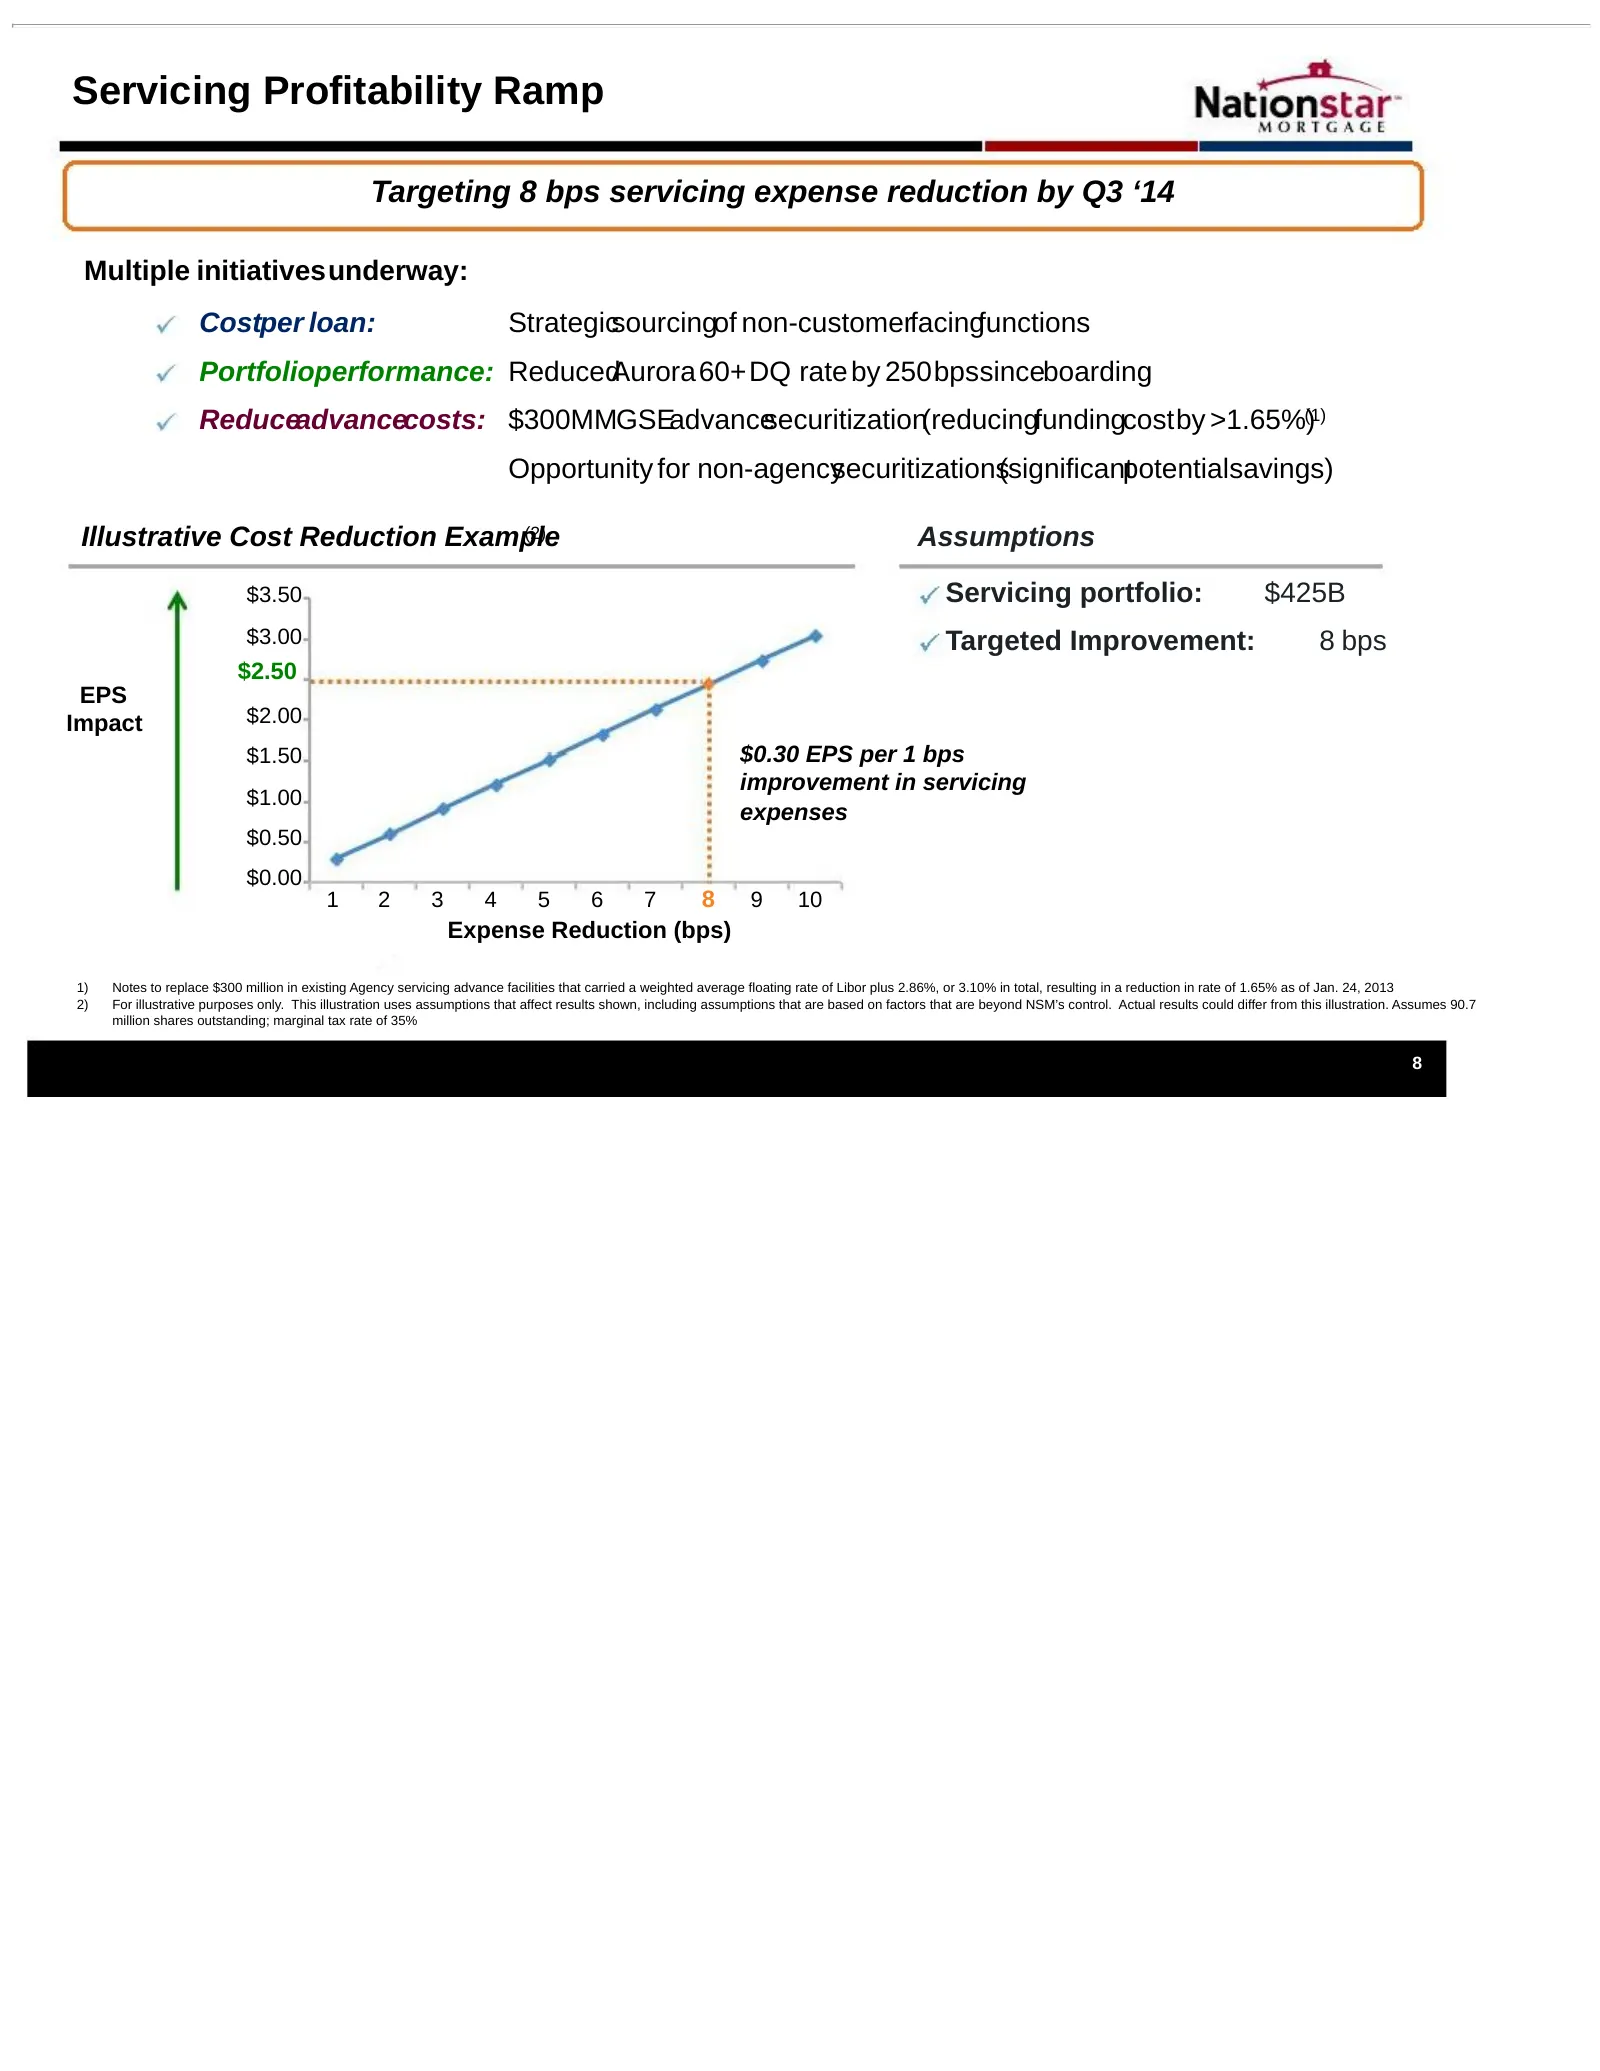
Servicing Profitability Ramp Targeting 8 bps servicing expense reduction by Q3 ‘14 Multiple initiativesunderway: Costper loan: Strategicsourcingof non-customerfacingfunctions Portfolioperformance: ReducedAurora 60+DQ rate by 250bpssinceboarding Reduceadvancecosts: $300MMGSEadvancesecuritization(redu
Slide 10: Advance Securitization: Significant Earnings Catalyst
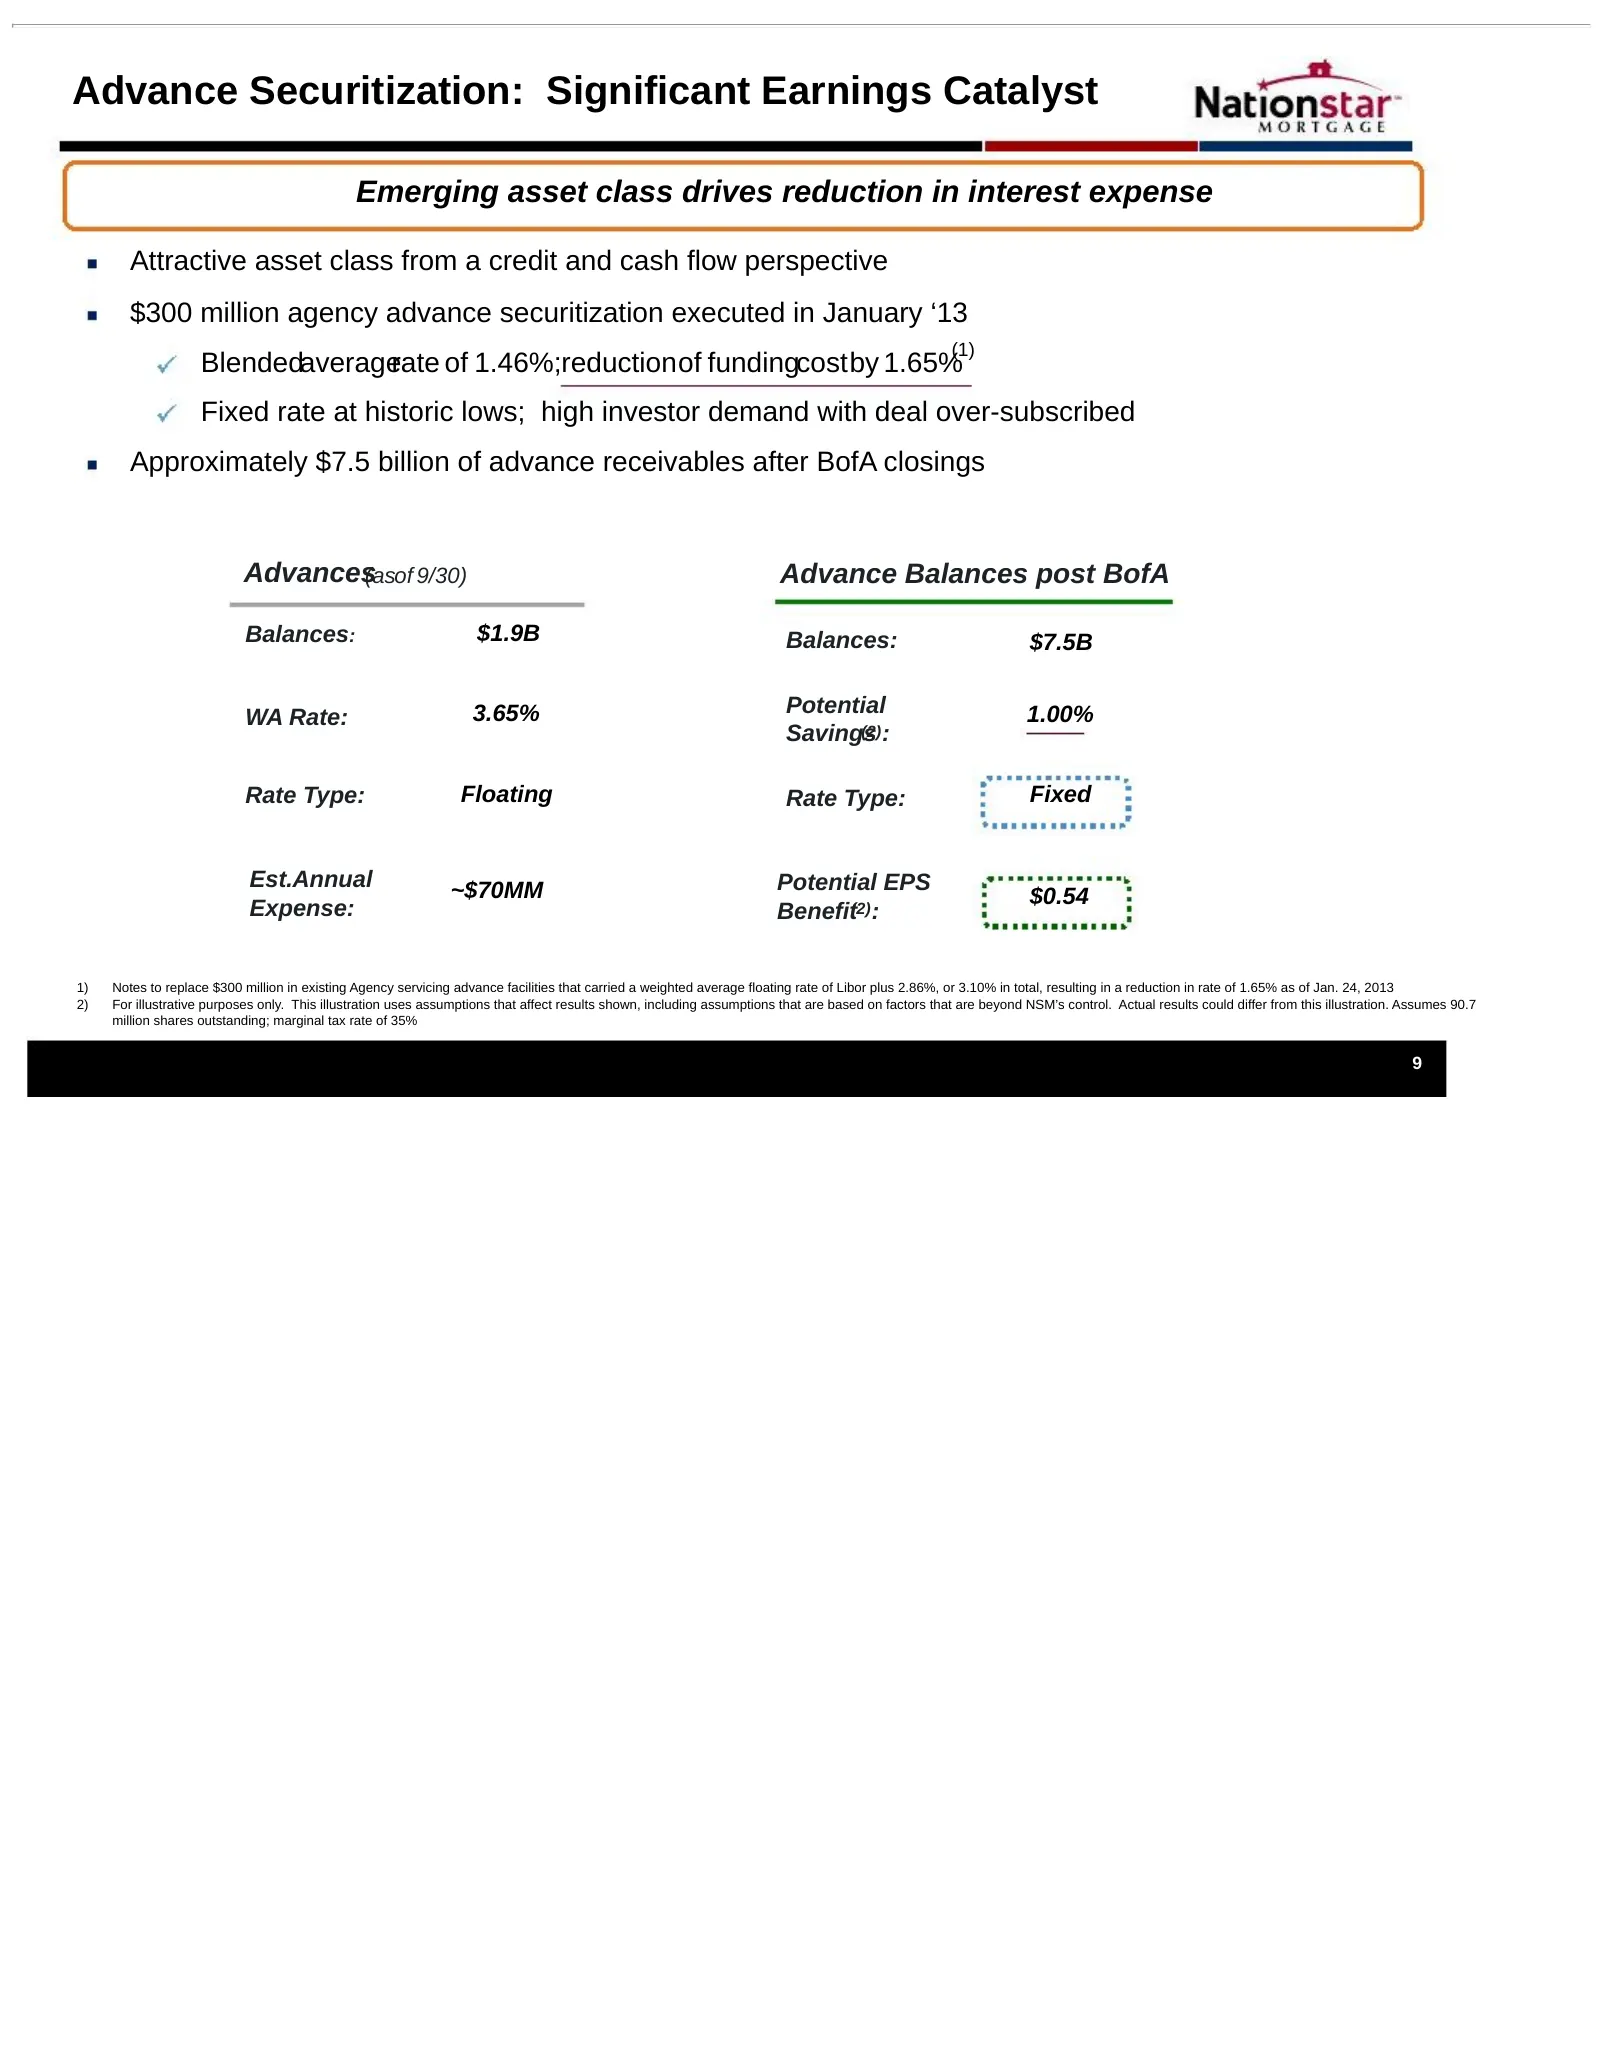
Advance Securitization: Significant Earnings Catalyst Emerging asset class drives reduction in interest expense Attractive asset class from a credit and cash flow perspective $300 million agency advance securitization executed in January ‘13 (1) Blendedaveragerate of 1.46%;reductionof fundingcostby
Slide 11: Originations: Enhances Core Servicing Platform
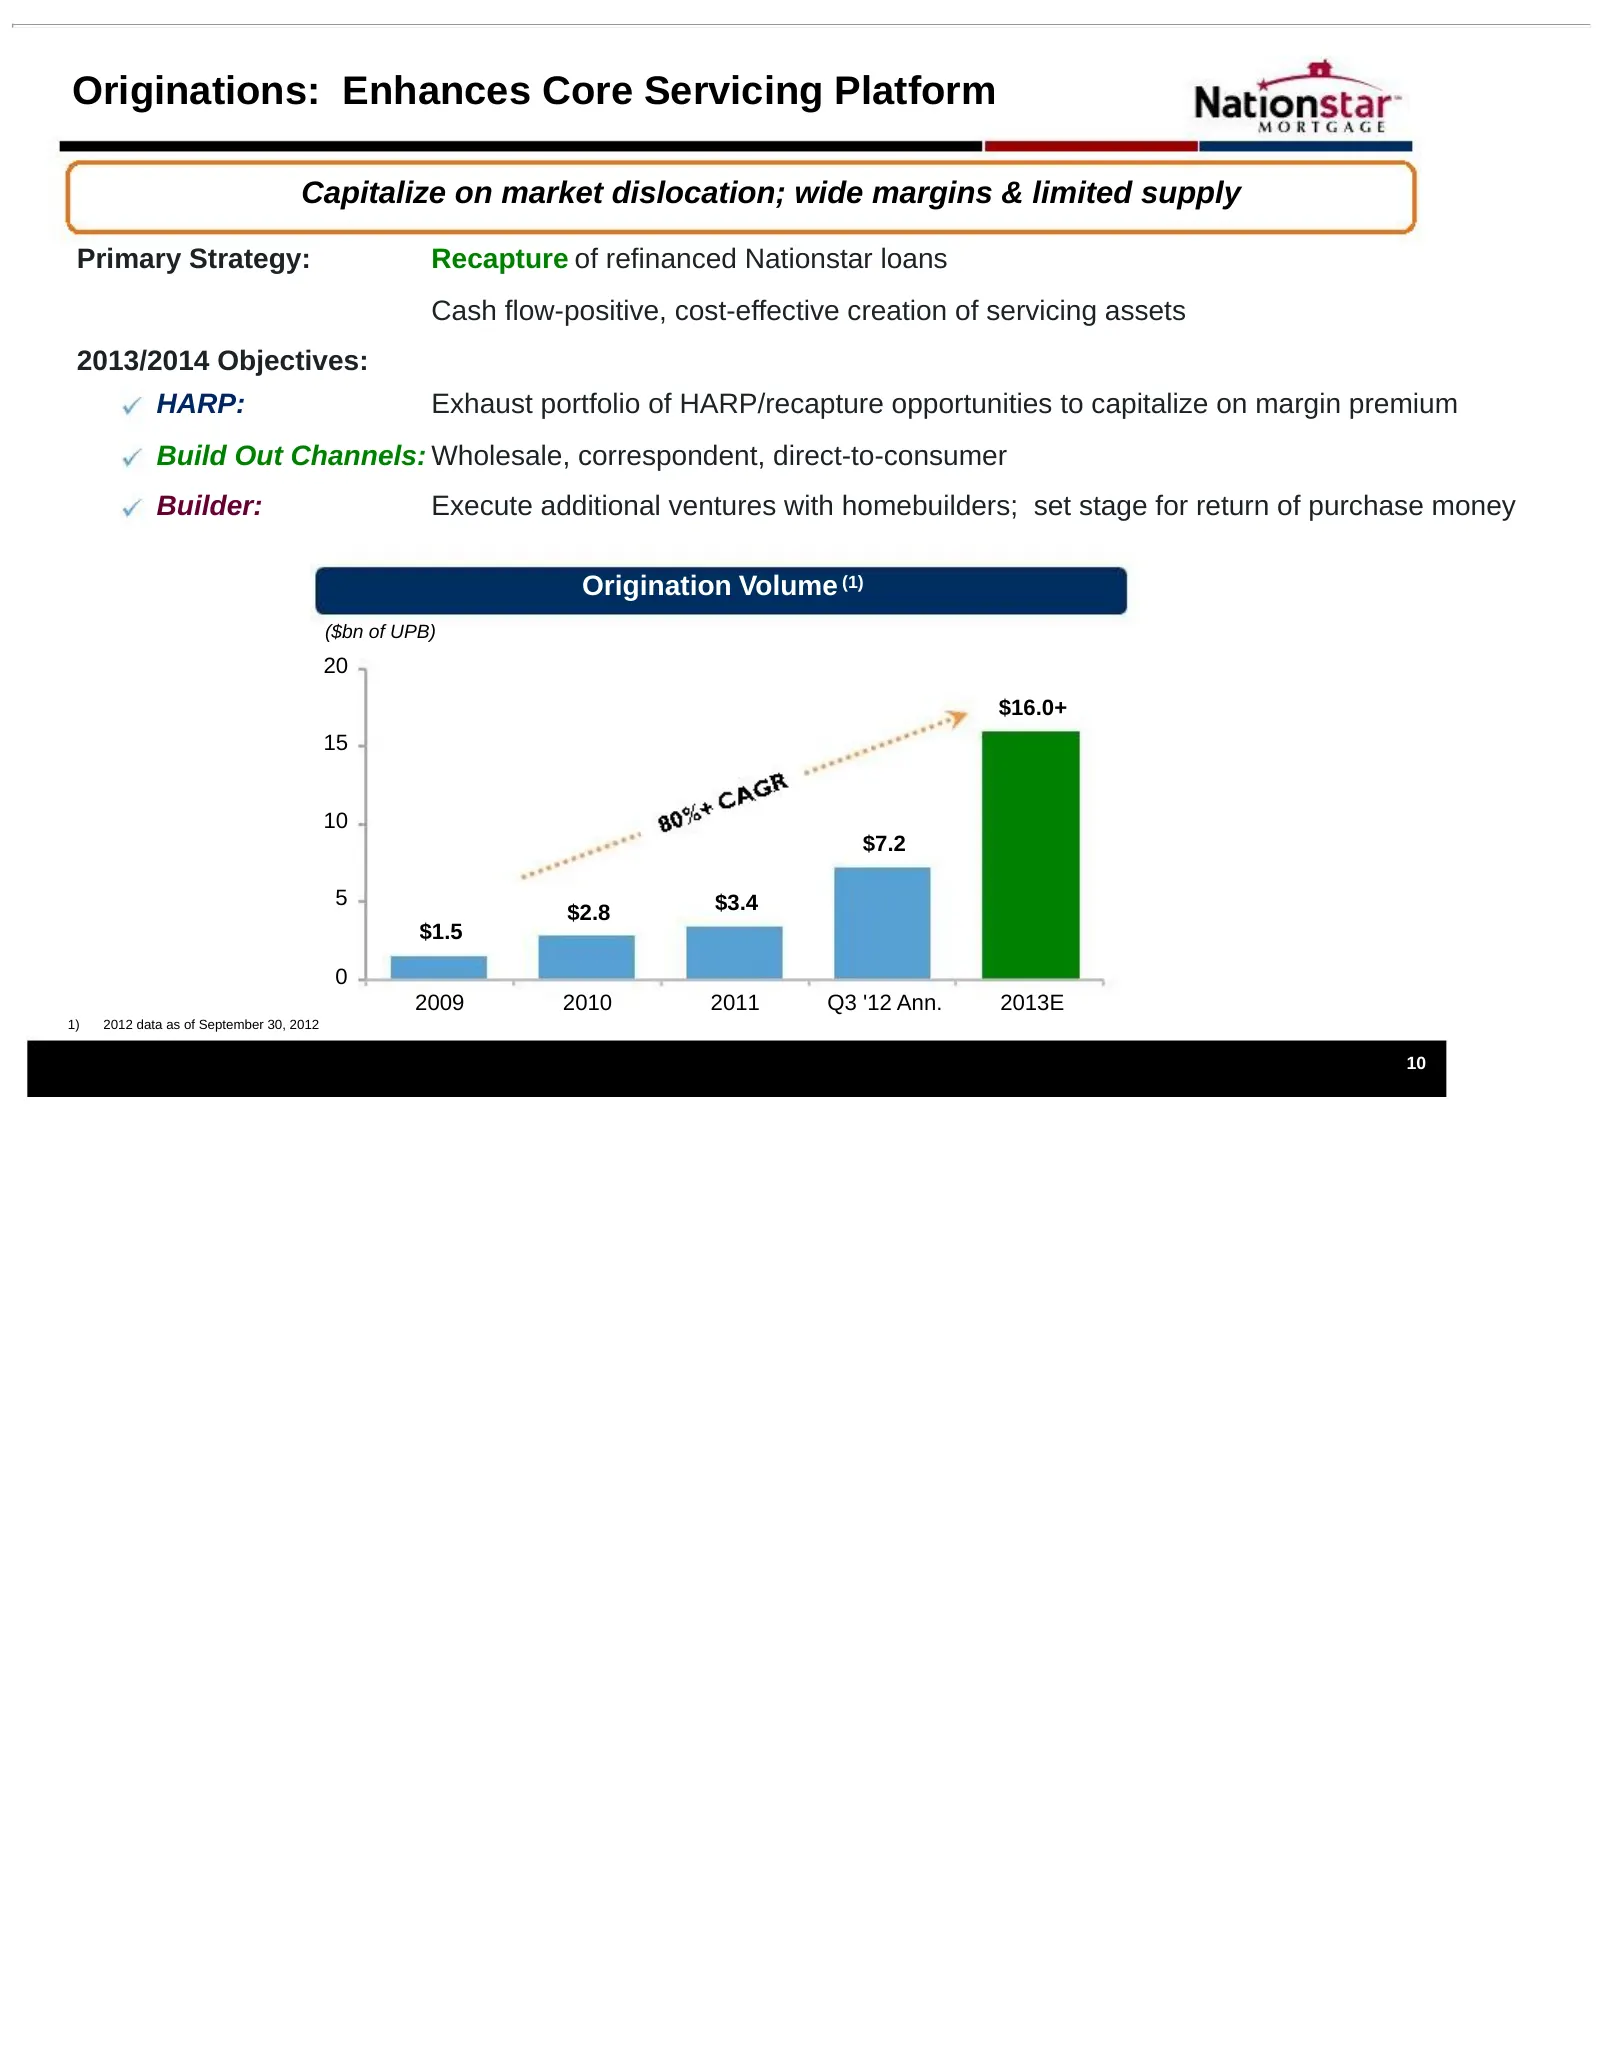
Originations: Enhances Core Servicing Platform Capitalize on market dislocation; wide margins & limited supply Primary Strategy: Recapture of refinanced Nationstar loans Cash flow-positive, cost-effective creation of servicing assets 2013/2014 Objectives: HARP: Exhaust portfolio of HARP/recapture op
Slide 12: Solutionstar
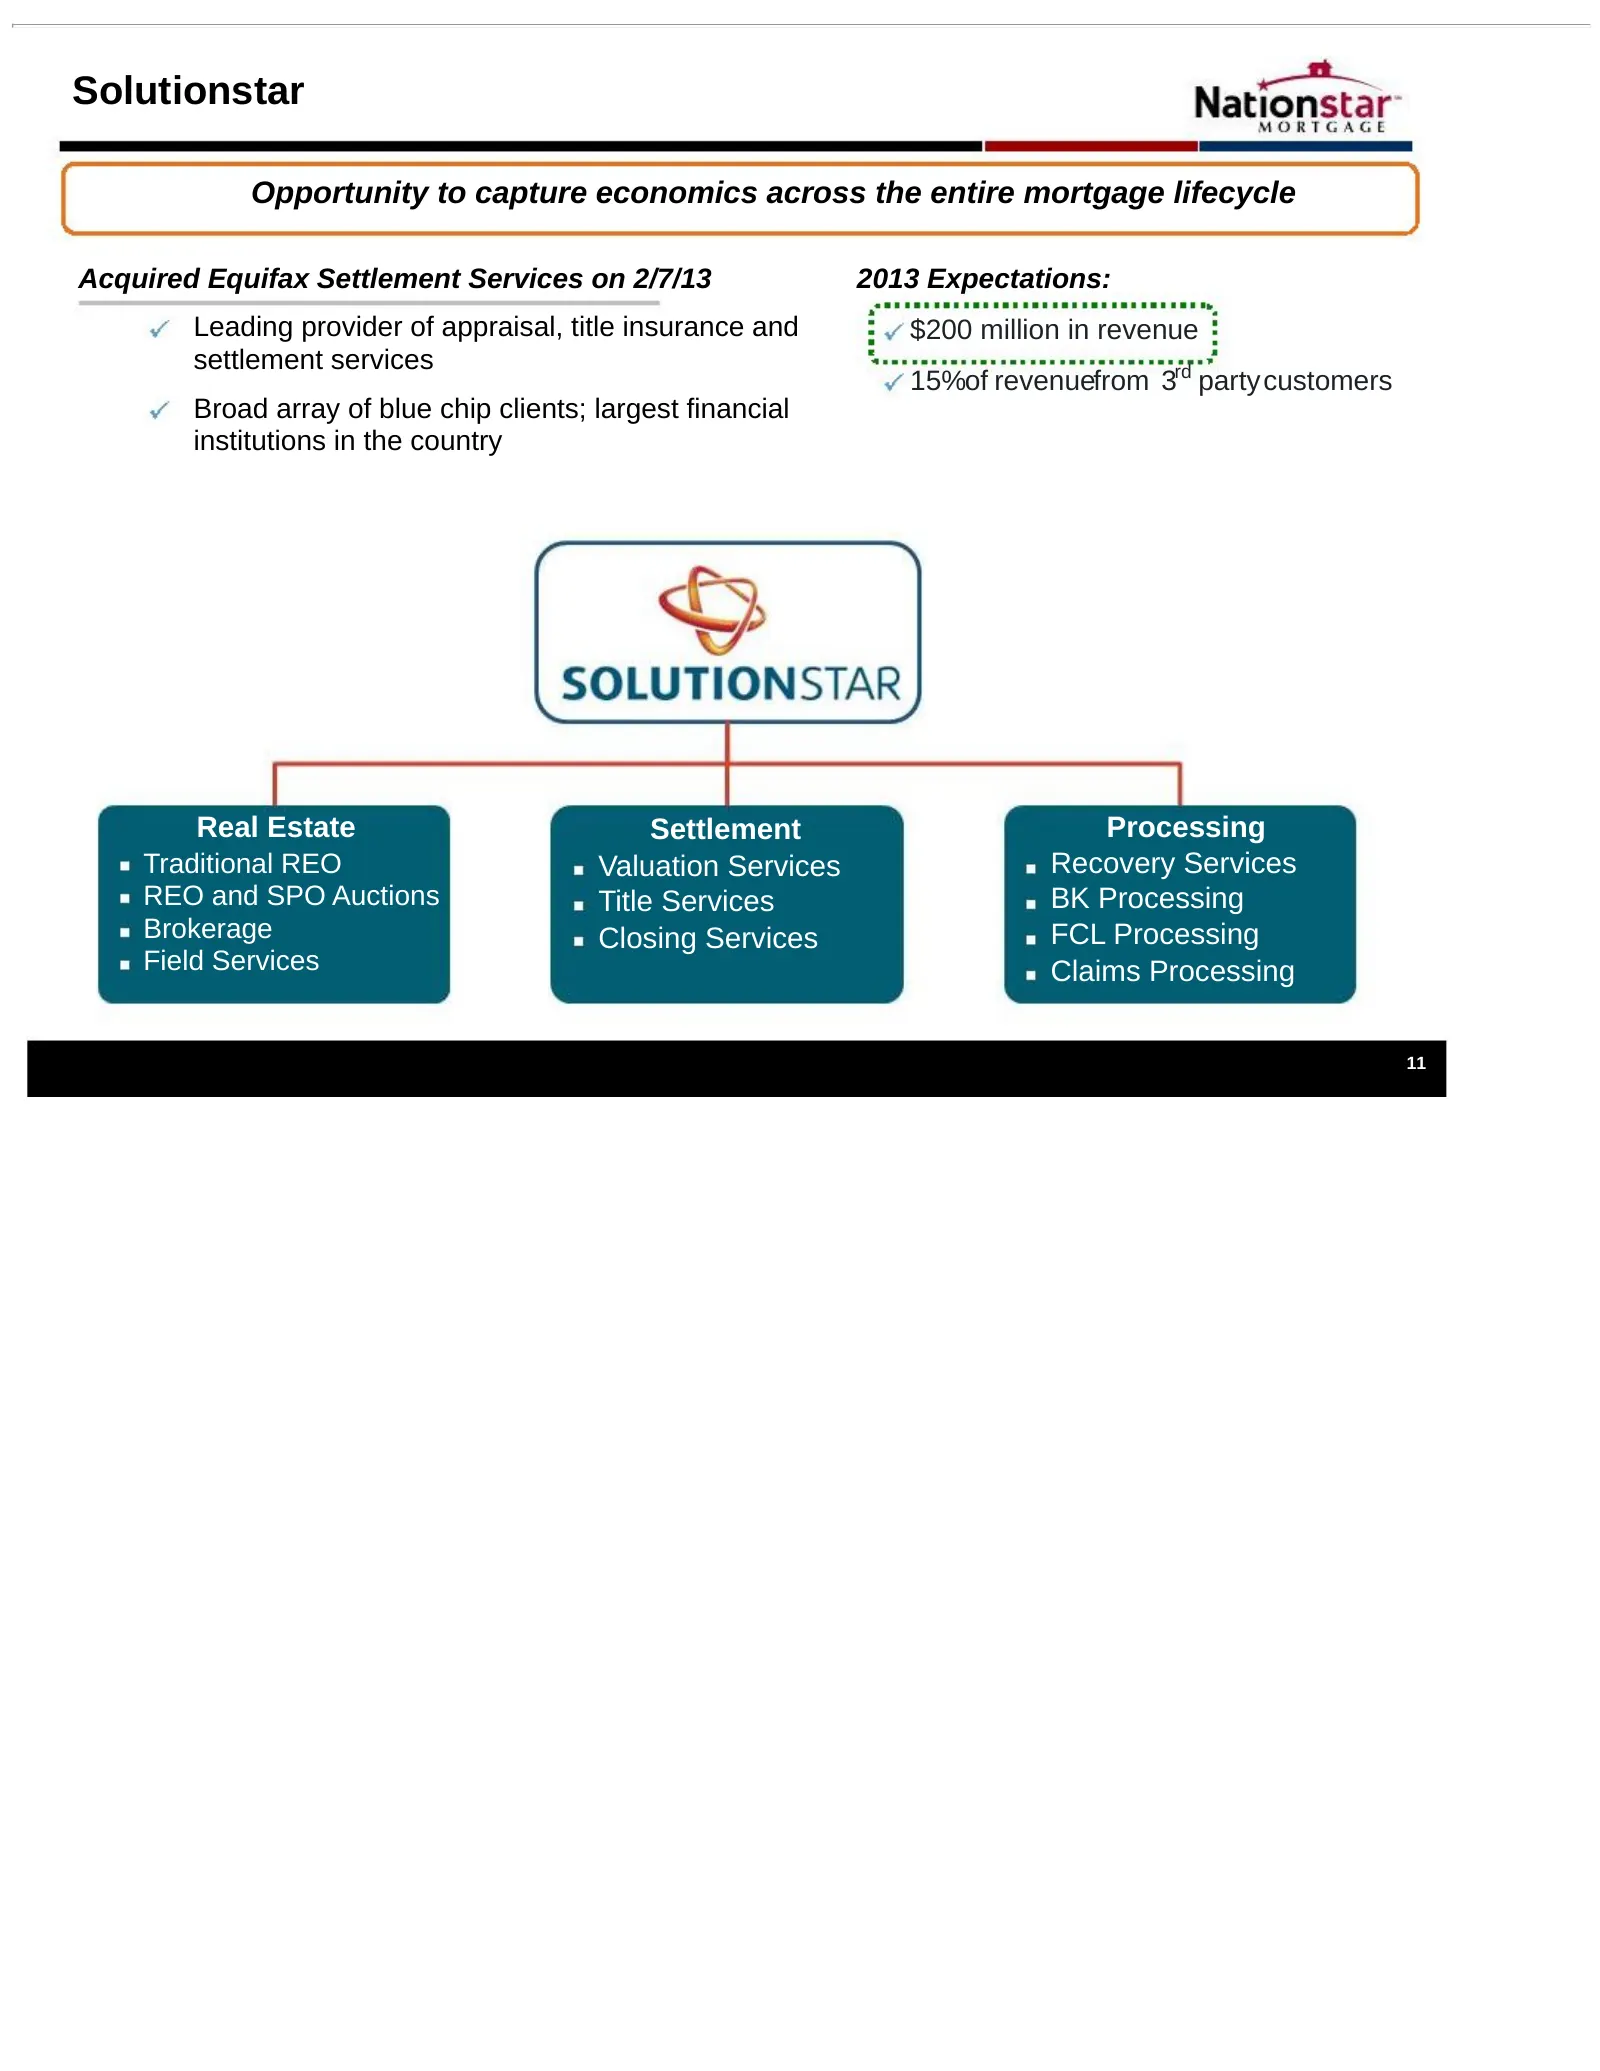
Solutionstar Opportunity to capture economics across the entire mortgage lifecycle Acquired Equifax Settlement Services on 2/7/13 2013 Expectations: Leading provider of appraisal, title insurance and $200 million in revenue settlement services 15%of revenuefrom 3rd partycustomers Broad array of blue
Slide 13: Illustrative Example: Solutionstar Earnings Lever
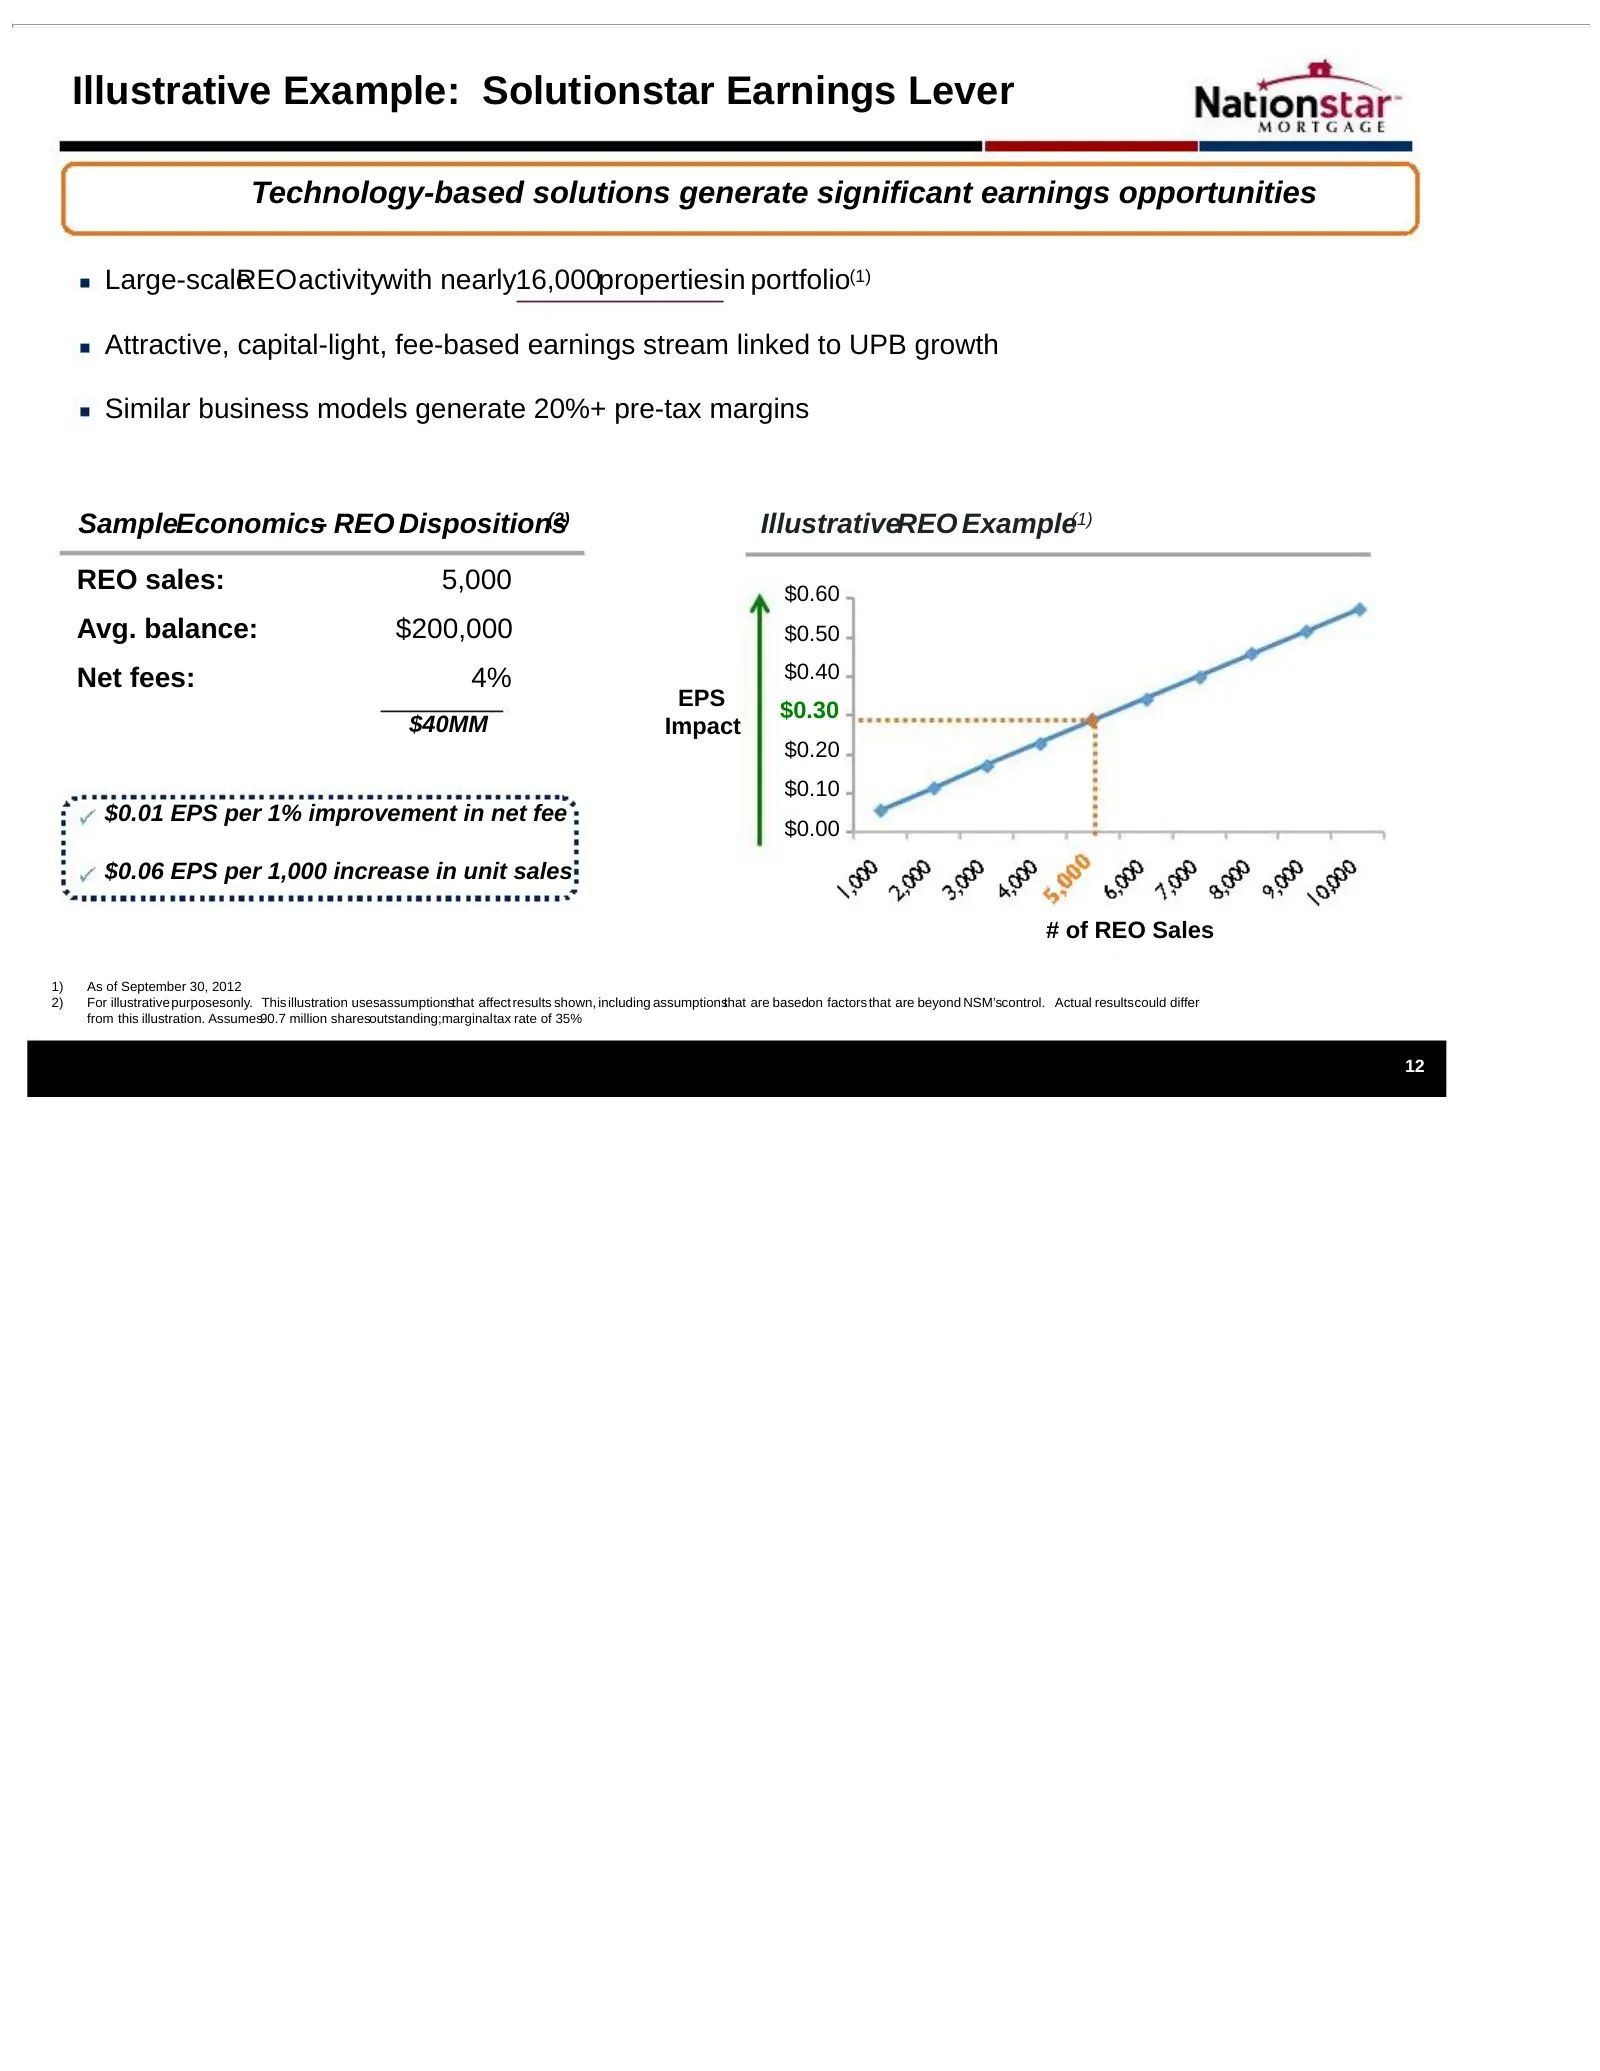
Illustrative Example: Solutionstar Earnings Lever Technology-based solutions generate significant earnings opportunities Large-scale REOactivitywith nearly16,000propertiesin portfolio(1) Attractive, capital-light, fee-based earnings stream linked to UPB growth Similar business models generate 20%+ p
Slide 14: At Current Levels, NSM Represents Value Proposition
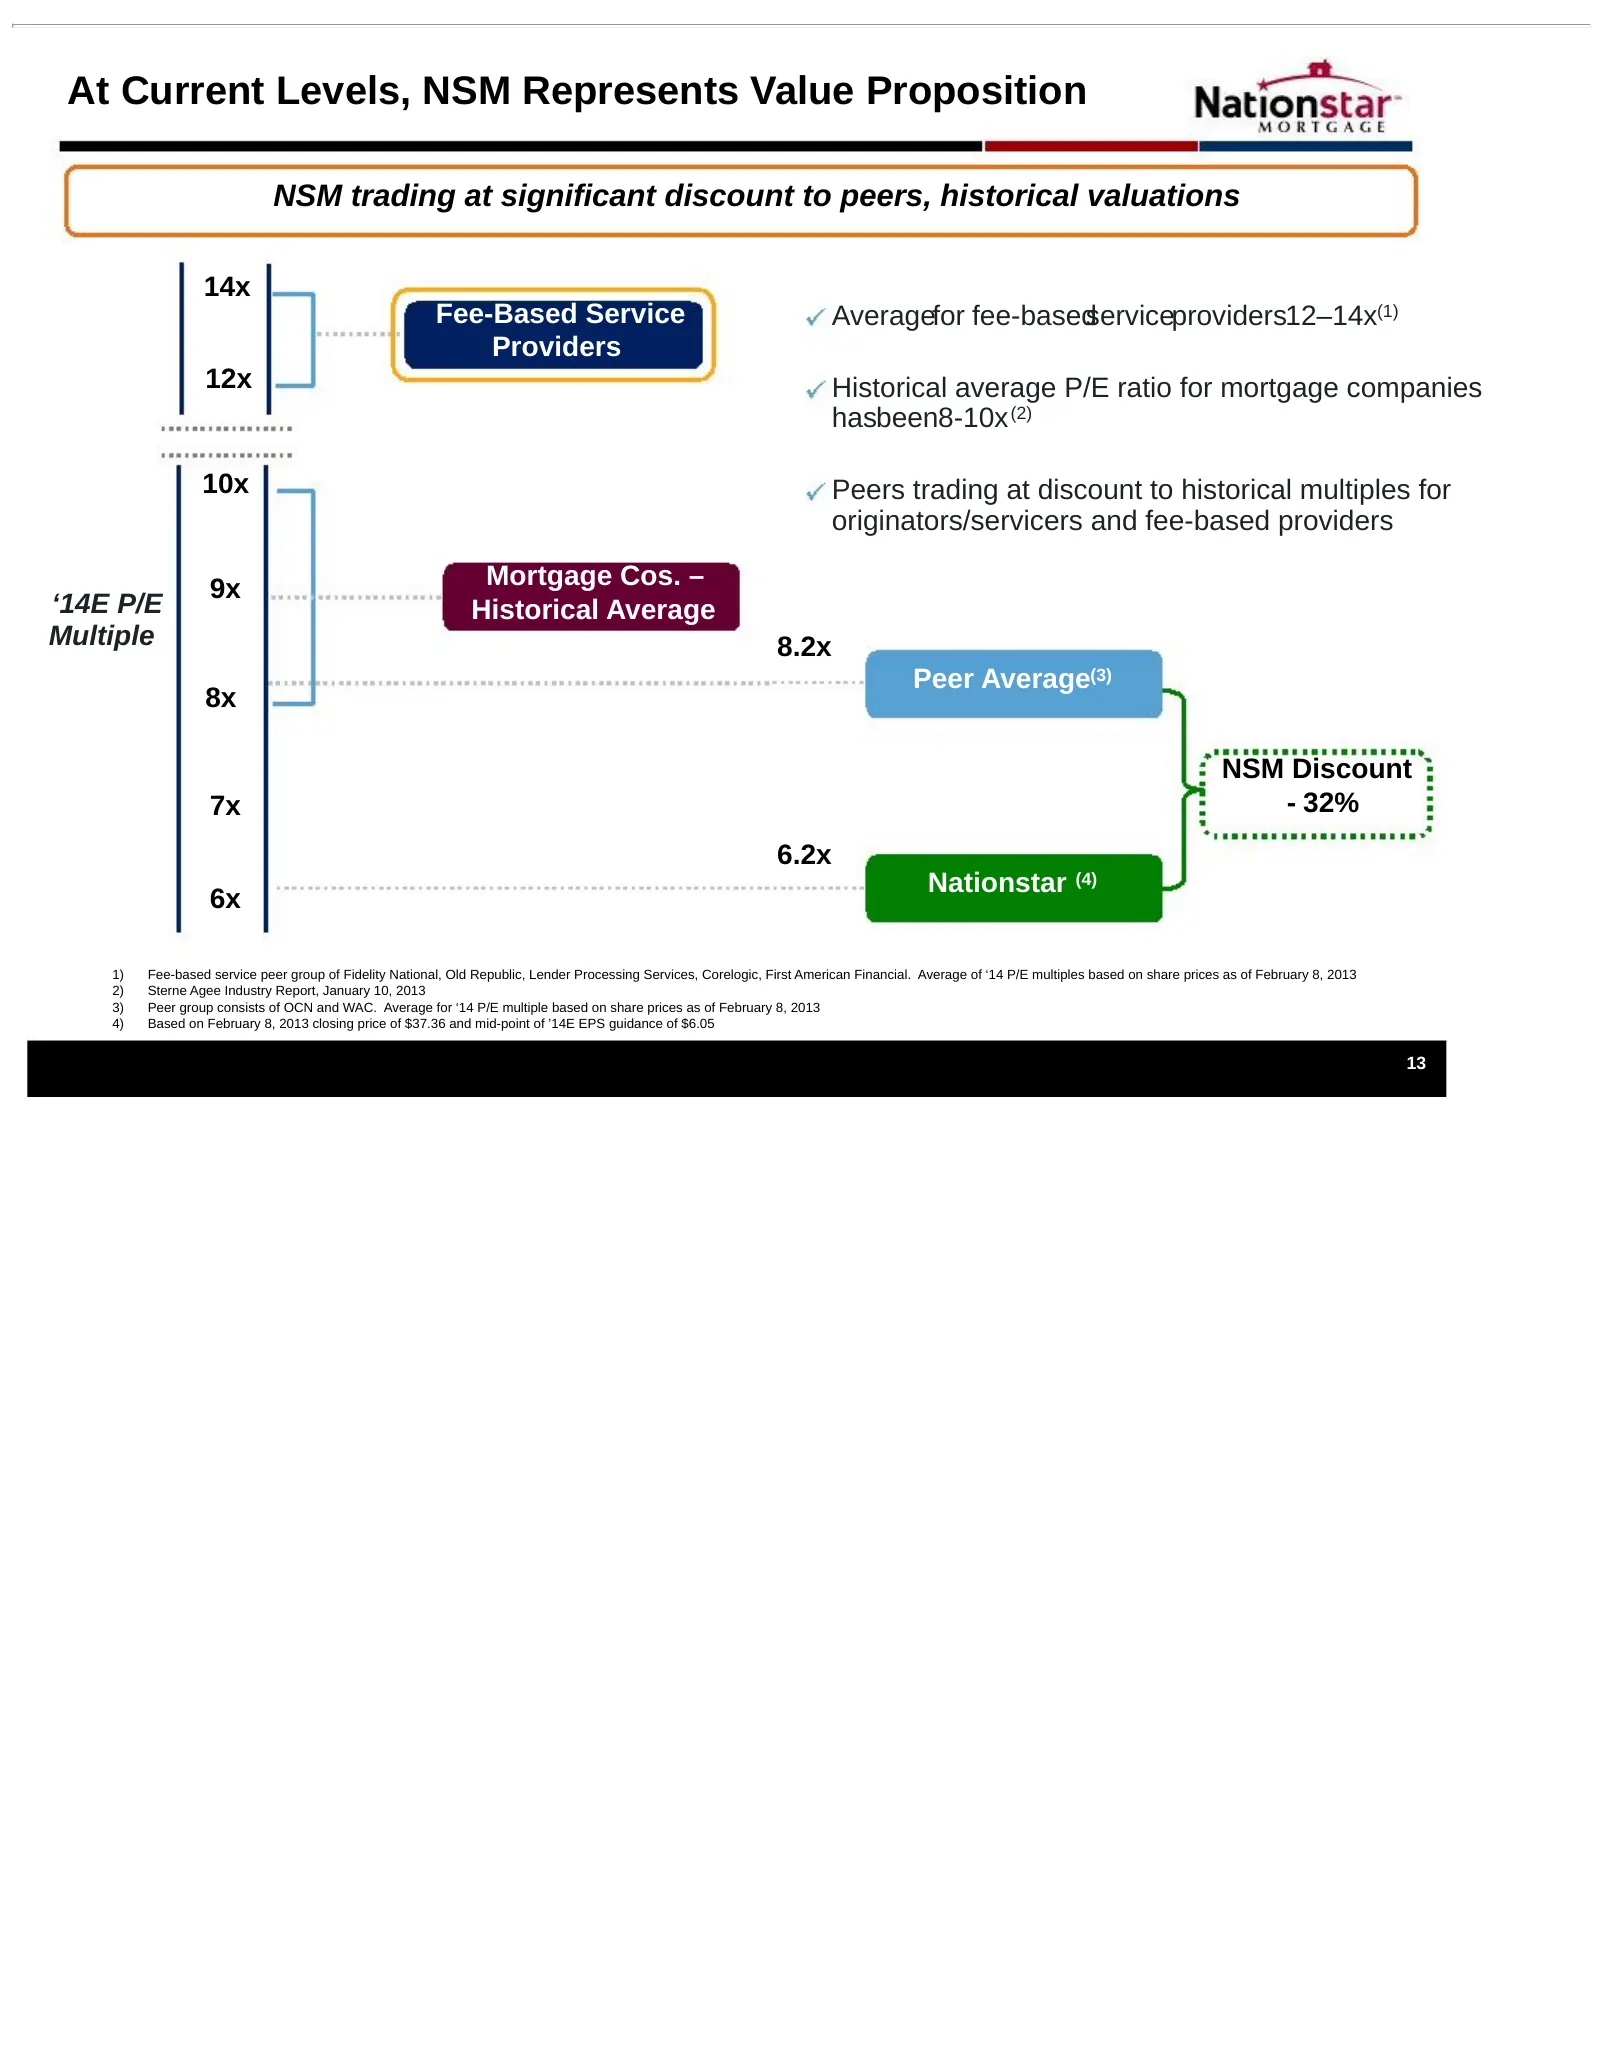
At Current Levels, NSM Represents Value Proposition NSM trading at significant discount to peers, historical valuations 14x Fee-Based Service Averagefor fee-basedserviceproviders12–14x(1) Providers 12x Historical average P/E ratio for mortgage companies hasbeen8-10x (2) 10x Peers trading at discount
Slide 15: Maximize shareholder value via…
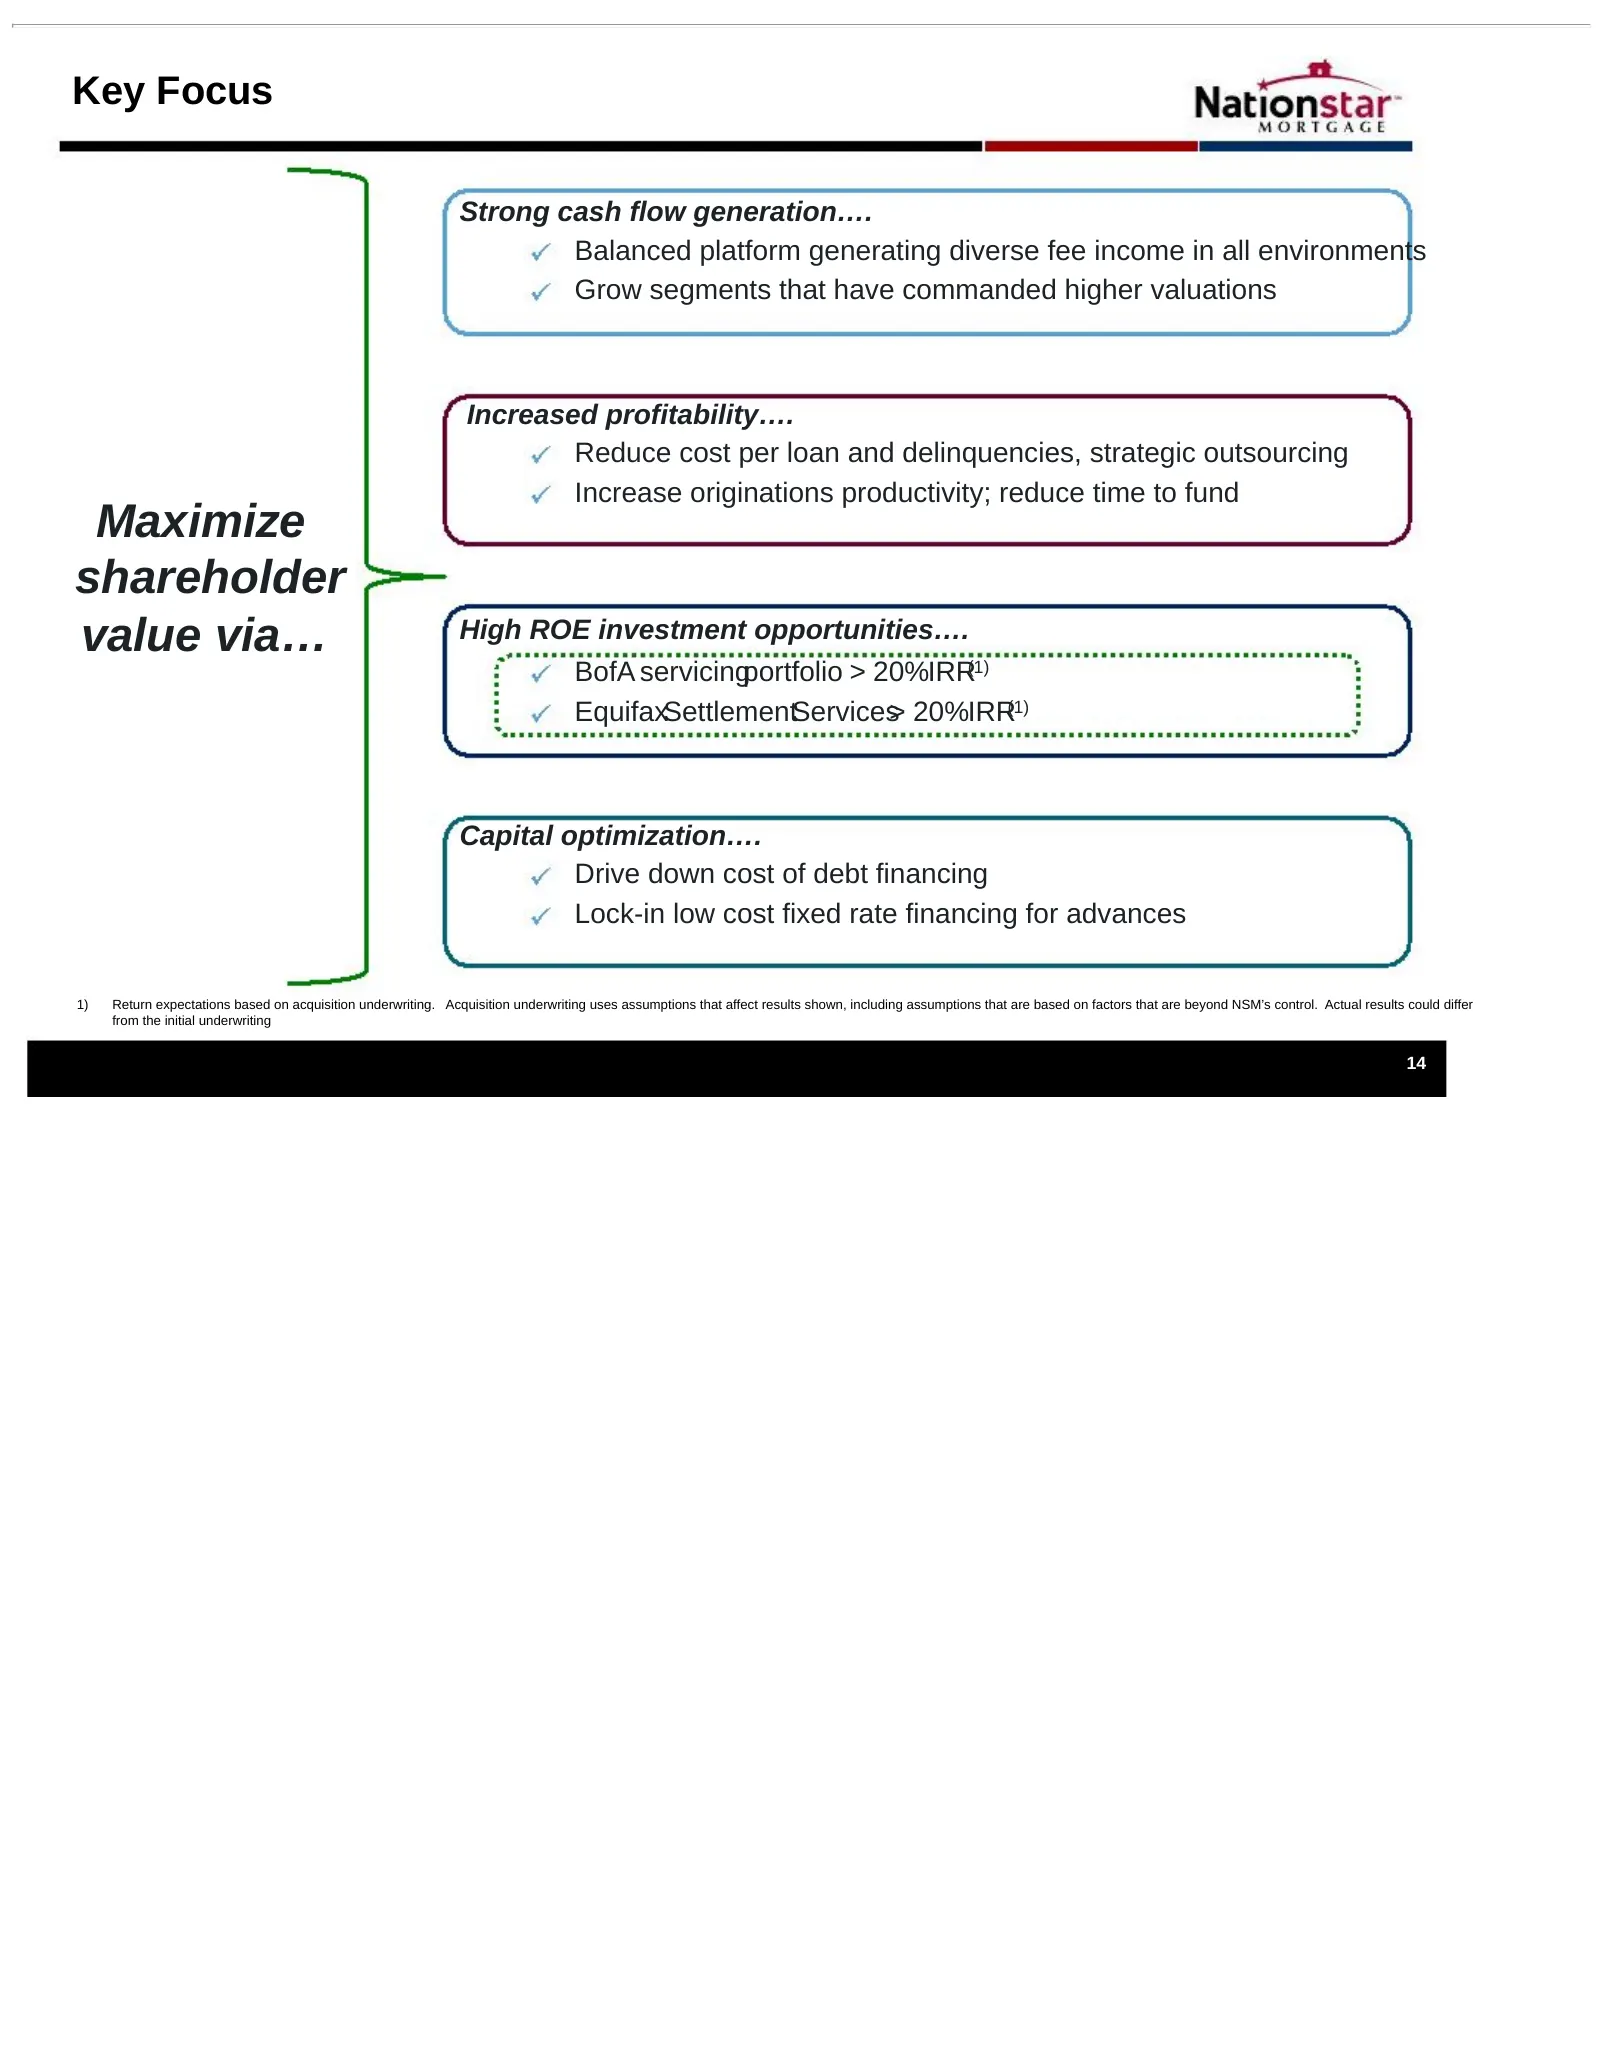
Key Focus Strong cash flow generation…. Balanced platform generating diverse fee income in all environments Grow segments that have commanded higher valuations Increased profitability…. Reduce cost per loan and delinquencies, strategic outsourcing Increase originations productivity; reduce time to f

Slide 16: Appendix
Be we =z Appendix
Slide 17: Focused on Profitable Growth
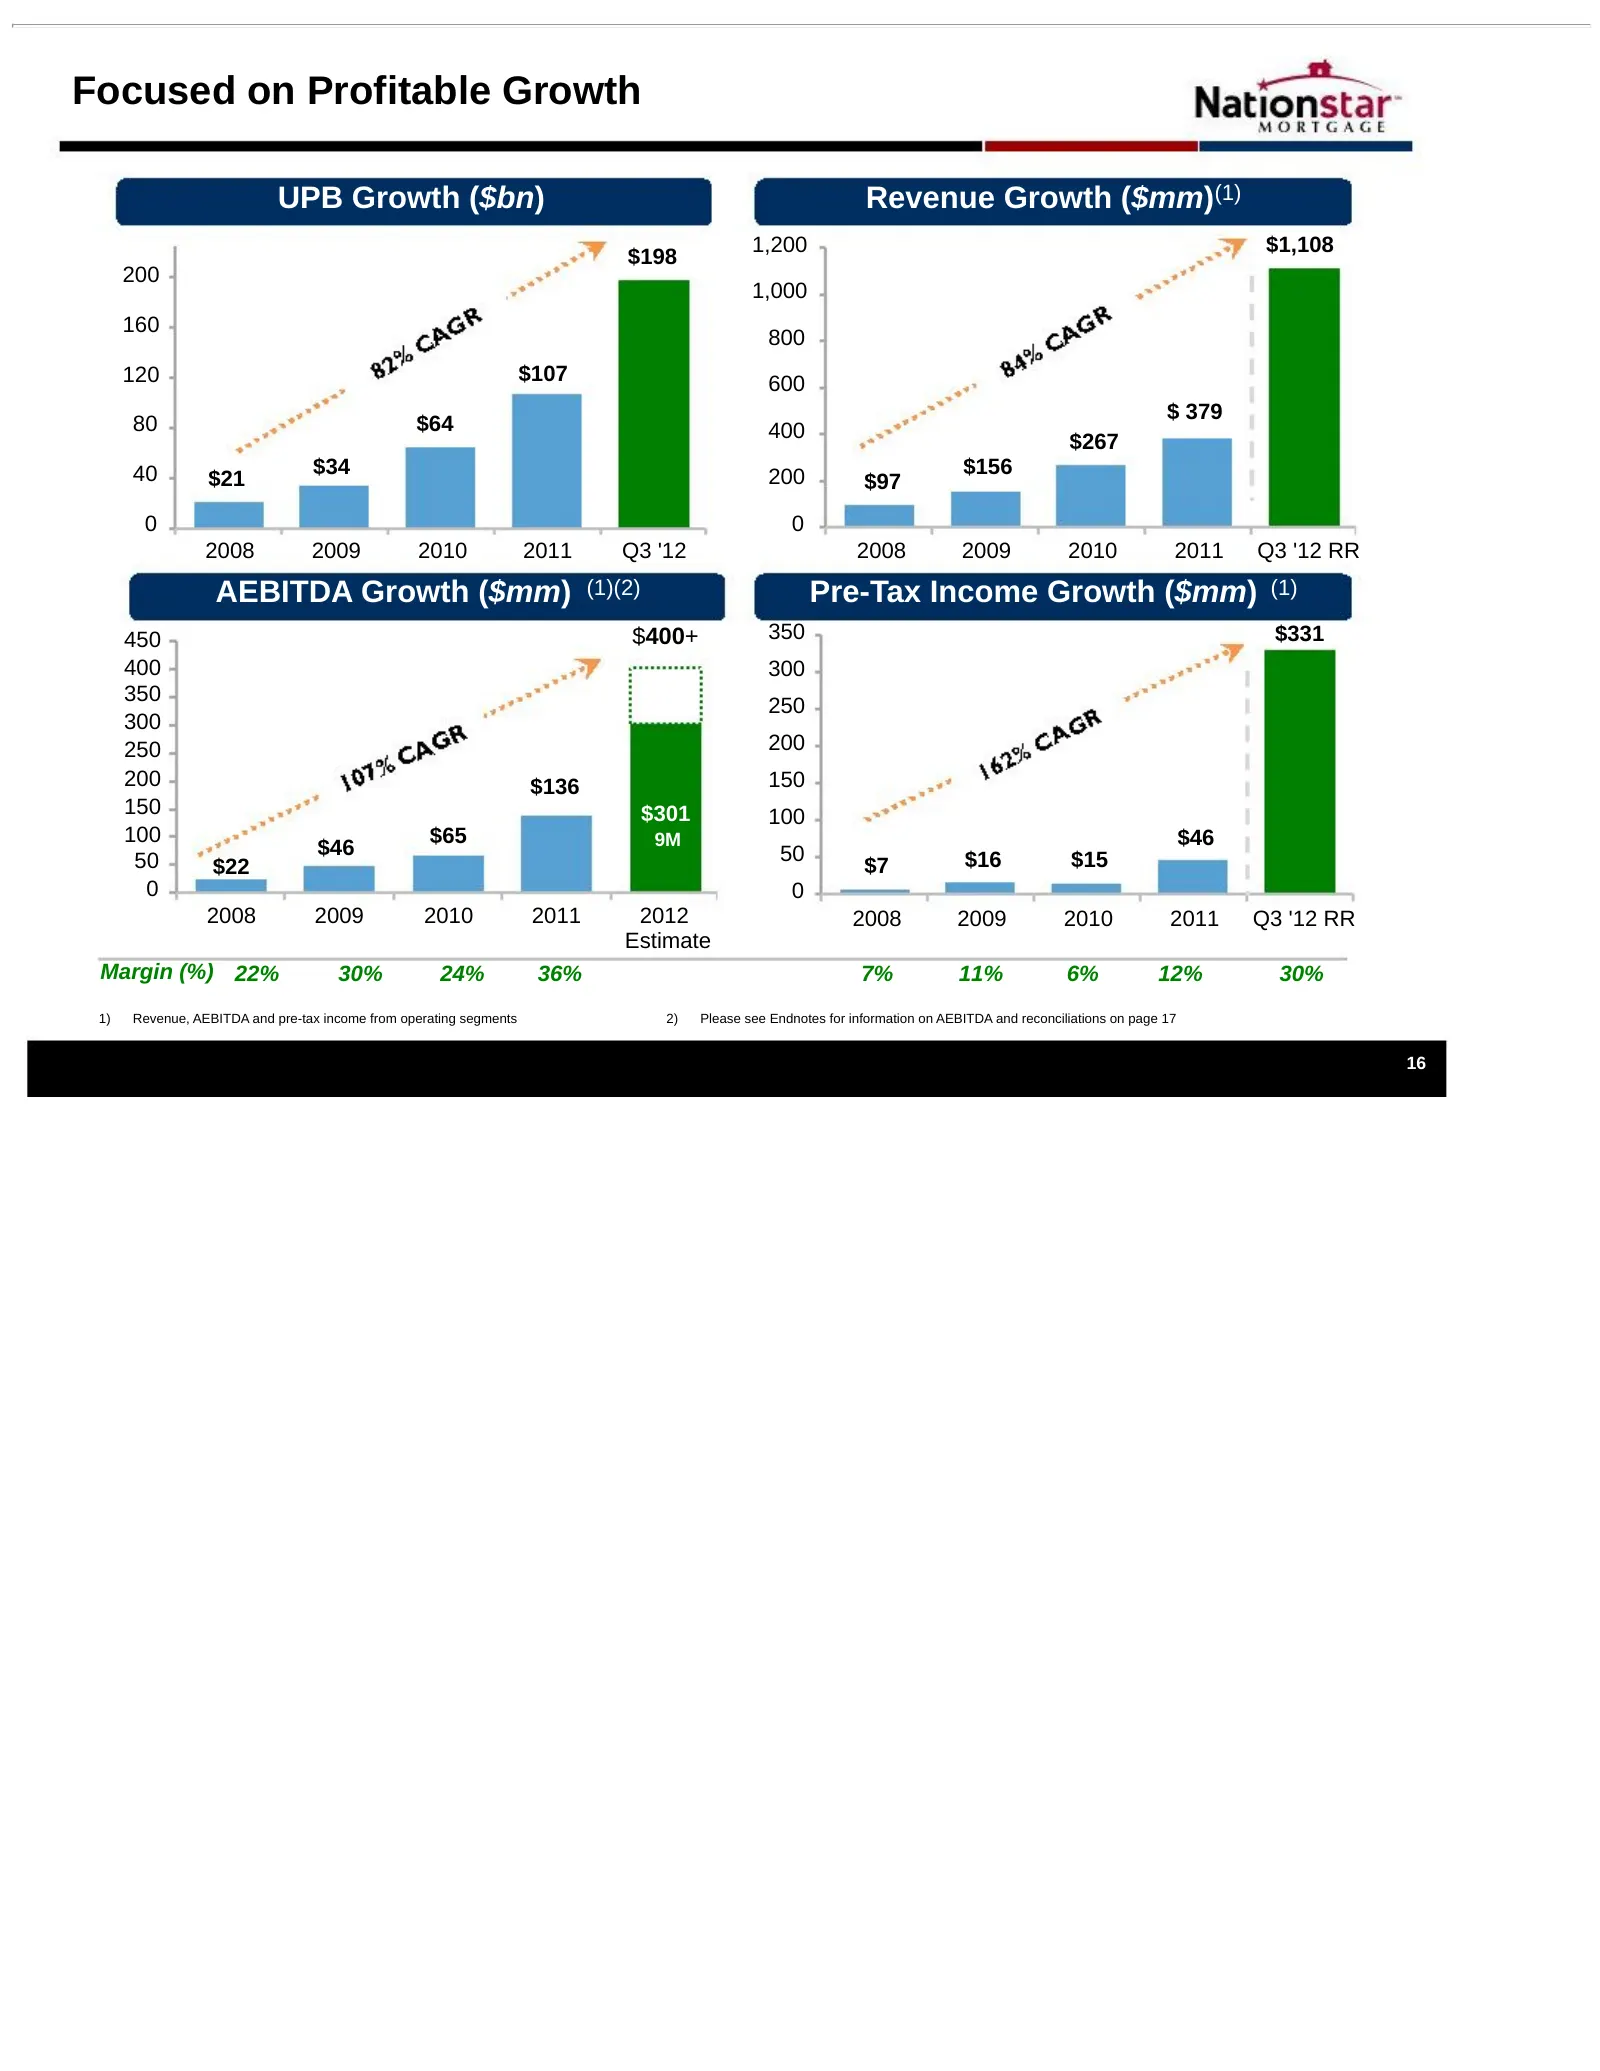
Focused on Profitable Growth UPB Growth ($bn) Revenue Growth ($mm)(1) 1,200 $1,108 $198 200 1,000 160 800 120 $107 600 $ 379 80 $64 400 $267 40 $34 200 $156 $21 $97 0 0 2008 2009 2010 2011 Q3 '12 2008 2009 2010 2011 Q3 '12 RR AEBITDA Growth ($mm) (1)(2) Pre-Tax Income Growth ($mm) (1) 450 $400+ 350
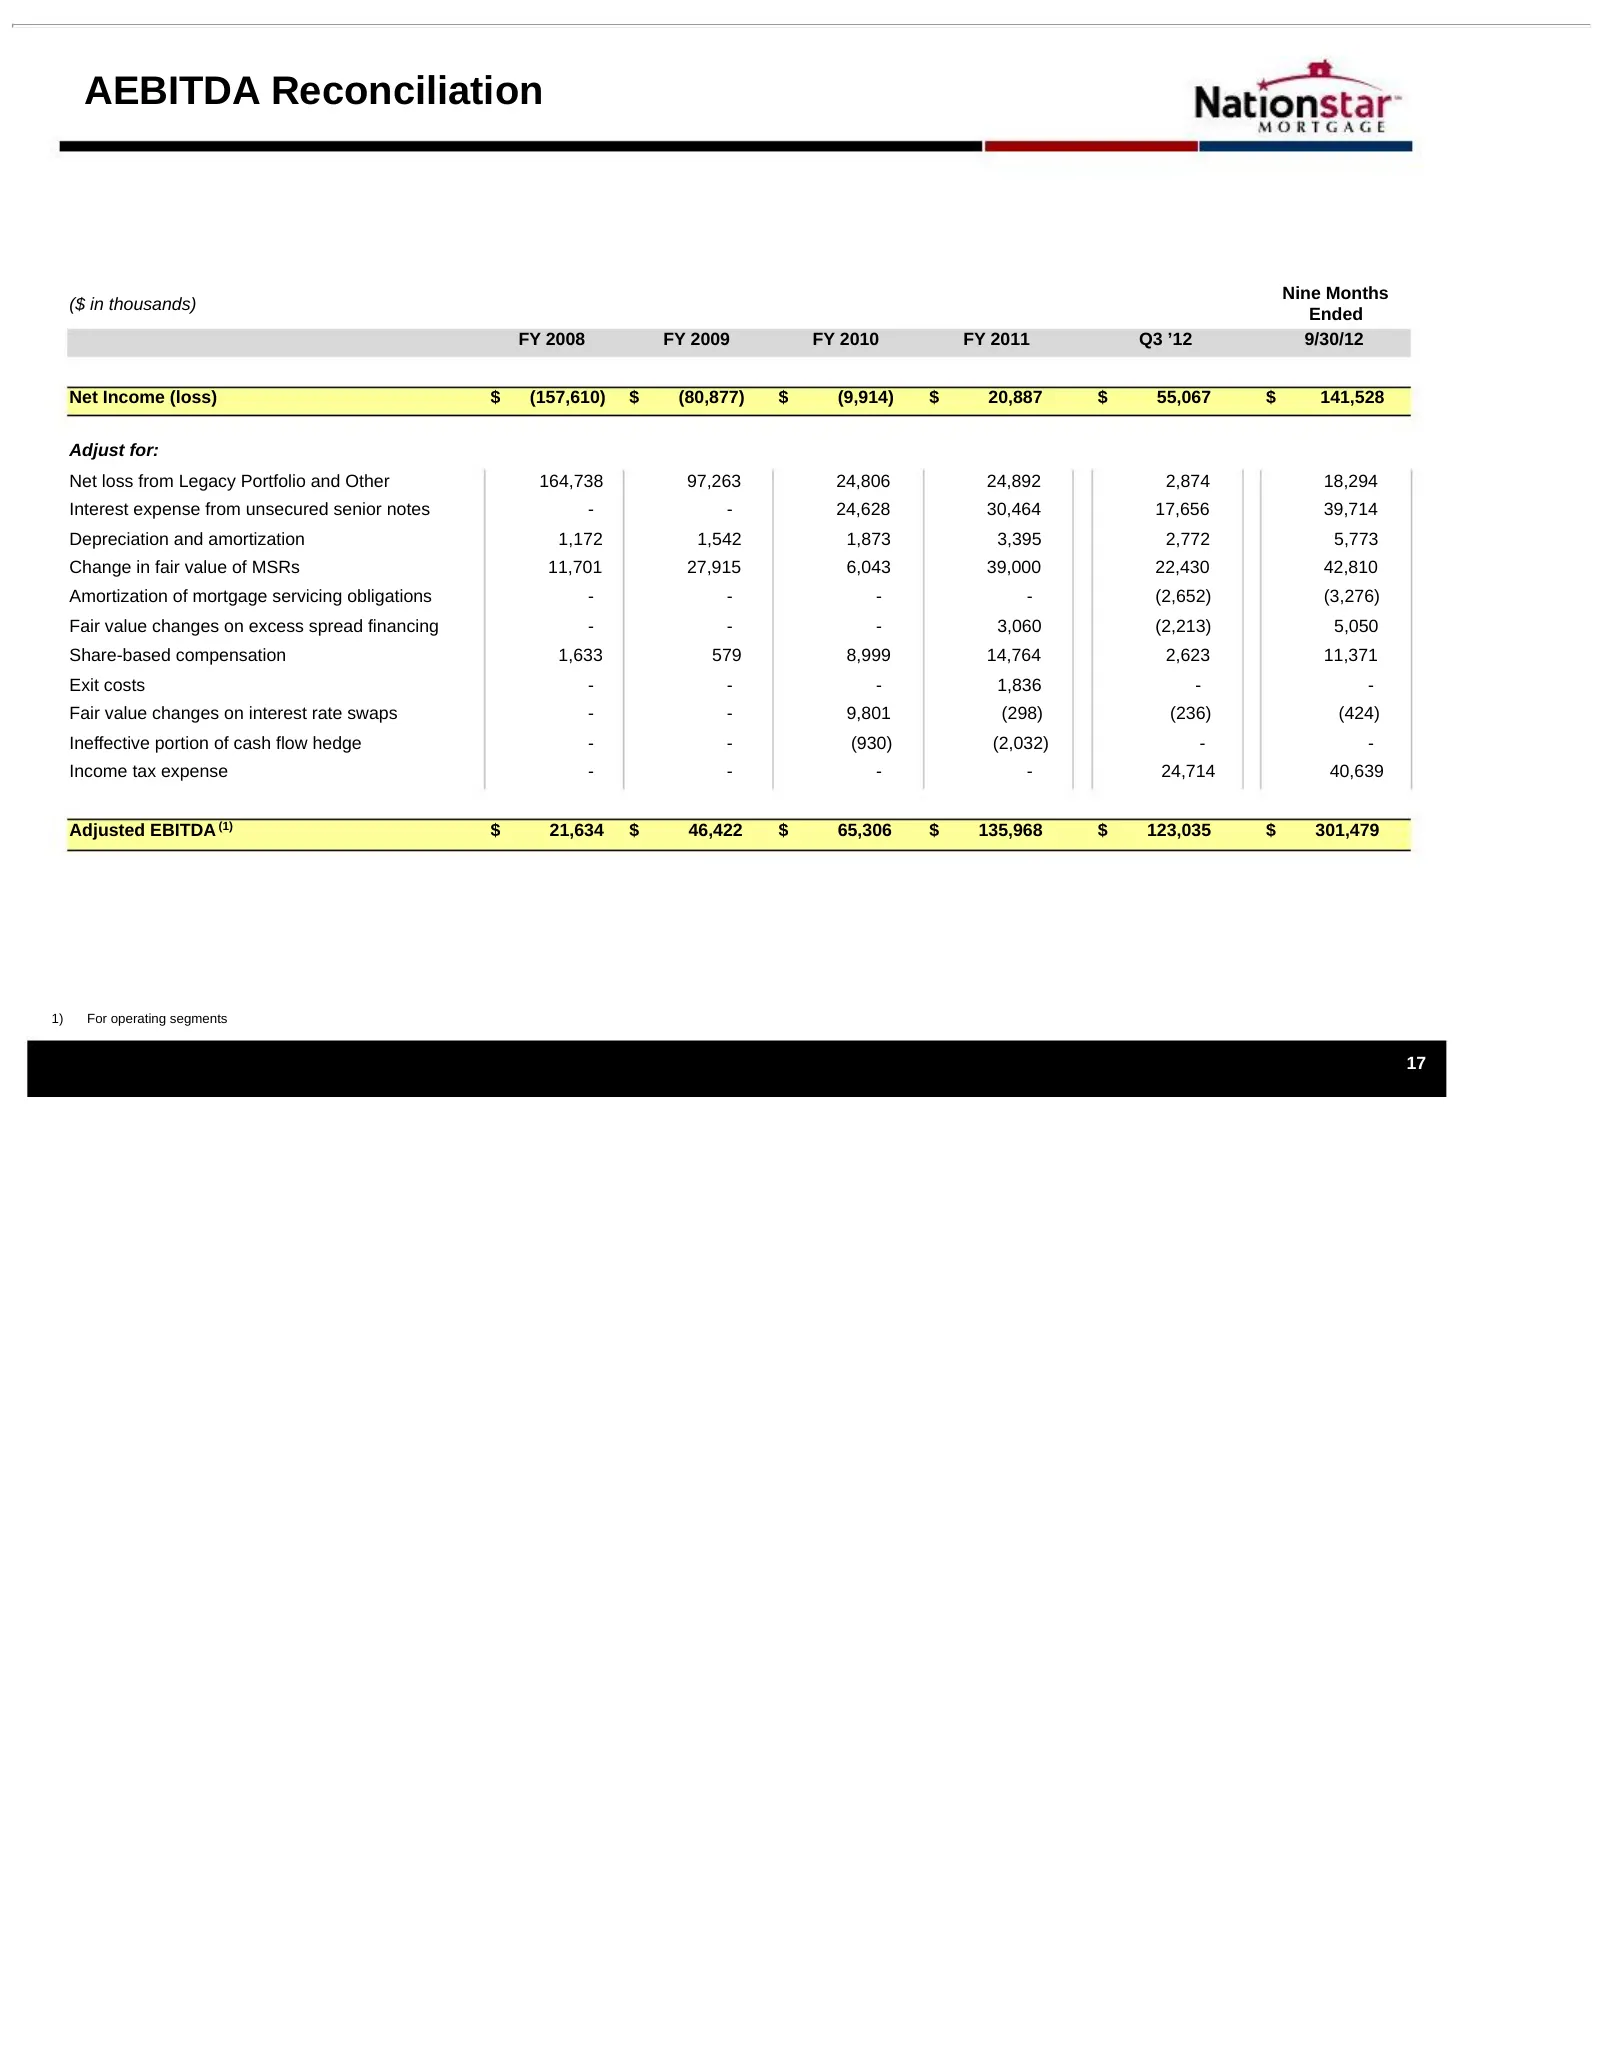
Slide 18: AEBITDA Reconciliation
AEBITDA Reconciliation Nine Months ($ in thousands) Ended FY 2008 FY 2009 FY 2010 FY 2011 Q3 ’12 9/30/12 Net Income (loss) $ (157,610) $ (80,877) $ (9,914) $ 20,887 $ 55,067 $ 141,528 Adjust for: Net loss from Legacy Portfolio and Other 164,738 97,263 24,806 24,892 2,874 18,294 Interest expense from
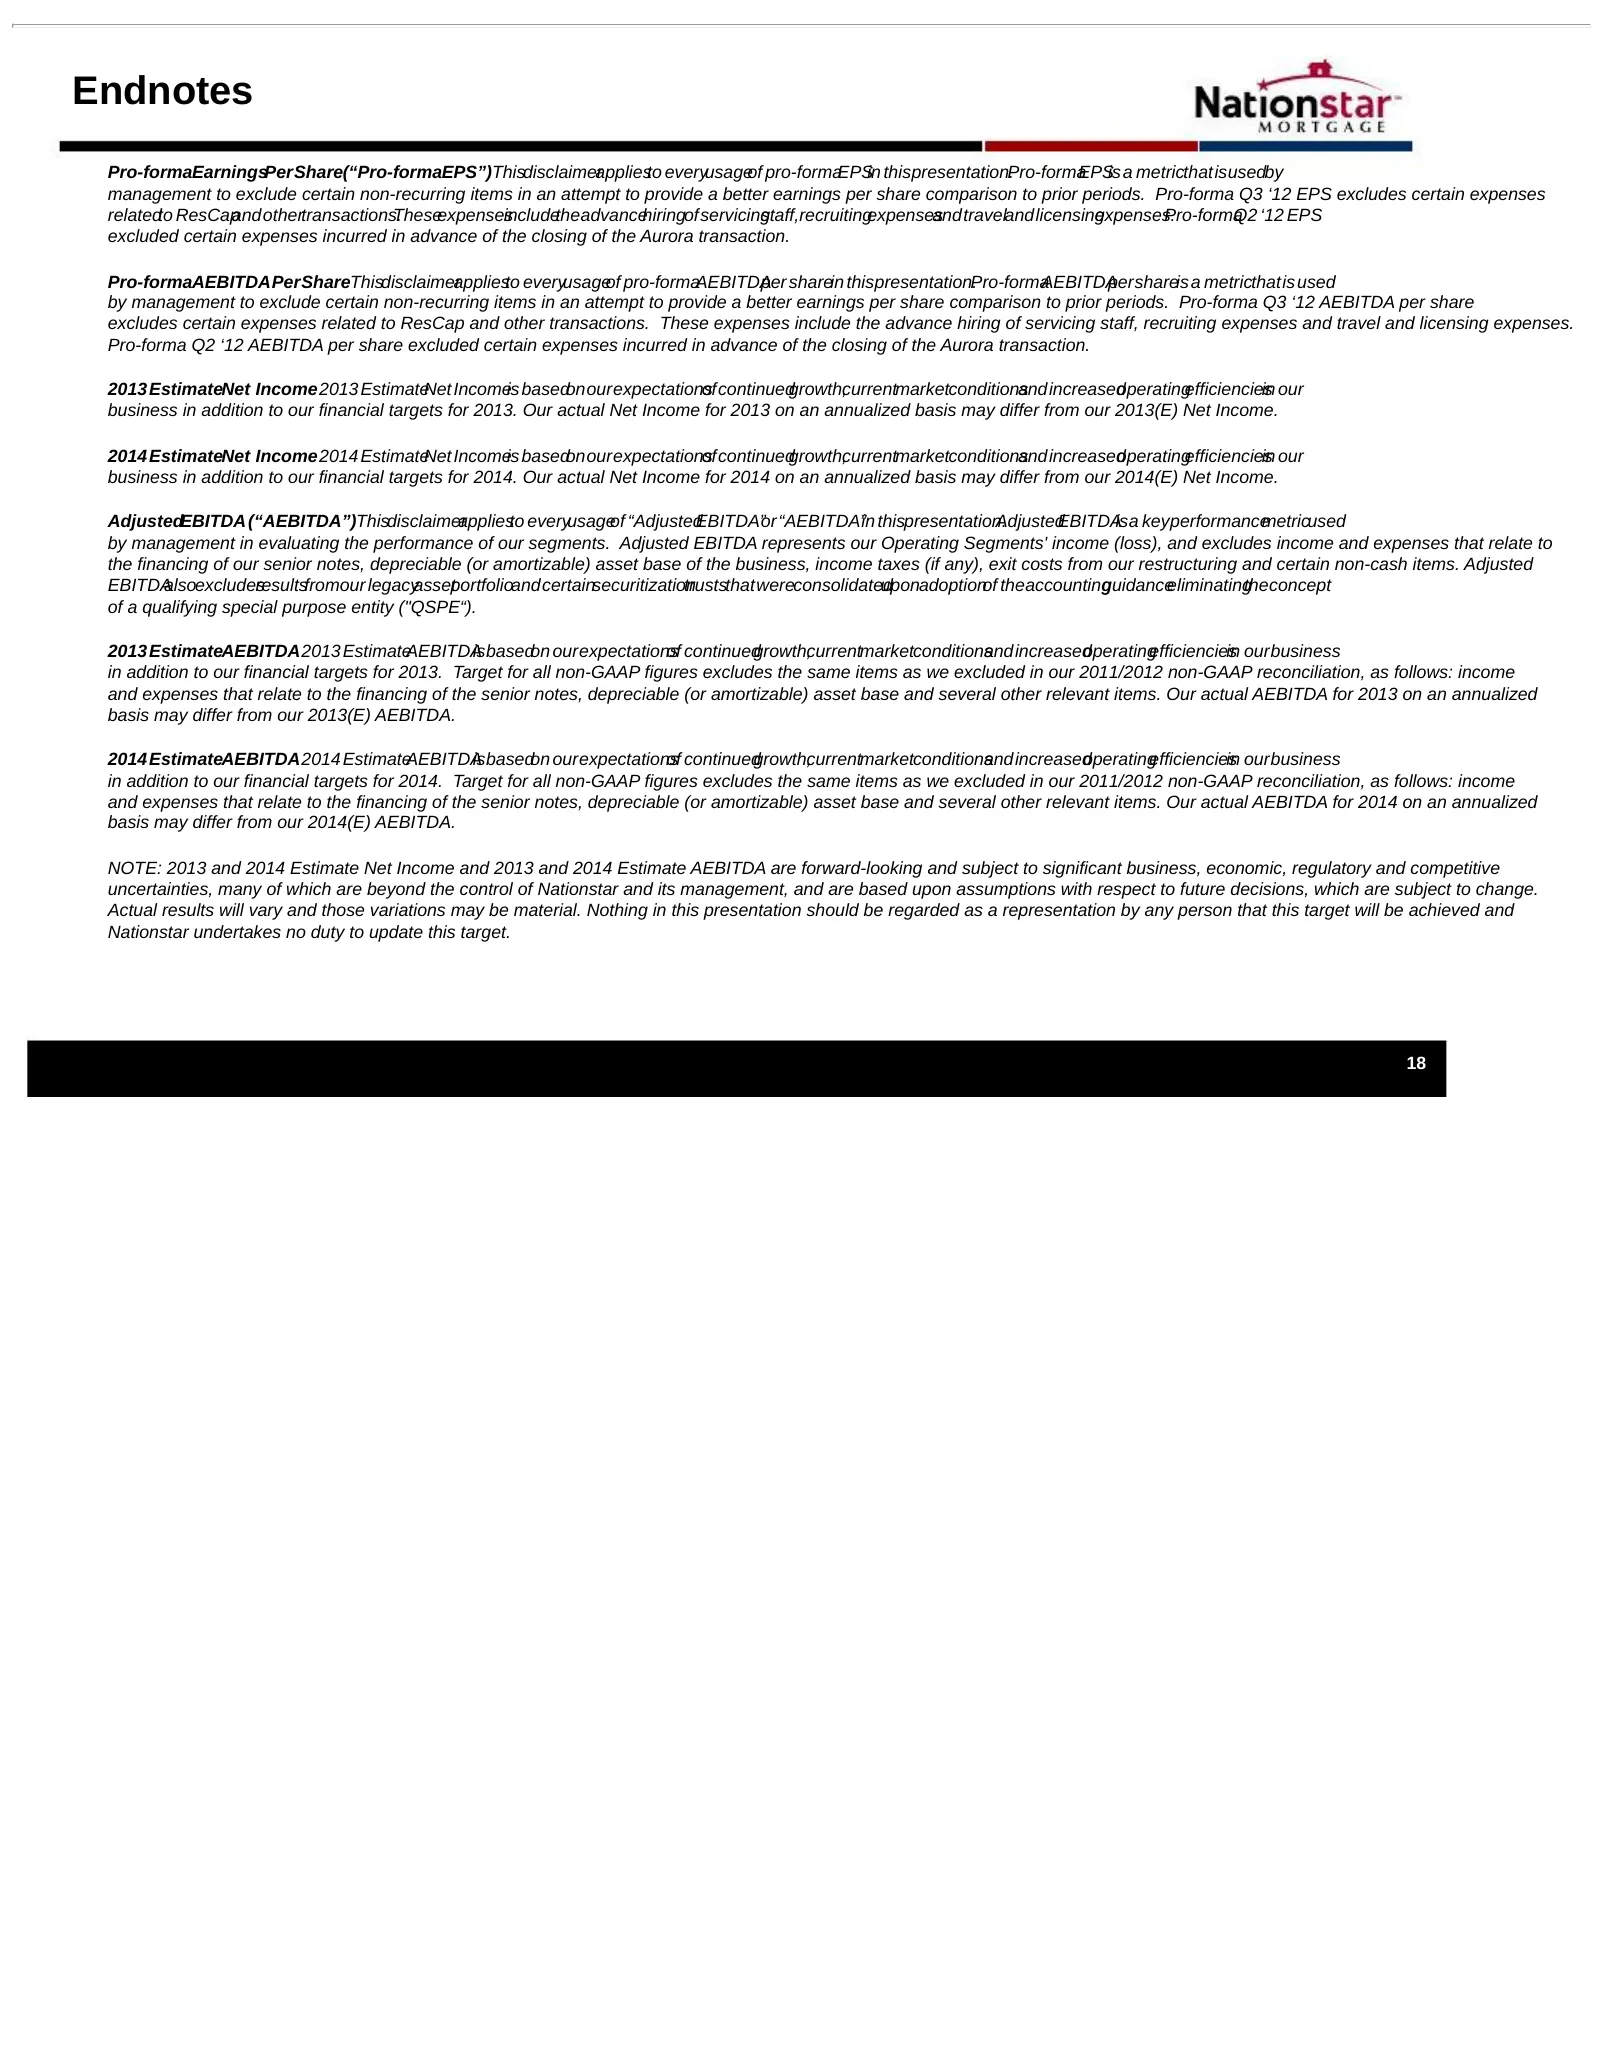
Slide 19: Endnotes
Endnotes Pro-formaEarningsPerShare(“Pro-formaEPS”)Thisdisclaimerappliesto everyusageof pro-formaEPSin thispresentation.Pro-formaEPSis a metricthatisusedby management to exclude certain non-recurring items in an attempt to provide a better earnings per share comparison to prior periods. Pro-forma Q3
Source: SEC EDGAR · 8-K filed Feb 12, 2013
More decks from Mr. Cooper Group Inc
 Q2 2025 Earnings Presentation25 slides · Jul 23, 2025
 Q1 2025 Earnings Presentation24 slides · Apr 23, 2025
 Merger or Acquisition (March 2025)23 slides · Mar 31, 2025
 Q4 2024 Earnings Presentation29 slides · Feb 12, 2025
 Q3 2024 Earnings Presentation29 slides · Oct 23, 2024
 Q2 2024 Earnings Presentation26 slides · Jul 25, 2024