Yadkin Financial — Yadkin Valley Financial — Investor Presentation (November 2008)
24 slides from Yadkin Financial's investor presentation, Nov 17, 2008
Slide 1: Investor Meetings Atlanta, GA November 17, 2008
Investor Meetings Atlanta, GA November 17, 2008
Slide 2: Road map
2 Road map Corporate Overview American Community Acquisition Financial Performance Operating Strategy Outlook
Slide 3: Who are We?
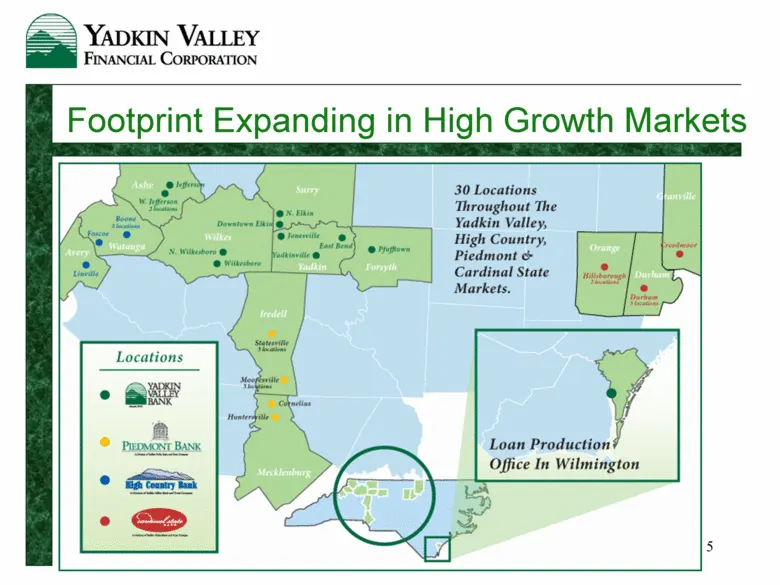
3 Who are We? Yadkin Valley Bank chartered in 1968 Total assets of $1.5 billion Strong management team with an average of over 30 years of banking experience 30 branches across 12 counties in central and northwestern North Carolina Wilmington LPO Sidus Financial – mortgage subsidiary Focused on init
Slide 4: Proven Integration Strategy
4 Proven Integration Strategy Since 2002, we have successfully integrated the acquisition of: Three banking institutions with total assets of $625 million One mortgage company with operations in 12 states Single bank charter and core processing system, yet retain local brands, which enhances custome
Slide 5: Footprint Expanding in High Growth Markets
5 Footprint Expanding in High Growth Markets
Slide 6: Selected Deposit Market Share Data
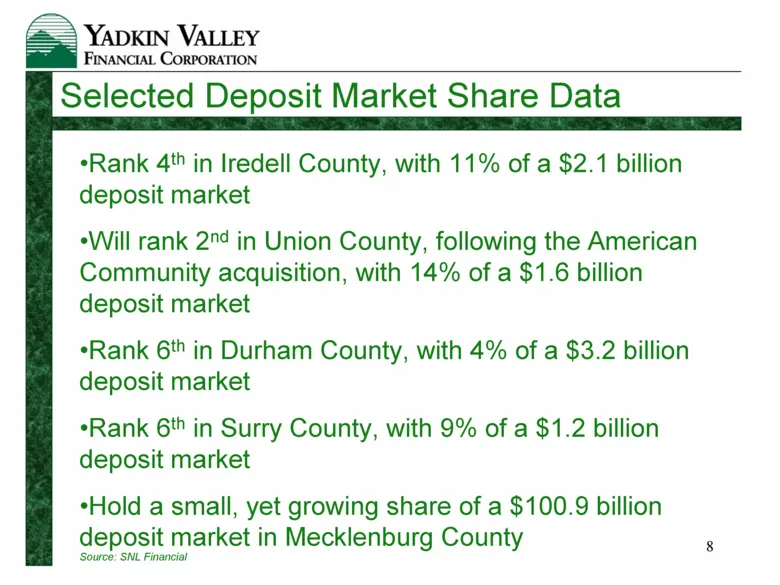
8 Selected Deposit Market Share Data Rank 4th in Iredell County, with 11% of a $2.1 billion deposit market Will rank 2nd in Union County, following the American Community acquisition, with 14% of a $1.6 billion deposit market Rank 6th in Durham County, with 4% of a $3.2 billion deposit market Rank 6
Slide 7: ACBA Acquisition – Strategic Rationale
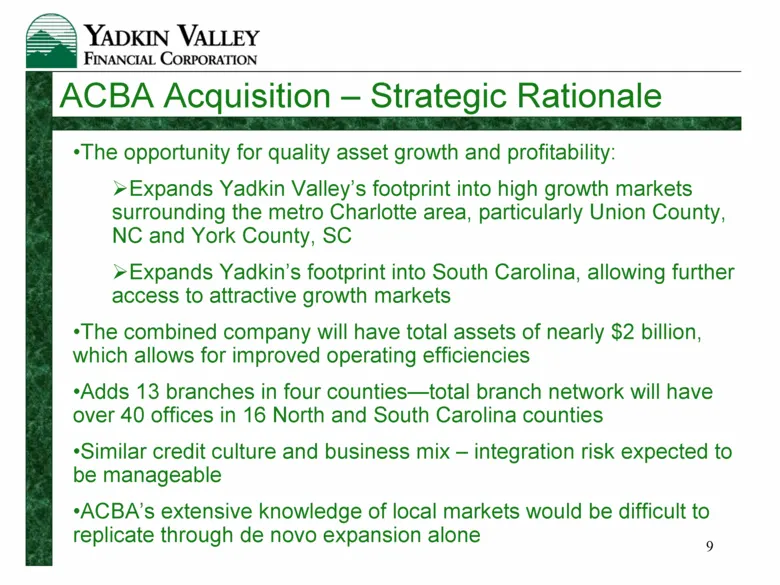
9 ACBA Acquisition – Strategic Rationale The opportunity for quality asset growth and profitability: Expands Yadkin Valley’s footprint into high growth markets surrounding the metro Charlotte area, particularly Union County, NC and York County, SC Expands Yadkin’s footprint into South Carolina, allo
Slide 8: ACBA Acquisition Summary
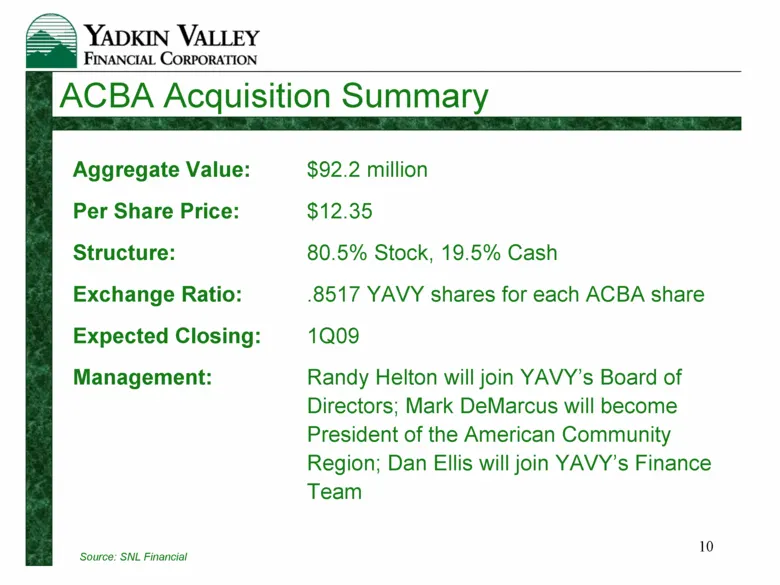
10 ACBA Acquisition Summary Source: SNL Financial Aggregate Value: $92.2 million Per Share Price: $12.35 Structure: 80.5% Stock, 19.5% Cash Exchange Ratio: .8517 YAVY shares for each ACBA share Expected Closing: 1Q09 Management: Randy Helton will join YAVY’s Board of Directors; Mark DeMarcus will be
Slide 9: Complimentary Loan Portfolios
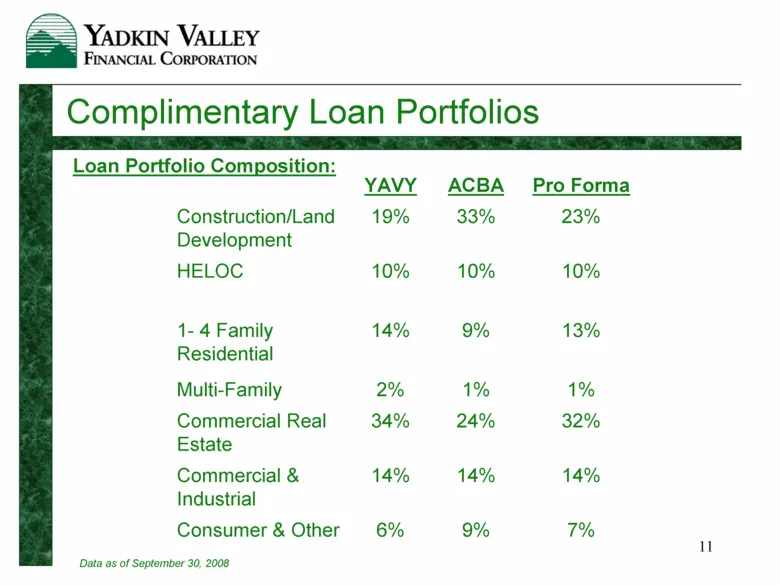
11 Complimentary Loan Portfolios Loan Portfolio Composition: 14% 14% 14% Commercial & Industrial 7% 9% 6% Consumer & Other 32% 24% 34% Commercial Real Estate 1% 1% 2% Multi-Family 13% 9% 14% 1- 4 Family Residential 10% 10% 10% HELOC 23% 33% 19% Construction/Land Development Pro Forma ACBA YAVY Data
Slide 10: Deposit Composition
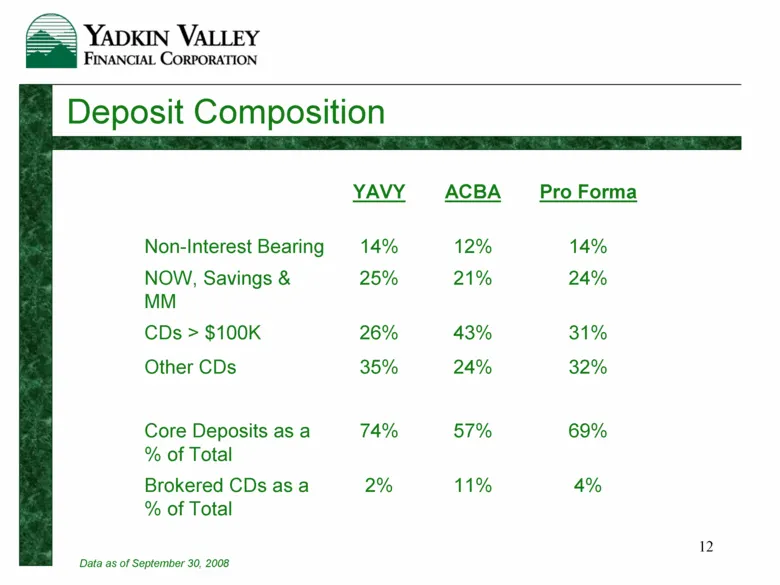
12 Deposit Composition 69% 57% 74% Core Deposits as a % of Total 4% 11% 2% Brokered CDs as a % of Total 32% 24% 35% Other CDs 31% 43% 26% CDs > $100K 24% 21% 25% NOW, Savings & MM 14% 12% 14% Non-Interest Bearing Pro Forma ACBA YAVY Data as of September 30, 2008
Slide 11: Third Quarter 2008 Financial Highlights
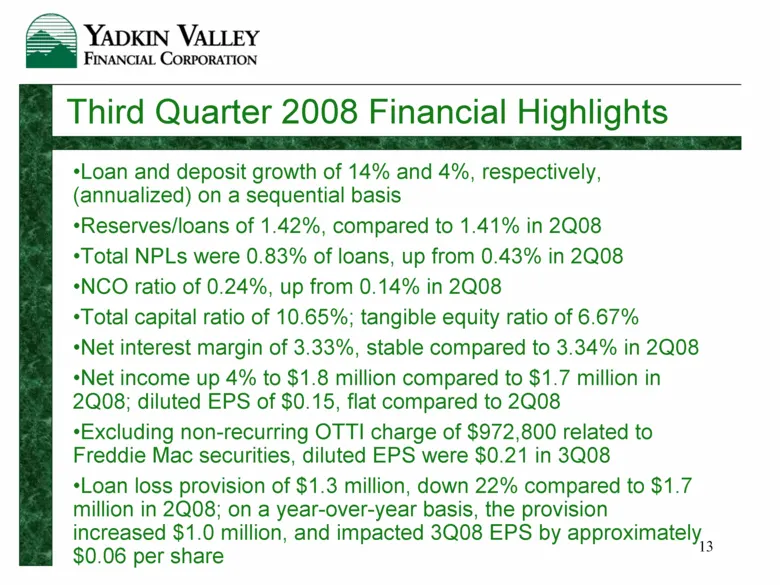
13 Third Quarter 2008 Financial Highlights Loan and deposit growth of 14% and 4%, respectively, (annualized) on a sequential basis Reserves/loans of 1.42%, compared to 1.41% in 2Q08 Total NPLs were 0.83% of loans, up from 0.43% in 2Q08 NCO ratio of 0.24%, up from 0.14% in 2Q08 Total capital ratio of
Slide 12: A Track Record of Solid Growth
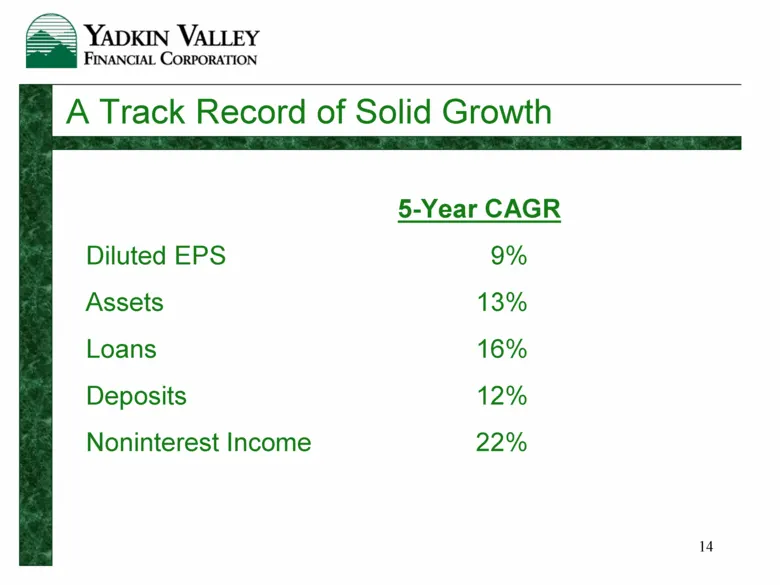
14 A Track Record of Solid Growth 5-Year CAGR Diluted EPS 9% Assets 13% Loans 16% Deposits 12% Noninterest Income 22%
Slide 13: We Continue to Outperform Peers
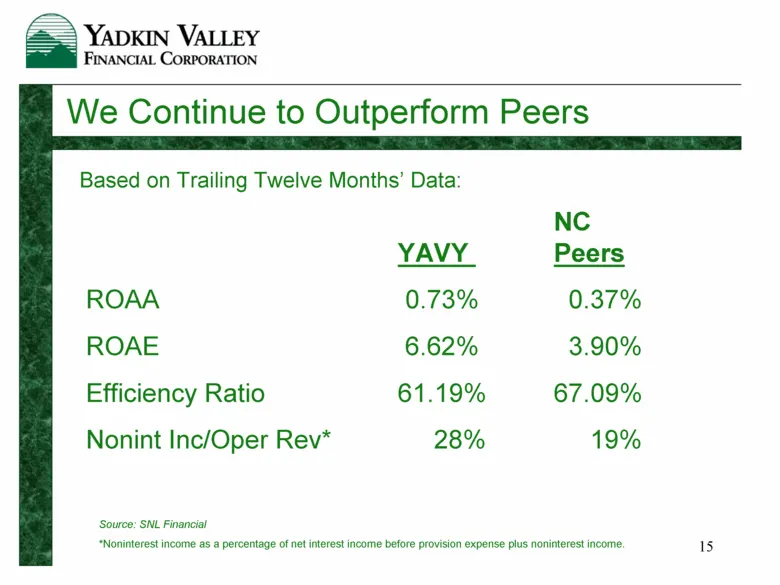
15 We Continue to Outperform Peers NC YAVY Peers ROAA 0.73% 0.37% ROAE 6.62% 3.90% Efficiency Ratio 61.19% 67.09% Nonint Inc/Oper Rev* 28% 19% Based on Trailing Twelve Months’ Data: Source: SNL Financial *Noninterest income as a percentage of net interest income before provision expense plus noninte
Slide 14: Asset Quality Consistently Outperforms Peers (Nonperforming Loans)
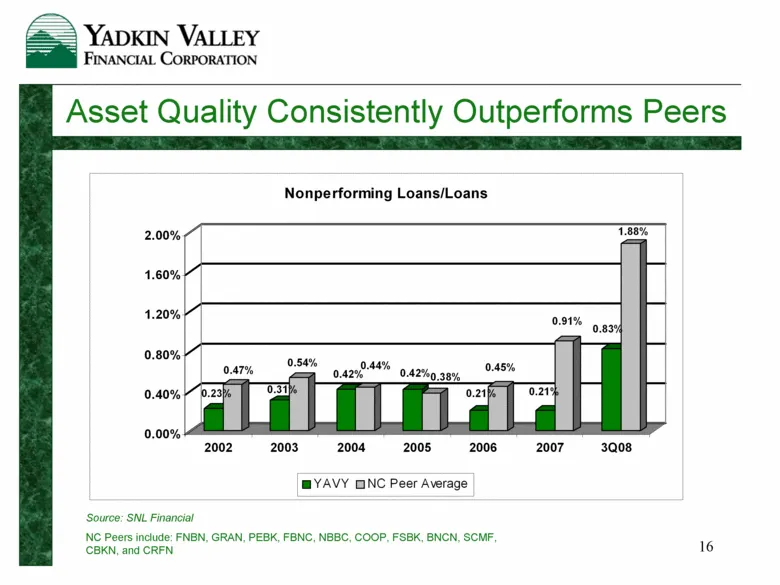
16 Asset Quality Consistently Outperforms Peers Source: SNL Financial NC Peers include: FNBN, GRAN, PEBK, FBNC, NBBC, COOP, FSBK, BNCN, SCMF, CBKN, and CRFN 0.23% 0.47% 0.31% 0.54% 0.42% 0.44% 0.42% 0.38% 0.21% 0.45% 0.21% 0.91% 0.83% 1.88% 0.00% 0.40% 0.80% 1.20% 1.60% 2.00% 2002 2003 2004 2005 200
Slide 15: Asset Quality Consistently Outperforms Peers (NCOs)
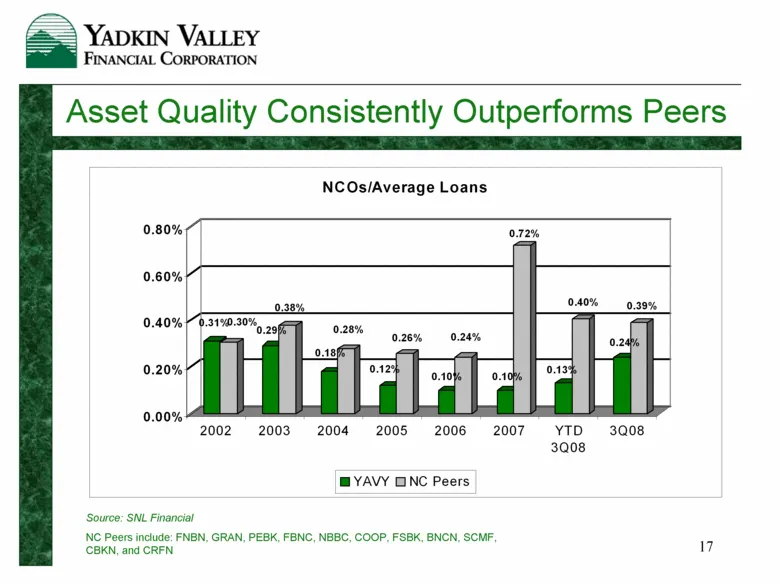
17 Asset Quality Consistently Outperforms Peers Source: SNL Financial NC Peers include: FNBN, GRAN, PEBK, FBNC, NBBC, COOP, FSBK, BNCN, SCMF, CBKN, and CRFN 0.31% 0.30% 0.29% 0.38% 0.18% 0.28% 0.12% 0.26% 0.10% 0.24% 0.10% 0.72% 0.13% 0.40% 0.24% 0.39% 0.00% 0.20% 0.40% 0.60% 0.80% 2002 2003 2004 20
Slide 16: Conservative Loan Loss Reserve Methodology
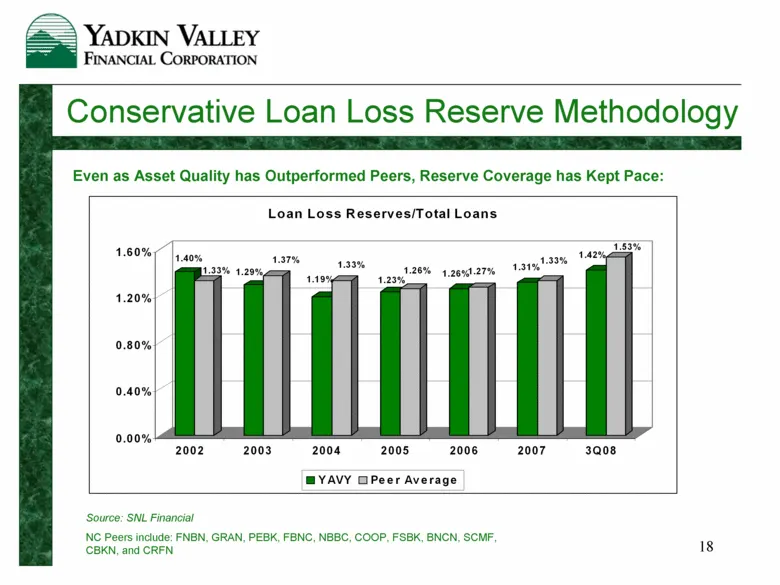
18 Conservative Loan Loss Reserve Methodology Source: SNL Financial NC Peers include: FNBN, GRAN, PEBK, FBNC, NBBC, COOP, FSBK, BNCN, SCMF, CBKN, and CRFN Even as Asset Quality has Outperformed Peers, Reserve Coverage has Kept Pace: 1.4 0% 1.33% 1.29% 1.37% 1.19% 1.33% 1.23% 1.26% 1.26%1.27% 1.31% 1
Slide 17: A Diverse Loan Portfolio
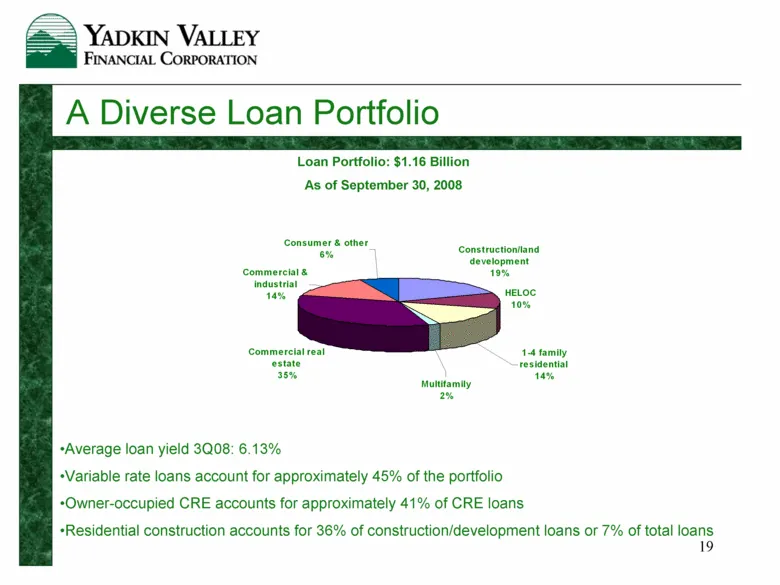
19 A Diverse Loan Portfolio Loan Portfolio: $1.16 Billion As of September 30, 2008 Average loan yield 3Q08: 6.13% Variable rate loans account for approximately 45% of the portfolio Owner-occupied CRE accounts for approximately 41% of CRE loans Residential construction accounts for 36% of constructio
Slide 18: Nonperforming Loans Remain Manageable
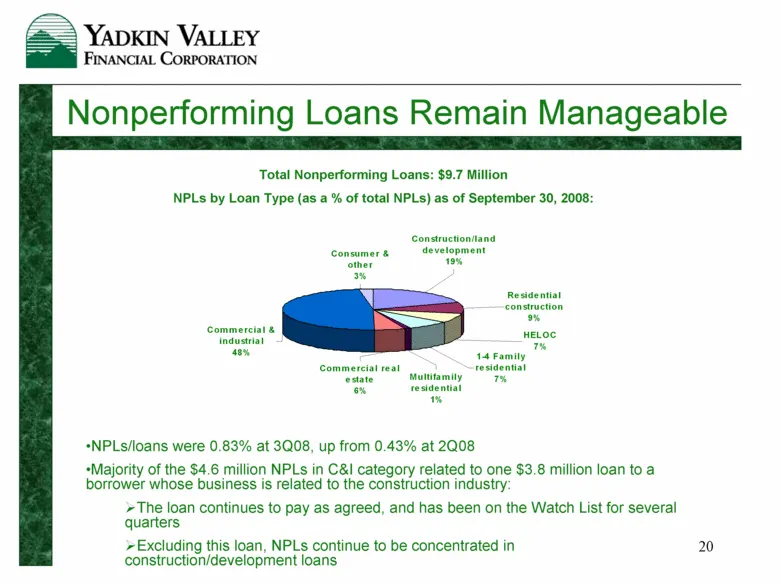
20 Nonperforming Loans Remain Manageable Total Nonperforming Loans: $9.7 Million NPLs by Loan Type (as a % of total NPLs) as of September 30, 2008: NPLs/loans were 0.83% at 3Q08, up from 0.43% at 2Q08 Majority of the $4.6 million NPLs in C&I category related to one $3.8 million loan to a borrower wh
Slide 19: Strong Core Deposit Base Fuels Loan Growth
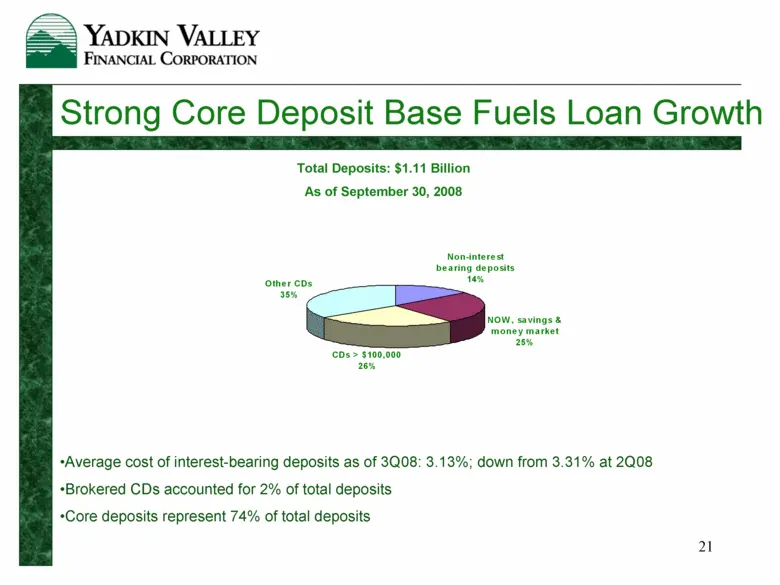
21 Strong Core Deposit Base Fuels Loan Growth Total Deposits: $1.11 Billion As of September 30, 2008 Average cost of interest-bearing deposits as of 3Q08: 3.13%; down from 3.31% at 2Q08 Brokered CDs accounted for 2% of total deposits Core deposits represent 74% of total deposits Non-interest bearing
Slide 20: Managing Through the Current Environment: Net Interest Margin
22 Managing Through the Current Environment Net Interest Margin October Fed rate cuts of 100 bps expected to create additional pressure on NIM—for every 50 bps cut, we anticipate a 10-15 bpt reduction in the NIM. Offsetting this somewhat: –Loan pricing has become more attractive as the competition f
Slide 21: Managing Through the Current Environment: Asset Quality
23 Managing Through the Current Environment Asset Quality Review watch list and nonaccruals regularly Conservative and proactive approach to managing nonperforming loans—approximately 57% of NPLs are currently paying as agreed Loans 30-89 days past due decreased slightly between 3Q08 and 2Q08 ($9.4
Slide 22: Long-Term Vision
24 Long-Term Vision Expansion in high growth areas through: Attractive acquisition opportunities De novo branching LPOs Durham, Wake and Mecklenburg Counties are our primary areas of focus South Carolina remains a long-term goal
Slide 23: Forward-Looking Statement
25 Forward-Looking Statement This presentation contains forward-looking statements, as defined by Federal Securities Laws, including statements about financial outlook and business environment. These statements are provided to assist in the understanding of future financial performance and such perf
Slide 24: For Further Information Contact
26 For Further Information Contact: Edwin Laws, EVP & Chief Financial Officer (336) 526-6313 [email protected]
Source: SEC EDGAR · 8-K filed Nov 17, 2008
More decks from Yadkin Financial Corp
 Merger or Acquisition (August 2016)38 slides · Aug 16, 2016
 Merger or Acquisition (July 2016)20 slides · Jul 21, 2016
 Gulf South Bank Conference 201624 slides · May 2, 2016
 Q1 2016 Earnings Presentation10 slides · Apr 21, 2016
 Q4 2015 Earnings Presentation13 slides · Jan 28, 2016
 Q3 2015 Earnings Presentation29 slides · Nov 10, 2015