Investors Bancorp — Shareholder Meeting (June 2015)
19 slides from Investors Bancorp's shareholder meeting presentation, Jun 10, 2015
Slide 1: Investors Presentation – Annual Shareholder Meeting
Investors Presentation June 9, 2015 1 Annual Shareholder Meeting Exhibit 99.1
Slide 2: Forward Looking Statements
Investors Bancorp, Inc. Investor Presentation Forward Looking Statements Certain statements contained herein are “forward looking statements” within the meaning of Section 27A of the Securities Act of 1933 and Section 21E of the Securities Exchange Act of 1934. Such forward looking statements may be

Slide 3: Core Values
Investors Bancorp, Inc. June 9, 2015 Core Values 3 Cooperation The act of working together towards a common purpose or benefit. Character The combination of features and traits that form the individual nature of a person or team. Community A self-organized network of people who collaborate by sharin
Slide 4: Corporate Profile
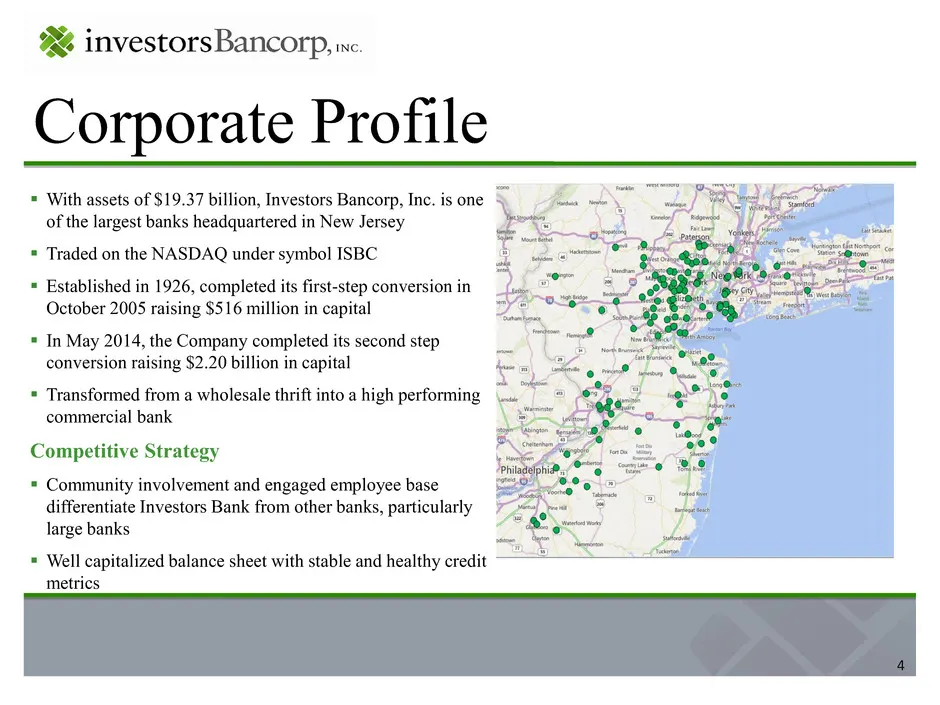
Corporate Profile 4 With assets of $19.37 billion, Investors Bancorp, Inc. is one of the largest banks headquartered in New Jersey Traded on the NASDAQ under symbol ISBC Established in 1926, completed its first-step conversion in October 2005 raising $516 million in capital In May 2014, the
Slide 5: Asset Growth
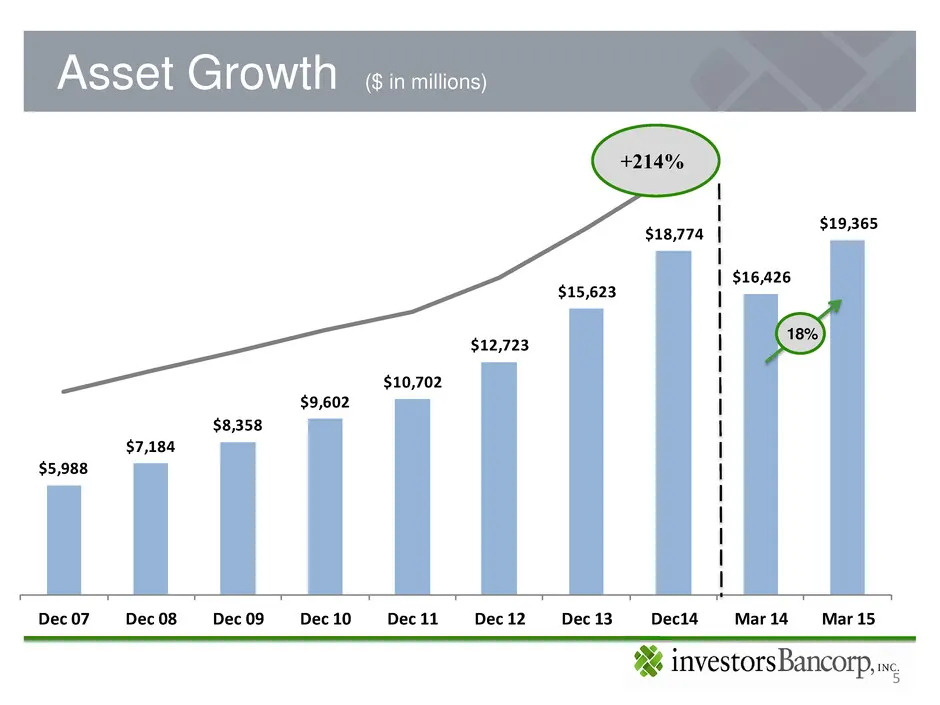
$5,988 $7,184 $8,358 $9,602 $10,702 $12,723 $15,623 $18,774 $16,426 $19,365 Dec 07 Dec 08 Dec 09 Dec 10 Dec 11 Dec 12 Dec 13 Dec14 Mar 14 Mar 15 Asset Growth ($ in millions) 5 +214% 18%
Slide 6: Loan Growth
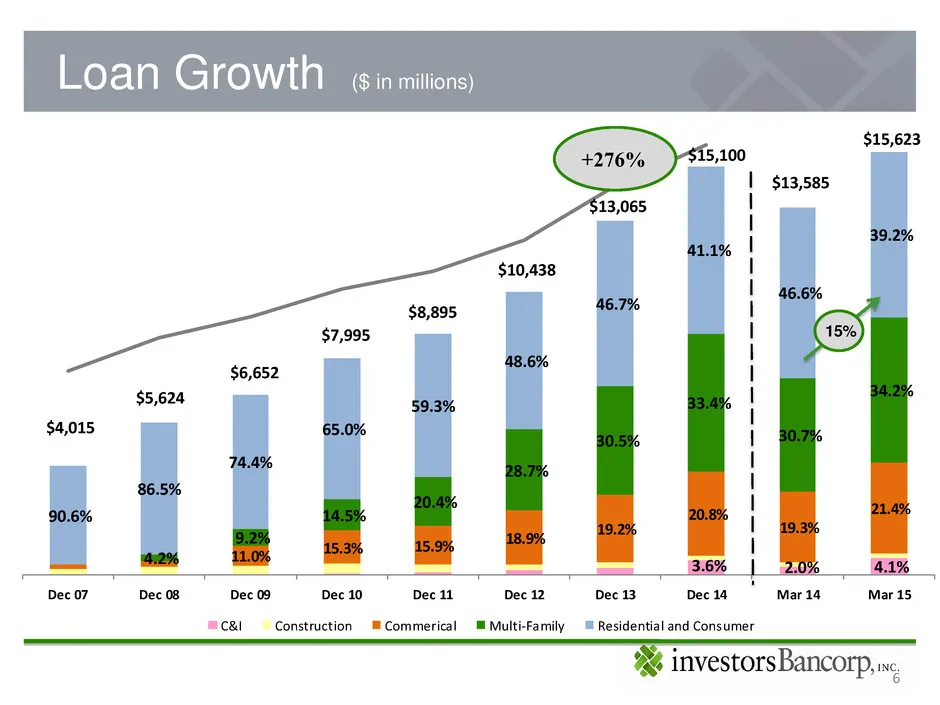
$4,015 $5,624 $6,652 $7,995 $8,895 $10,438 $13,065 $15,100 $13,585 $15,623 90.6% 86.5% 74.4% 65.0% 59.3% 48.6% 46.7% 41.1% 46.6% 39.2% 4.2% 9.2% 14.5% 20.4% 28.7% 30.5% 33.4% 30.7% 34.2% 11.0% 15.3% 15.9% 18.9% 19.2% 20.8% 19.3% 21.4% 3.6% 2.0% 4.1% Dec 07 Dec 08 Dec 09 Dec 10 Dec 11 Dec 12 Dec 13 D
Slide 7: Lending Initiatives
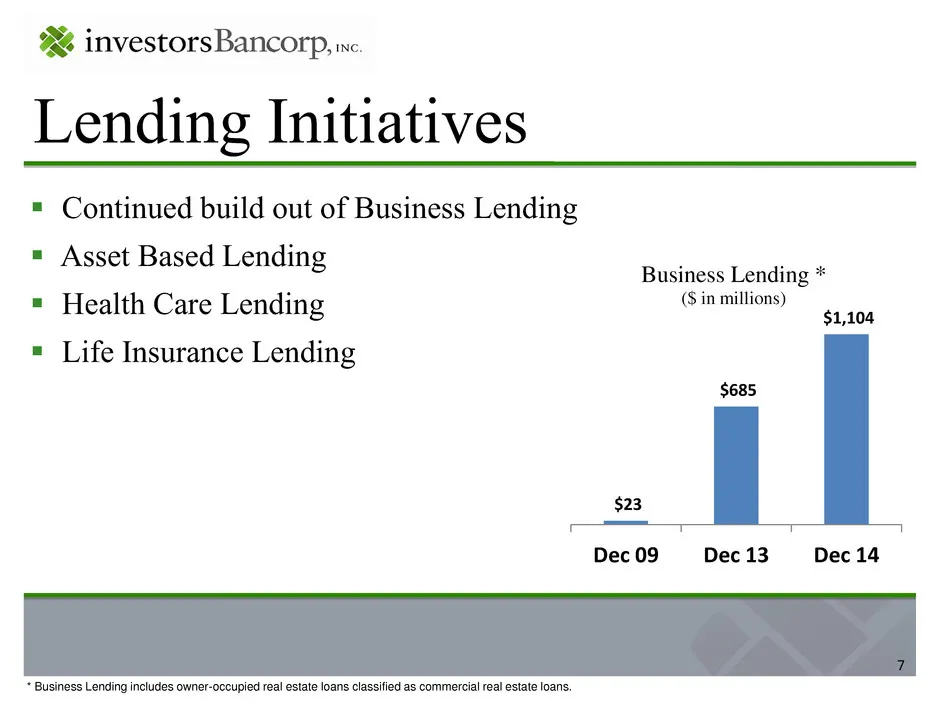
Lending Initiatives 7 Continued build out of Business Lending Asset Based Lending Health Care Lending Life Insurance Lending $23 $685 $1,104 Dec 09 Dec 13 Dec 14 Business Lending * ($ in millions) * Business Lending includes owner-occupied real estate loans classified as commercial real esta
Slide 8: Asset Quality
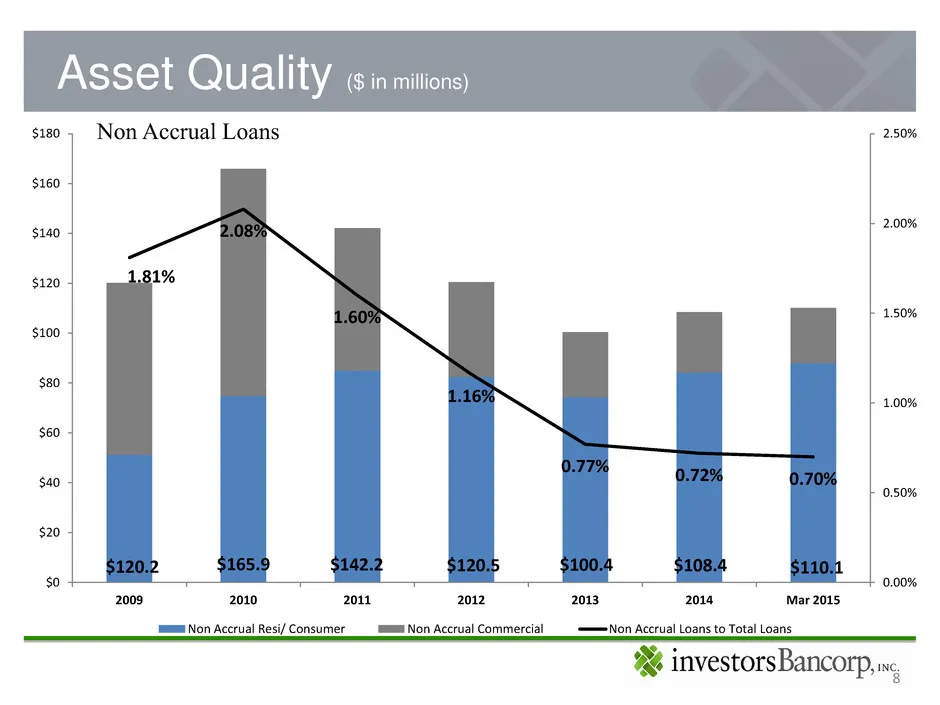
Asset Quality ($ in millions) 8 $120.2 $165.9 $142.2 $120.5 $100.4 $108.4 $110.1 1.81% 2.08% 1.60% 1.16% 0.77% 0.72% 0.70% 0.00% 0.50% 1.00% 1.50% 2.00% 2.50% $0 $20 $40 $60 $80 $100 $120 $140 $160 $180 2009 2010 2011 2012 2013 2014 Mar 2015 Non Accrual Resi/ Consumer Non Accrual Commercial Non Accr
Slide 9: Deposit Growth
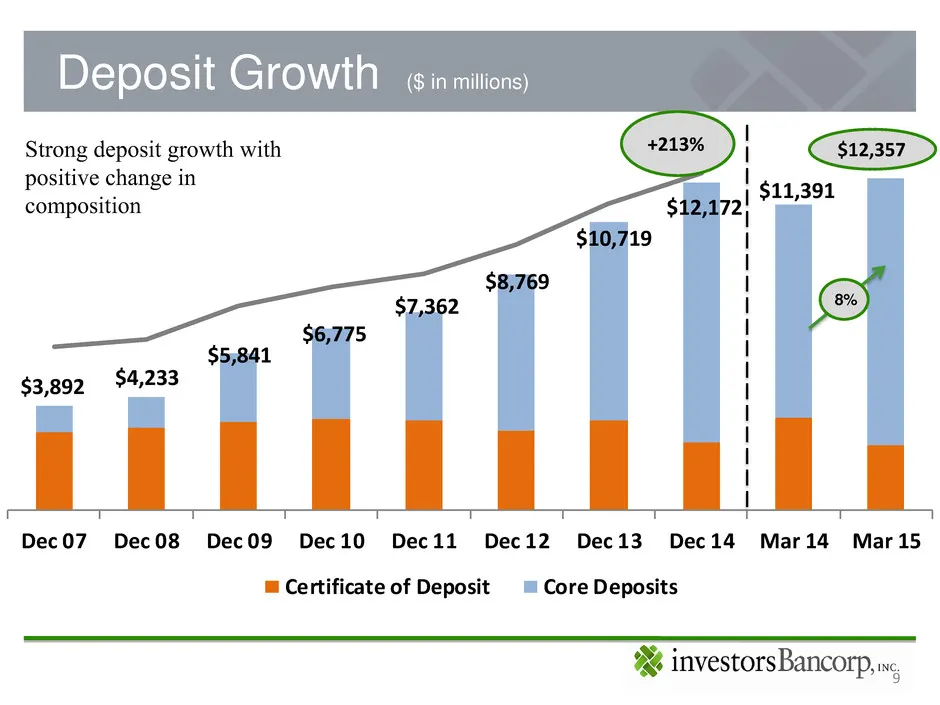
$3,892 $4,233 $5,841 $6,775 $7,362 $8,769 $10,719 $12,172 $11,391 Dec 07 Dec 08 Dec 09 Dec 10 Dec 11 Dec 12 Dec 13 Dec 14 Mar 14 Mar 15 Certificate of Deposit Core Deposits Deposit Growth ($ in millions) 9 Strong deposit growth with positive change in composition +213% $12,357 8%
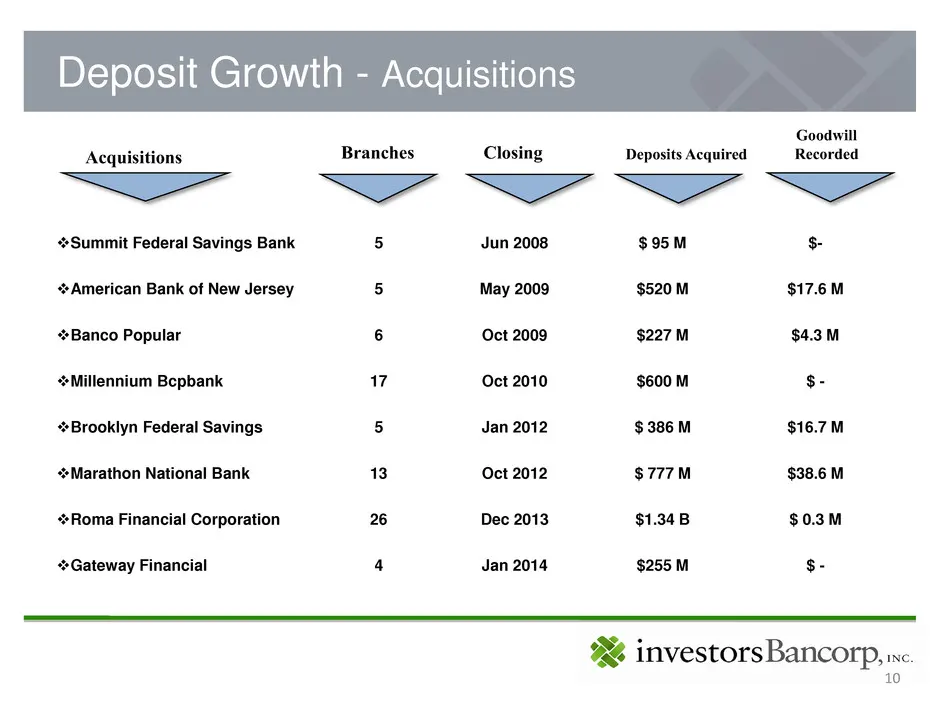
Slide 10: Deposit Growth - Acquisitions
Summit Federal Savings Bank 5 Jun 2008 $ 95 M $- American Bank of New Jersey 5 May 2009 $520 M $17.6 M Banco Popular 6 Oct 2009 $227 M $4.3 M Millennium Bcpbank 17 Oct 2010 $600 M $ - Brooklyn Federal Savings 5 Jan 2012 $ 386 M $16.7 M Marathon National Bank 13 Oct 2012 $ 777 M $38.6 M Roma F
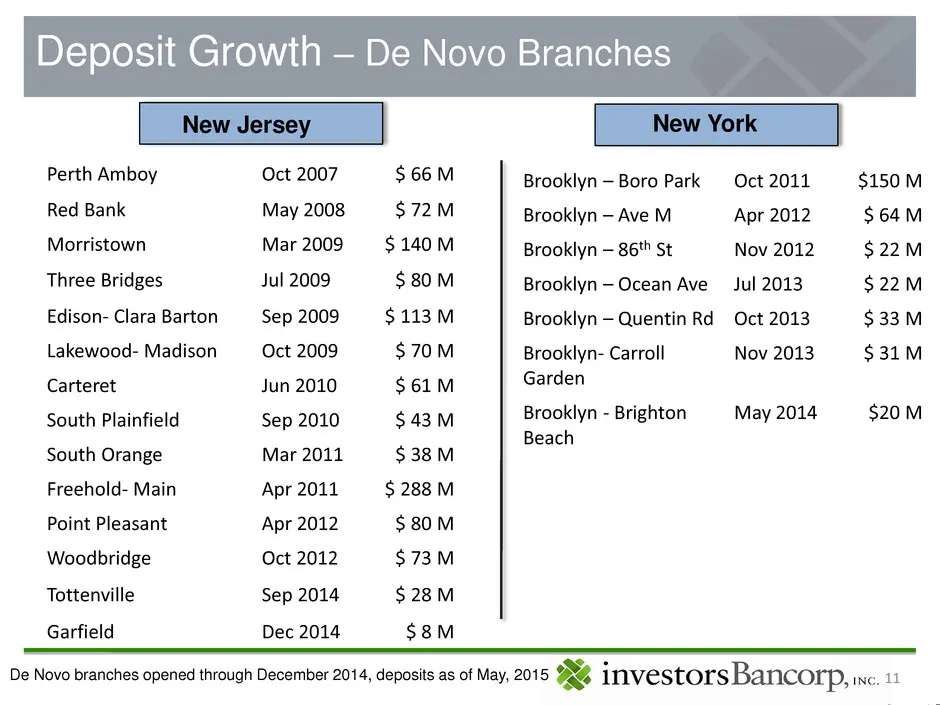
Slide 11: Deposit Growth – De Novo Branches
Brooklyn – Boro Park Oct 2011 $150 M Brooklyn – Ave M Apr 2012 $ 64 M Brooklyn – 86th St Nov 2012 $ 22 M Brooklyn – Ocean Ave Jul 2013 $ 22 M Brooklyn – Quentin Rd Oct 2013 $ 33 M Brooklyn- Carroll Garden Nov 2013 $ 31 M Brooklyn - Brighton Beach May 2014 $20 M Deposit Growth – De Novo Branches 11 N
Slide 12: Business Initiatives
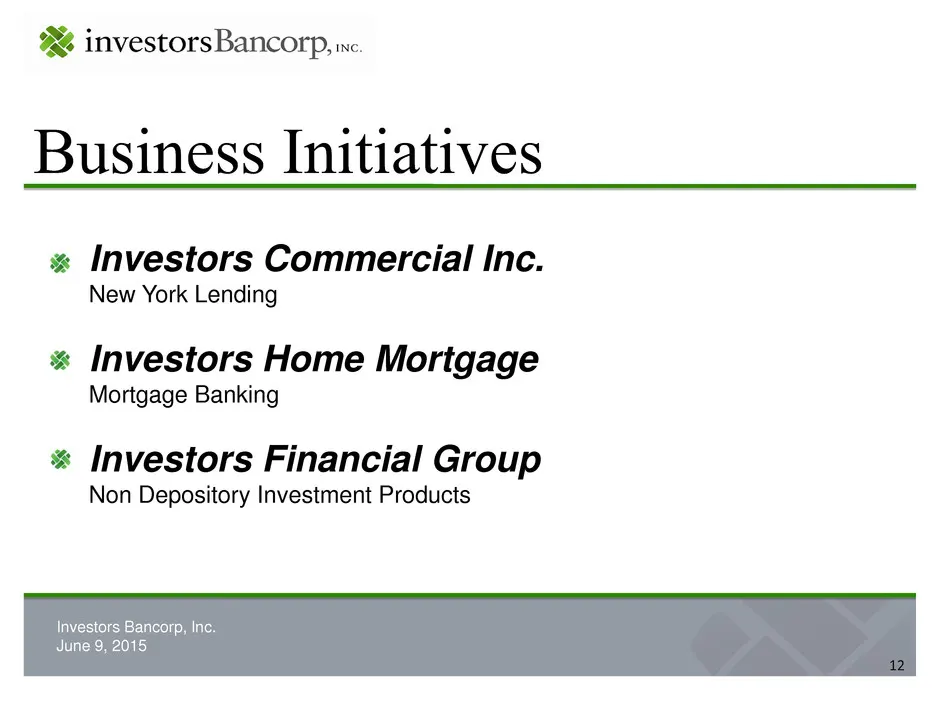
Investors Bancorp, Inc. June 9, 2015 Business Initiatives 12 Investors Commercial Inc. New York Lending Investors Home Mortgage Mortgage Banking Investors Financial Group Non Depository Investment Products
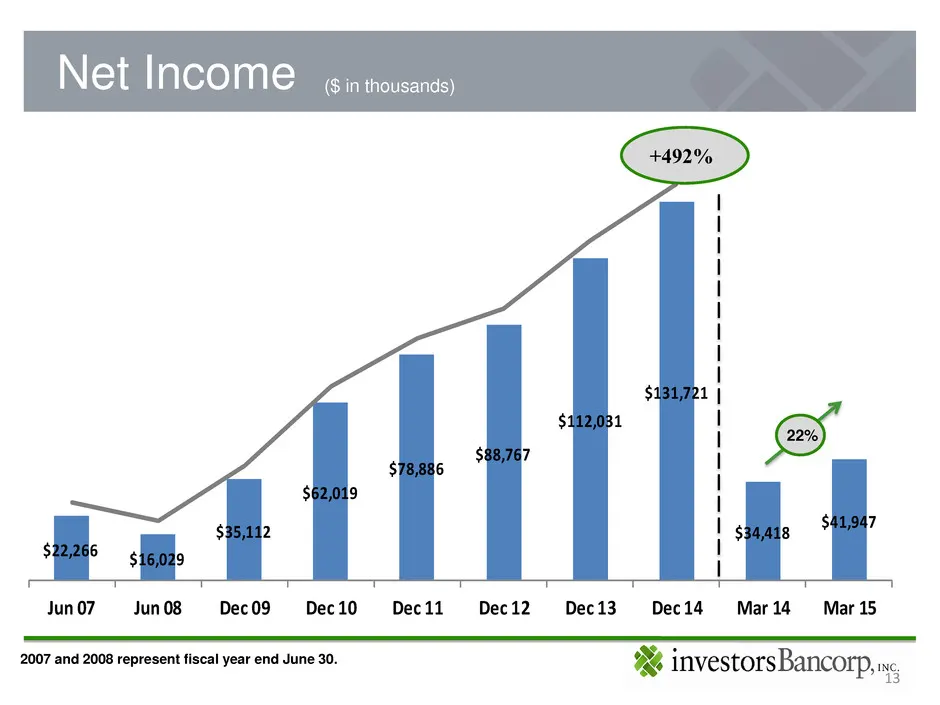
Slide 13: Net Income
$22,266 $16,029 $35,112 $62,019 $78,886 $88,767 $112,031 $131,721 $34,418 $41,947 Jun 07 Jun 08 Dec 09 Dec 10 Dec 11 Dec 12 Dec 13 Dec 14 Mar 14 Mar 15 Net Income 13 +492% 2007 and 2008 represent fiscal year end June 30. ($ in thousands) 22%
Slide 14: ISBC Financial Highlights
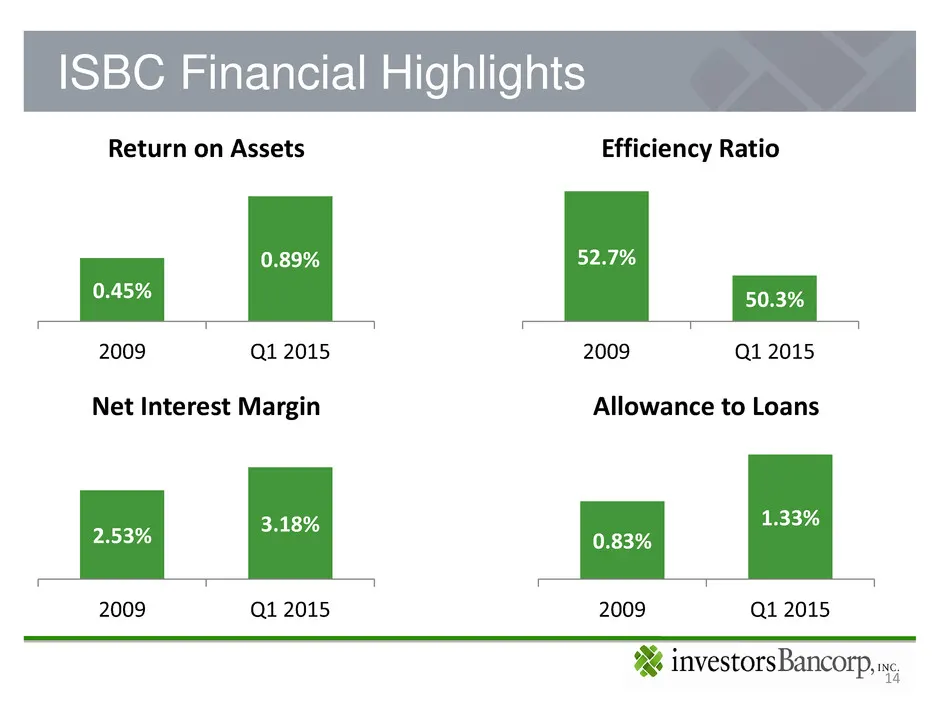
ISBC Financial Highlights 14 0.45% 0.89% 2009 Q1 2015 Return on Assets 52.7% 50.3% 2009 Q1 2015 Efficiency Ratio 2.53% 3.18% 2009 Q1 2015 Net Interest Margin 0.83% 1.33% 2009 Q1 2015 Allowance to Loans
Slide 15: Strong Financial Metrics vs. Peers
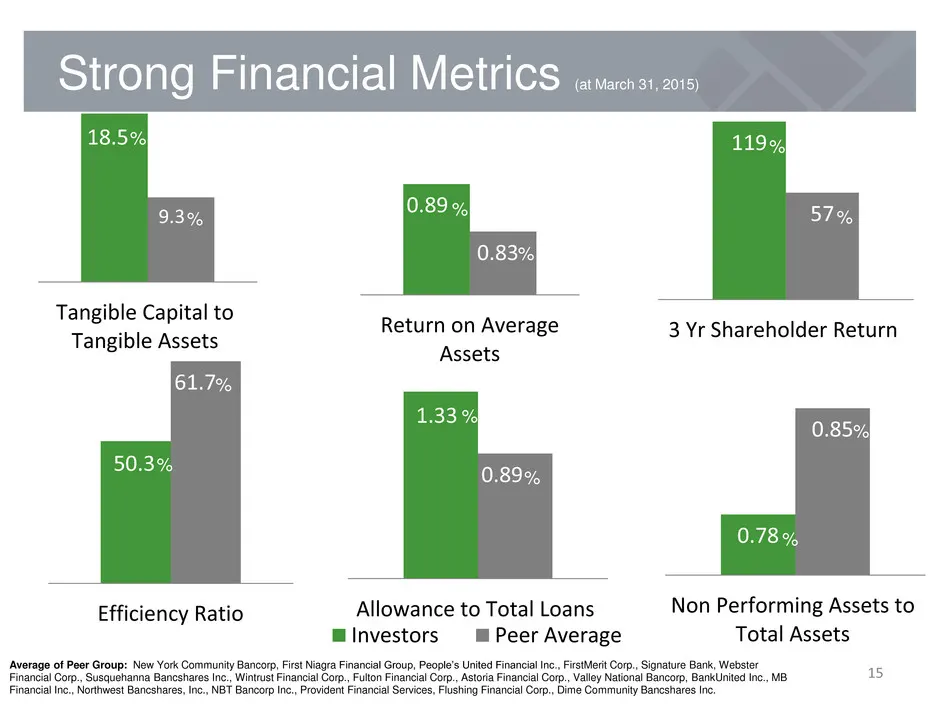
18.5 9.3 Tangible Capital to Tangible Assets 15 119 57 3 Yr Shareholder Return 50.3 61.7 Efficiency Ratio Investors Peer Average Average of Peer Group: New York Community Bancorp, First Niagra Financial Group, People’s United Financial Inc., FirstMerit Corp., Signature Bank, Webster Financial Corp.,
Slide 16: Strategic Plan Initiatives
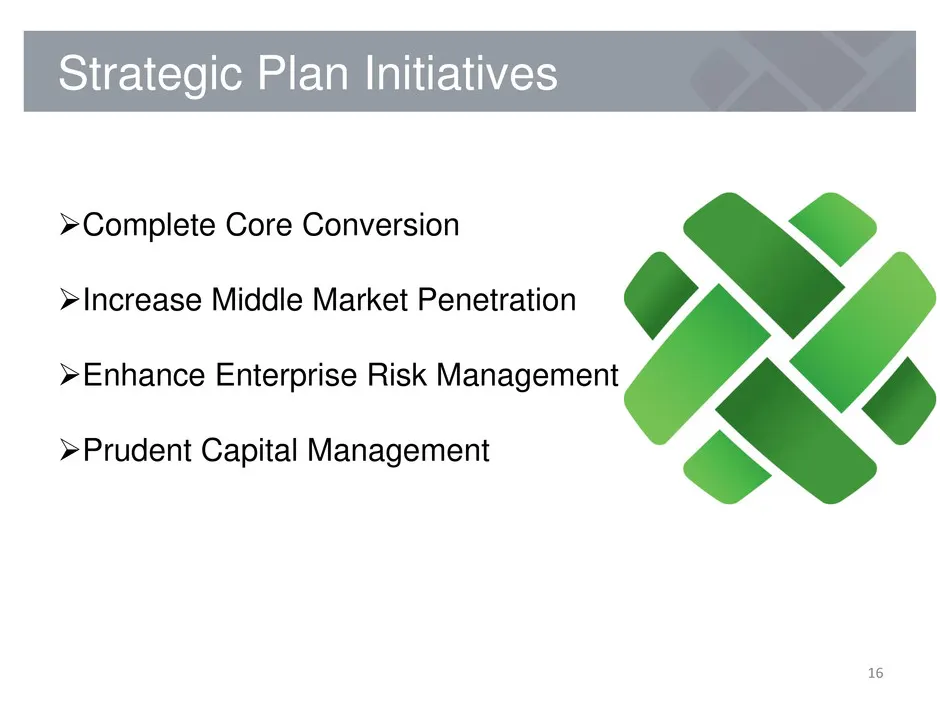
16 Strategic Plan Initiatives Complete Core Conversion Increase Middle Market Penetration Enhance Enterprise Risk Management Prudent Capital Management
Slide 17: Capital Management
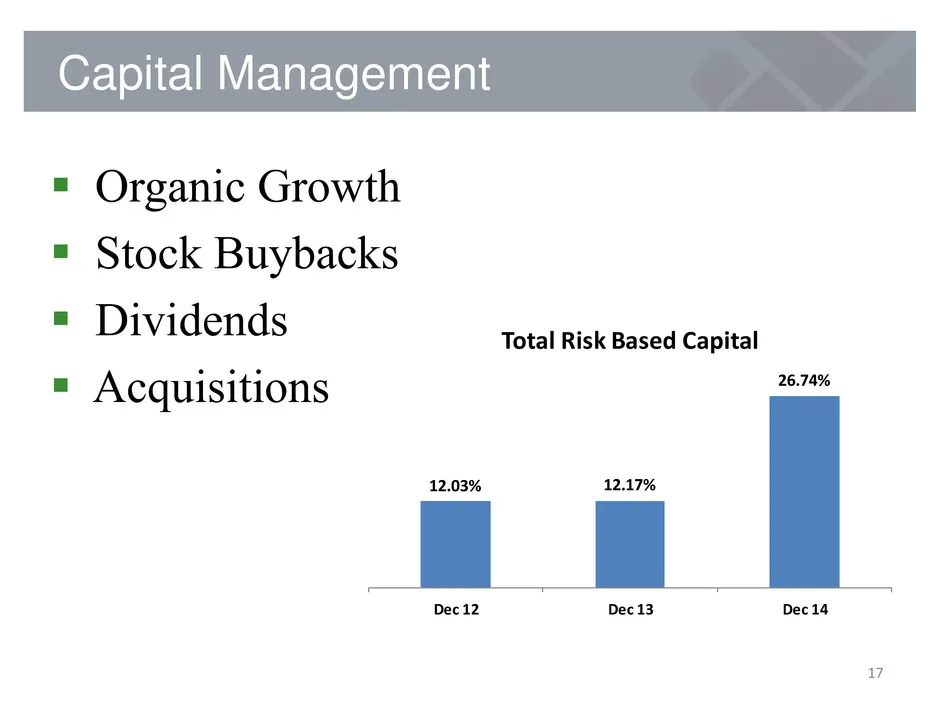
17 Capital Management Organic Growth Stock Buybacks Dividends Acquisitions 12.03% 12.17% 26.74% Dec 12 Dec 13 Dec 14 Total Risk Based Capital
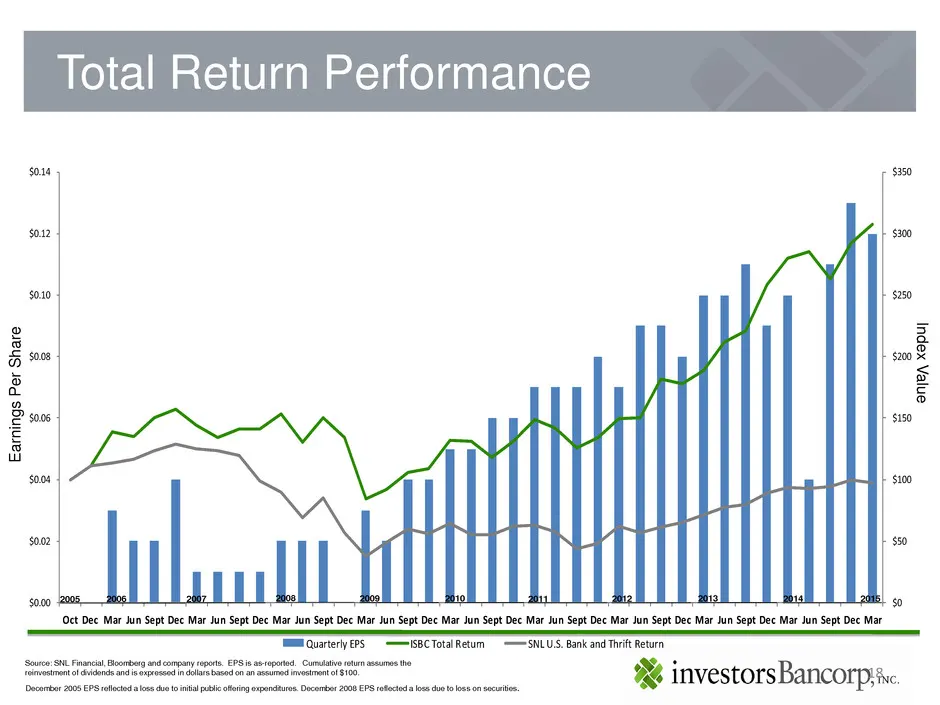
Slide 18: Total Return Performance
$0 $50 $100 $150 $200 $250 $300 $350 $0.00 $0.02 $0.04 $0.06 $0.08 $0.10 $0.12 $0.14 Oct Dec Mar Jun Sept Dec Mar Jun Sept Dec Mar Jun Sept Dec Mar Jun Sept Dec Mar Jun Sept Dec Mar Jun Sept Dec Mar Jun Sept Dec Mar Jun Sept Dec Mar Jun Sept Dec Mar Quarterly EPS ISBC Total Return SNL U.S. Bank and

Slide 19: Thank You
Thank You For More Information: • Log onto our web site: www.myinvestorsbank.com • Log onto our website above or www.sec.gov to obtain free copies of documents filed by Investors with the SEC 19
Source: SEC EDGAR · 8-K filed Jun 10, 2015
More decks from Investors Bancorp Inc
 Q4 2021 Earnings Presentation4 slides · Jan 26, 2022
 Q3 2021 Earnings Presentation4 slides · Oct 27, 2021
 Q2 2021 Earnings Presentation4 slides · Jul 28, 2021
 Merger or Acquisition (July 2021)17 slides · Jul 28, 2021
 Q1 2021 Earnings Presentation4 slides · Apr 28, 2021
 Q4 2020 Earnings Presentation4 slides · Jan 28, 2021