Pacific Mercantile Bancorp — Shareholder Meeting (May 2015)
23 slides from Pacific Mercantile Bancorp's shareholder meeting presentation, May 20, 2015
Slide 1: President's Report 2015 Annual Meeting
PACIFIC MERCANTILE BANCORP PRESIDENT’S REPORT 2 0 1 5 A N N U A L M E E T I N G
Slide 2: Forward-looking statements
PACIFIC MERCANTILE BANCORP This presentation contains statements regarding our expectations, beliefs and views about our future financial performance and our business, trends and expectations regarding the markets in which we operate, and our future plans. Those statements constitute “forward-lookin
Slide 3: Orange County Economic Trends
PACIFIC MERCANTILE BANCORP ORANGE COUNTY ECONOMIC TRENDS
Slide 4: 2014 VC Investment by MSA
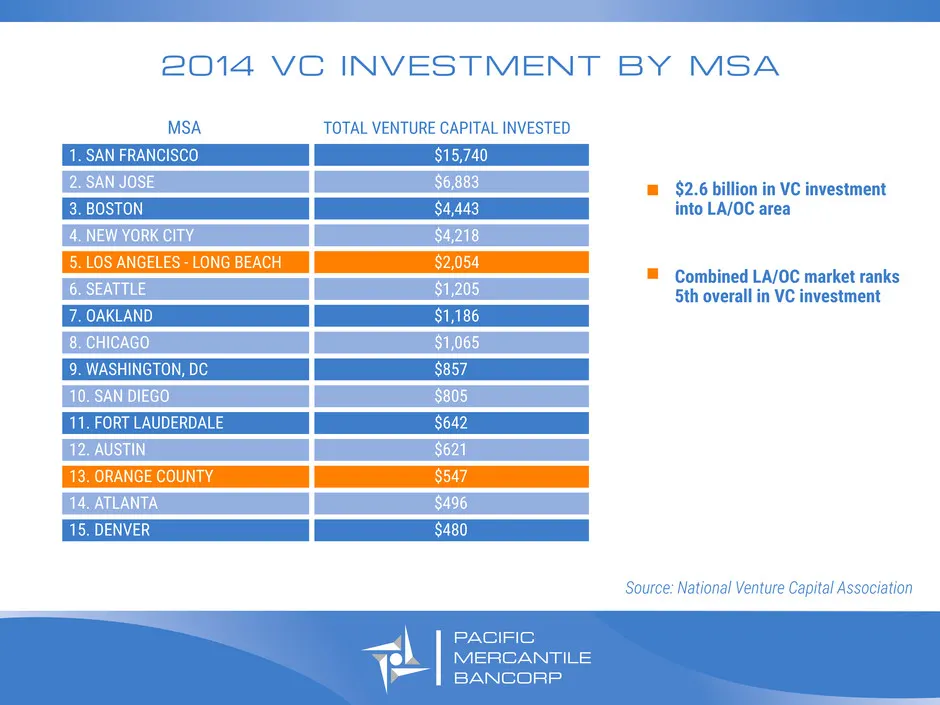
PACIFIC MERCANTILE BANCORP 2014 VC INVESTMENT BY MSA $15,740 $6,883 $4,443 $4,218 $2,054 $1,205 $1,186 $1,065 $857 $805 $642 $621 $547 $496 $480 Combined LA/OC market ranks 5th overall in VC investment TOTAL VENTURE CAPITAL INVESTEDMSA $2.6 billion in VC investment into LA/OC area 1. SAN FRANCISCO 2
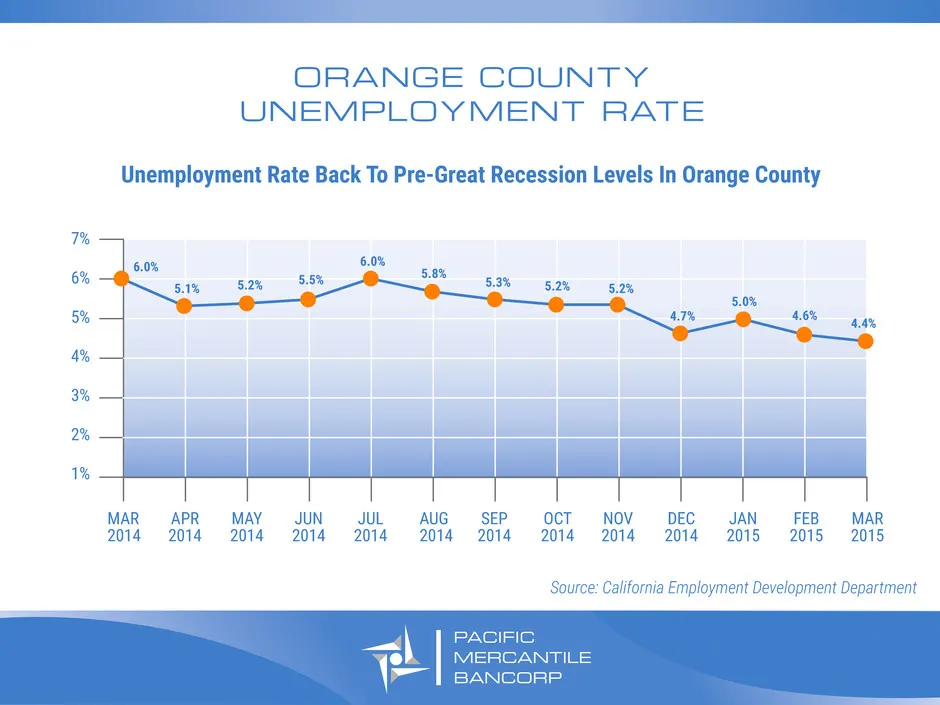
Slide 5: Orange County Unemployment Rate
ORANGE COUNTY UNEMPLOYMENT RATE PACIFIC MERCANTILE BANCORP 7% 6% 5% 4% 3% 2% 1% MAR 2014 APR 2014 MAY 2014 JUN 2014 JUL 2014 AUG 2014 SEP 2014 OCT 2014 NOV 2014 DEC 2014 JAN 2015 FEB 2015 MAR 2015 Unemployment Rate Back To Pre-Great Recession Levels In Orange County 6.0% 5.1% 5.2% 5.5% 6.0% 5.8% 5.3
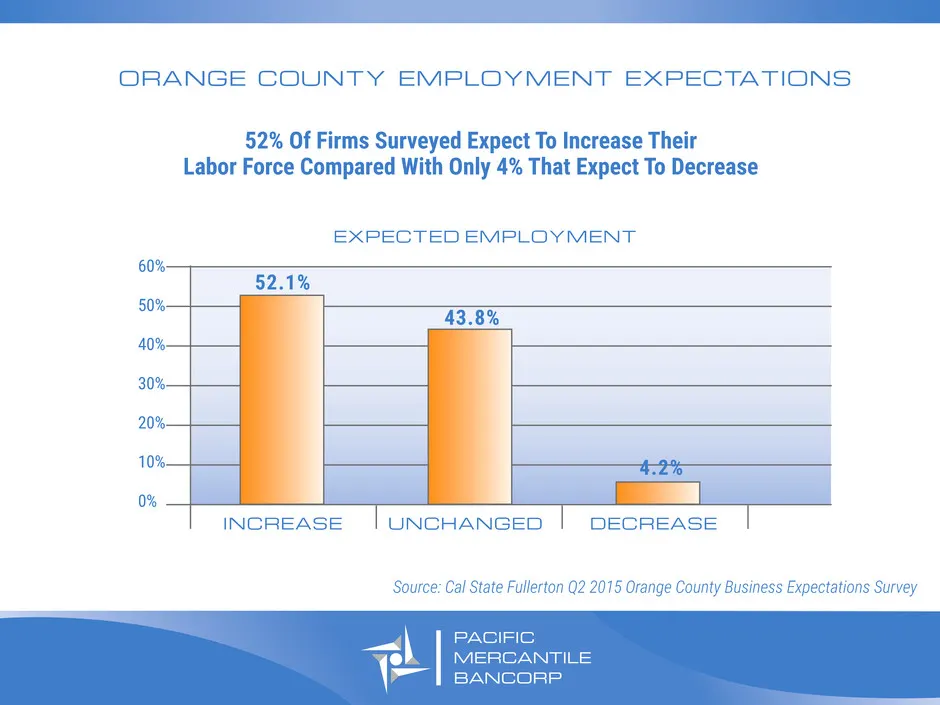
Slide 6: Orange County Employment Expectations
PACIFIC MERCANTILE BANCORP 60% 50% 40% 30% 20% 10% 0% EXPECTED EMPLOYMENT ORANGE COUNTY EMPLOYMENT EXPECTATIONS 52% Of Firms Surveyed Expect To Increase Their Labor Force Compared With Only 4% That Expect To Decrease INCREASE 52.1% 43.8% 4.2% UNCHANGED DECREASE Source: Cal State Fullerton Q2 2015 Or
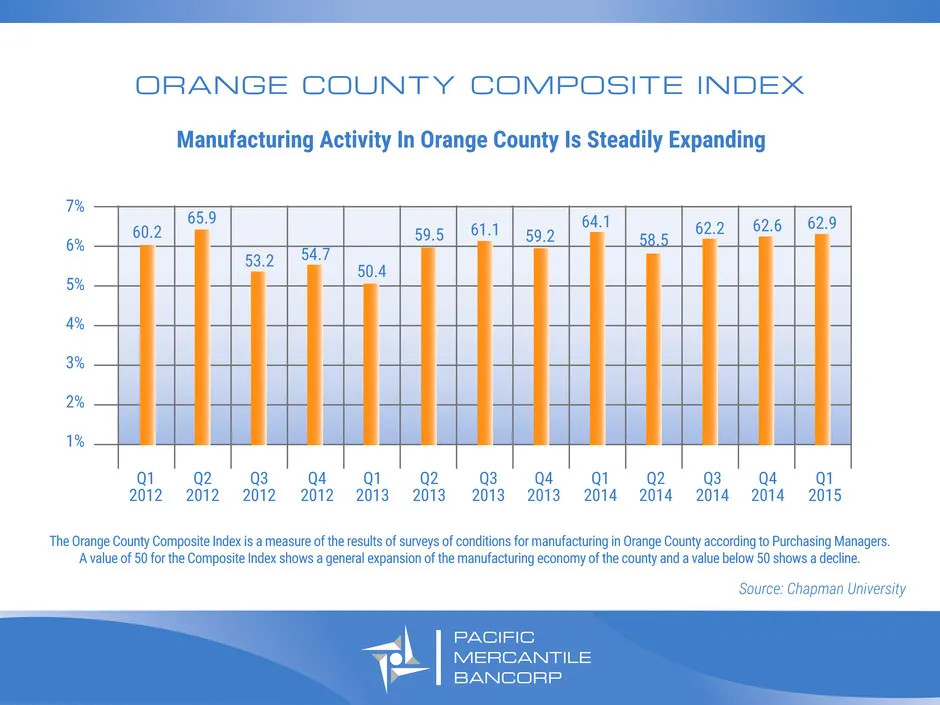
Slide 7: Orange County Composite Index
PACIFIC MERCANTILE BANCORP Source: Chapman University 7% 6% 5% 4% 3% 2% 1% 60.2 65.9 53.2 54.7 50.4 59.5 61.1 59.2 64.1 58.5 62.2 62.6 62.9 Q1 2012 Q2 2012 Q3 2012 Q4 2012 Q1 2013 Q2 2013 Q3 2013 Q4 2013 Q1 2014 Q2 2014 Q3 2014 Q4 2014 Q1 2015 The Orange County Composite Index is a measure of the re
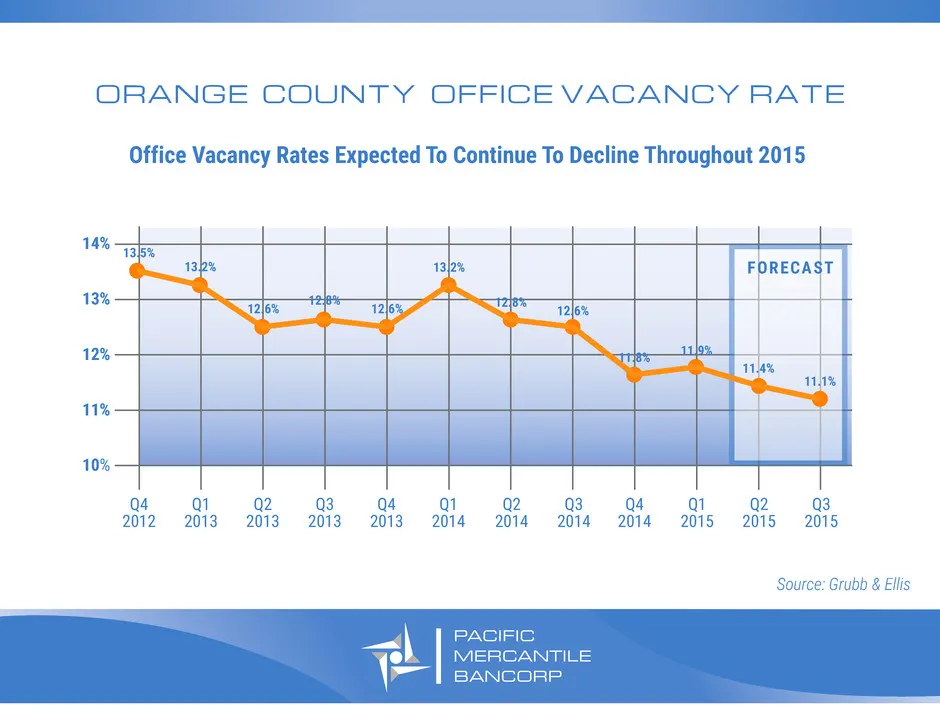
Slide 8: Orange County Office Vacancy Rate
PACIFIC MERCANTILE BANCORP Office Vacancy Rates Expected To Continue To Decline Throughout 2015 ORANGE COUNTY OFFICE VACANCY RATE 14% 13% 12% 11% 10% Q4 2012 Q1 2013 Q2 2013 Q3 2013 Q4 2013 Q1 2014 Q2 2014 Q3 2014 Q4 2014 Q1 2015 Q2 2015 Q3 2015 FORECAST 13.5% 13.2% 12.6% 12.8% 12.6% 13.2% 12.6% 12.
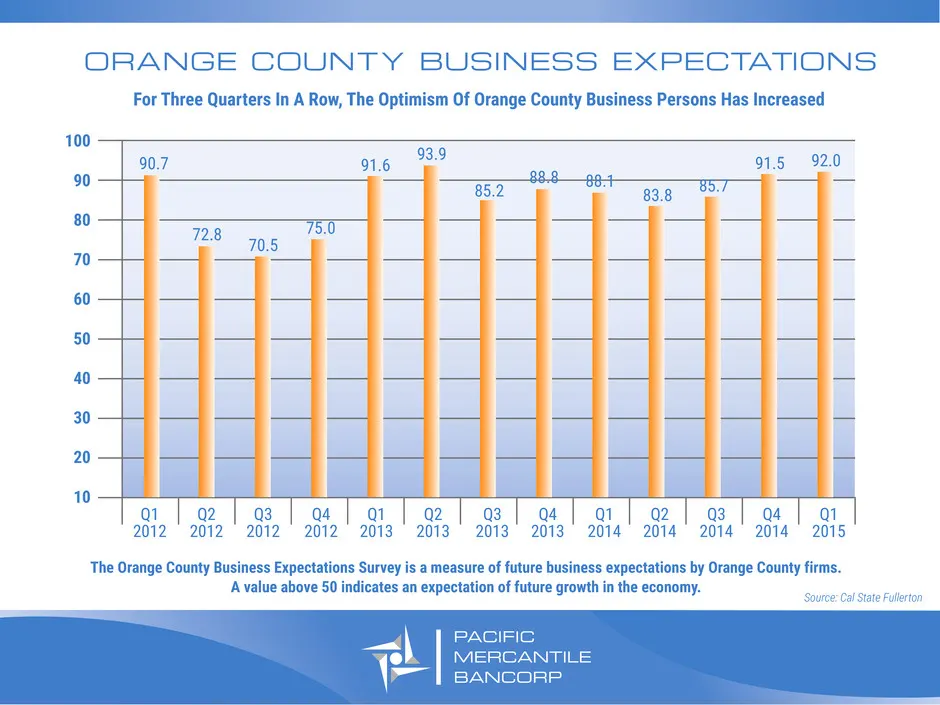
Slide 9: Orange County Business Expectations
PACIFIC MERCANTILE BANCORP For Three Quarters In A Row, The Optimism Of Orange County Business Persons Has Increased ORANGE COUNTY BUSINESS EXPECTATIONS Source: Cal State Fullerton 100 90 80 70 60 50 40 30 20 10 90.7 72.8 70.5 75.0 91.6 93.9 85.2 88.8 88.1 83.8 85.7 91.5 92.0 Q1 2012 Q2 2012 Q3 2012
Slide 10: 2014 Review & Key Performance Indicators
PACIFIC MERCANTILE BANCORP 2014 REVIEW & KEY PERFORMANCE INDICATORS
Slide 11: 2014 in Review
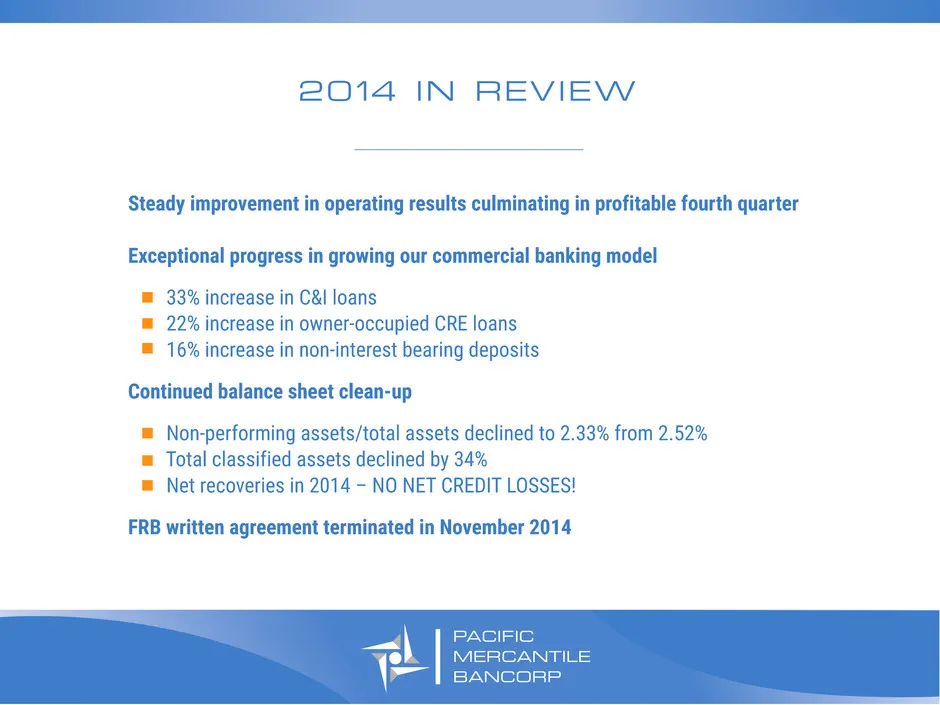
PACIFIC MERCANTILE BANCORP Steady improvement in operating results culminating in profitable fourth quarter Exceptional progress in growing our commercial banking model 33% increase in C&I loans 22% increase in owner-occupied CRE loans 16% increase in non-interest bearing deposits Continued balance
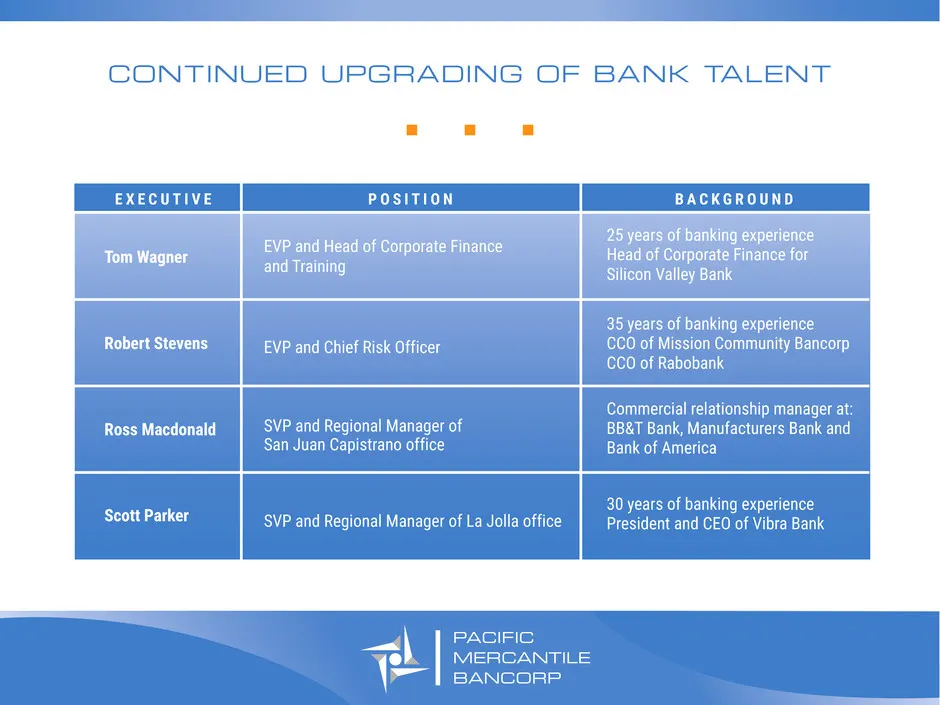
Slide 12: Continued Upgrading of Bank Talent
PACIFIC MERCANTILE BANCORP Steady improvement in operating results culminating in profitable fourth quarter Exceptional progress in growing our commercial banking model 33% increase in C&I loans 22% increase in owner-occupied CRE loans 16% increase in non-interest bearing deposits Continued balance
Slide 13: Key Performance Indicators Progress Report
Continue building relationship-oriented banking model Expand specialty lending businesses Improve deposit mix with more core deposits Maintain strong capital ratios KEY PERFORMANCE INDICATORS PROGRESS REPORT PACIFIC MERCANTILE BANCORP
Slide 14: Continue Building Relationship-Oriented Banking Model
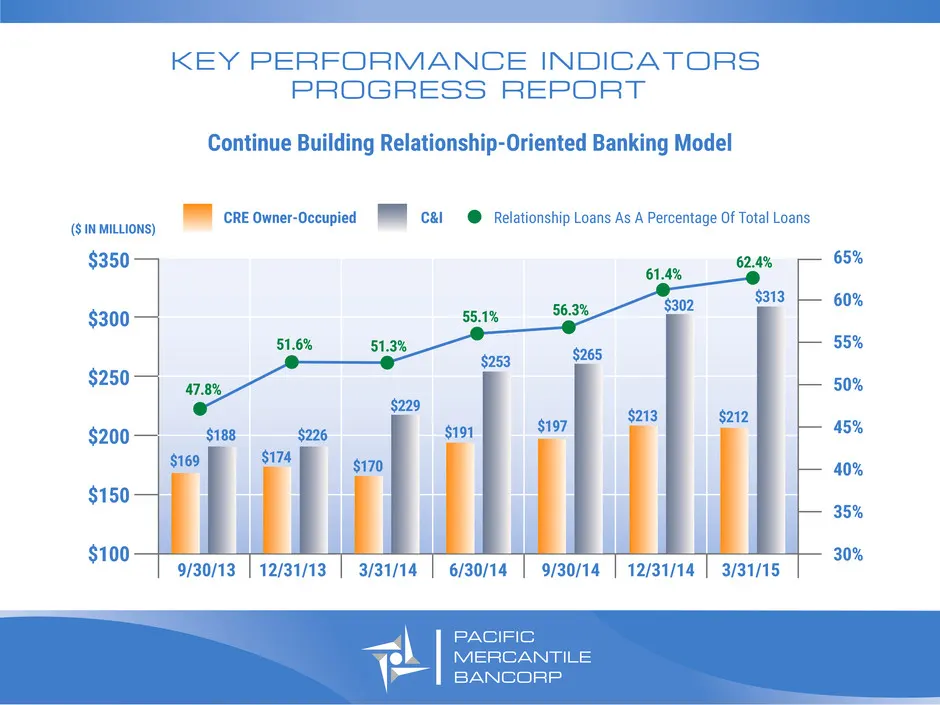
$350 $300 $250 $200 $150 $100 ($ IN MILLIONS) CRE Owner-Occupied C&I Relationship Loans As A Percentage Of Total Loans 65% 60% 55% 50% 45% 40% 35% 30% KEY PERFORMANCE INDICATORS PROGRESS REPORT Continue Building Relationship-Oriented Banking Model $169 9/30/13 12/31/13 3/31/14 6/30/14 9/30/14 12/31/
Slide 15: Expand Specialty Lending: Entertainment Financing
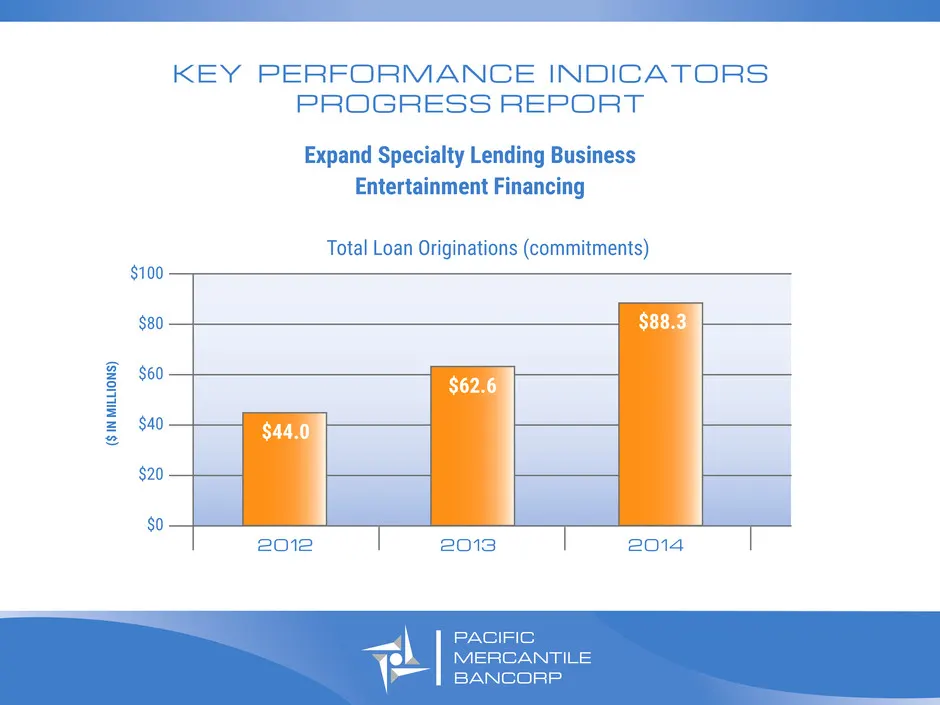
PACIFIC MERCANTILE BANCORP $100 $80 $60 $40 $20 $0 2012 2013 2014 $88.3 $62.6 $44.0 Expand Specialty Lending Business Entertainment Financing KEY PERFORMANCE INDICATORS PROGRESS REPORT Total Loan Originations (commitments) ($ IN MILLIONS )
Slide 16: Expand Specialty Lending: Asset-Based Lending
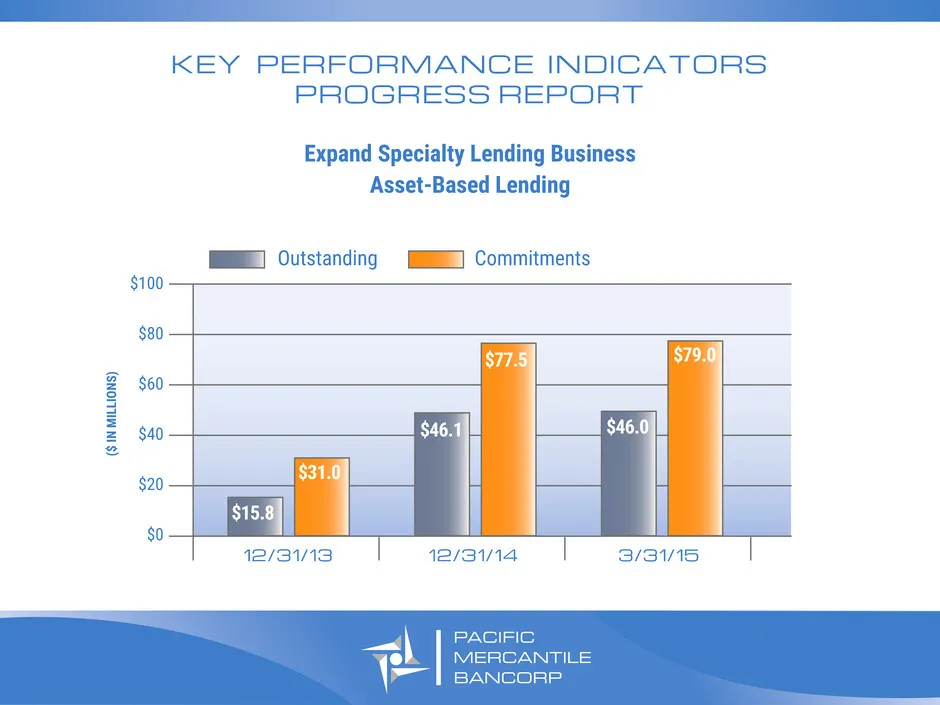
$100 $80 $60 $40 $20 $0 12/31/13 12/31/14 3/31/15 $15.8 $31.0 $46.1 $77.5 $46.0 $79.0 Outstanding Commitments ($ IN MILLIONS ) PACIFIC MERCANTILE BANCORP Expand Specialty Lending Business Asset-Based Lending KEY PERFORMANCE INDICATORS PROGRESS REPORT
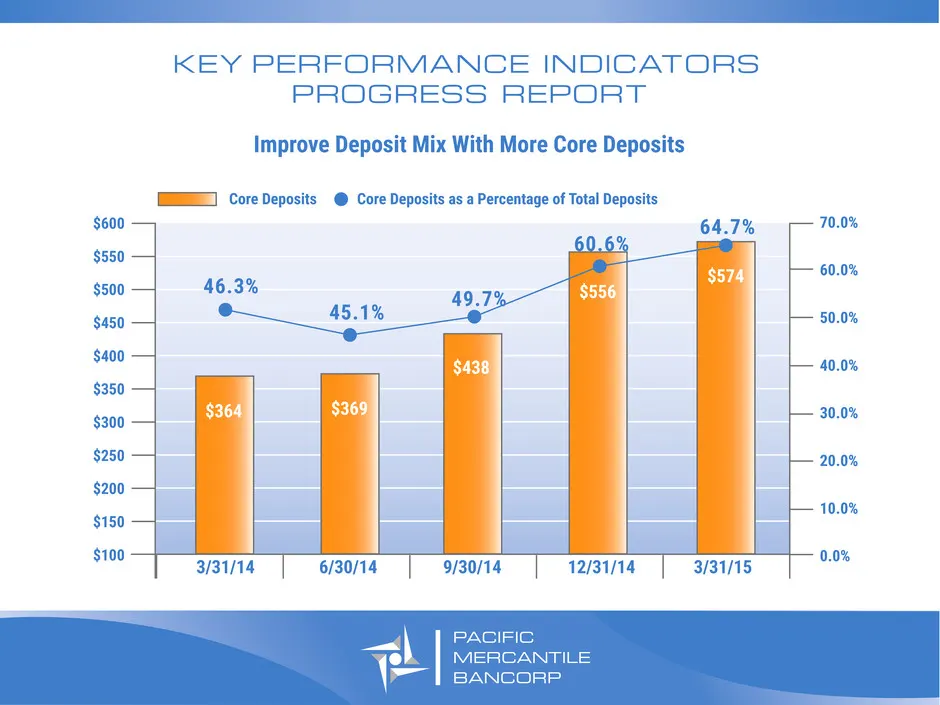
Slide 17: Improve Deposit Mix With More Core Deposits
PACIFIC MERCANTILE BANCORP $600 $550 $500 $450 $400 $350 $300 $250 $200 $150 $100 46.3% 45.1% 64.7% 60.6% 49.7% 3/31/14 Core Deposits Core Deposits as a Percentage of Total Deposits 6/30/14 9/30/14 12/31/14 3/31/15 70.0% 60.0% 50.0% 40.0% 30.0% 20.0% 10.0% 0.0% $574 $556 $438 $369$364 KEY PERFORMANC
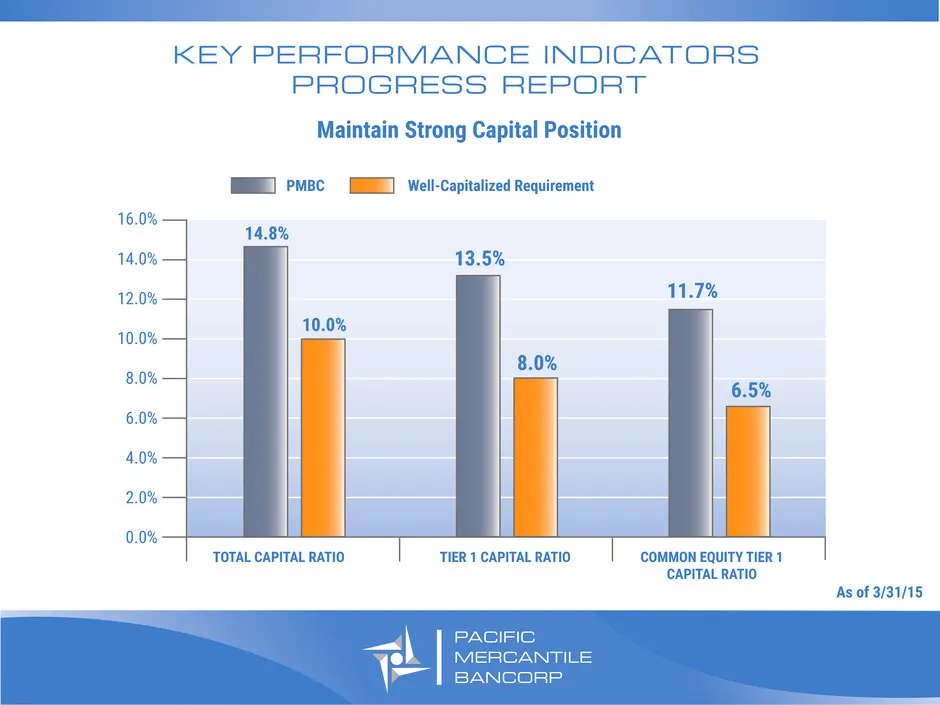
Slide 18: Maintain Strong Capital Position
PACIFIC MERCANTILE BANCORP PMBC Well-Capitalized Requirement As of 3/31/15 KEY PERFORMANCE INDICATORS PROGRESS REPORT Maintain Strong Capital Position 16.0% 14.0% 12.0% 10.0% 8.0% 6.0% 4.0% 2.0% 0.0% TOTAL CAPITAL RATIO 14.8% 10.0% 6.5% 8.0% 11.7% TIER 1 CAPITAL RATIO COMMON EQUITY TIER 1 CAPITAL RA

Slide 19: 2015 Outlook
PACIFIC MERCANTILE BANCORP 2015 OUTLOOK
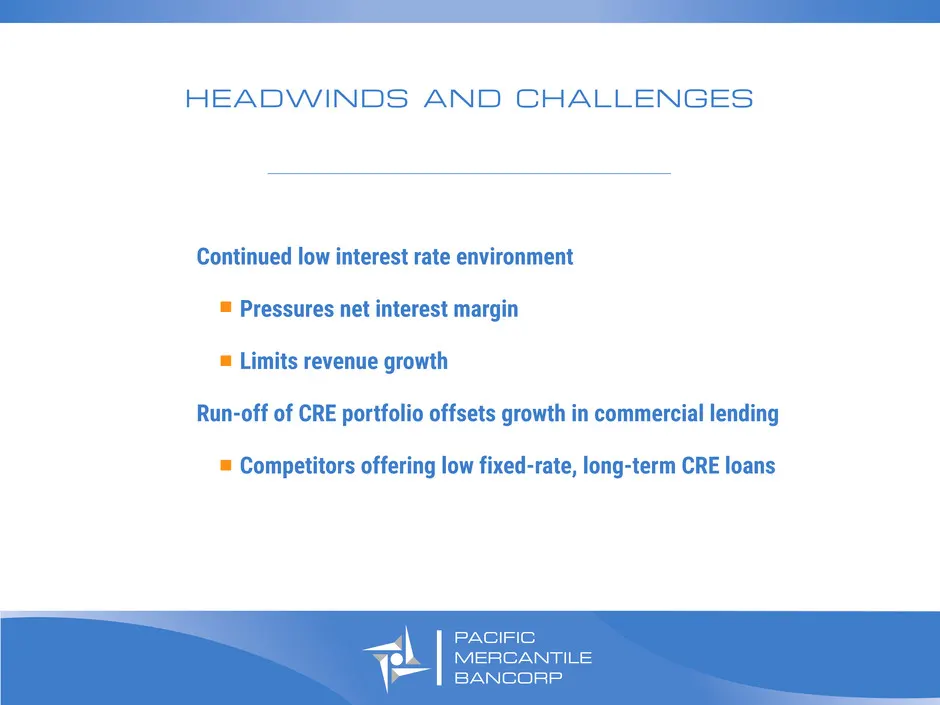
Slide 20: Headwinds and Challenges
PACIFIC MERCANTILE BANCORP Continued low interest rate environment Pressures net interest margin Limits revenue growth Run-off of CRE portfolio offsets growth in commercial lending Competitors offering low fixed-rate, long-term CRE loans HEADWINDS AND CHALLENGES
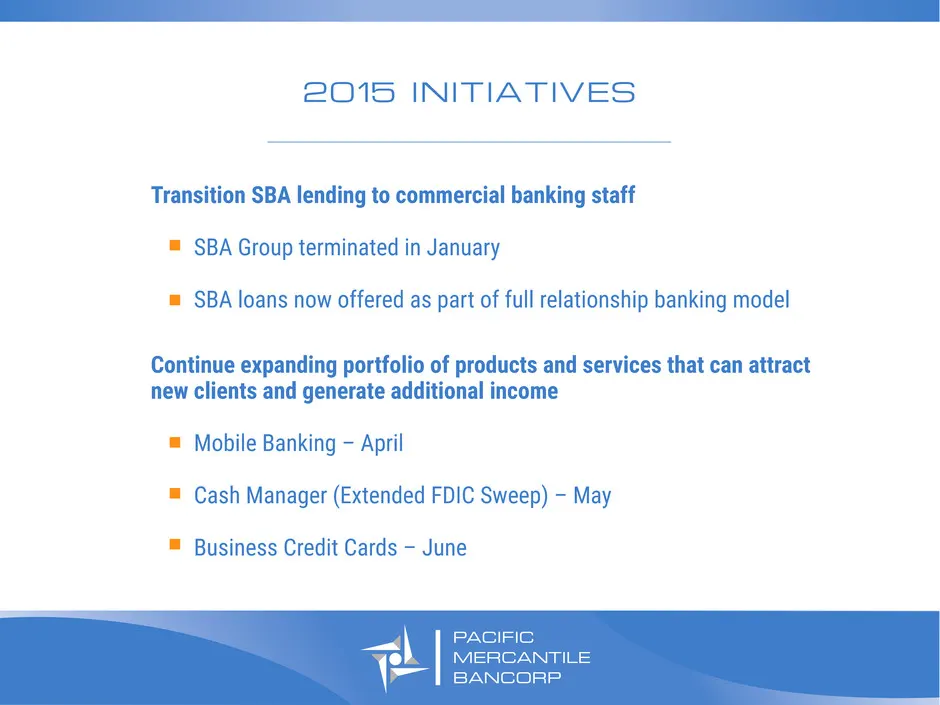
Slide 21: 2015 Initiatives
PACIFIC MERCANTILE BANCORP 2015 INITIATIVES Transition SBA lending to commercial banking staff SBA Group terminated in January SBA loans now offered as part of full relationship banking model Continue expanding portfolio of products and services that can attract new clients and generate additional i
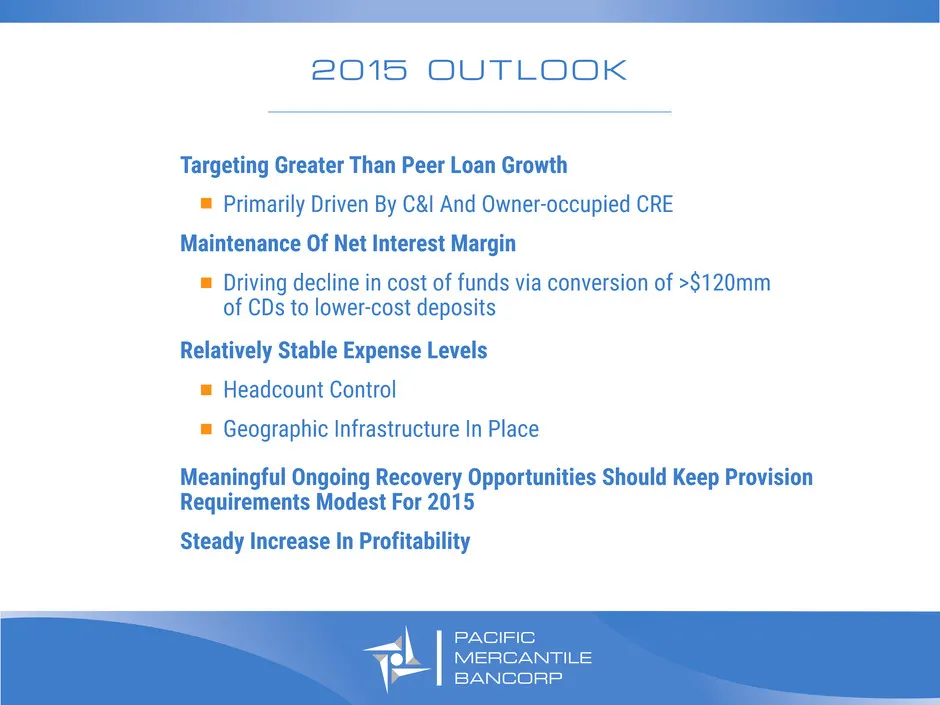
Slide 22: 2015 Outlook
PACIFIC MERCANTILE BANCORP Targeting Greater Than Peer Loan Growth Primarily Driven By C&I And Owner-occupied CRE Maintenance Of Net Interest Margin Driving decline in cost of funds via conversion of >$120mm of CDs to lower-cost deposits Relatively Stable Expense Levels Headcount Control Geographic

Slide 23: Q&A
PACIFIC MERCANTILE BANCORP Q&A
Source: SEC EDGAR · 8-K filed May 20, 2015
More decks from Pacific Mercantile Bancorp
 Q1 2021 Earnings Presentation18 slides · Apr 26, 2021
 Merger or Acquisition (March 2021)9 slides · Mar 23, 2021
 Q4 2020 Earnings Presentation22 slides · Jan 25, 2021
 Q3 2020 Earnings Presentation23 slides · Nov 2, 2020
 Corporate Update (September 2020)25 slides · Sep 8, 2020
 Corporate Update (August 2020)25 slides · Aug 5, 2020