Vantagesouth Bancshares — Crescent Financial Bancshares — Investor Presentation (September 2012)
14 slides from Vantagesouth Bancshares's investor presentation, Sep 19, 2012
Slide 1: Investor presentation
Investor presentation September 20, 2012 CONFIDENTIAL Crescent Financial Bancshares, Inc
Slide 2: Forward looking statement
Forward looking statement Statements in this presentation relating to plans, strategies, economic performance and trends, projections of results of specific, acquisitions, activities or investments, expectations or beliefs about future events or results, and other statements that are not description
Slide 3: Our vision: building a very profitable $5 Bn+ community bank
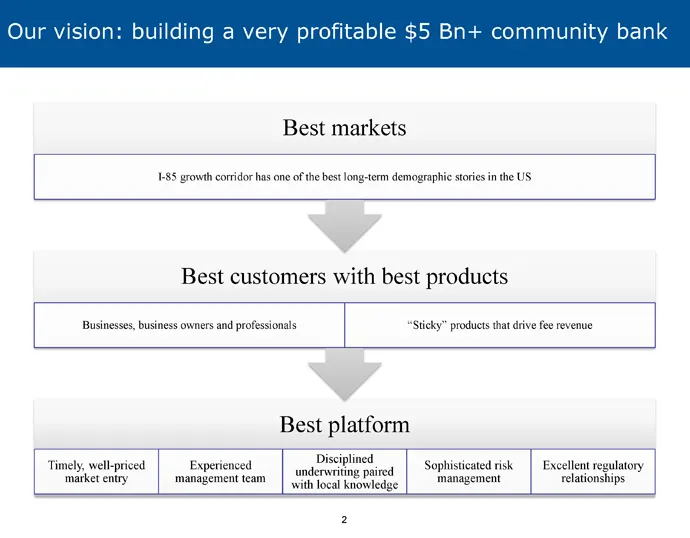
Our vision: building a very profitable $5 Bn+ community bank Best platform I-85 growth corridor has one of the best long-term demographic stories in the US Timely, well-priced market entry Experienced management team Disciplined underwriting paired with local knowledge Sophisticated risk management
Slide 4: Our vision: create an enduring community banking franchise
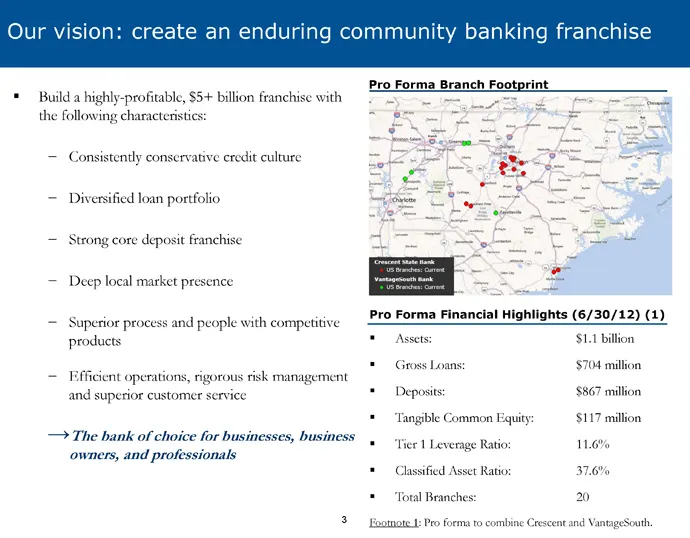
Build a highly-profitable, $5+ billion franchise with the following characteristics: Consistently conservative credit culture Diversified loan portfolio Strong core deposit franchise Deep local market presence Superior process and people with competitive products Efficient operations, rigorous risk
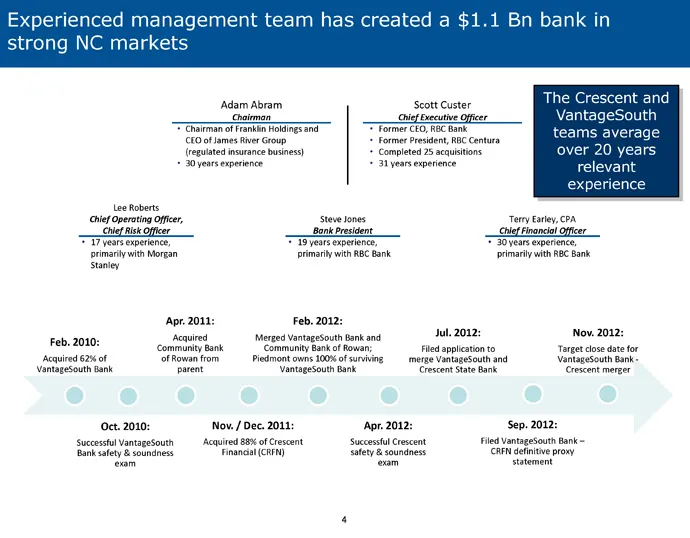
Slide 5: Experienced management team has created a $1.1 Bn bank in strong NC markets
Experienced management team has created a $1.1 Bn bank in strong NC markets Feb. 2010: Acquired 62% of VantageSouth Bank Apr. 2011: Acquired Community Bank of Rowan from parent Feb. 2012: Merged VantageSouth Bank and Community Bank of Rowan; Piedmont owns 100% of surviving VantageSouth Bank Oct. 201
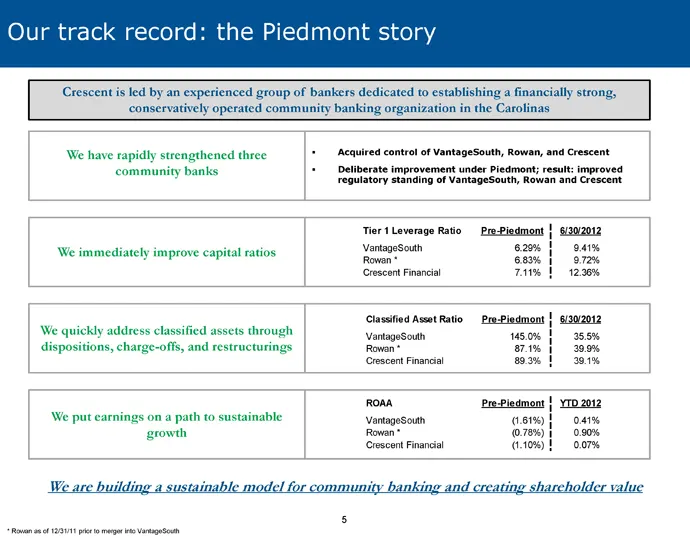
Slide 6: Our track record: the Piedmont story
Our track record: the Piedmont story Crescent is led by an experienced group of bankers dedicated to establishing a financially strong, conservatively operated community banking organization in the Carolinas We have rapidly strengthened three community banks Acquired control of VantageSouth, Rowan,
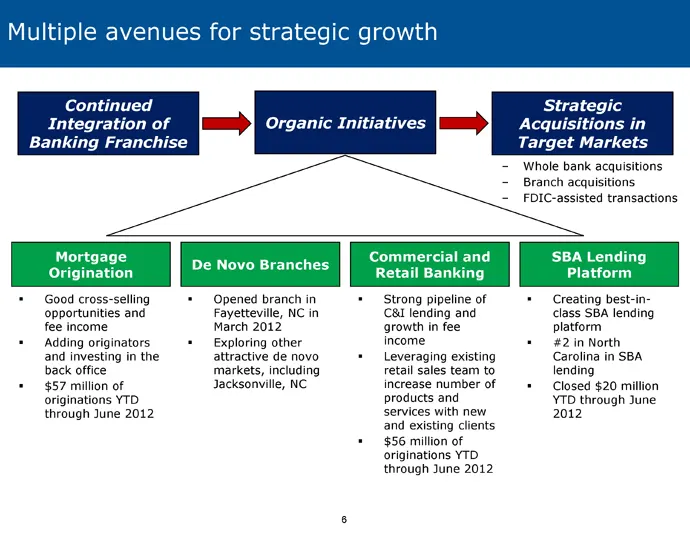
Slide 7: Multiple avenues for strategic growth
Multiple avenues for strategic growth Strategic Acquisitions in Target Markets Continued Integration of Banking Franchise Mortgage Origination De Novo Branches Commercial and Retail Banking SBA Lending Platform Organic Initiatives Creating best-in-class SBA lending platform #2 in North Carolina in S
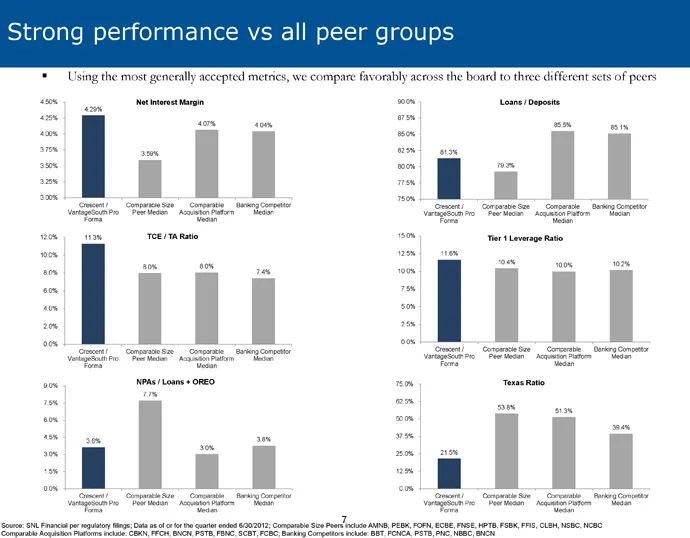
Slide 8: Strong performance vs all peer groups
Strong performance vs all peer groups ▪ Using the most generally accepted metrics, we compare favorably across the board to three different sets of peers Source: SNL Financial per regulatory filings; Data as of or for the quarter ended 6/30/2012; Comparable Size Peers include AMNB, PEBK, FOFN, ECBE,
Slide 9: Superior demographics
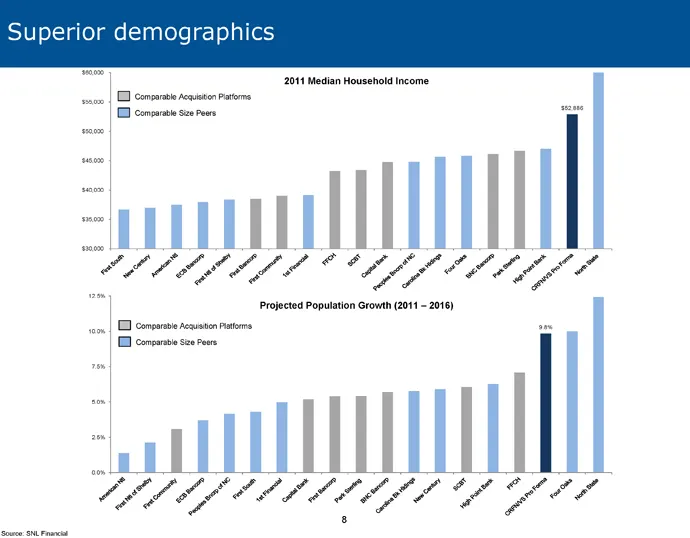
Superior demographics Source: SNL Financial 2011 Median Household Income Projected Population Growth (2011 – 2016) $52,886 9.8%
Slide 10: Crescent Financial Bancshares – capital & asset quality
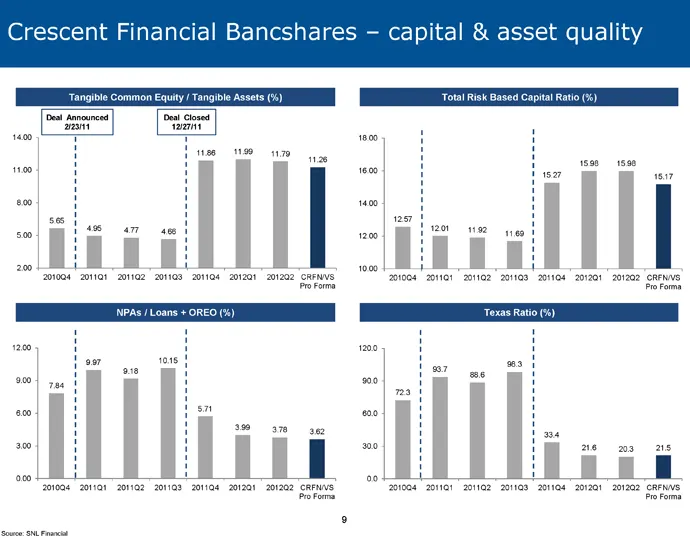
Crescent Financial Bancshares – capital & asset quality Source: SNL Financial Deal Closed 12/27/11 Deal Announced 2/23/11 Tangible Common Equity / Tangible Assets (%) Total Risk Based Capital Ratio (%) 5.65 4.95 4.77 4.66 11.86 11.99 11.79 11.26 2.00 5.00 8.00 11.00 14.00 2010Q4 2011Q1 2011Q2 2011Q3
Slide 11: Crescent Financial Bancshares – financial performance
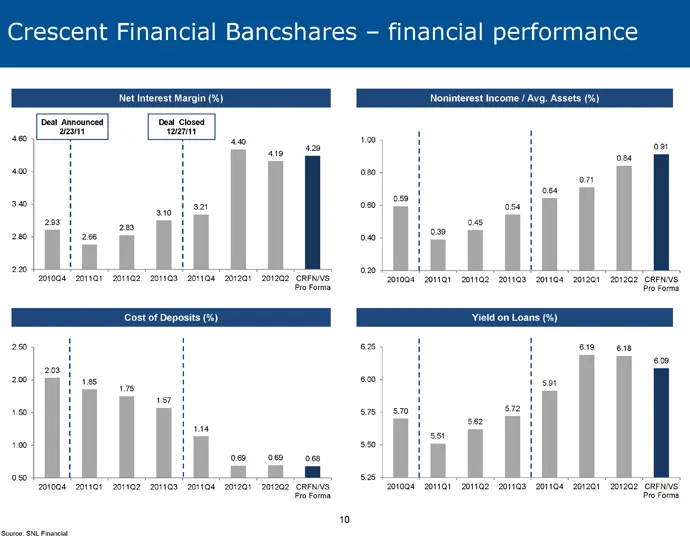
Crescent Financial Bancshares – financial performance Source: SNL Financial Net Interest Margin (%) Noninterest Income / Avg. Assets (%) Cost of Deposits (%) Yield on Loans (%) Deal Closed 12/27/11 Deal Announced 2/23/11 0.59 0.39 0.45 0.54 0.64 0.71 0.84 0.91 0.20 0.40 0.60 0.80 1.00 2010Q4 2011Q1
Slide 12: Crescent Financial Bancshares – loan portfolio over time
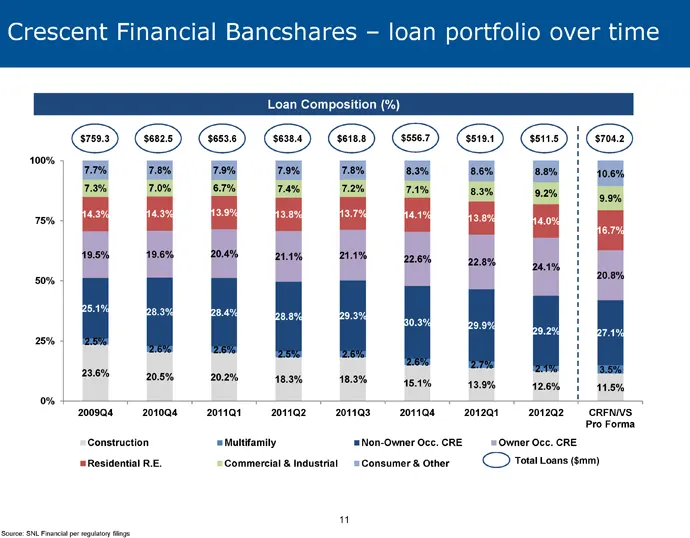
Crescent Financial Bancshares – loan portfolio over time Source: SNL Financial per regulatory filings Loan Composition (%) $759.3 $682.5 $653.6 $638.4 $618.8 $556.7 Total Loans ($mm) $519.1 $704.2 $511.5 23.6% 20.5% 20.2% 18.3% 18.3% 15.1% 13.9% 12.6% 11.5% 2.5% 2.6% 2.6% 2.5% 2.6% 2.6% 2.7% 2.1% 3.
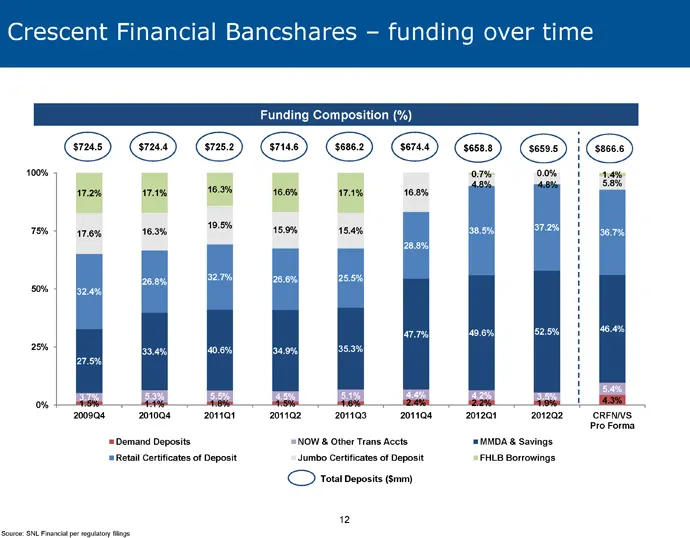
Slide 13: Crescent Financial Bancshares – funding over time
Crescent Financial Bancshares – funding over time Source: SNL Financial per regulatory filings Funding Composition (%) $724.5 $724.4 $725.2 $714.6 $686.2 $674.4 Total Deposits ($mm) $658.8 $866.6 $659.5 1.5% 1.1% 1.8% 1.5% 1.6% 2.4% 2.2% 1.9% 4.3% 3.7% 5.3% 5.5% 4.5% 5.1% 4.4% 4.2% 3.5% 5.4% 27.5% 3
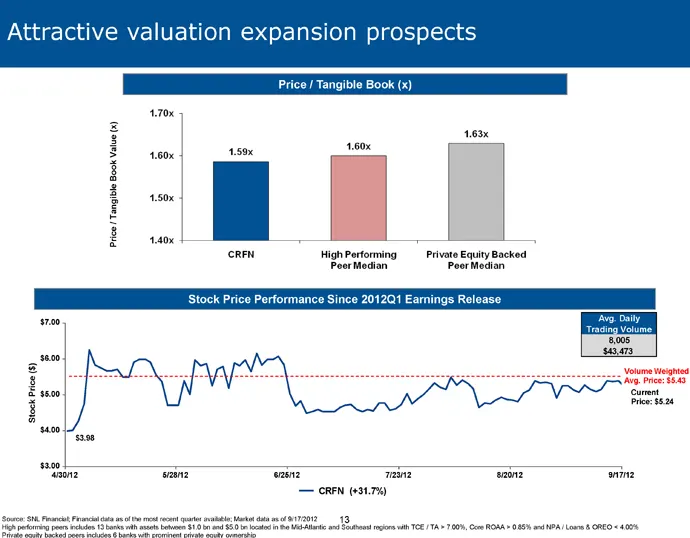
Slide 14: Stock price performance and valuation vs peers
Source: SNL Financial; Financial data as of the most recent quarter available; Market data as of 9/17/2012 13 High performing peers includes 13 banks with assets between $1.0 bn and $5.0 bn located in the Mid-Atlantic and Southeast regions with TCE / TA > 7.00%, Core ROAA > 0.85% and NPA / Loans & O
Source: SEC EDGAR · 8-K filed Sep 19, 2012
More decks from Vantagesouth Bancshares Inc.
 Gulf South Conference (May 2014)25 slides · May 12, 2014
 Q1 2014 Earnings Presentation15 slides · Apr 23, 2014
 Merger or Acquisition (March 2014)23 slides · Mar 4, 2014
 Merger or Acquisition (January 2014)15 slides · Jan 27, 2014
 Investor Presentation (December 2013)17 slides · Dec 18, 2013
 Q3 2013 Earnings Presentation14 slides · Oct 30, 2013