Noranda Aluminum — Non-Deal Roadshow (May 2011)
43 slides from Noranda Aluminum's roadshow presentation, May 25, 2011
Slide 1: Post Q1 2011 Investor Meetings
Post Q1 2011 Investor Meetings
Slide 2: Forward Looking Statements
Forward Looking Statements The following information contains, or may be deemed to contain, "forward-looking statements" (as defined in the U.S. Private Securities Litigation Reform Act of 1995). By their nature, forward-looking statements involve risks and uncertainties because they relate to event
Slide 3: Management Attendees
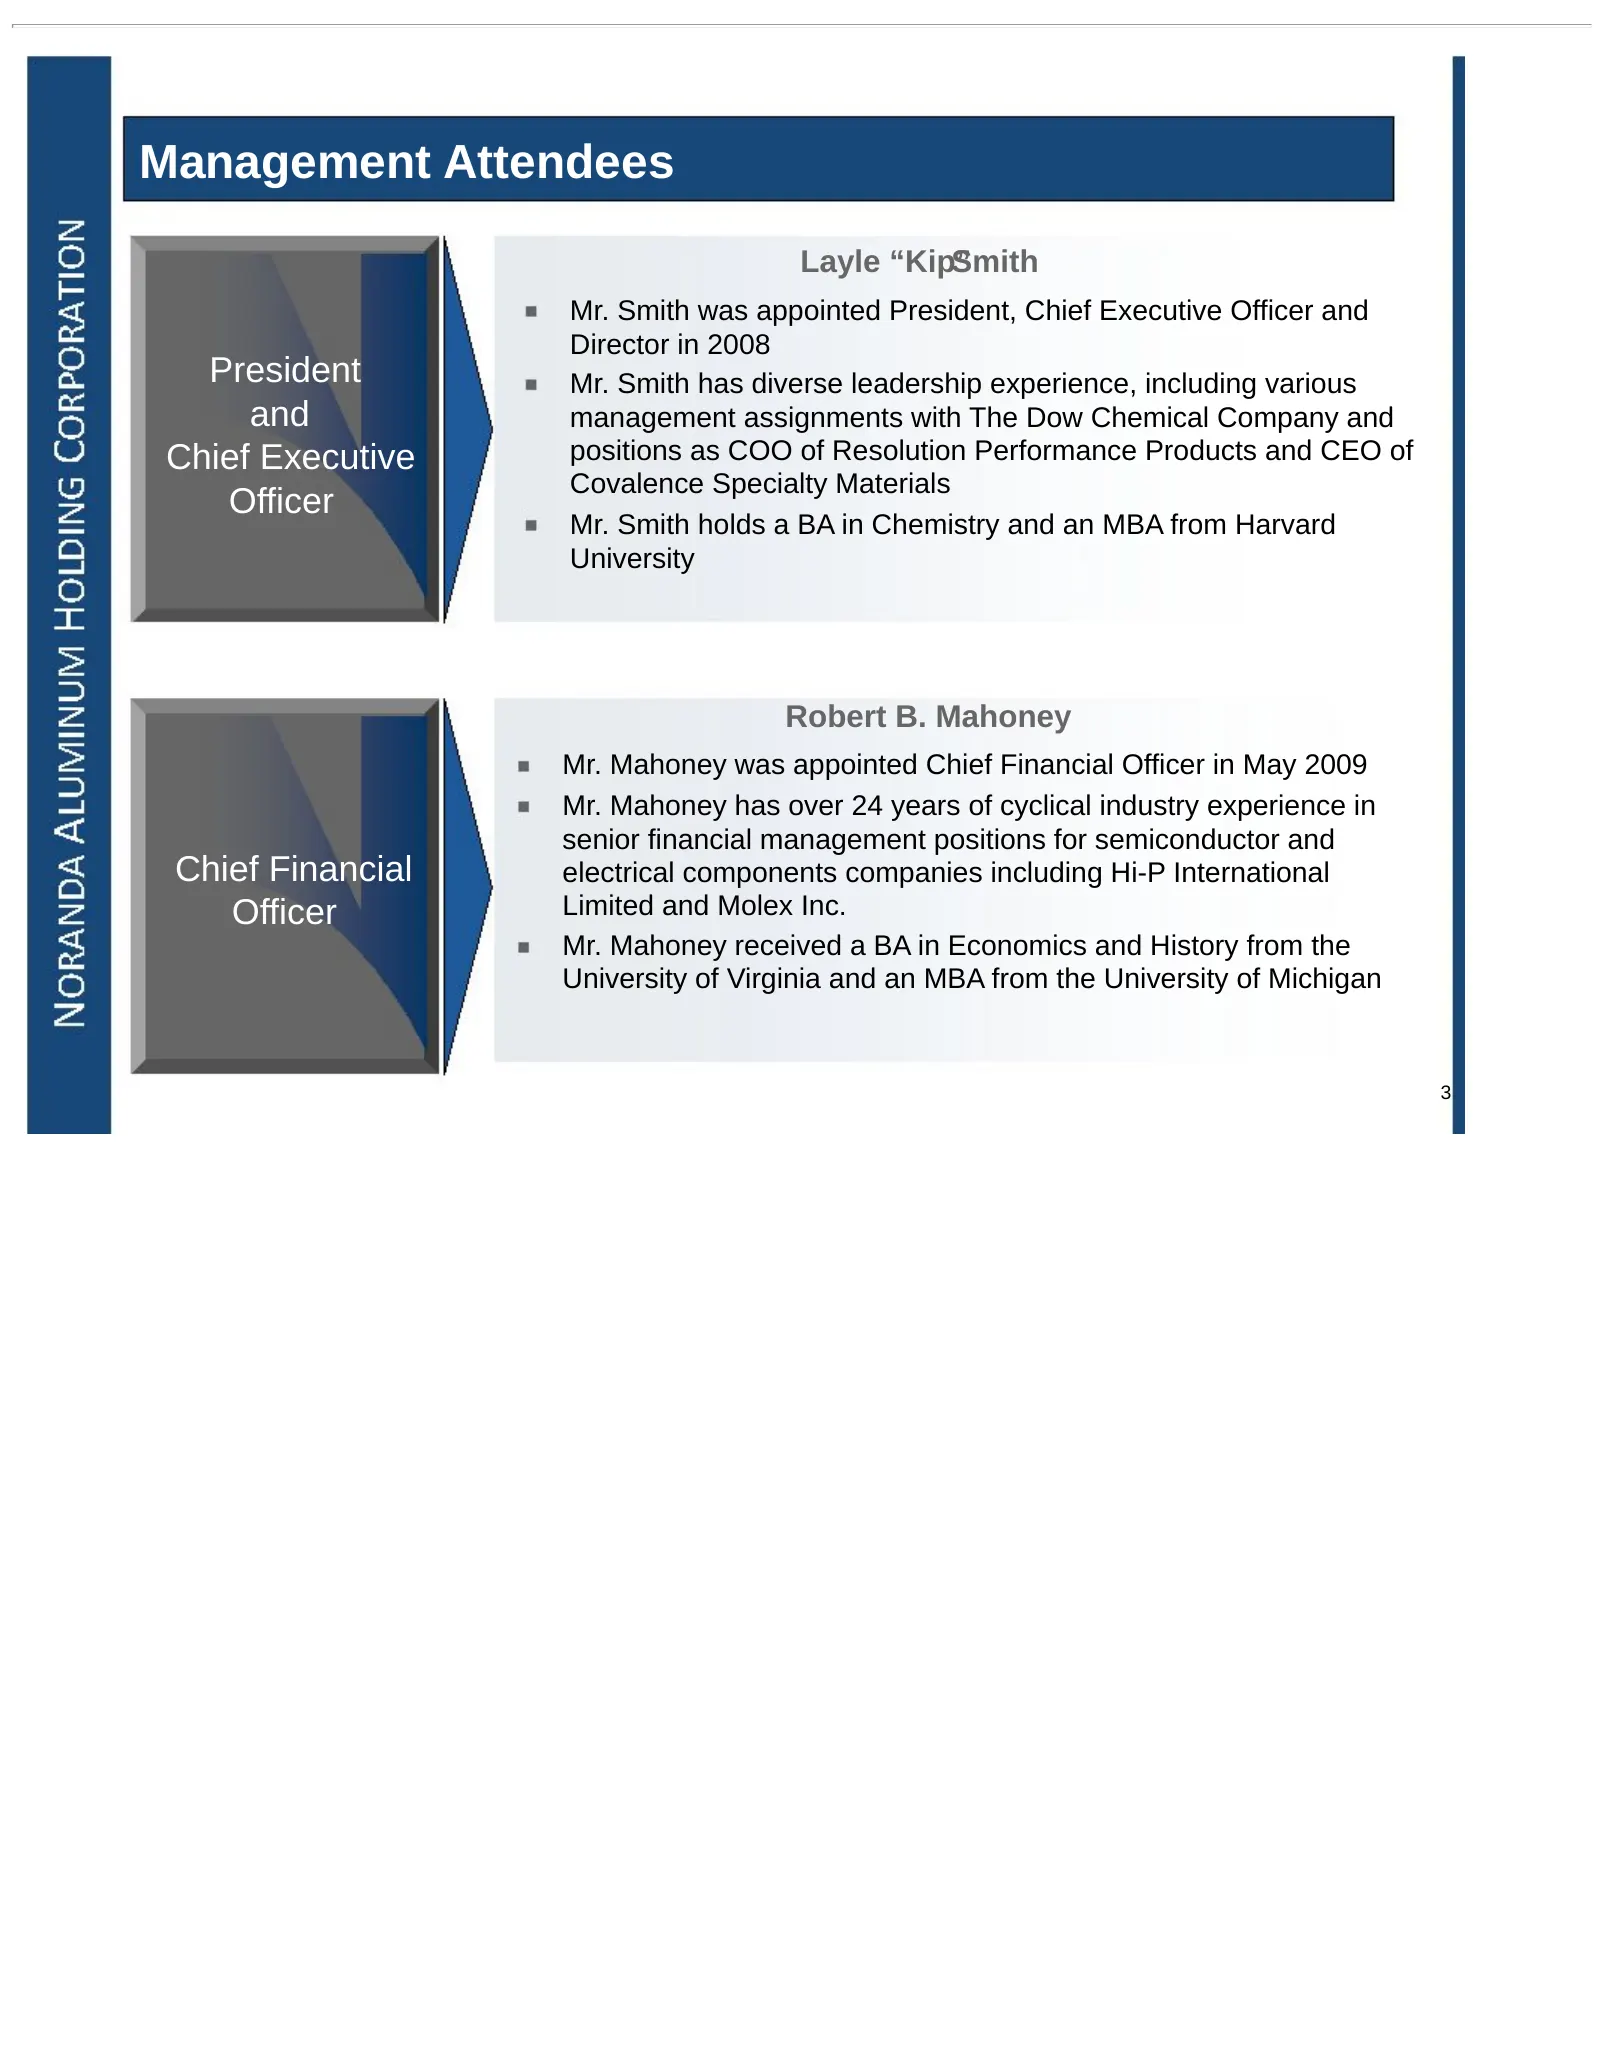
Management Attendees Layle “Kip” Smith Mr. Smith was appointed President, Chief Executive Officer and Director in 2008 President Mr. Smith has diverse leadership experience, including various and management assignments with The Dow Chemical Company and Chief Executive positions as COO of Resolution
Slide 4: Key Investment Messages
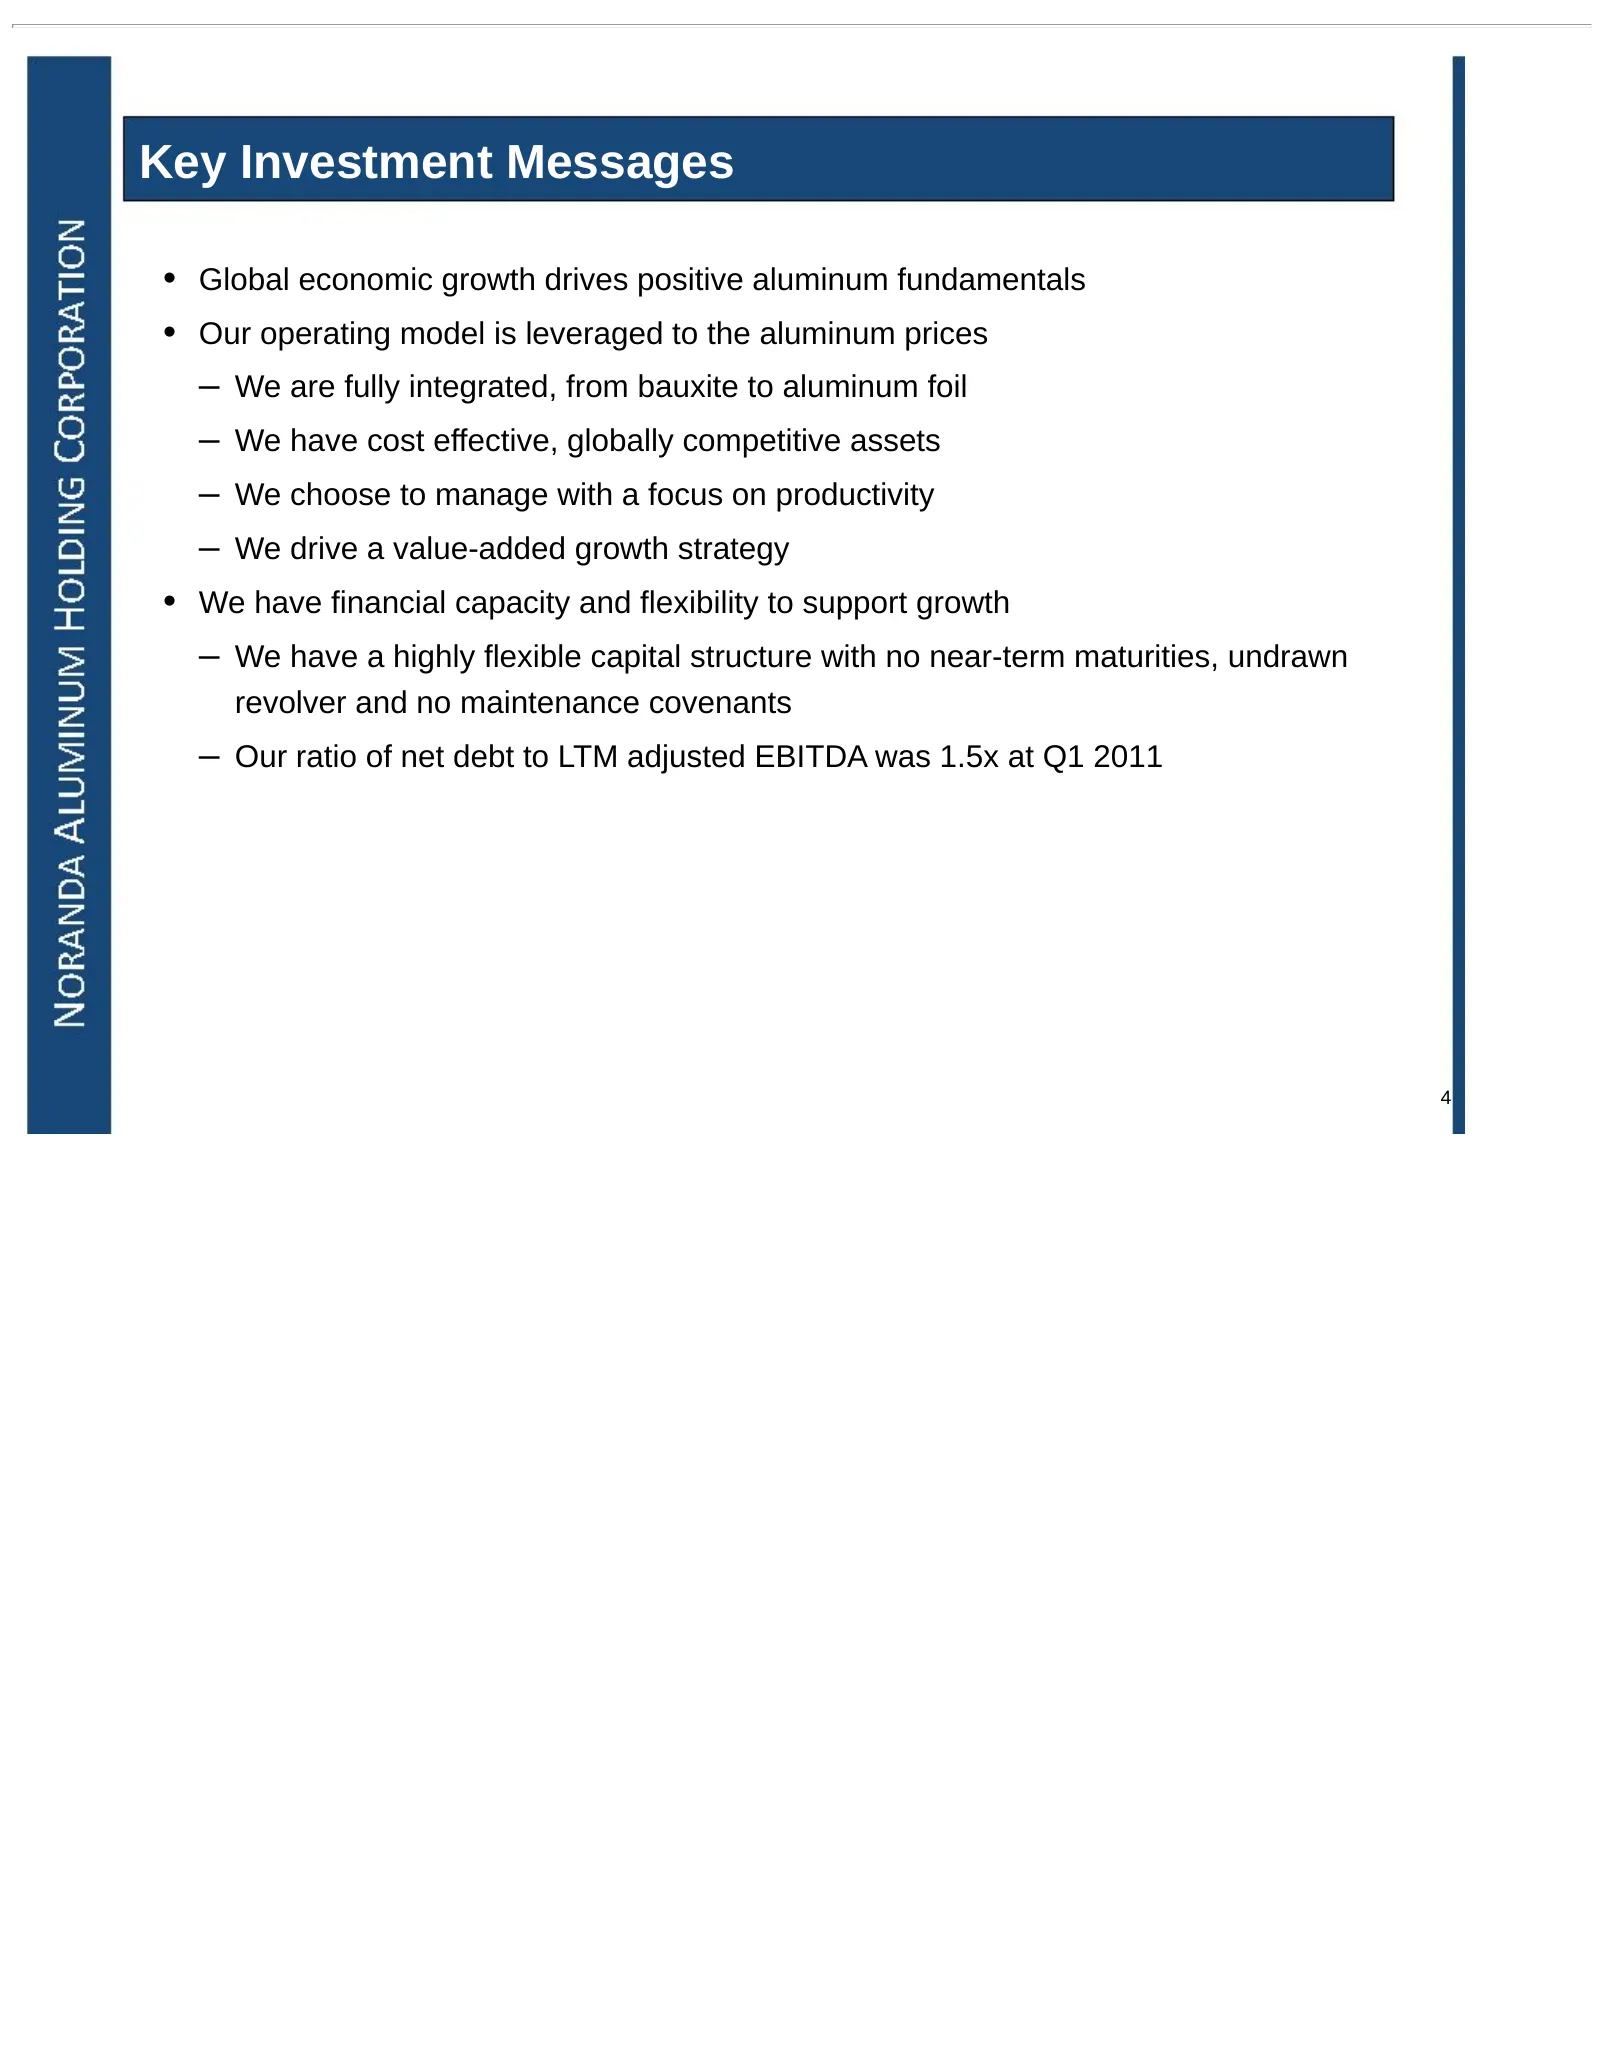
Key Investment Messages • Global economic growth drives positive aluminum fundamentals • Our operating model is leveraged to the aluminum prices – We are fully integrated, from bauxite to aluminum foil – We have cost effective, globally competitive assets – We choose to manage with a focus on produc
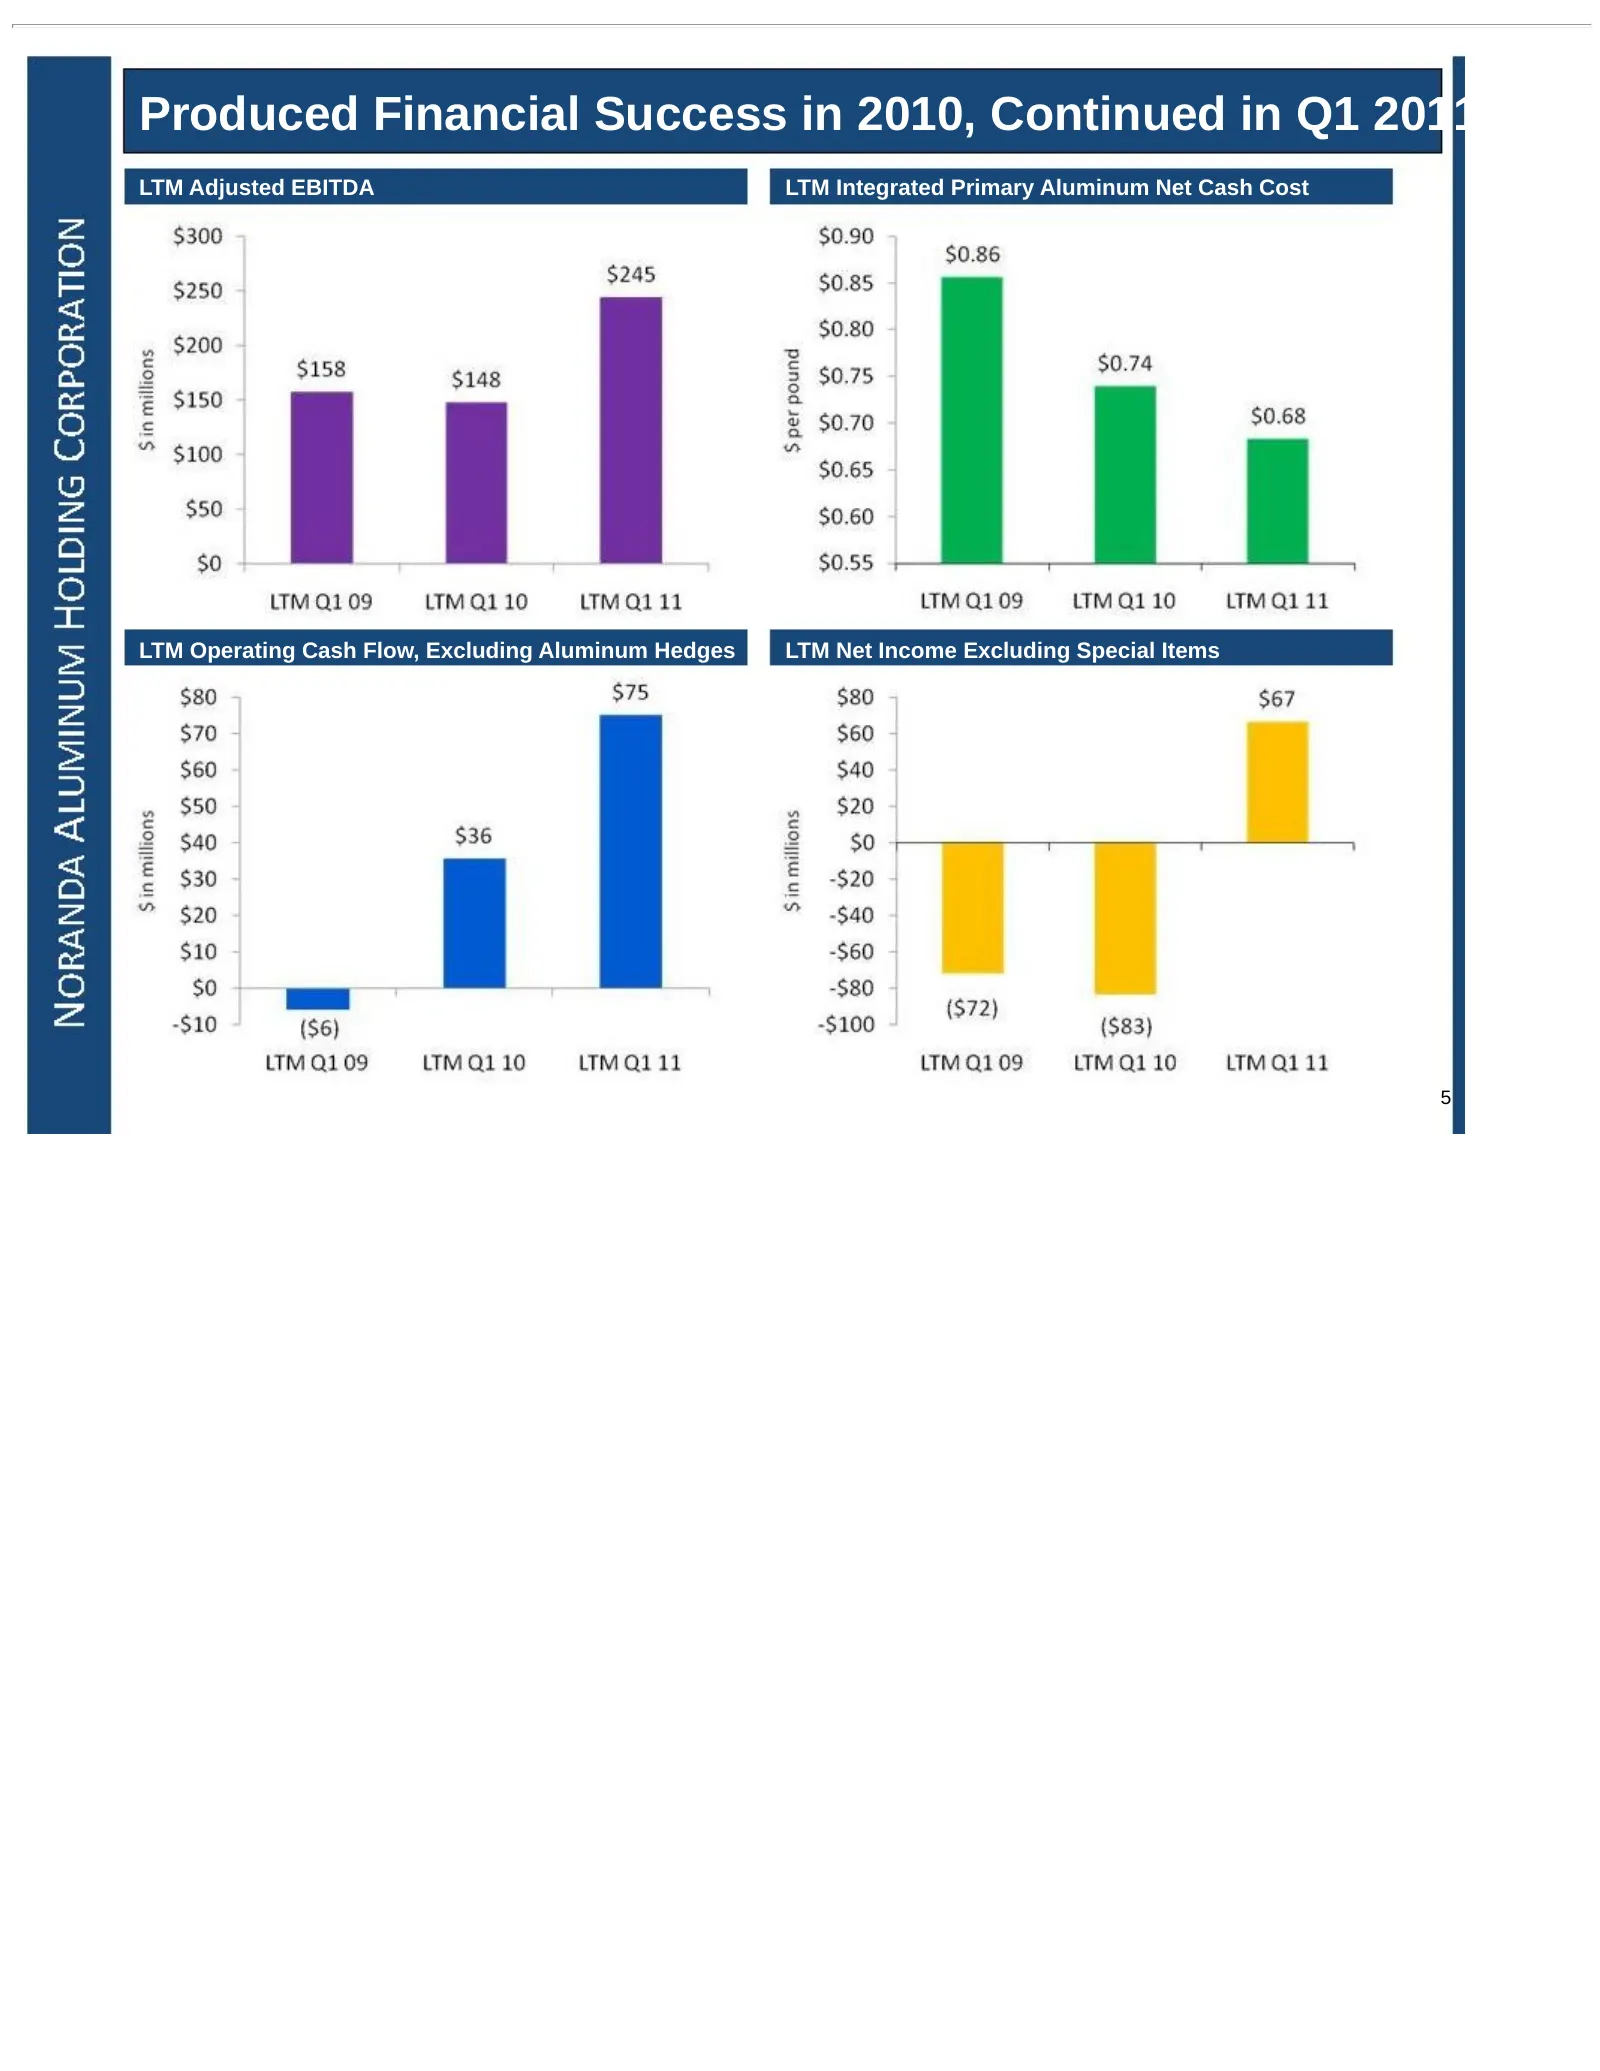
Slide 5: Produced Financial Success in 2010, Continued in Q1 2011
Produced Financial Success in 2010, Continued in Q1 2011 LTM Adjusted EBITDA LTM Integrated Primary Aluminum Net Cash Cost LTM Operating Cash Flow, Excluding Aluminum Hedges LTM Net Income Excluding Special Items 5
Slide 6: Key Investment Highlights
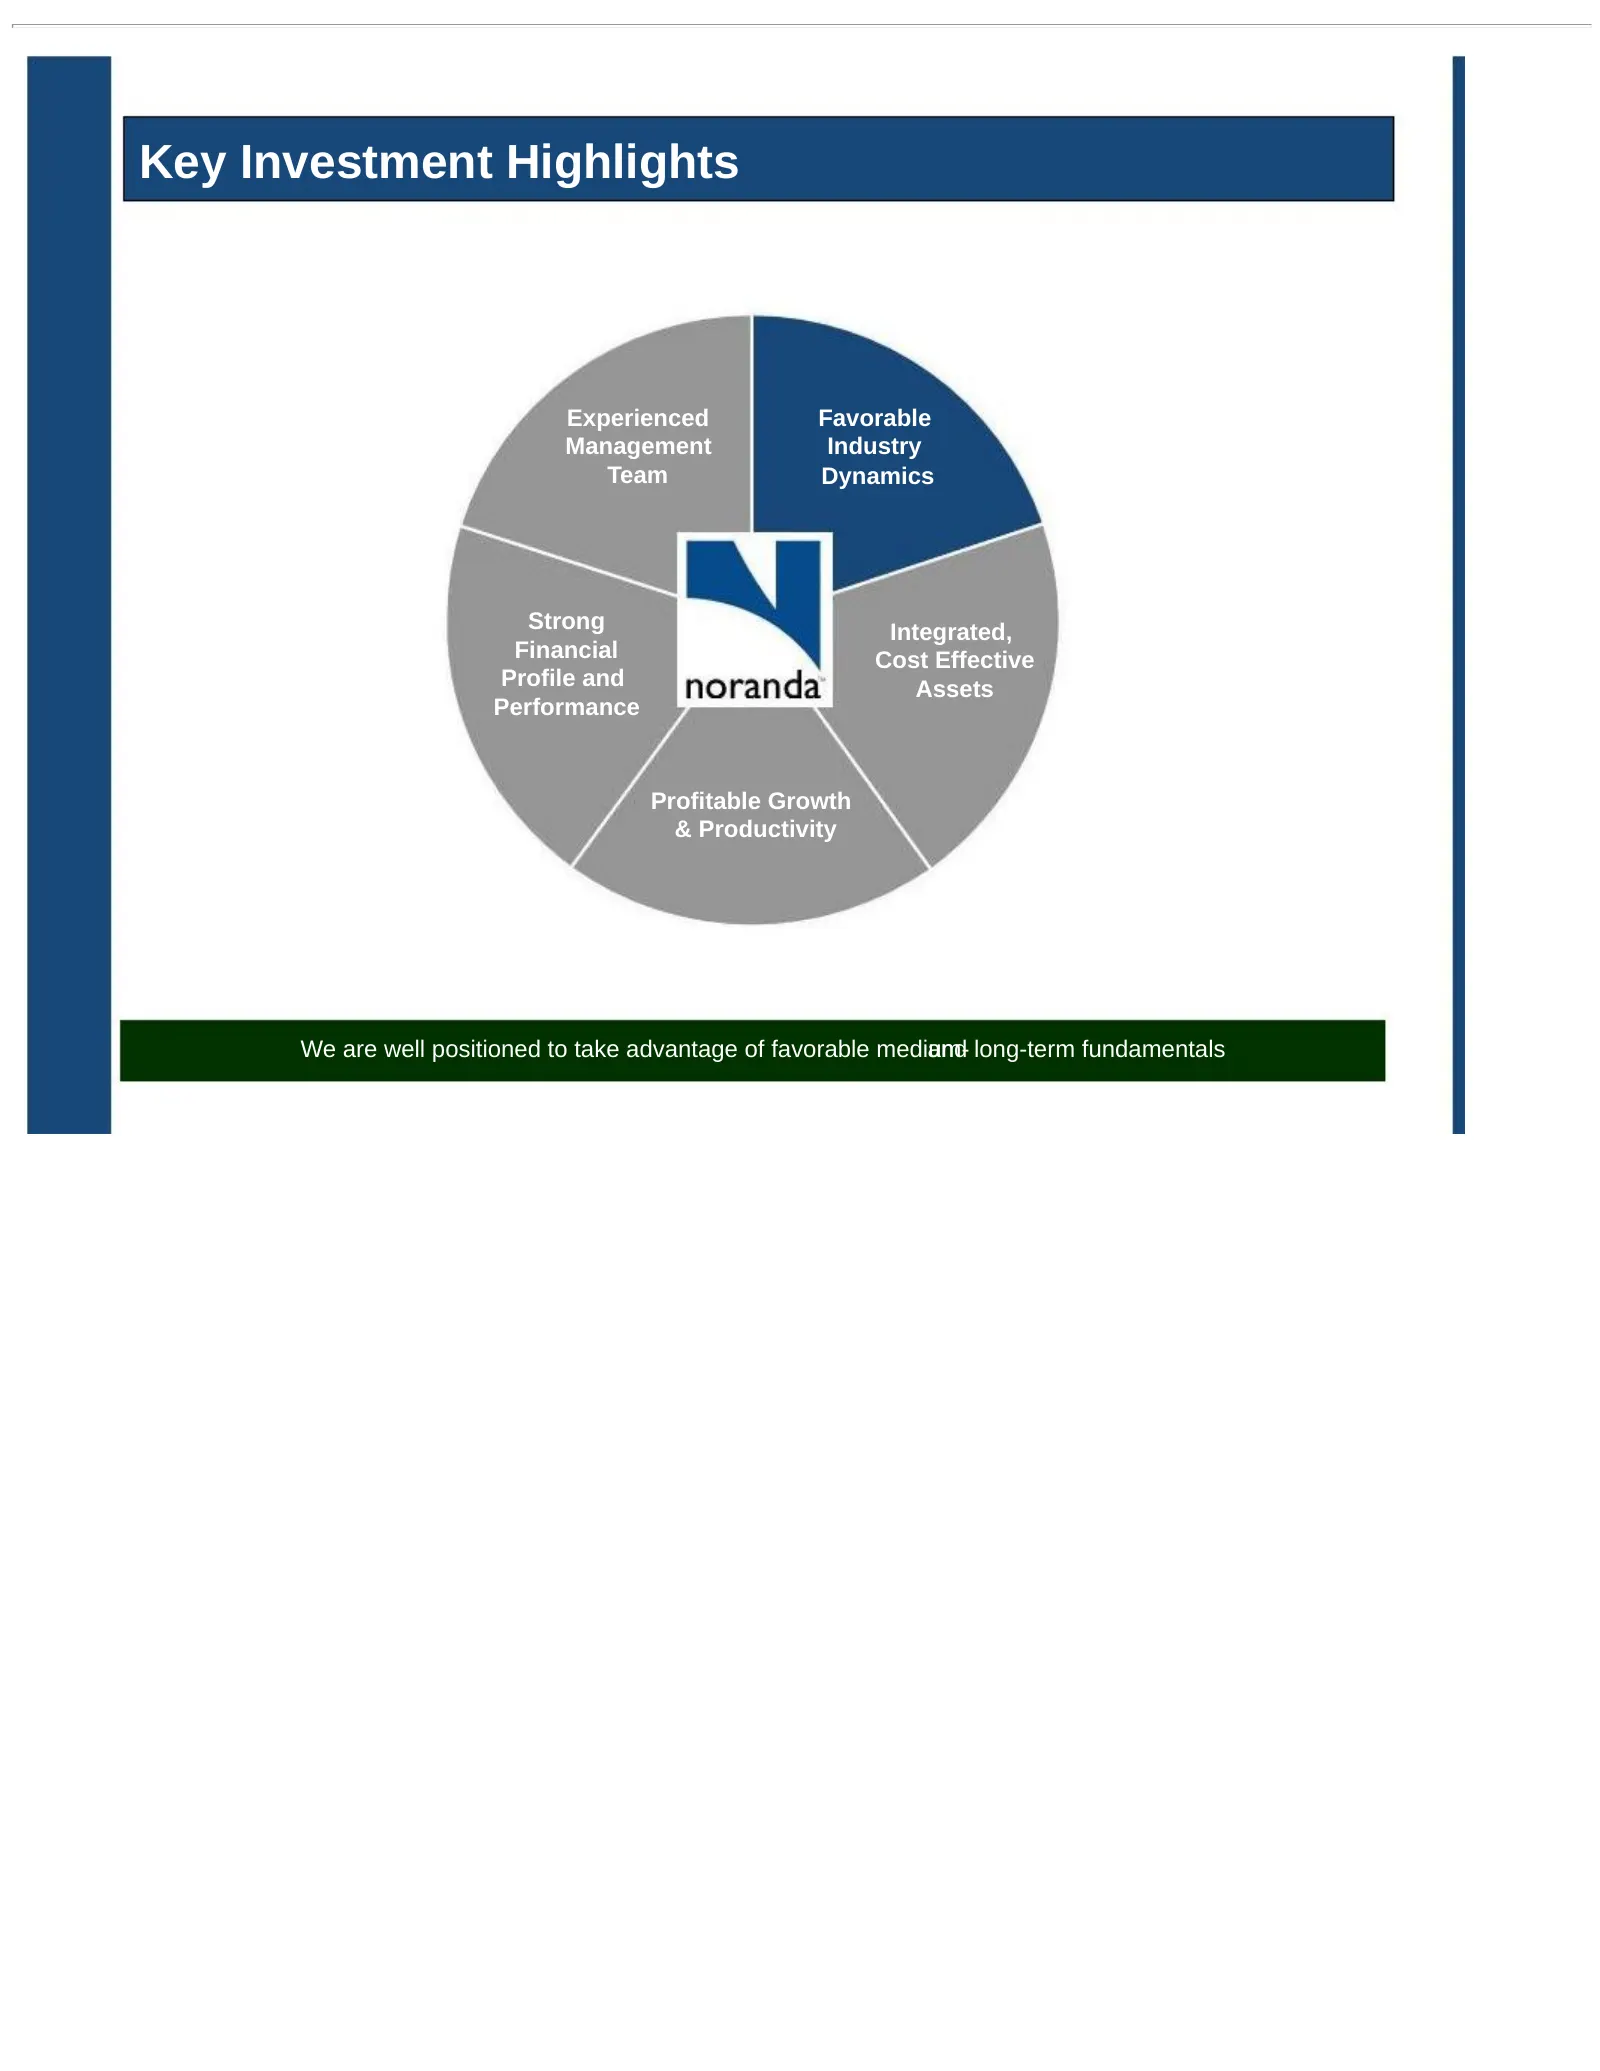
Key Investment Highlights Experienced Favorable Management Industry Team Dynamics Strong Integrated, Financial Cost Effective Profile and Assets Performance Profitable Growth & Productivity We are well positioned to take advantage of favorable medium- and long-term fundamentals
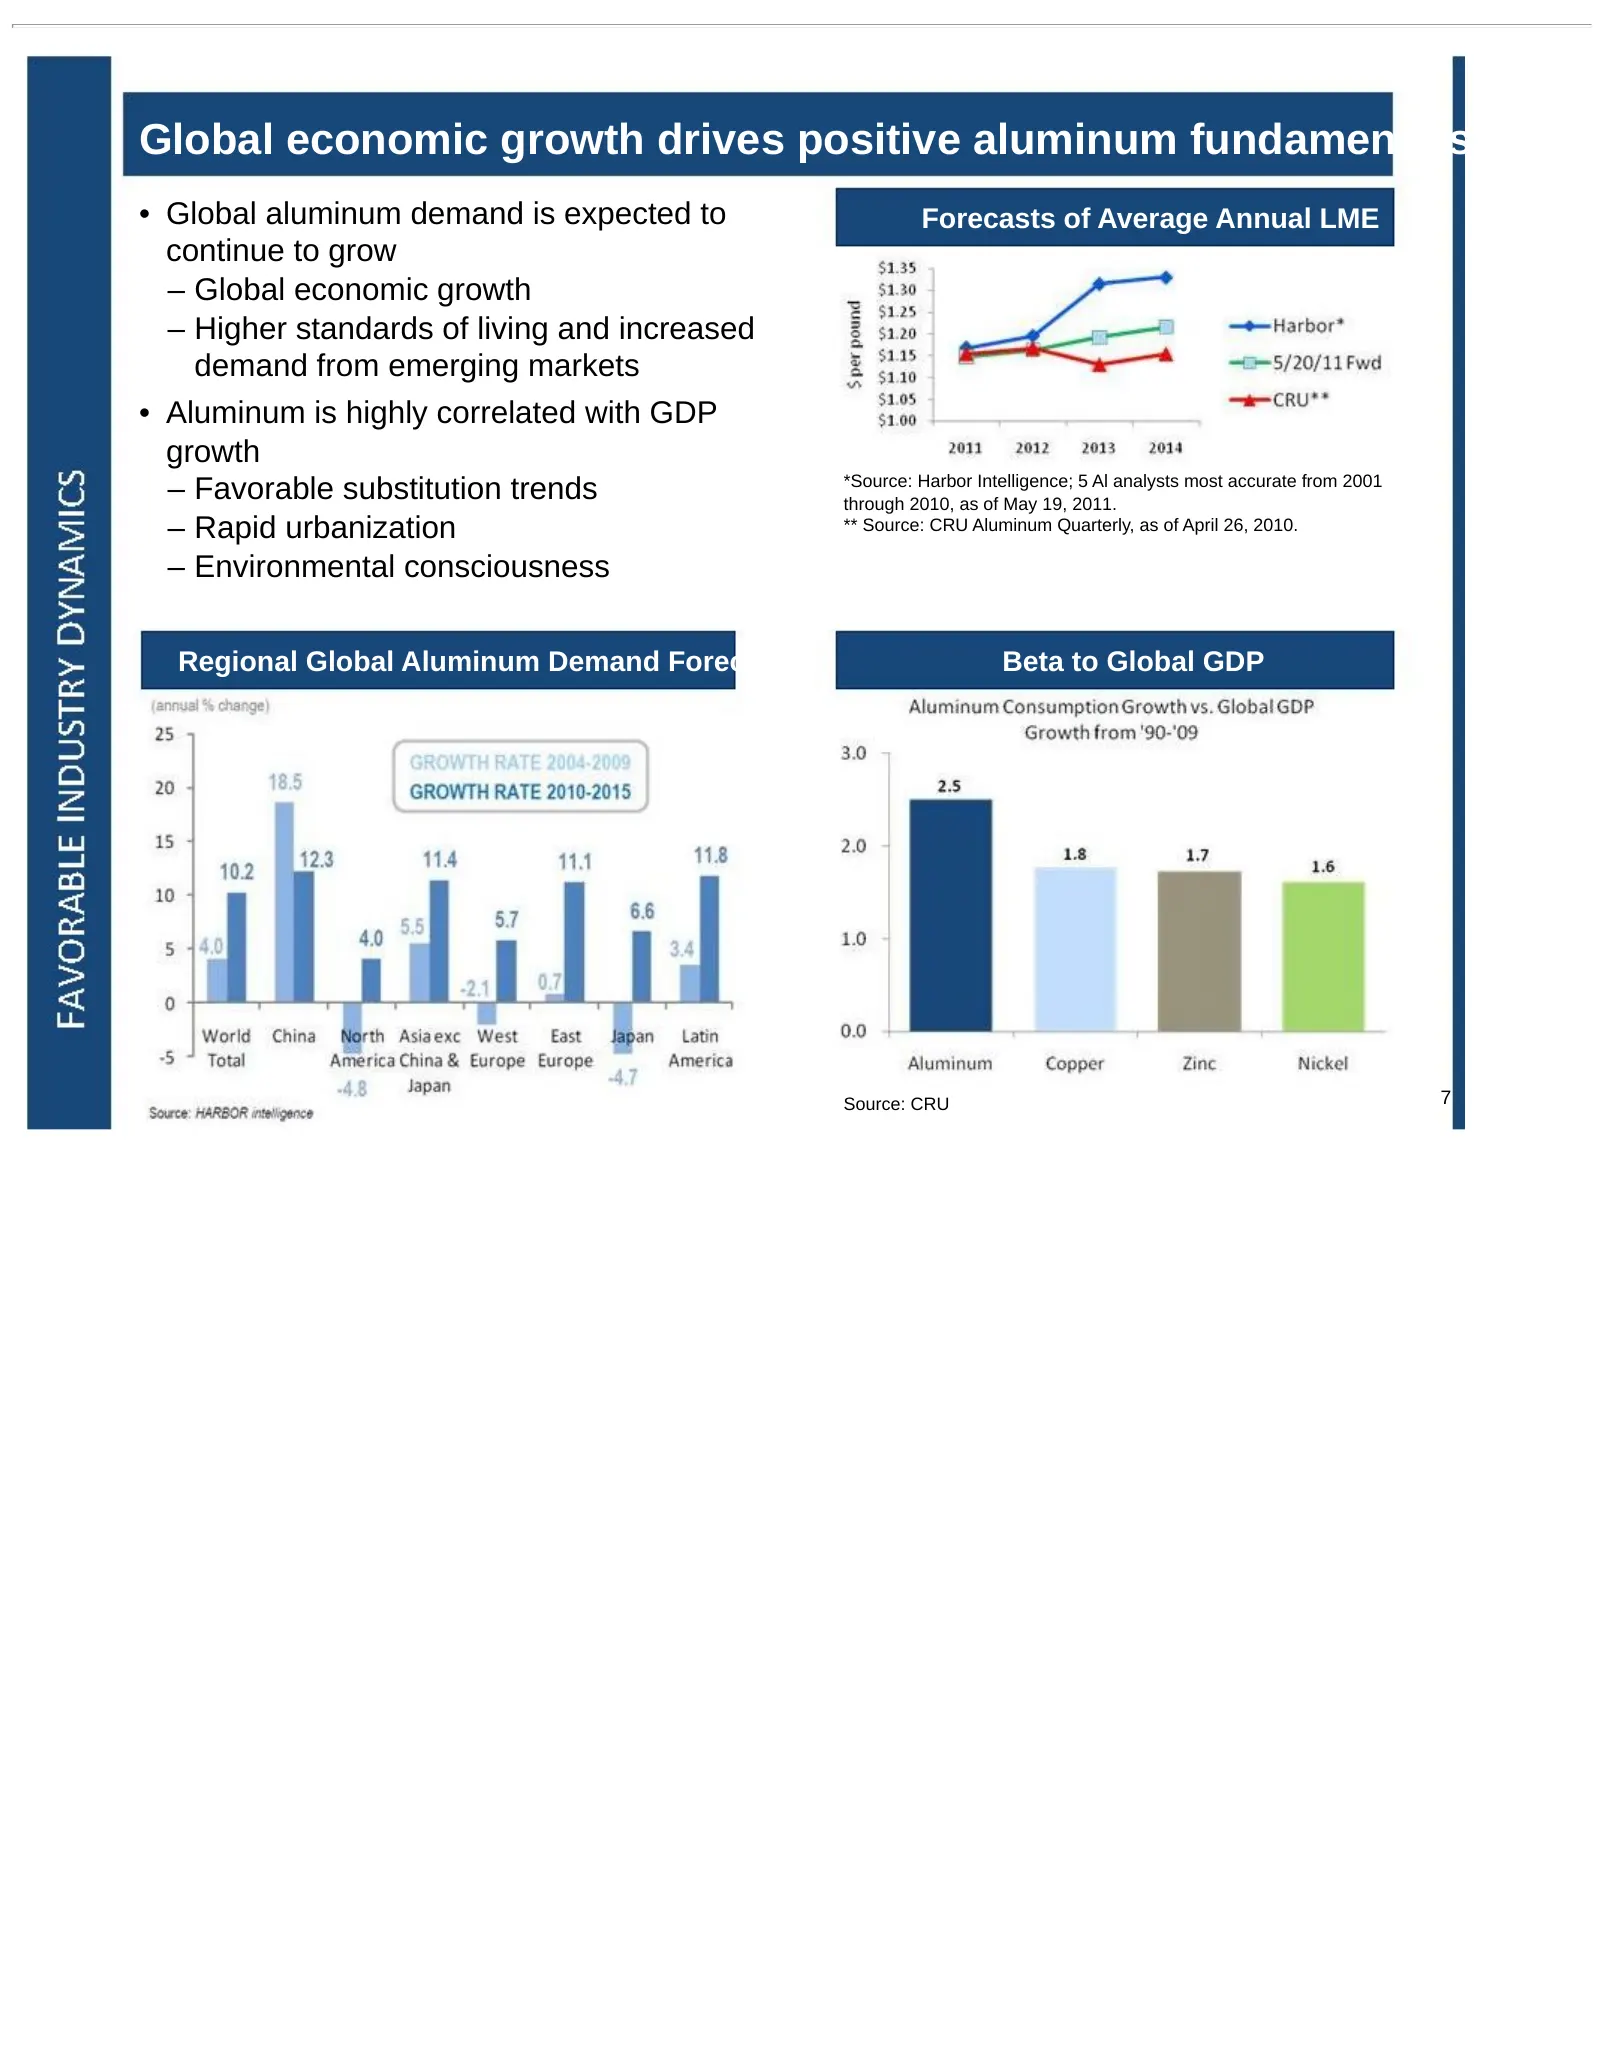
Slide 7: Global economic growth drives positive aluminum fundamentals
Global economic growth drives positive aluminum fundamentals • Global aluminum demand is expected to Forecasts of Average Annual LME continue to grow – Global economic growth – Higher standards of living and increased demand from emerging markets • Aluminum is highly correlated with GDP growth – Fav
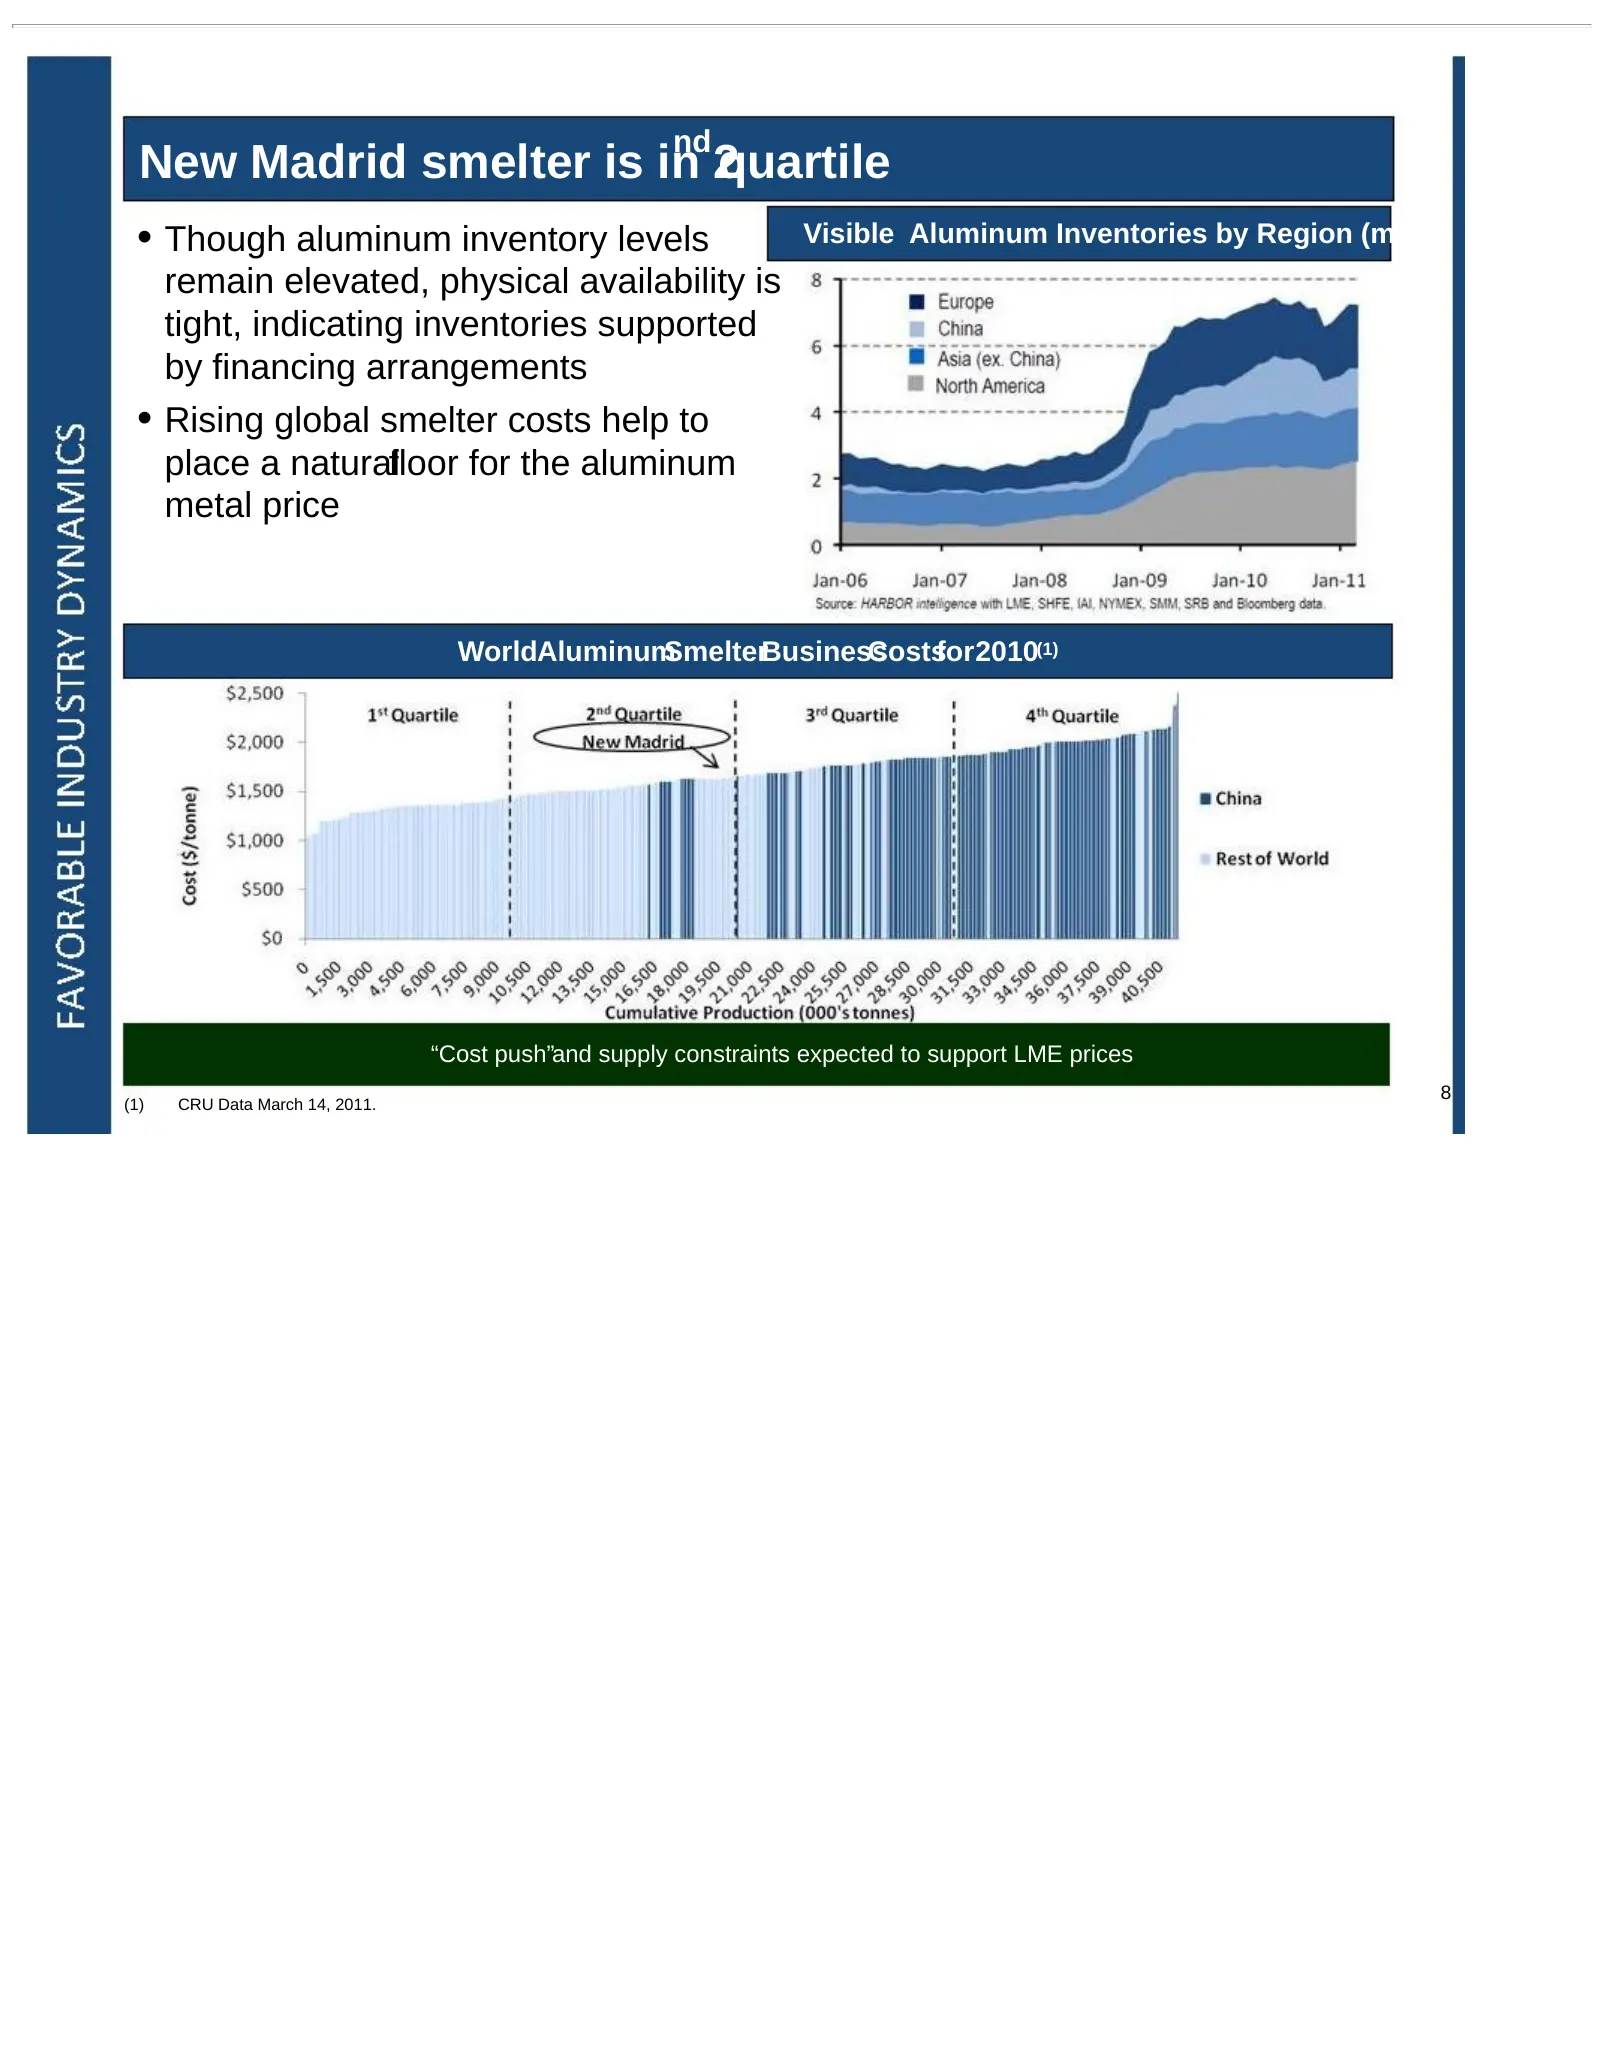
Slide 8: New Madrid smelter is in 2nd quartile
nd New Madrid smelter is in 2quartile • Though aluminum inventory levels Visible Aluminum Inventories by Region (mmt) remain elevated, physical availability is tight, indicating inventories supported by financing arrangements • Rising global smelter costs help to place a naturalfloor for the aluminu
Slide 9: Key Investment Highlights
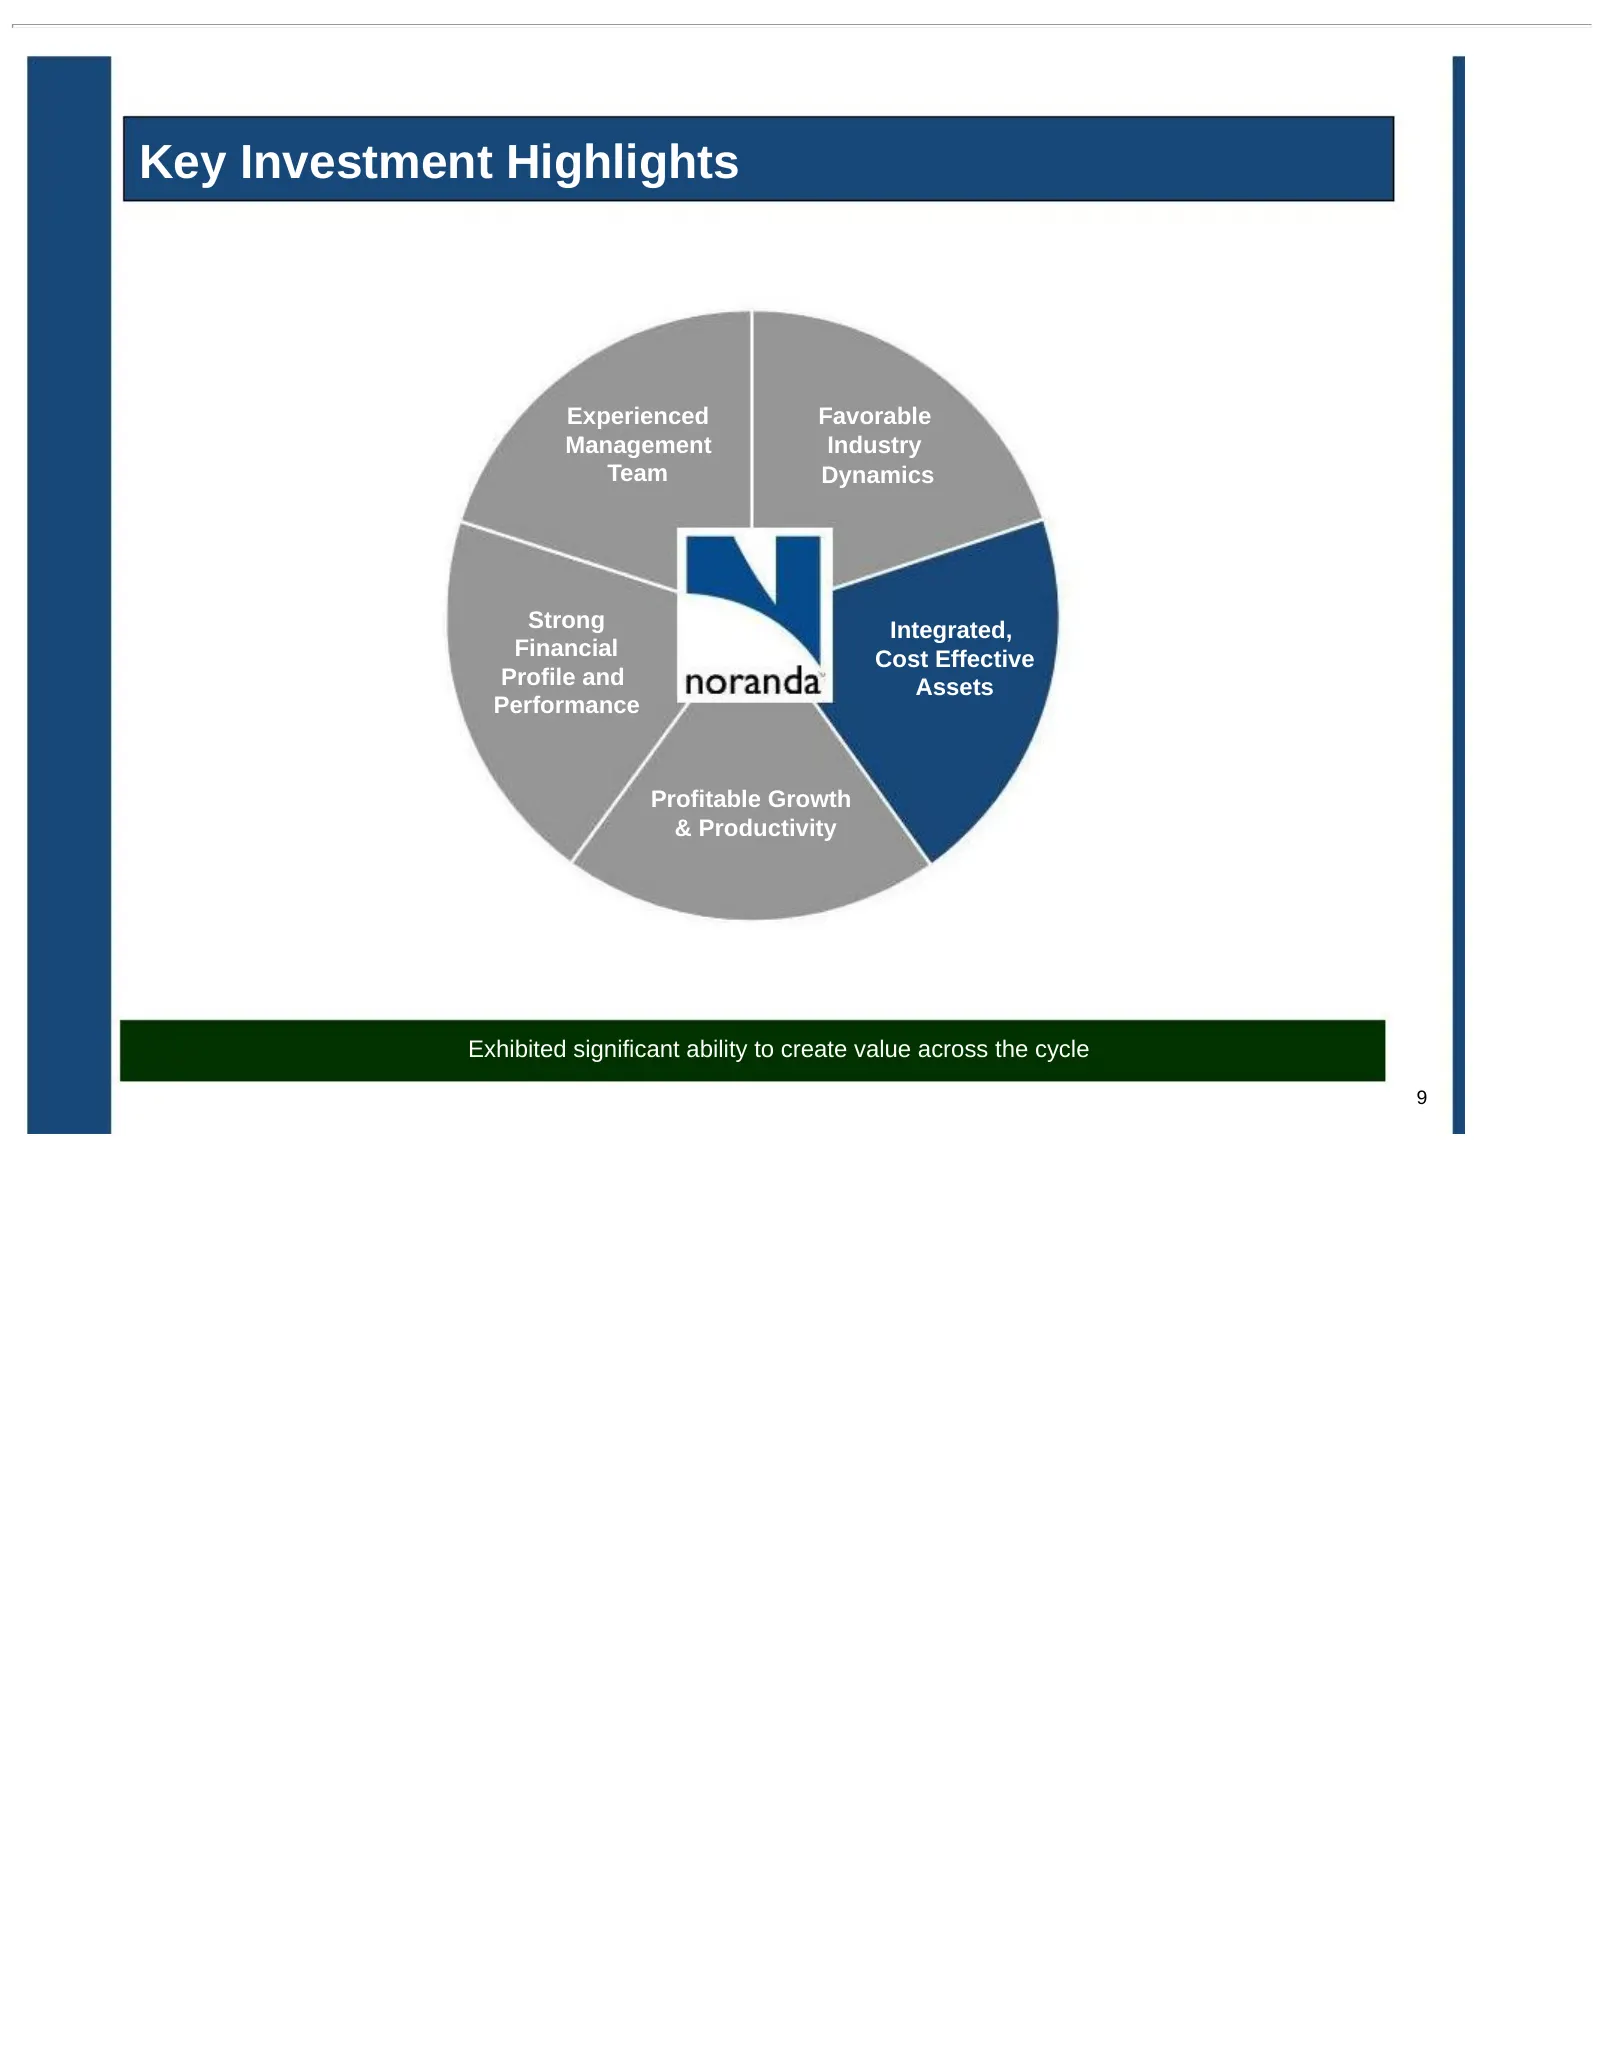
Key Investment Highlights Experienced Favorable Management Industry Team Dynamics Strong Integrated, Financial Cost Effective Profile and Assets Performance Profitable Growth & Productivity Exhibited significant ability to create value across the cycle 9
Slide 10: Noranda's Integrated Footprint
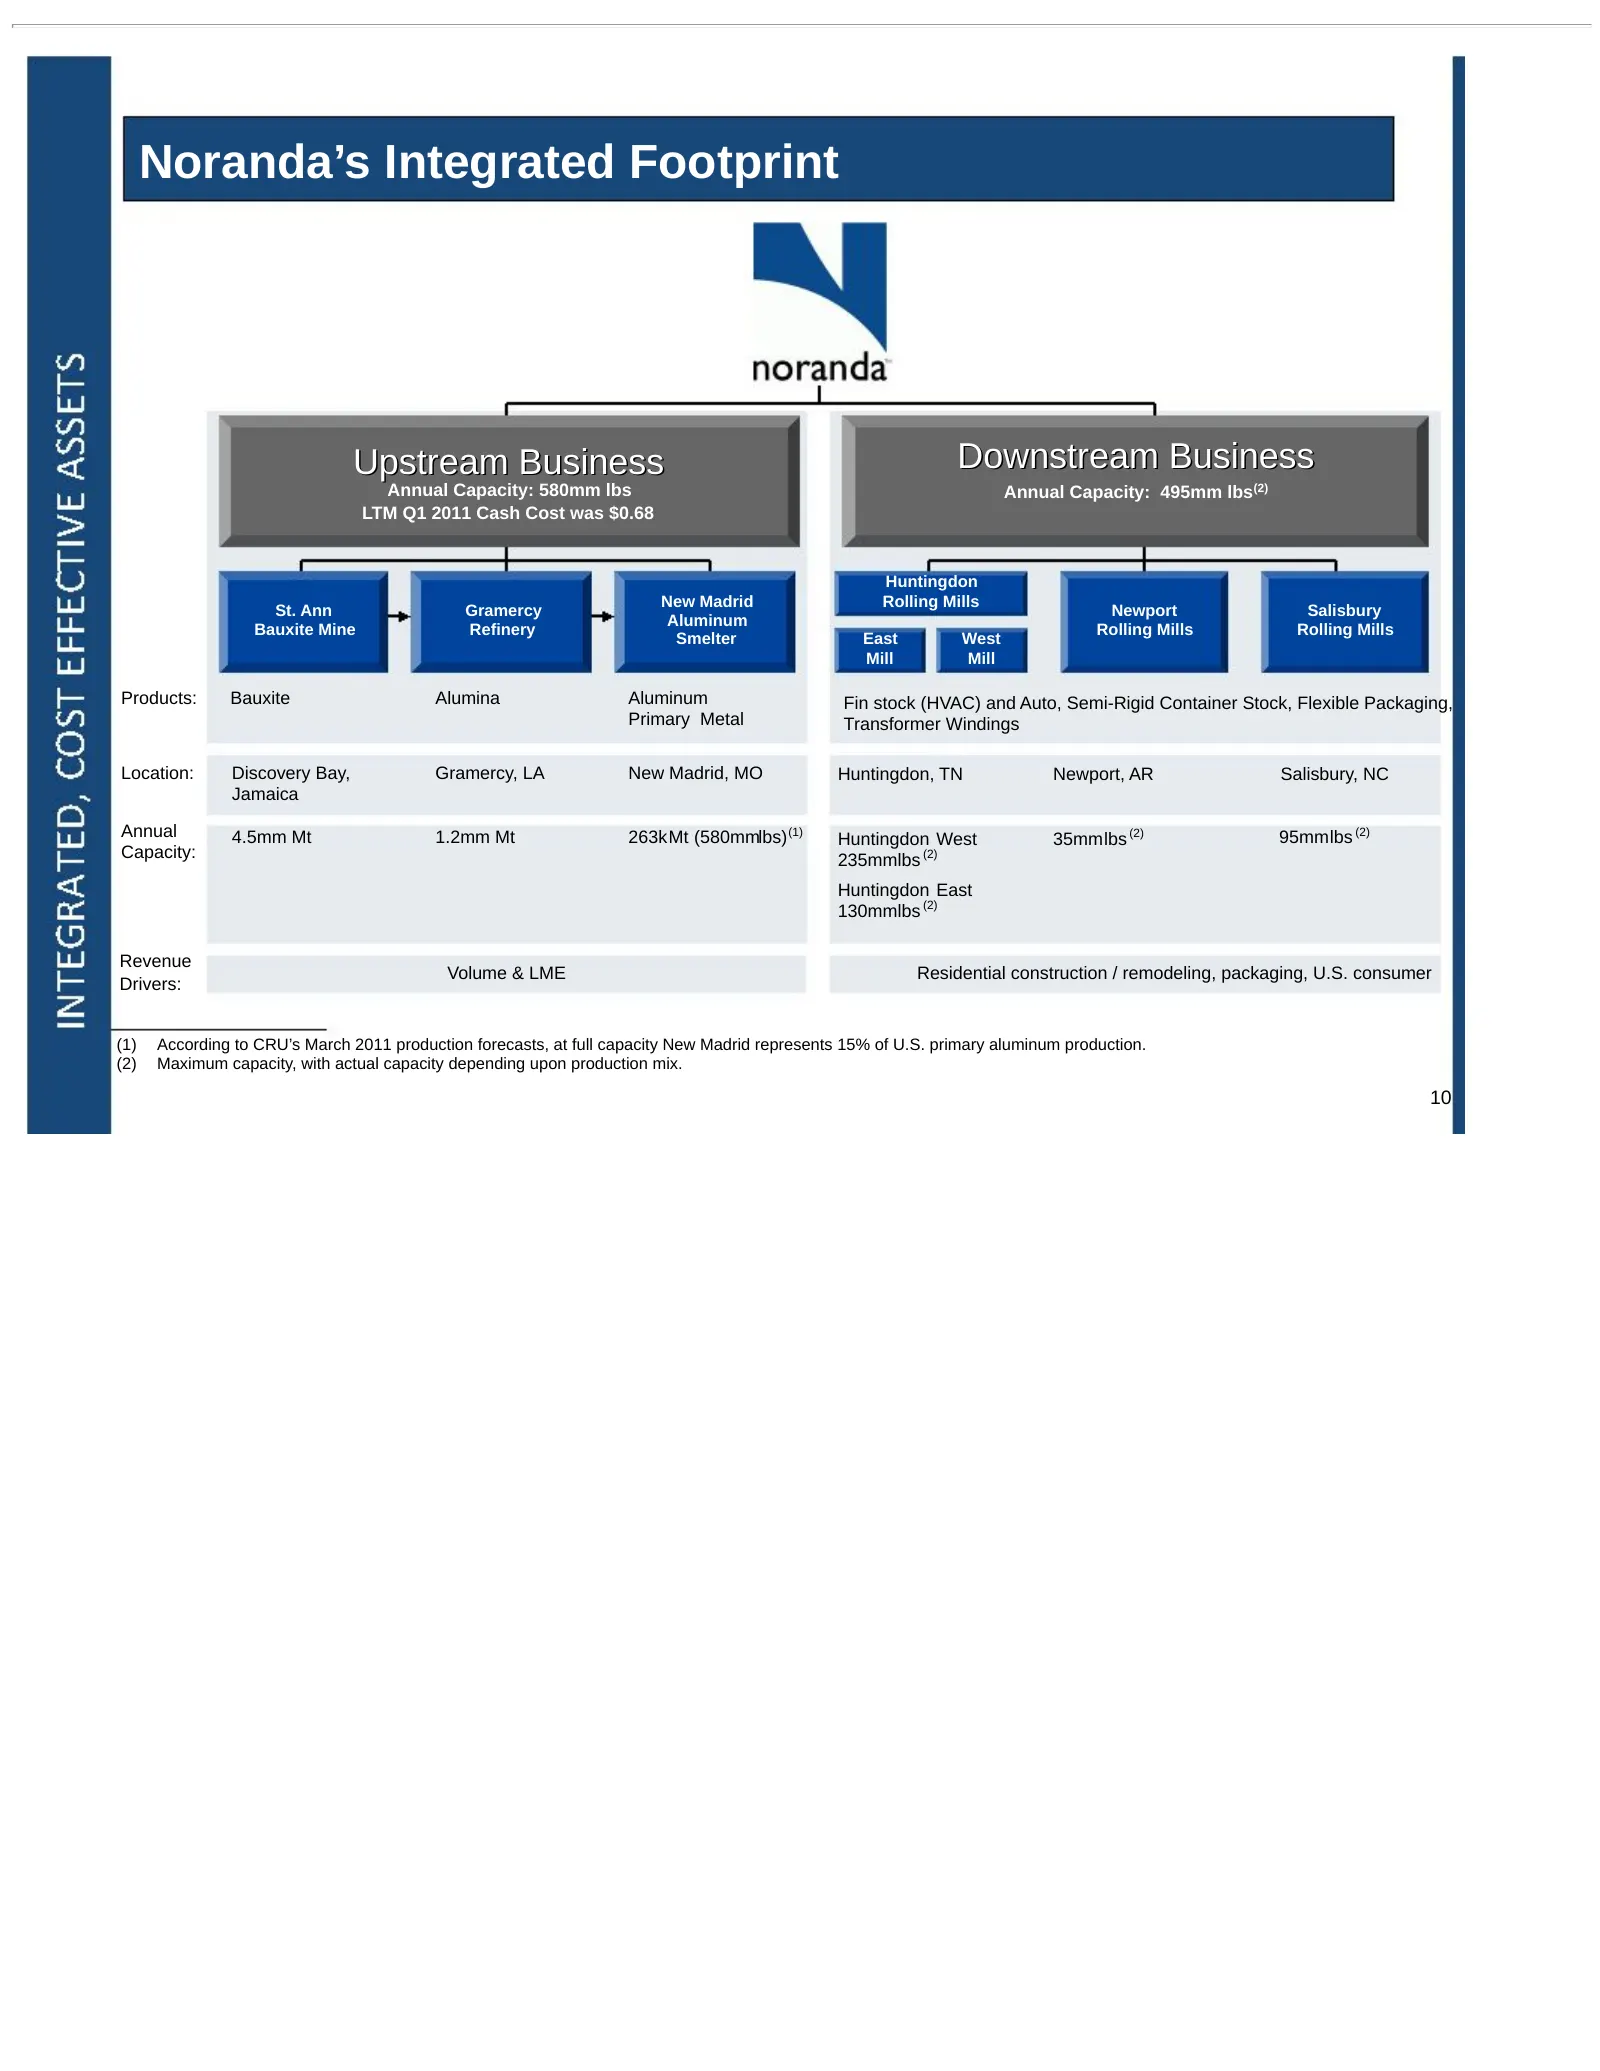
Noranda’s Integrated Footprint Upstream Business Downstream Business Annual Capacity: 580mm lbs Annual Capacity: 495mm lbs(2) LTM Q1 2011 Cash Cost was $0.68 Huntingdon New Madrid Rolling Mills St. Ann Gramercy Newport Salisbury Aluminum Bauxite Mine Refinery Rolling Mills Rolling Mills Smelter East
Slide 11: Vertically Integrated Upstream Business
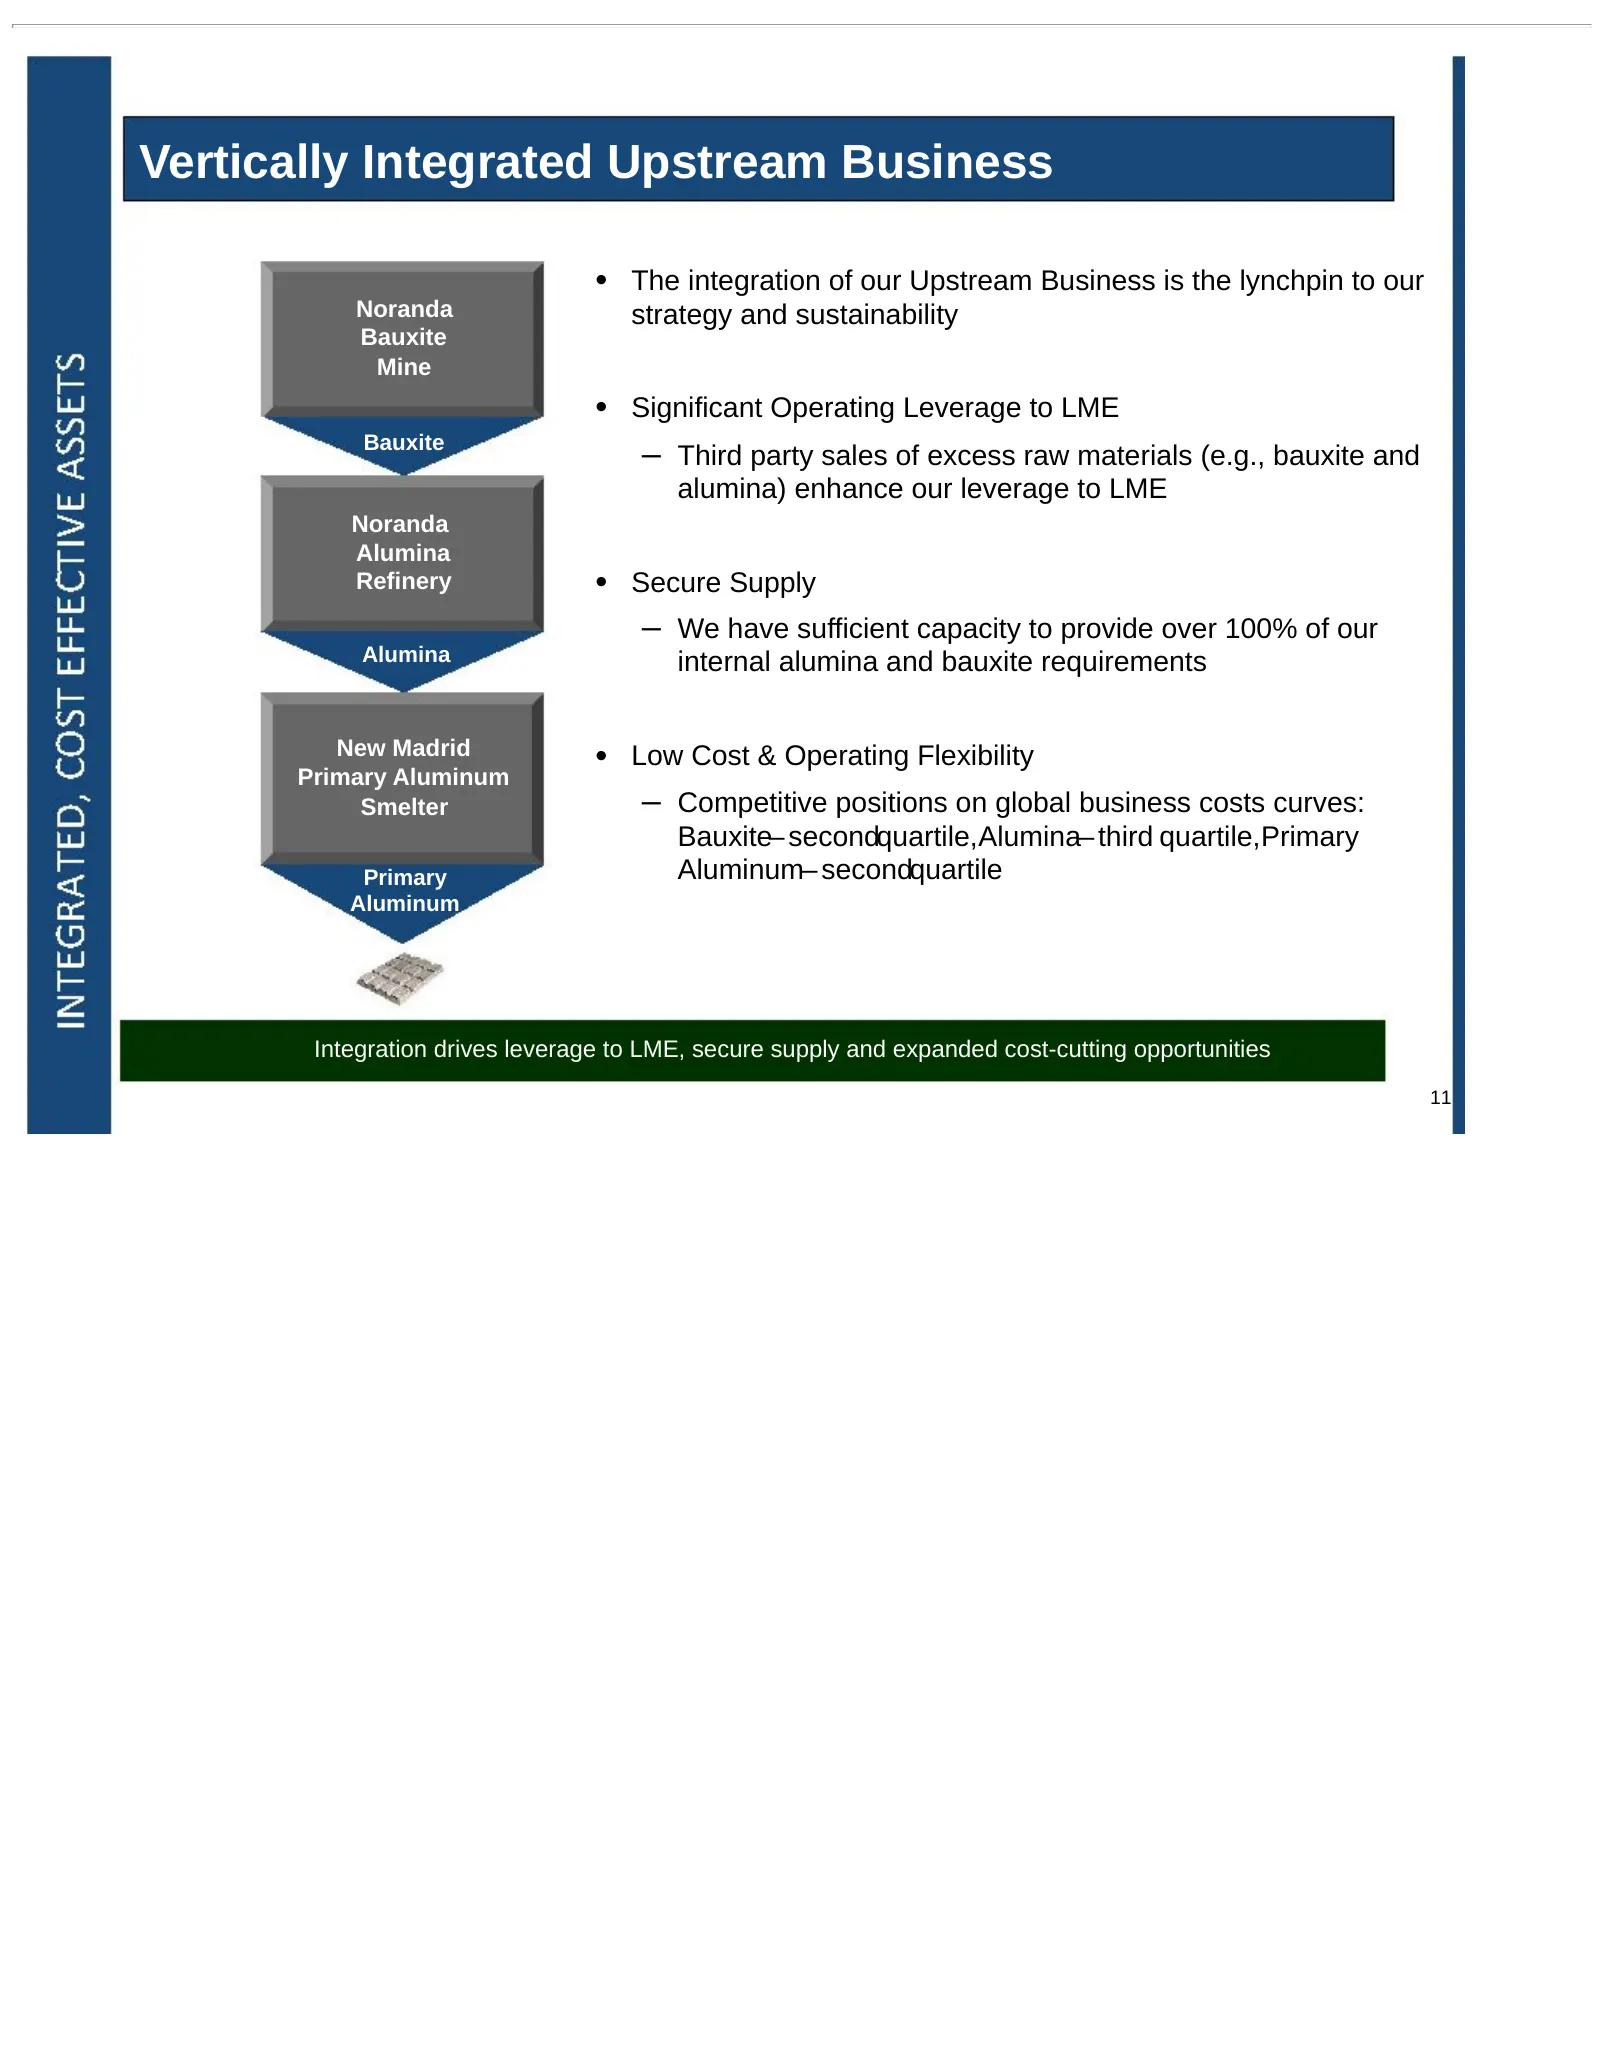
Vertically Integrated Upstream Business • The integration of our Upstream Business is the lynchpin to our Noranda strategy and sustainability Bauxite Mine • Significant Operating Leverage to LME Bauxite – Third party sales of excess raw materials (e.g., bauxite and alumina) enhance our leverage to L
Slide 12: Operating Leverage Comparison
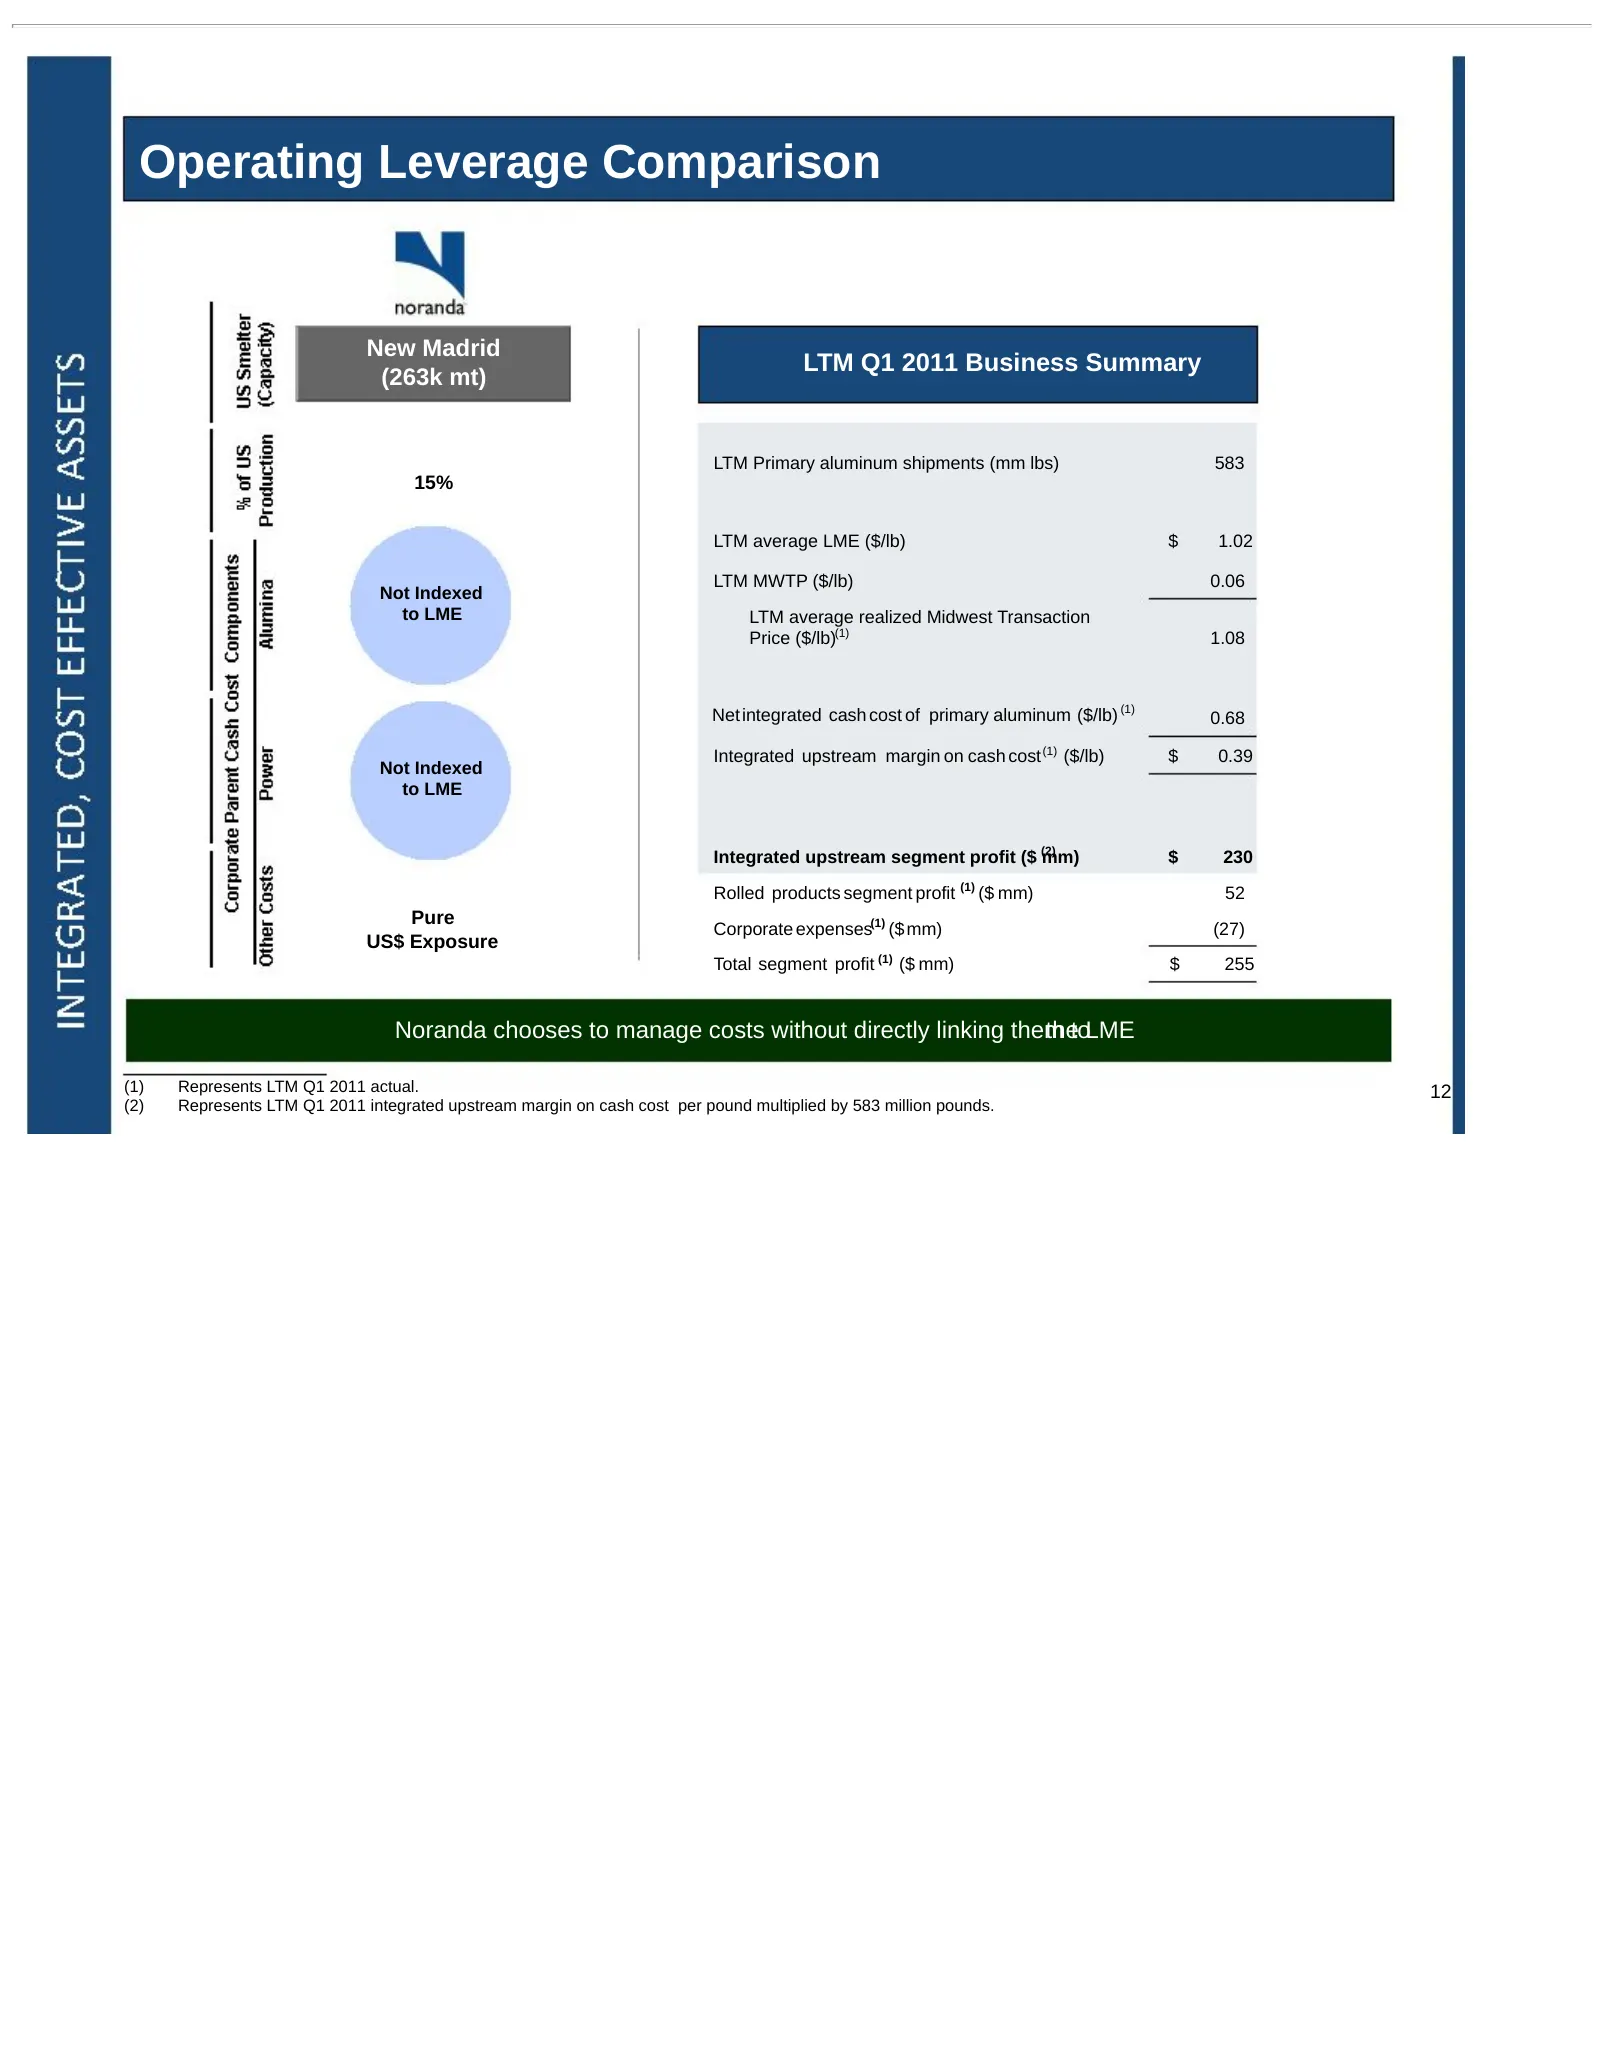
Operating Leverage Comparison New Madrid LTM Q1 2011 Business Summary (263k mt) LTM Primary aluminum shipments (mm lbs) 583 15% LTM average LME ($/lb) $ 1.02 LTM MWTP ($/lb) 0.06 Not Indexed to LME LTM average realized Midwest Transaction Price ($/lb)(1) 1.08 Net integrated cash cost of primary alum
Slide 13: Low Cost, Leading Downstream Business
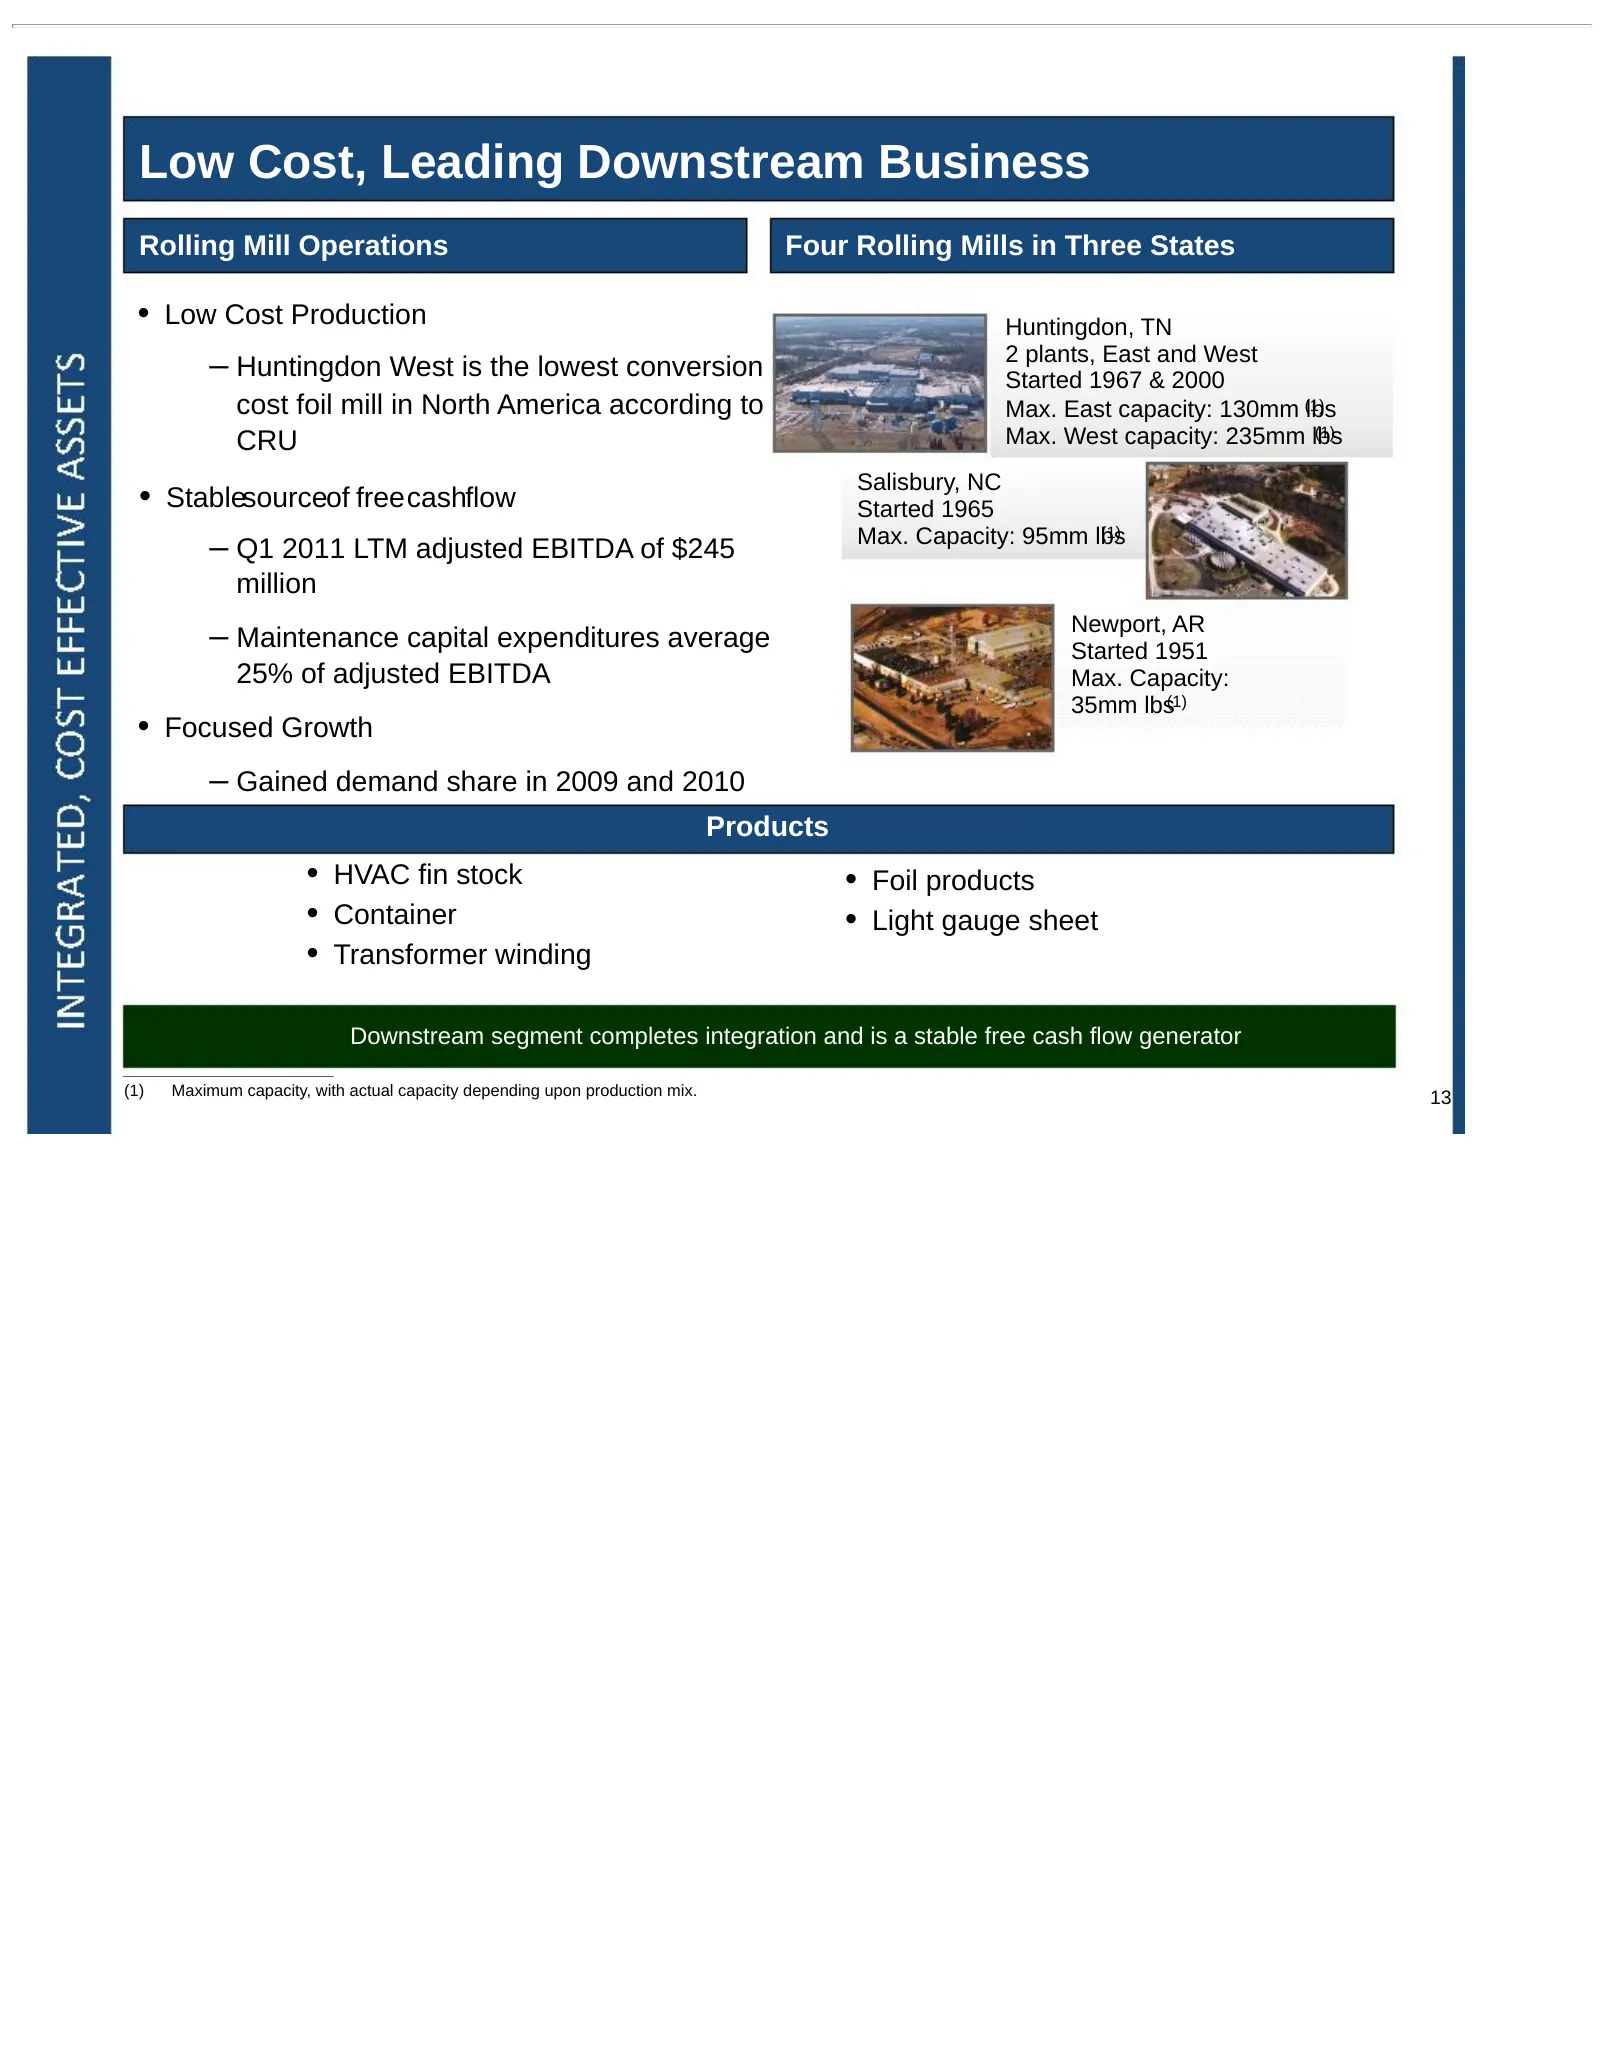
Low Cost, Leading Downstream Business Rolling Mill Operations Four Rolling Mills in Three States • Low Cost Production Huntingdon, TN 2 plants, East and West – Huntingdon West is the lowest conversion Started 1967 & 2000 cost foil mill in North America according to Max. East capacity: 130mm (1) lbs
Slide 14: Key Investment Highlights
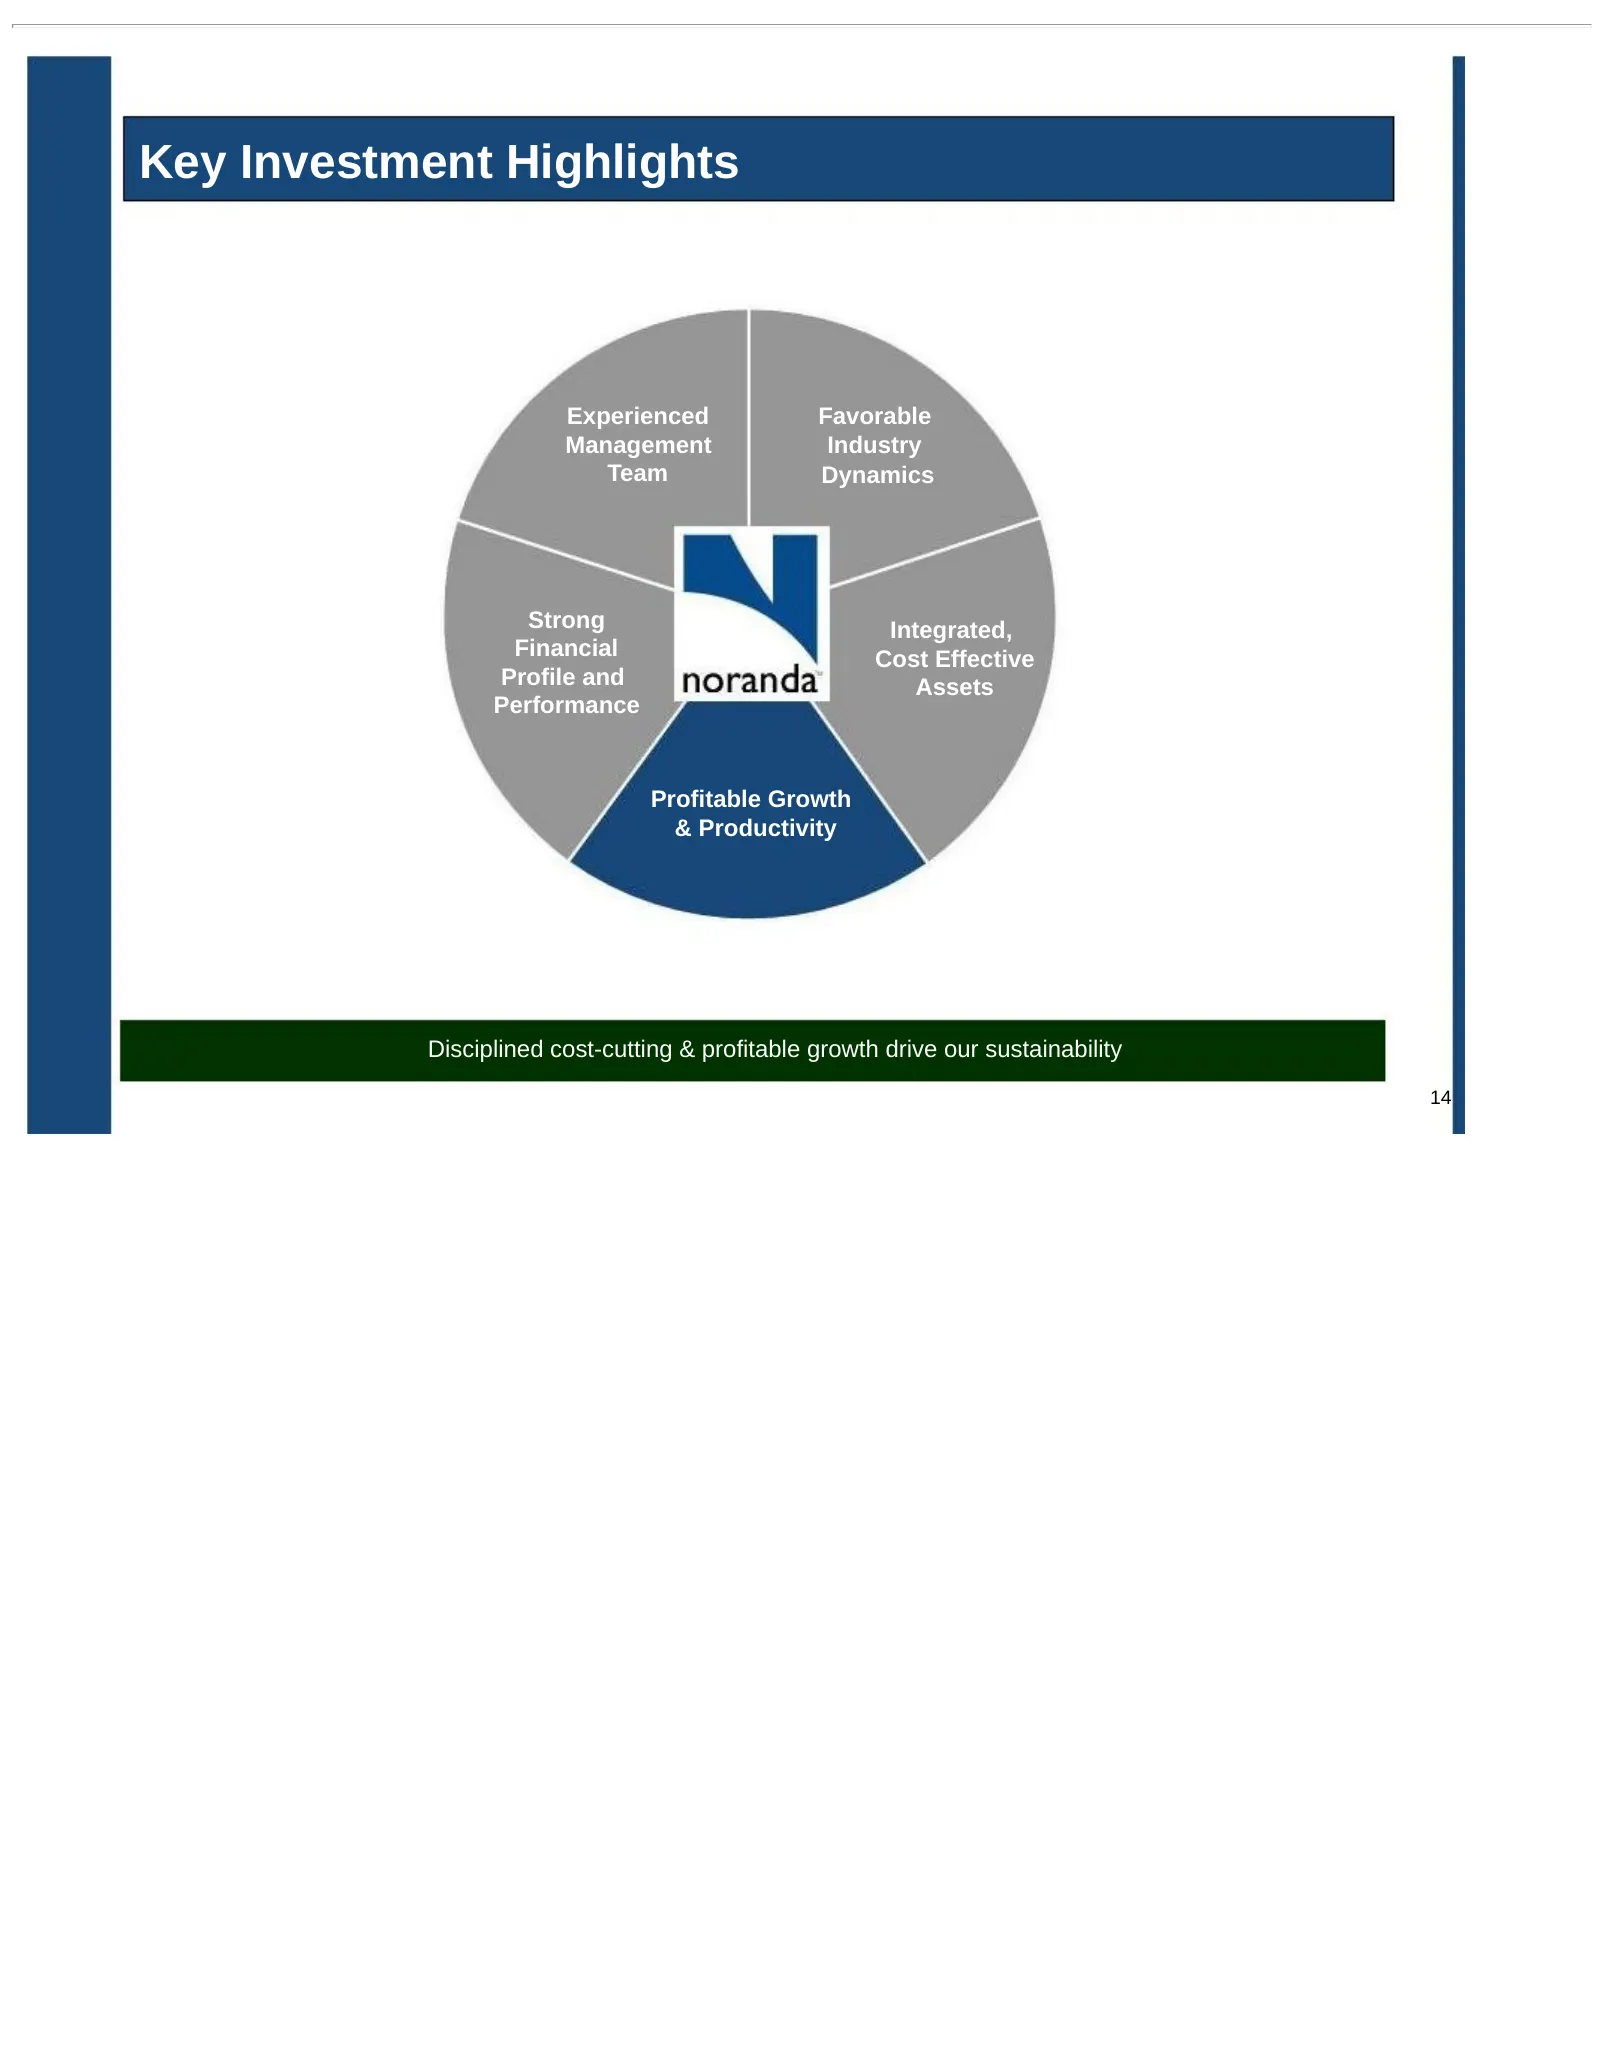
Key Investment Highlights Experienced Favorable Management Industry Team Dynamics Strong Integrated, Financial Cost Effective Profile and Assets Performance Profitable Growth & Productivity Disciplined cost-cutting & profitable growth drive our sustainability 14
Slide 15: Multiple Levers for Growth
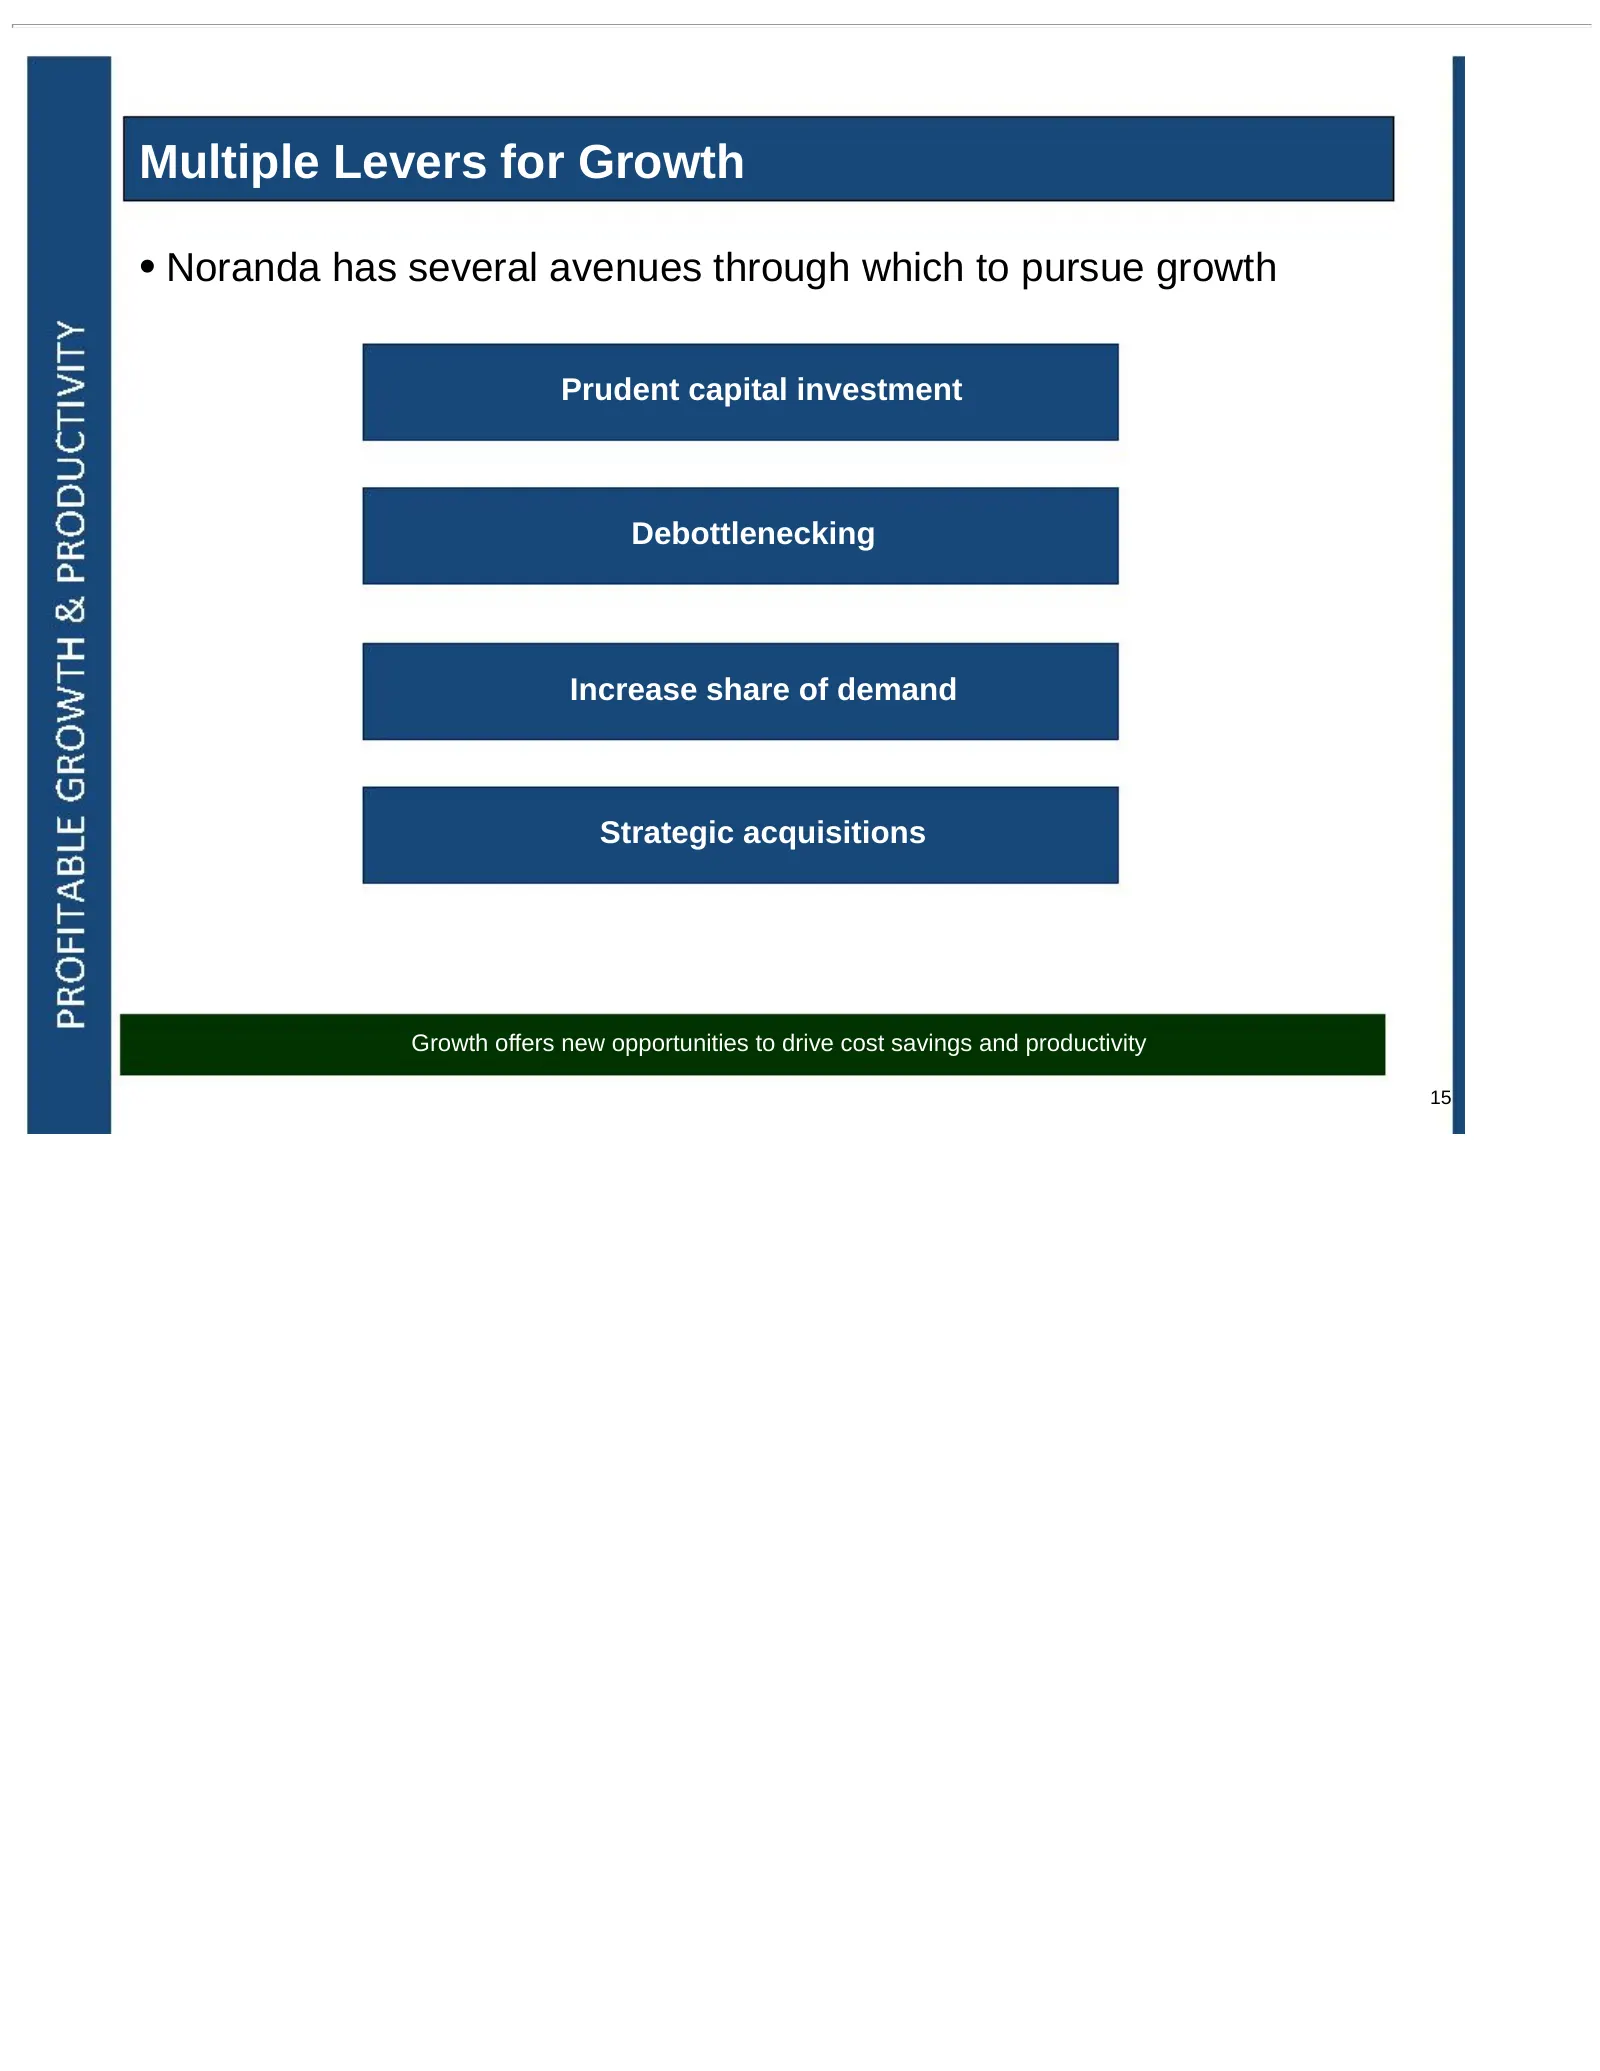
Multiple Levers for Growth • Noranda has several avenues through which to pursue growth Prudent capital investment Debottlenecking Increase share of demand Strategic acquisitions Growth offers new opportunities to drive cost savings and productivity 15
Slide 16: Strong Focus on Productivity
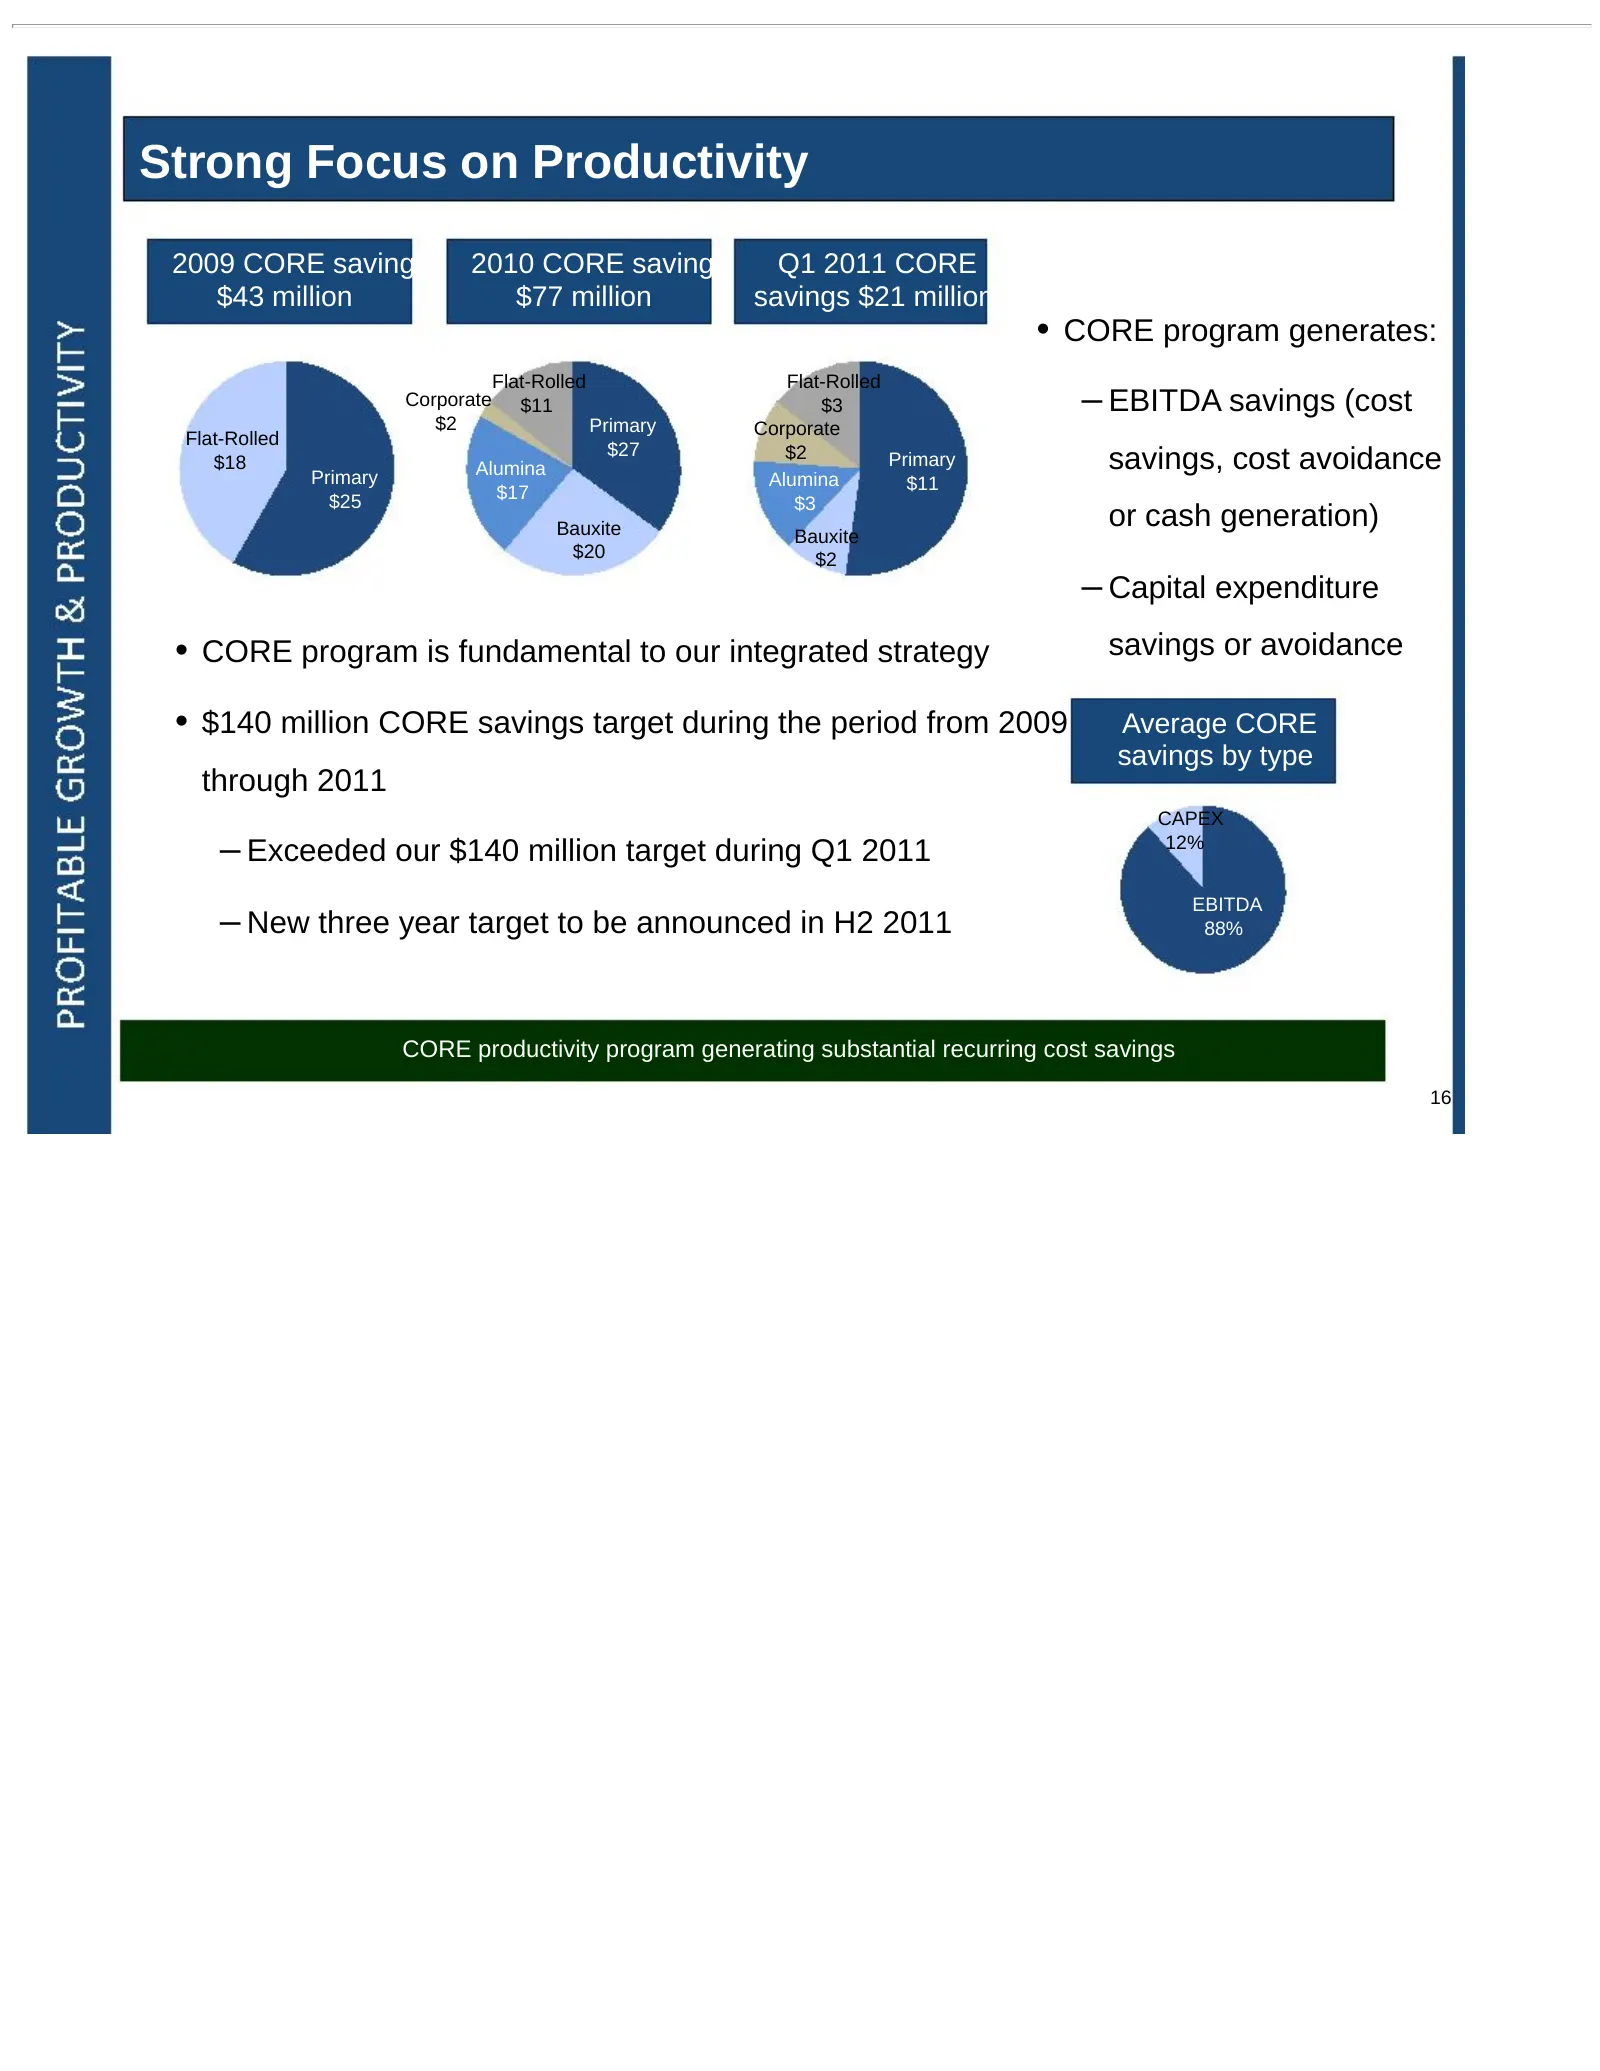
Strong Focus on Productivity 2009 CORE savings 2010 CORE savings Q1 2011 CORE $43 million $77 million savings $21 million • CORE program generates: Flat-Rolled Flat-Rolled Corporate $11 $3 – EBITDA savings (cost $2 Primary Corporate Flat-Rolled $27 $18 Primary Alumina $2 Primary savings, cost avoida
Slide 17: Key Investment Highlights
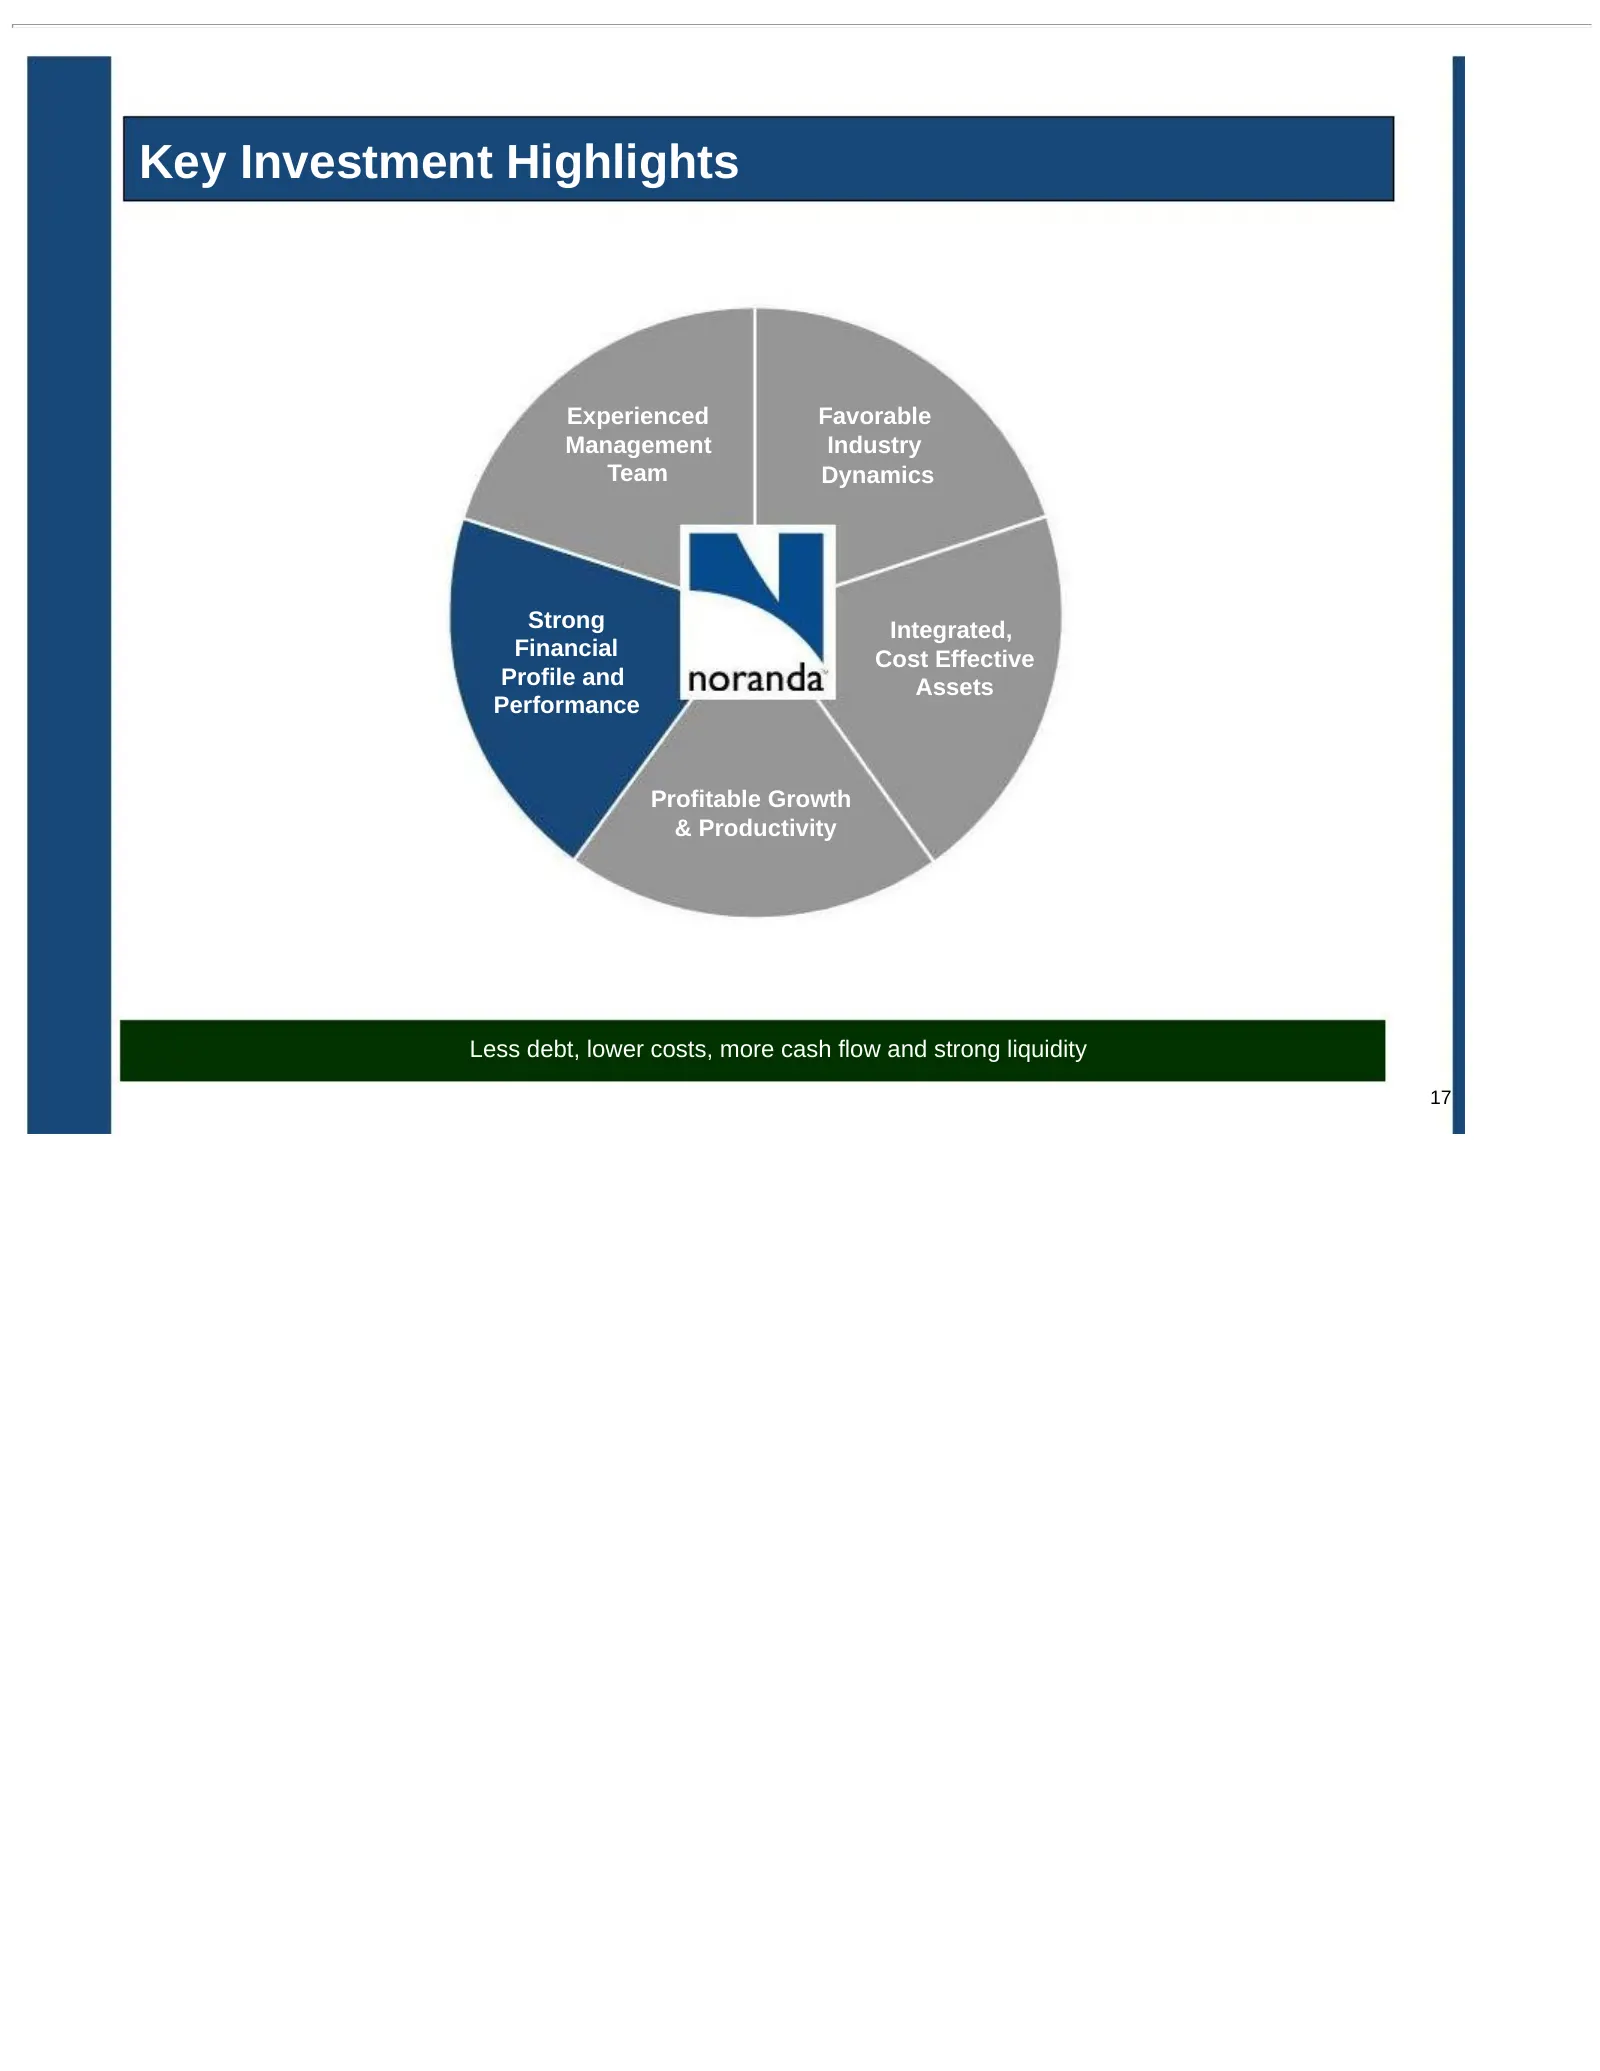
Key Investment Highlights Experienced Favorable Management Industry Team Dynamics Strong Integrated, Financial Cost Effective Profile and Assets Performance Profitable Growth & Productivity Less debt, lower costs, more cash flow and strong liquidity 17
Slide 18: We Have Created the Financial Flexibility to Grow
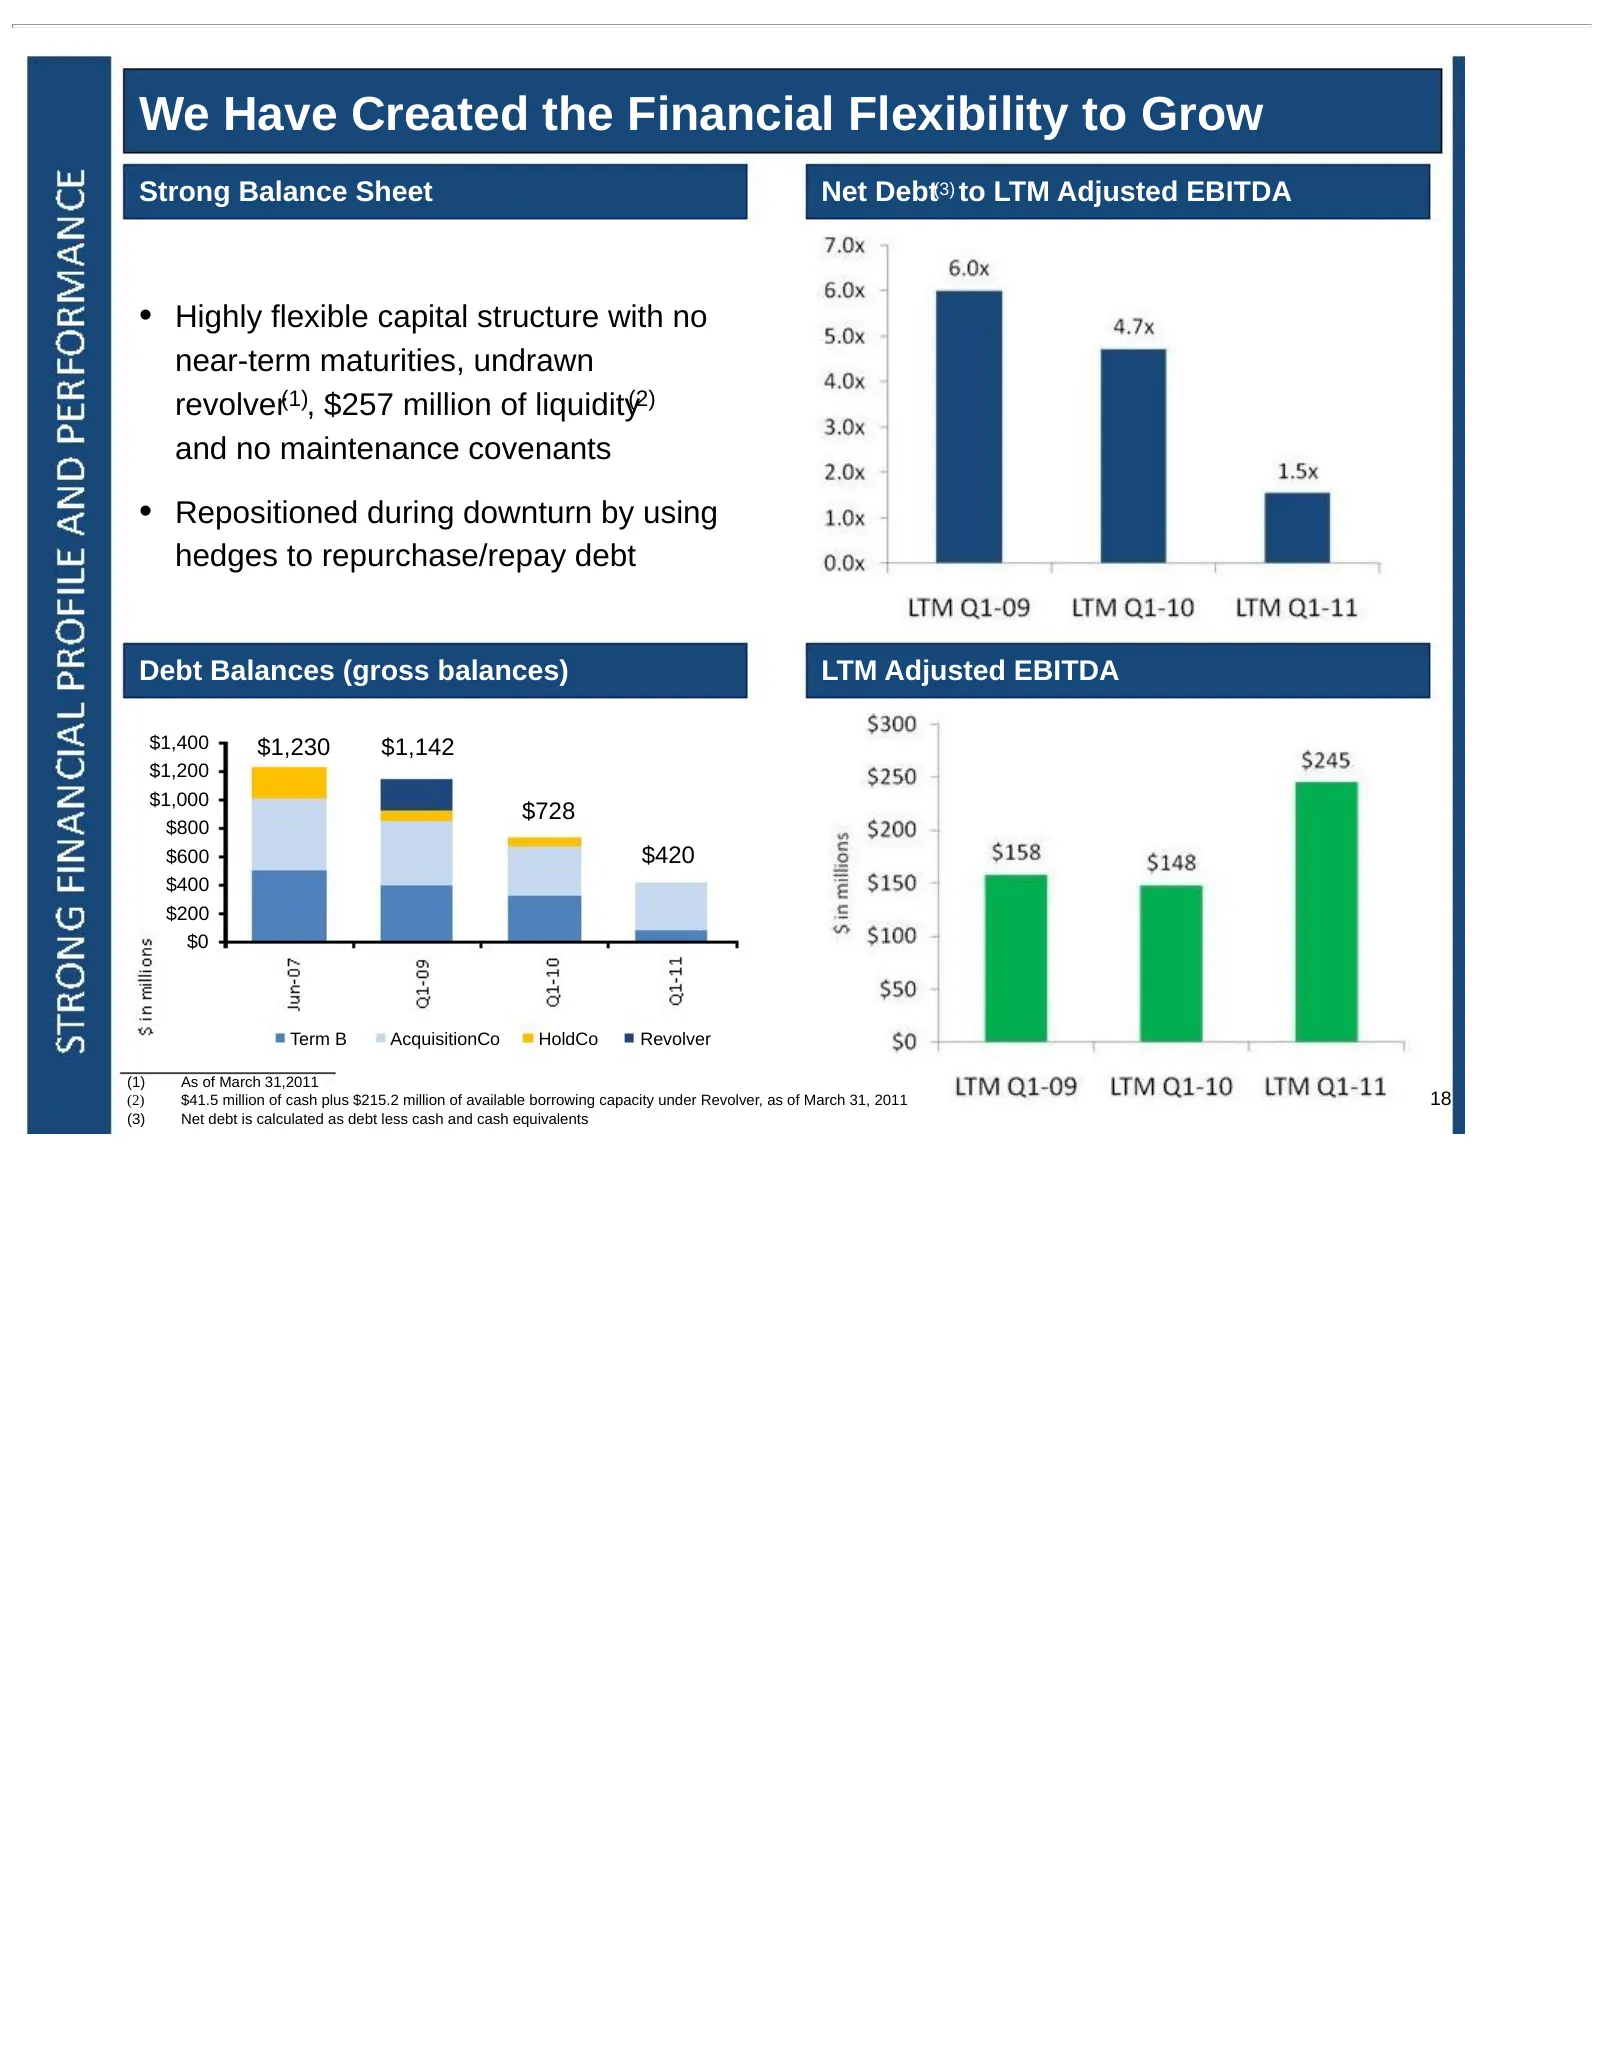
We Have Created the Financial Flexibility to Grow Strong Balance Sheet Net Debt(3) to LTM Adjusted EBITDA • Highly flexible capital structure with no near-term maturities, undrawn revolver(1), $257 million of liquidity(2) and no maintenance covenants • Repositioned during downturn by using hedges to
Slide 19: Key Investment Highlights
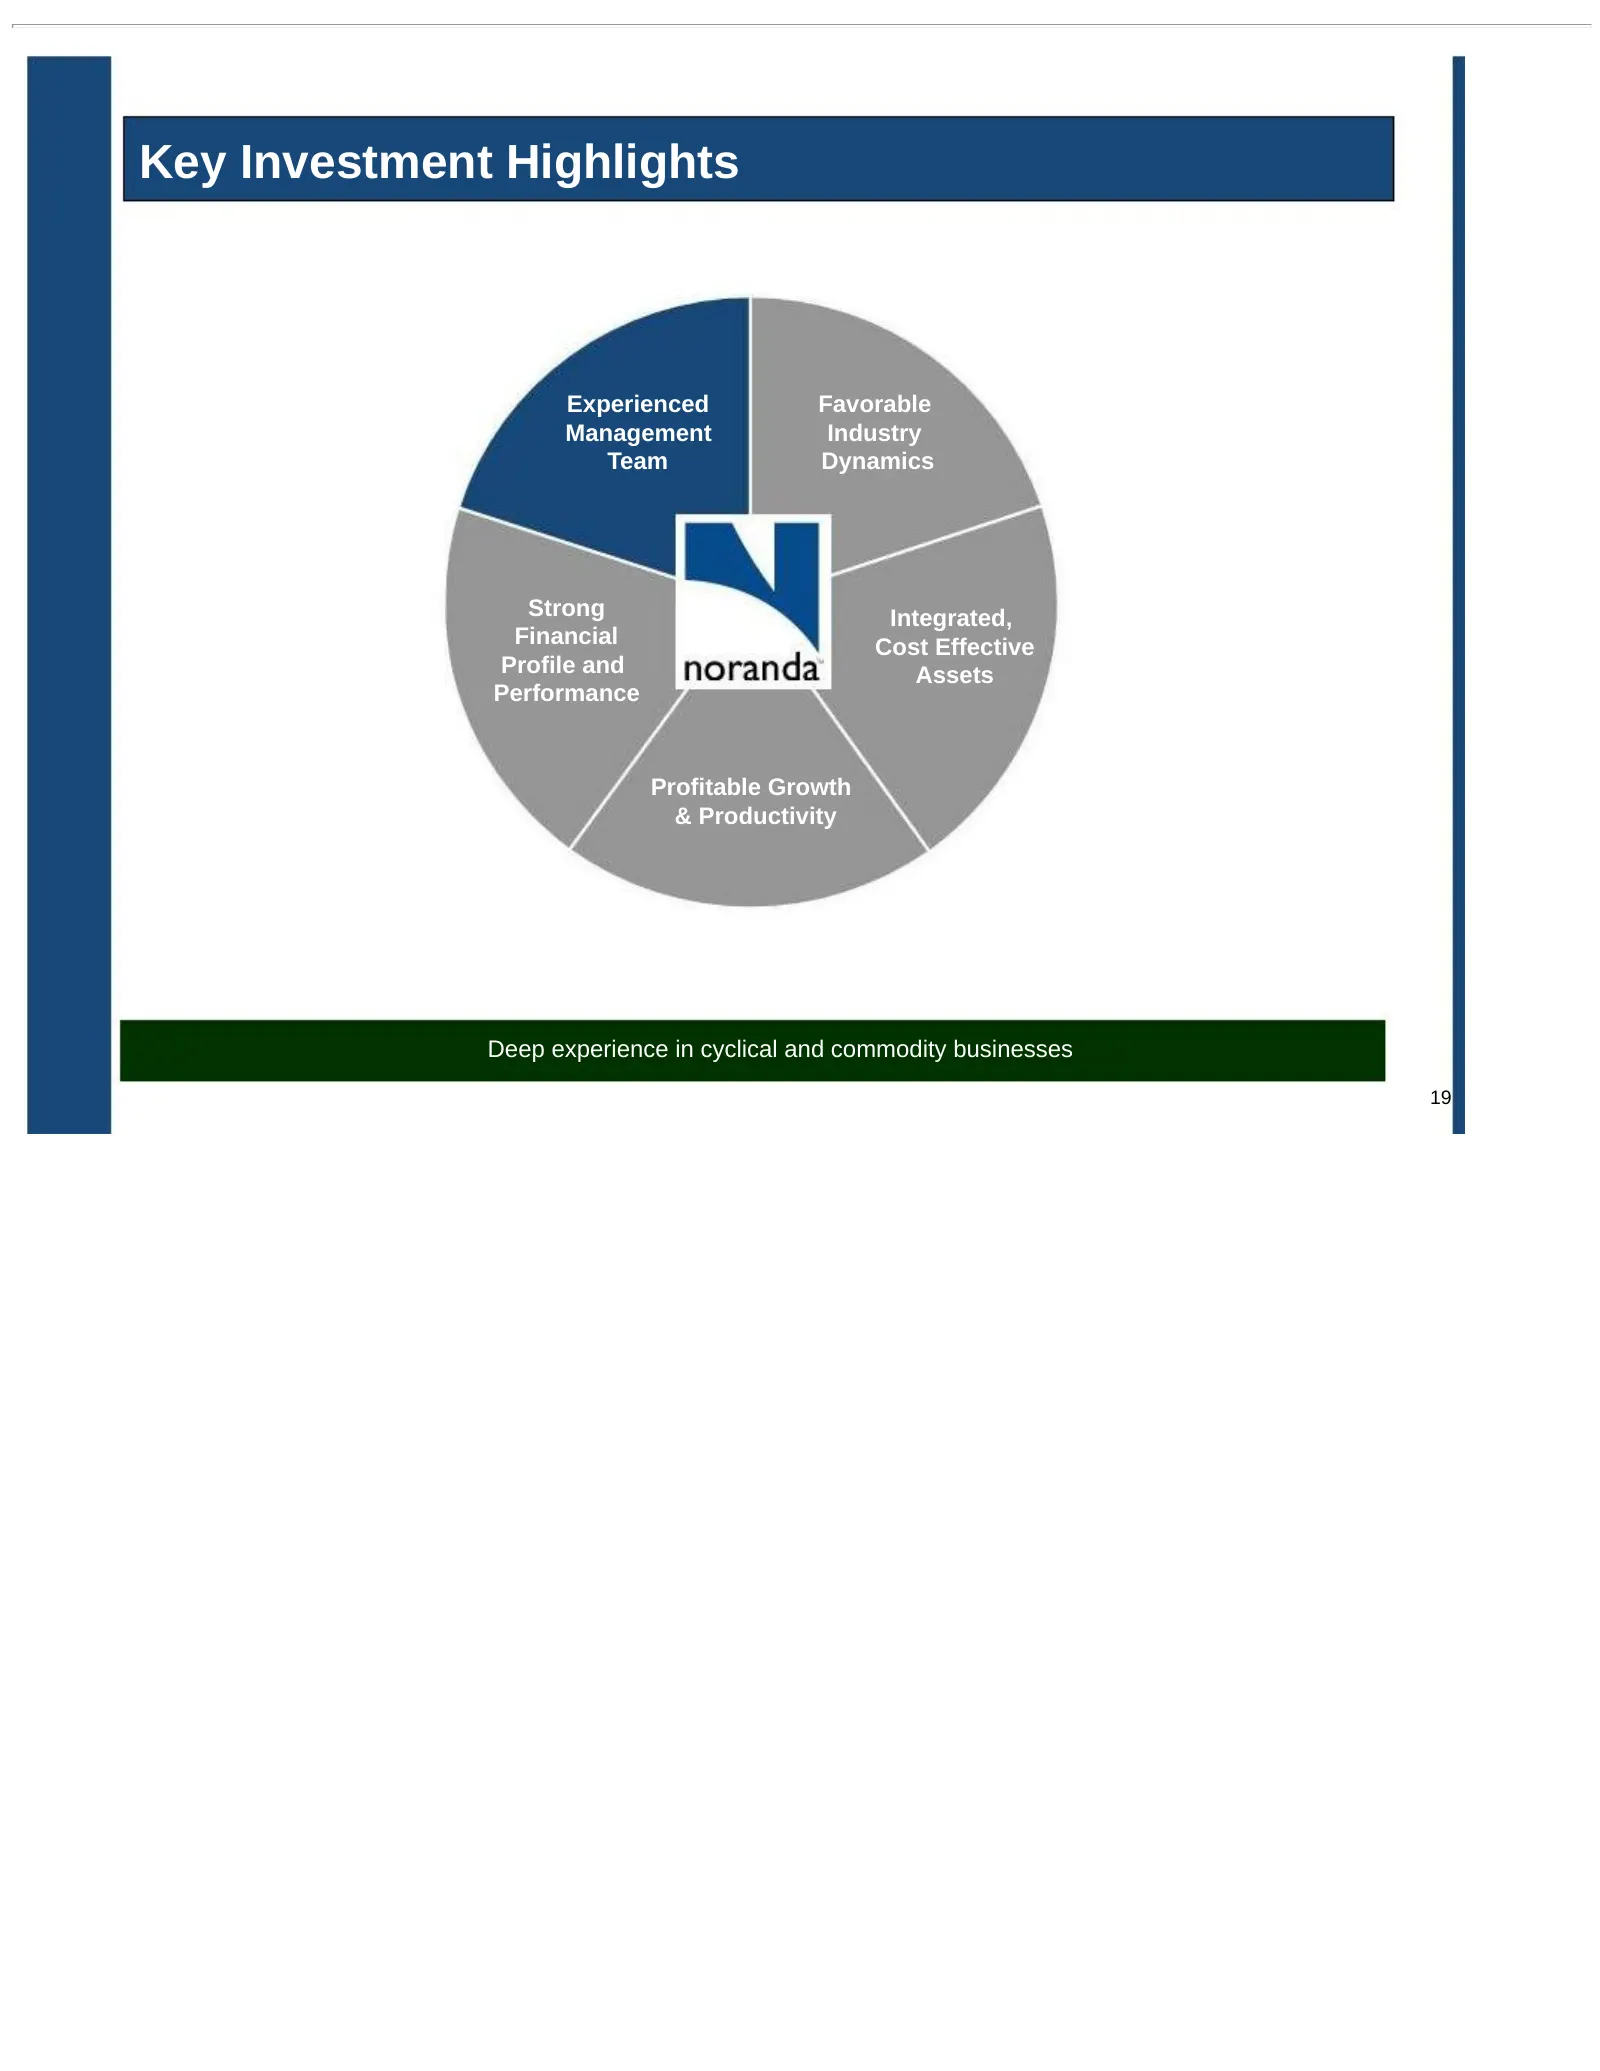
Key Investment Highlights Experienced Favorable Management Industry Team Dynamics Strong Integrated, Financial Cost Effective Profile and Assets Performance Profitable Growth & Productivity Deep experience in cyclical and commodity businesses 19
Slide 20: Experienced Management Team
Experienced Management Team • Management has created significant shareholder value at Noranda • Our executive team’s 14 members have an average of 24 years of experience in cyclical and commodity industries – Layle “Kip” Smith,PresidentandChiefExecutiveOfficer,hasover26 yearsof leadershipexperience,
Slide 21: Noranda Mission
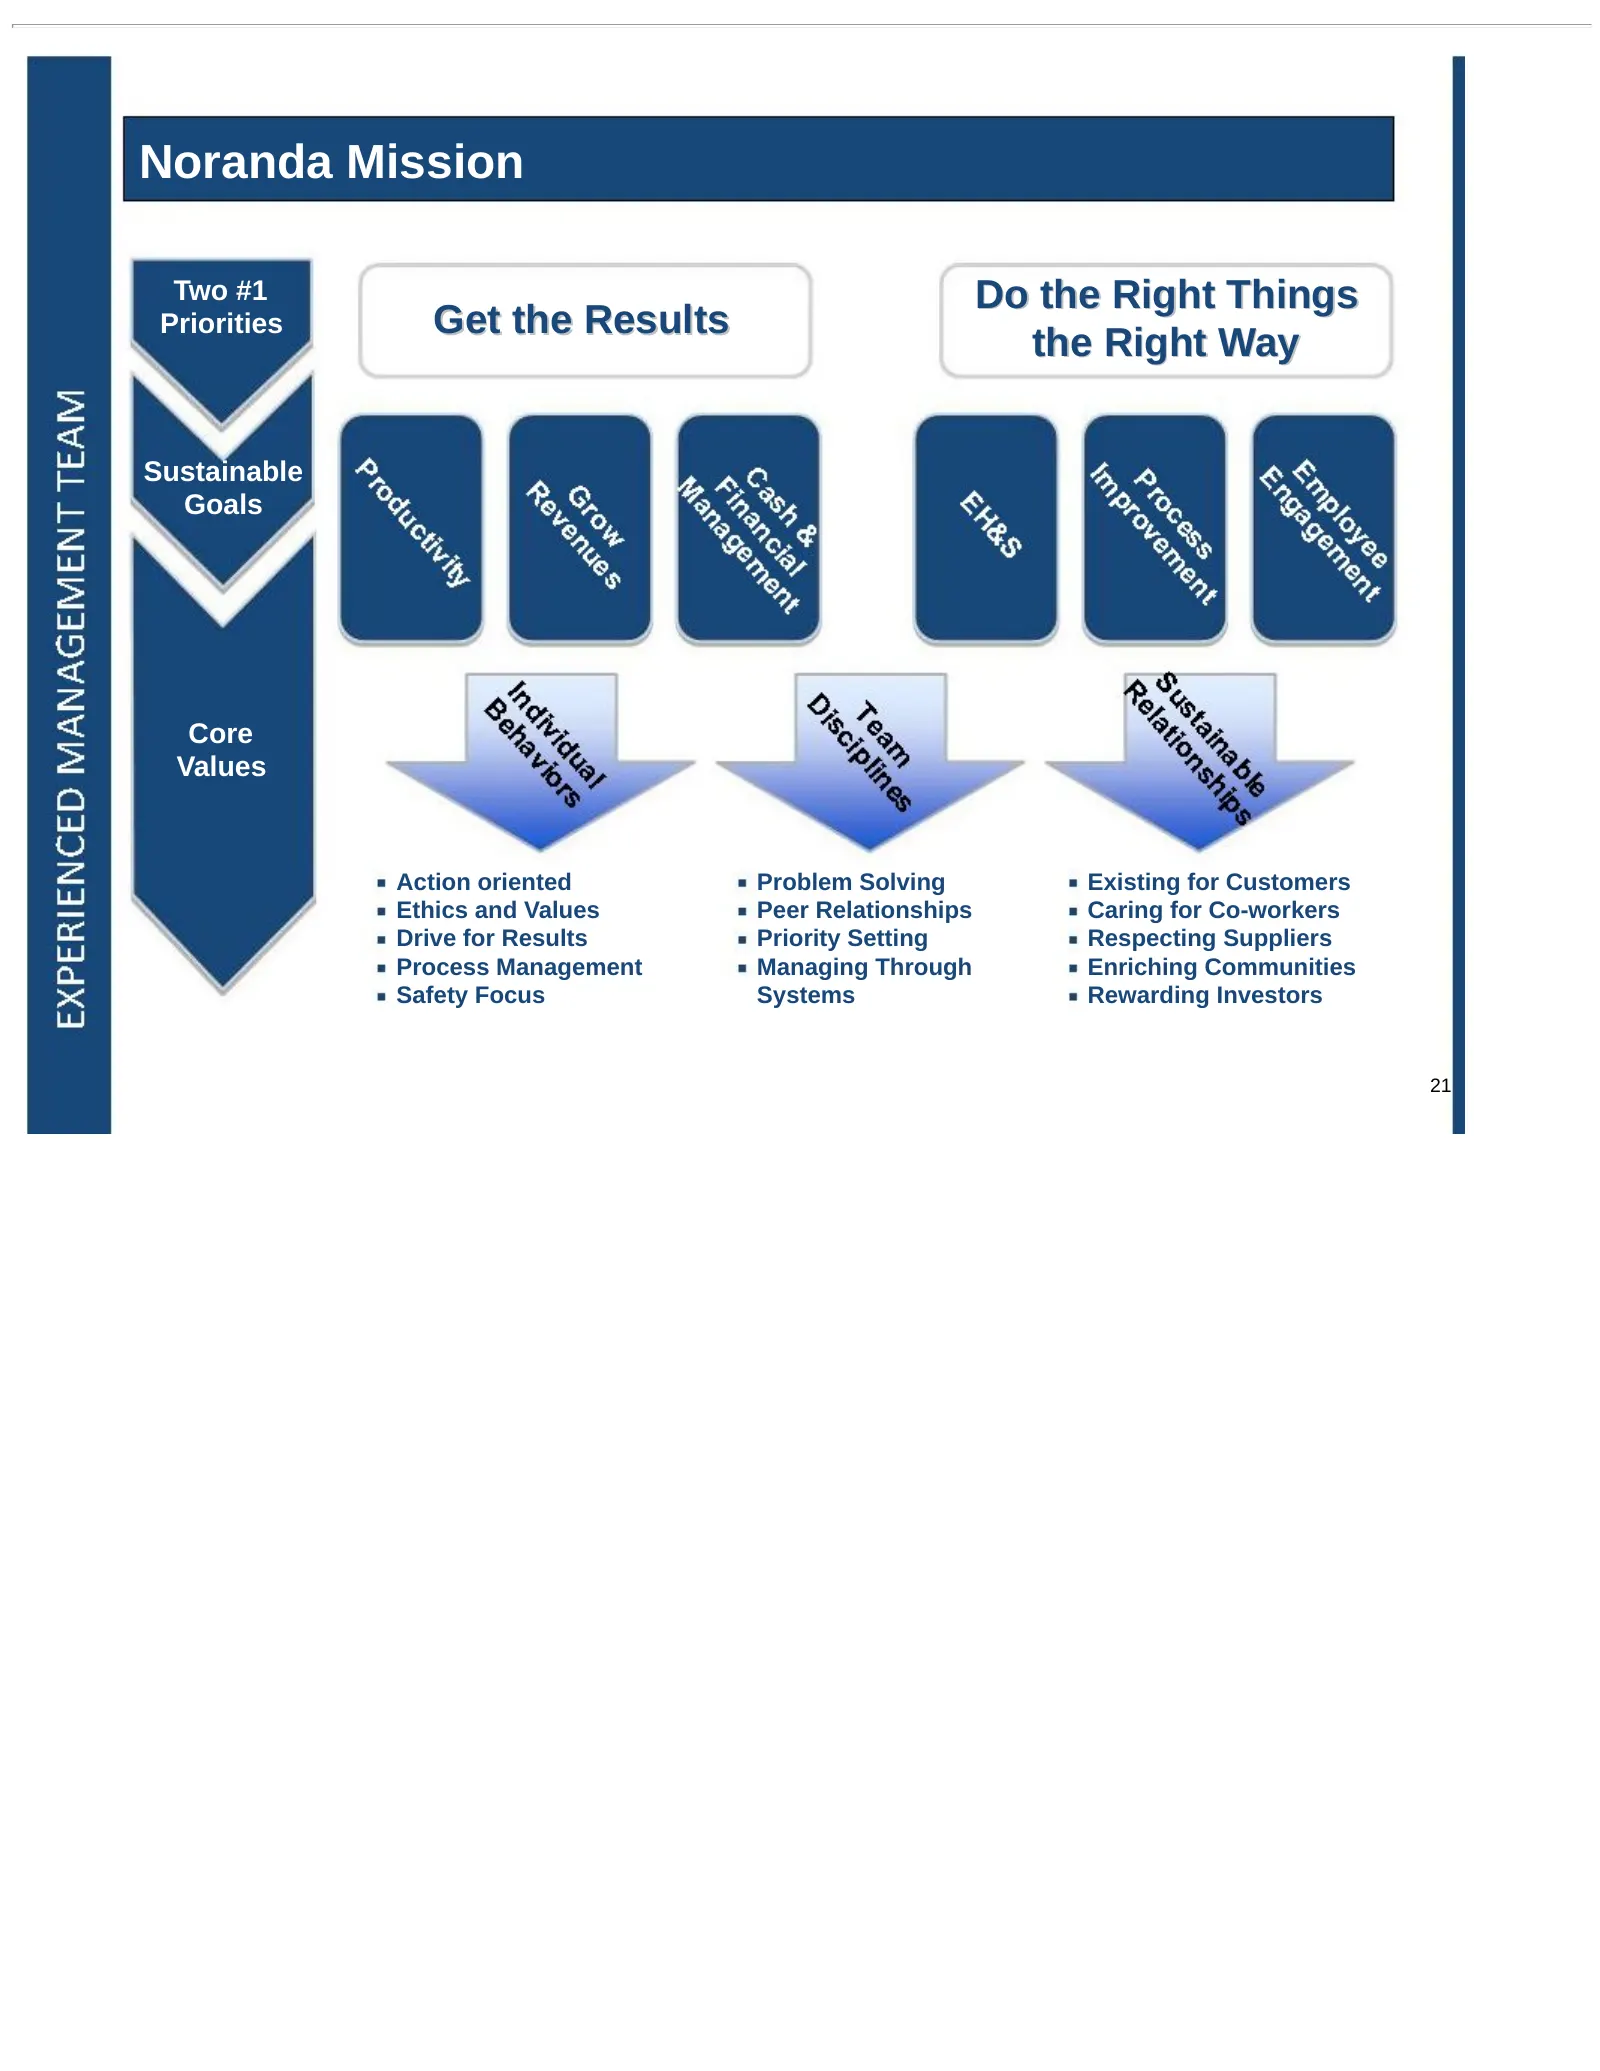
Noranda Mission Two #1 Do the Right Things Priorities Get the Results the Right Way Sustainable Goals Core Values Action oriented Problem Solving Existing for Customers Ethics and Values Peer Relationships Caring for Co-workers Drive for Results Priority Setting Respecting Suppliers Process Manageme

Slide 22: Appendices
—) a 2 Ss < © Q. Q. <x NOILVYOdYOD SNIGIOH WANIAINTY VONVYON
Slide 23: Non-GAAP Measure: Disclaimer
Non-GAAP Measure: Disclaimer This presentation contains non-GAAP financial measures as defined by SEC rules. We think that these measures are helpful to investors in measuring our financial performance and comparing our performance to our peers. However, our non-GAAP financial measures may not be co
Slide 24: Non-GAAP Measure: LTM Segment Profit (Loss)
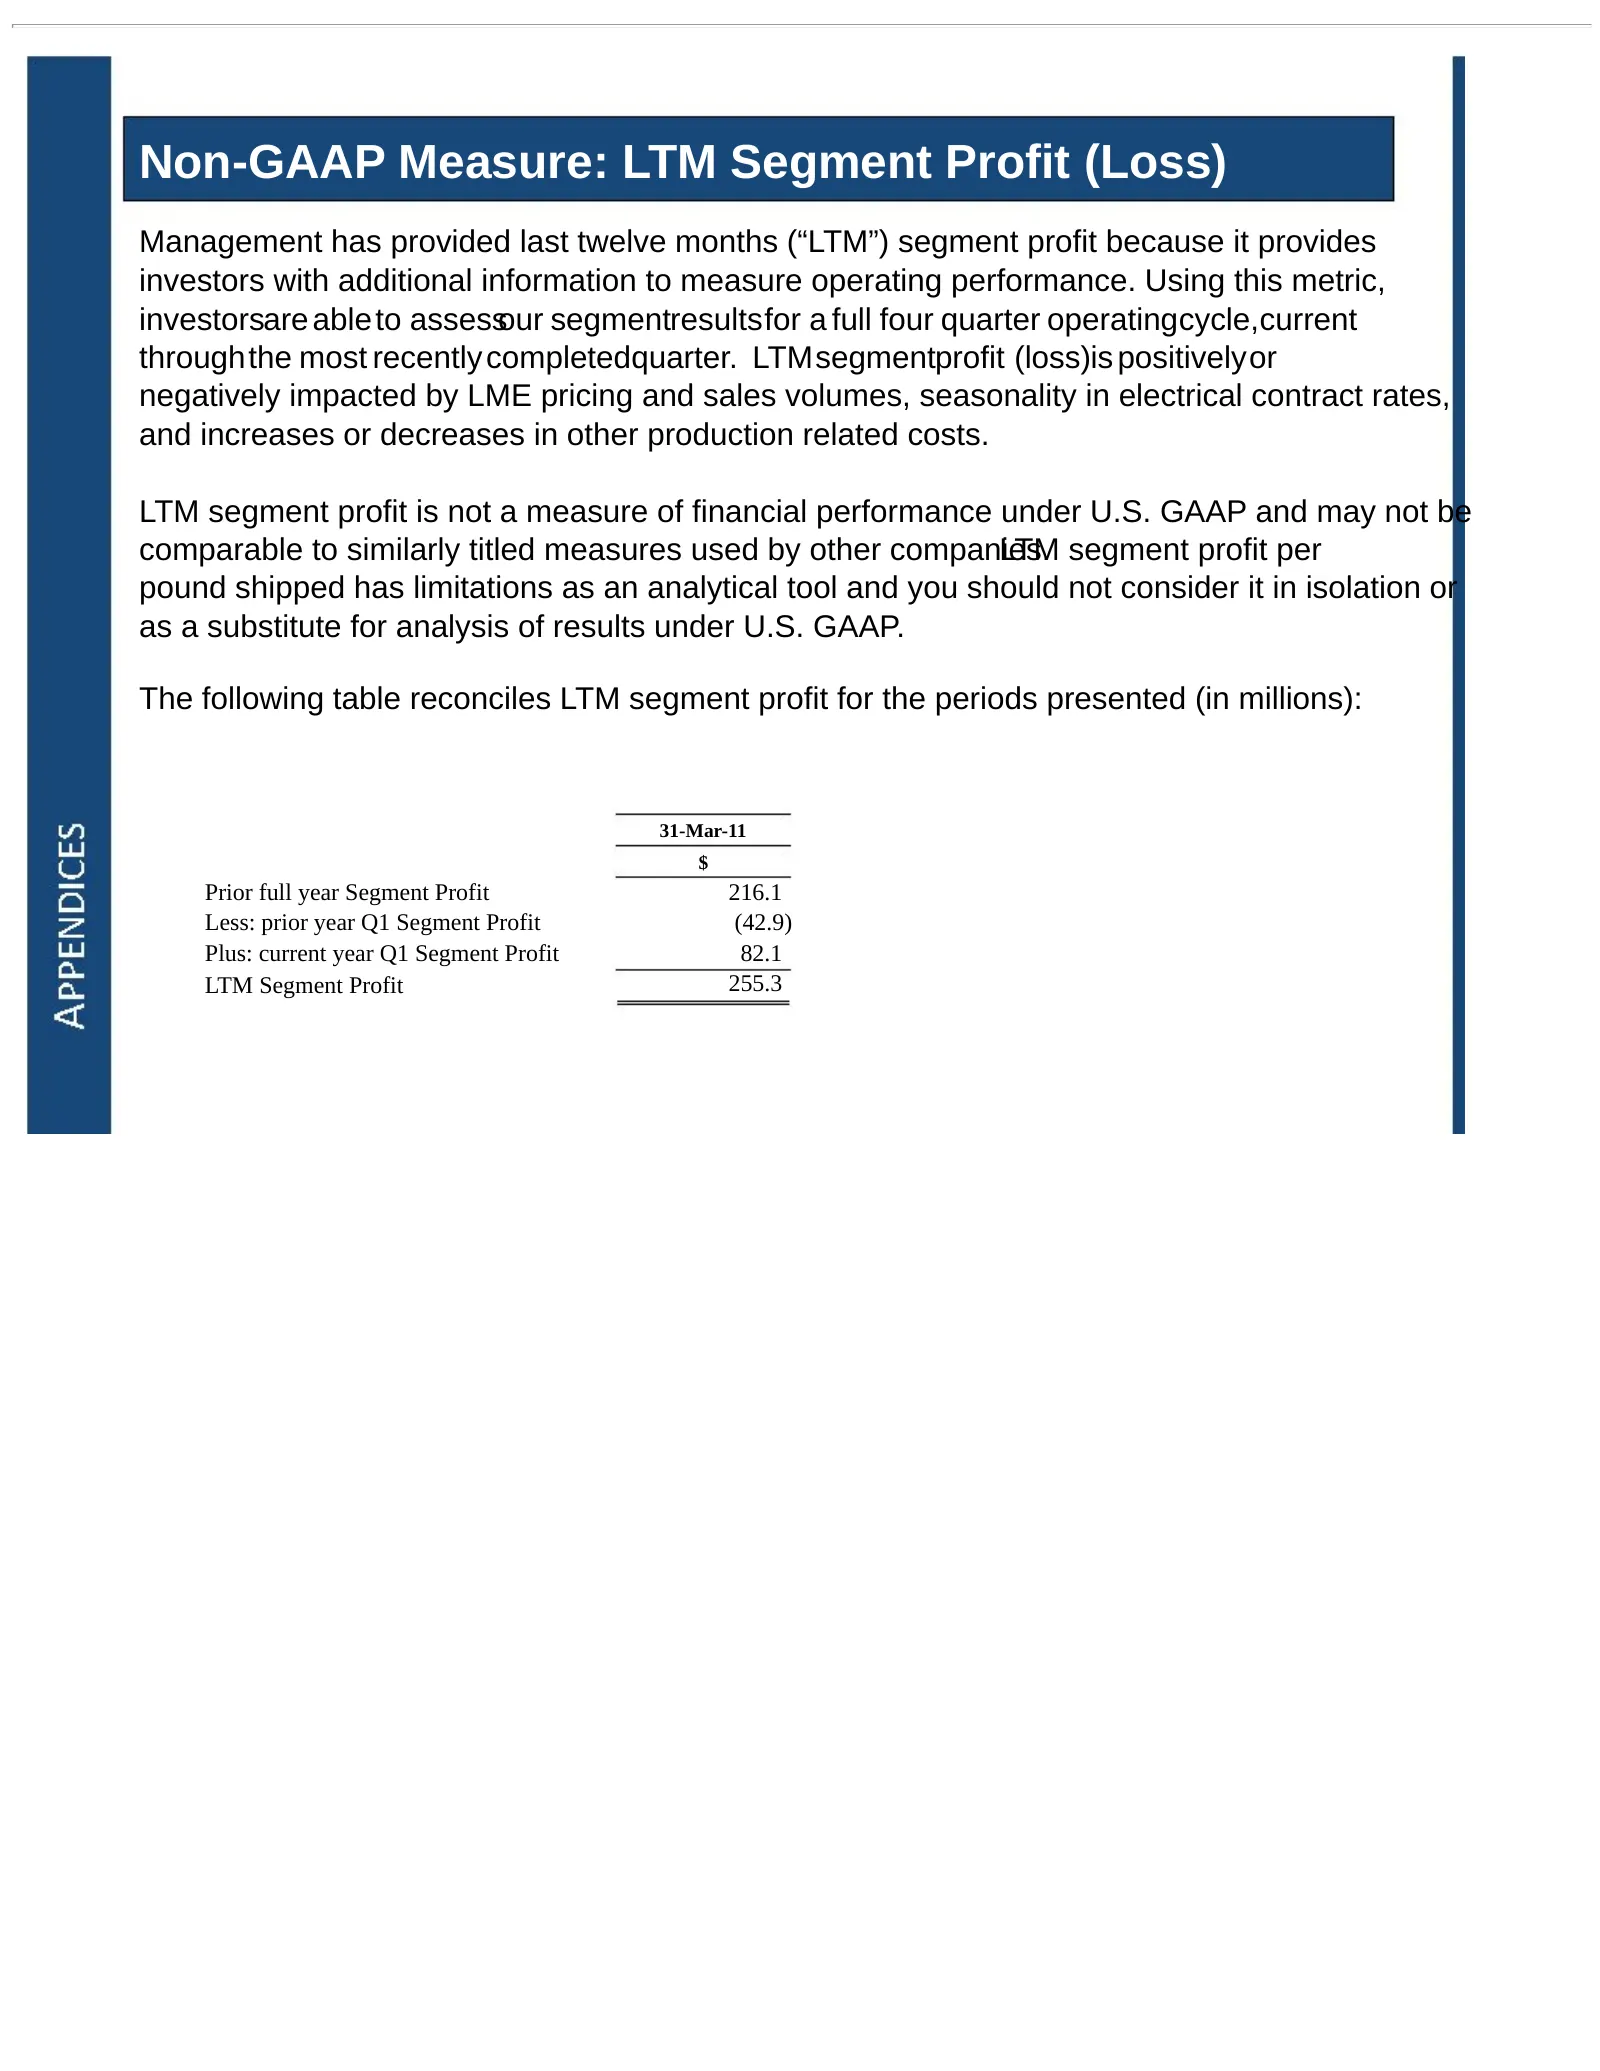
Non-GAAP Measure: LTM Segment Profit (Loss) Management has provided last twelve months (“LTM”) segment profit because it provides investors with additional information to measure operating performance. Using this metric, investorsare able to assessour segmentresultsfor a full four quarter operatingc
Slide 25: Non-GAAP Measure: LTM Segment Profit (Loss) (Cont'd)
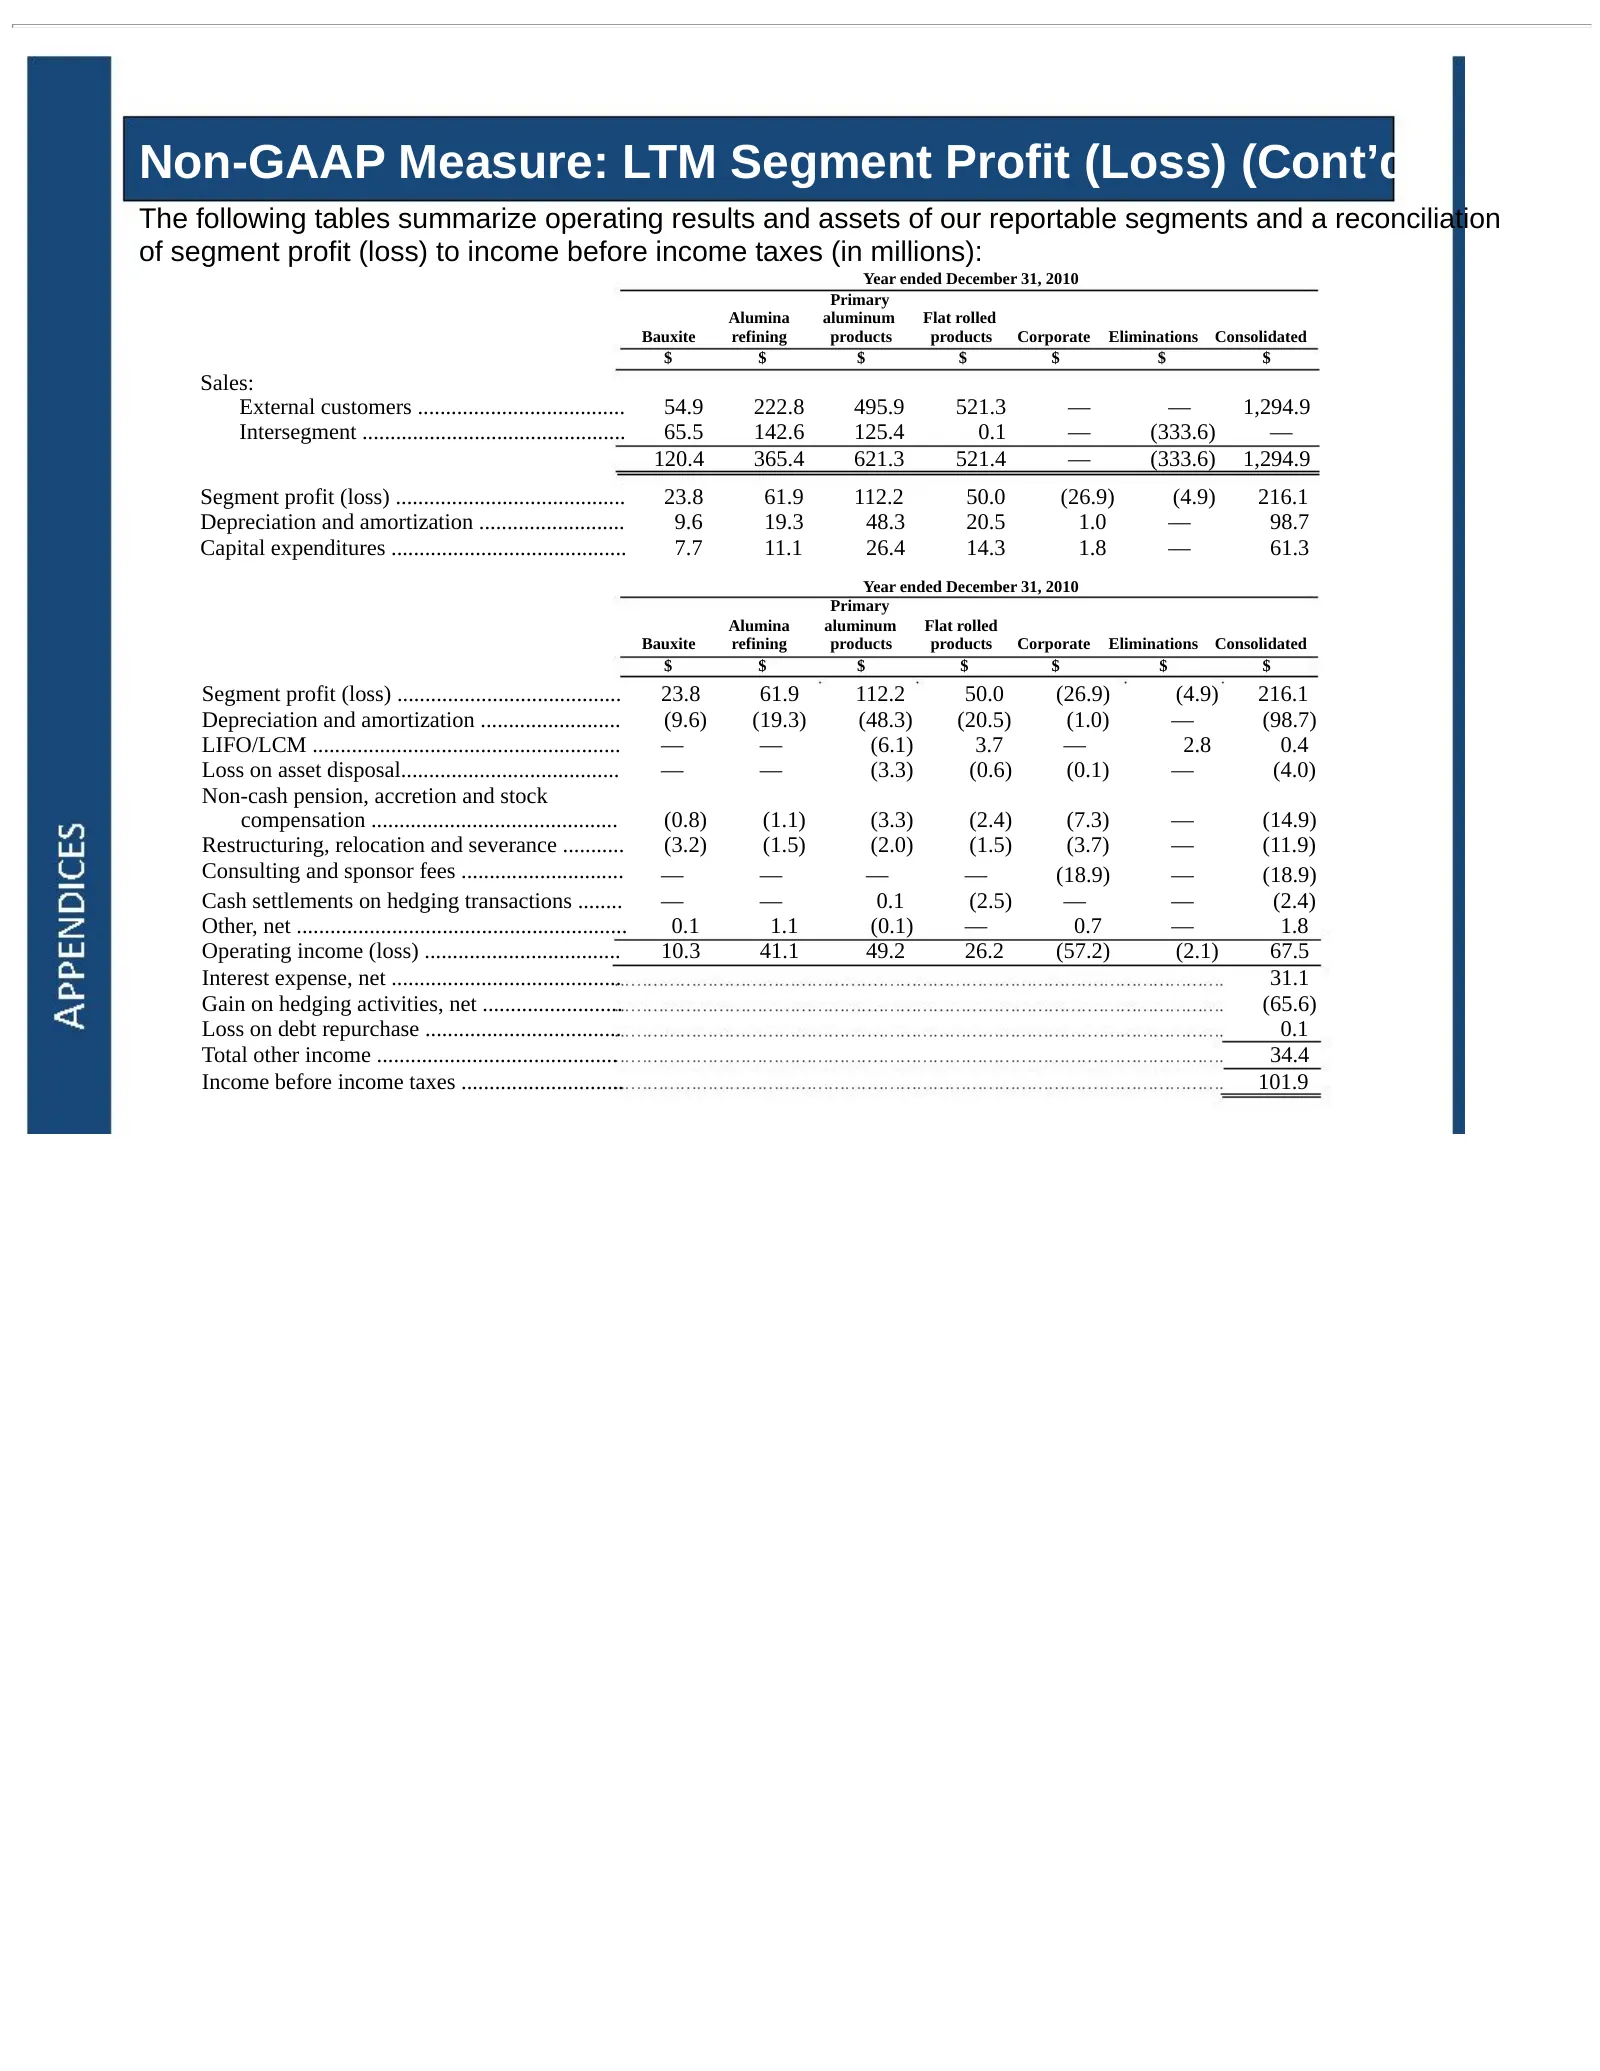
Non-GAAP Measure: LTM Segment Profit (Loss) (Cont’d) The following tables summarize operating results and assets of our reportable segments and a reconciliation of segment profit (loss) to income before income taxes (in millions): Year ended December 31, 2010 Primary Alumina aluminum Flat rolled Bau
Slide 26: Non-GAAP Measure: LTM Segment Profit (Loss) (Cont'd)
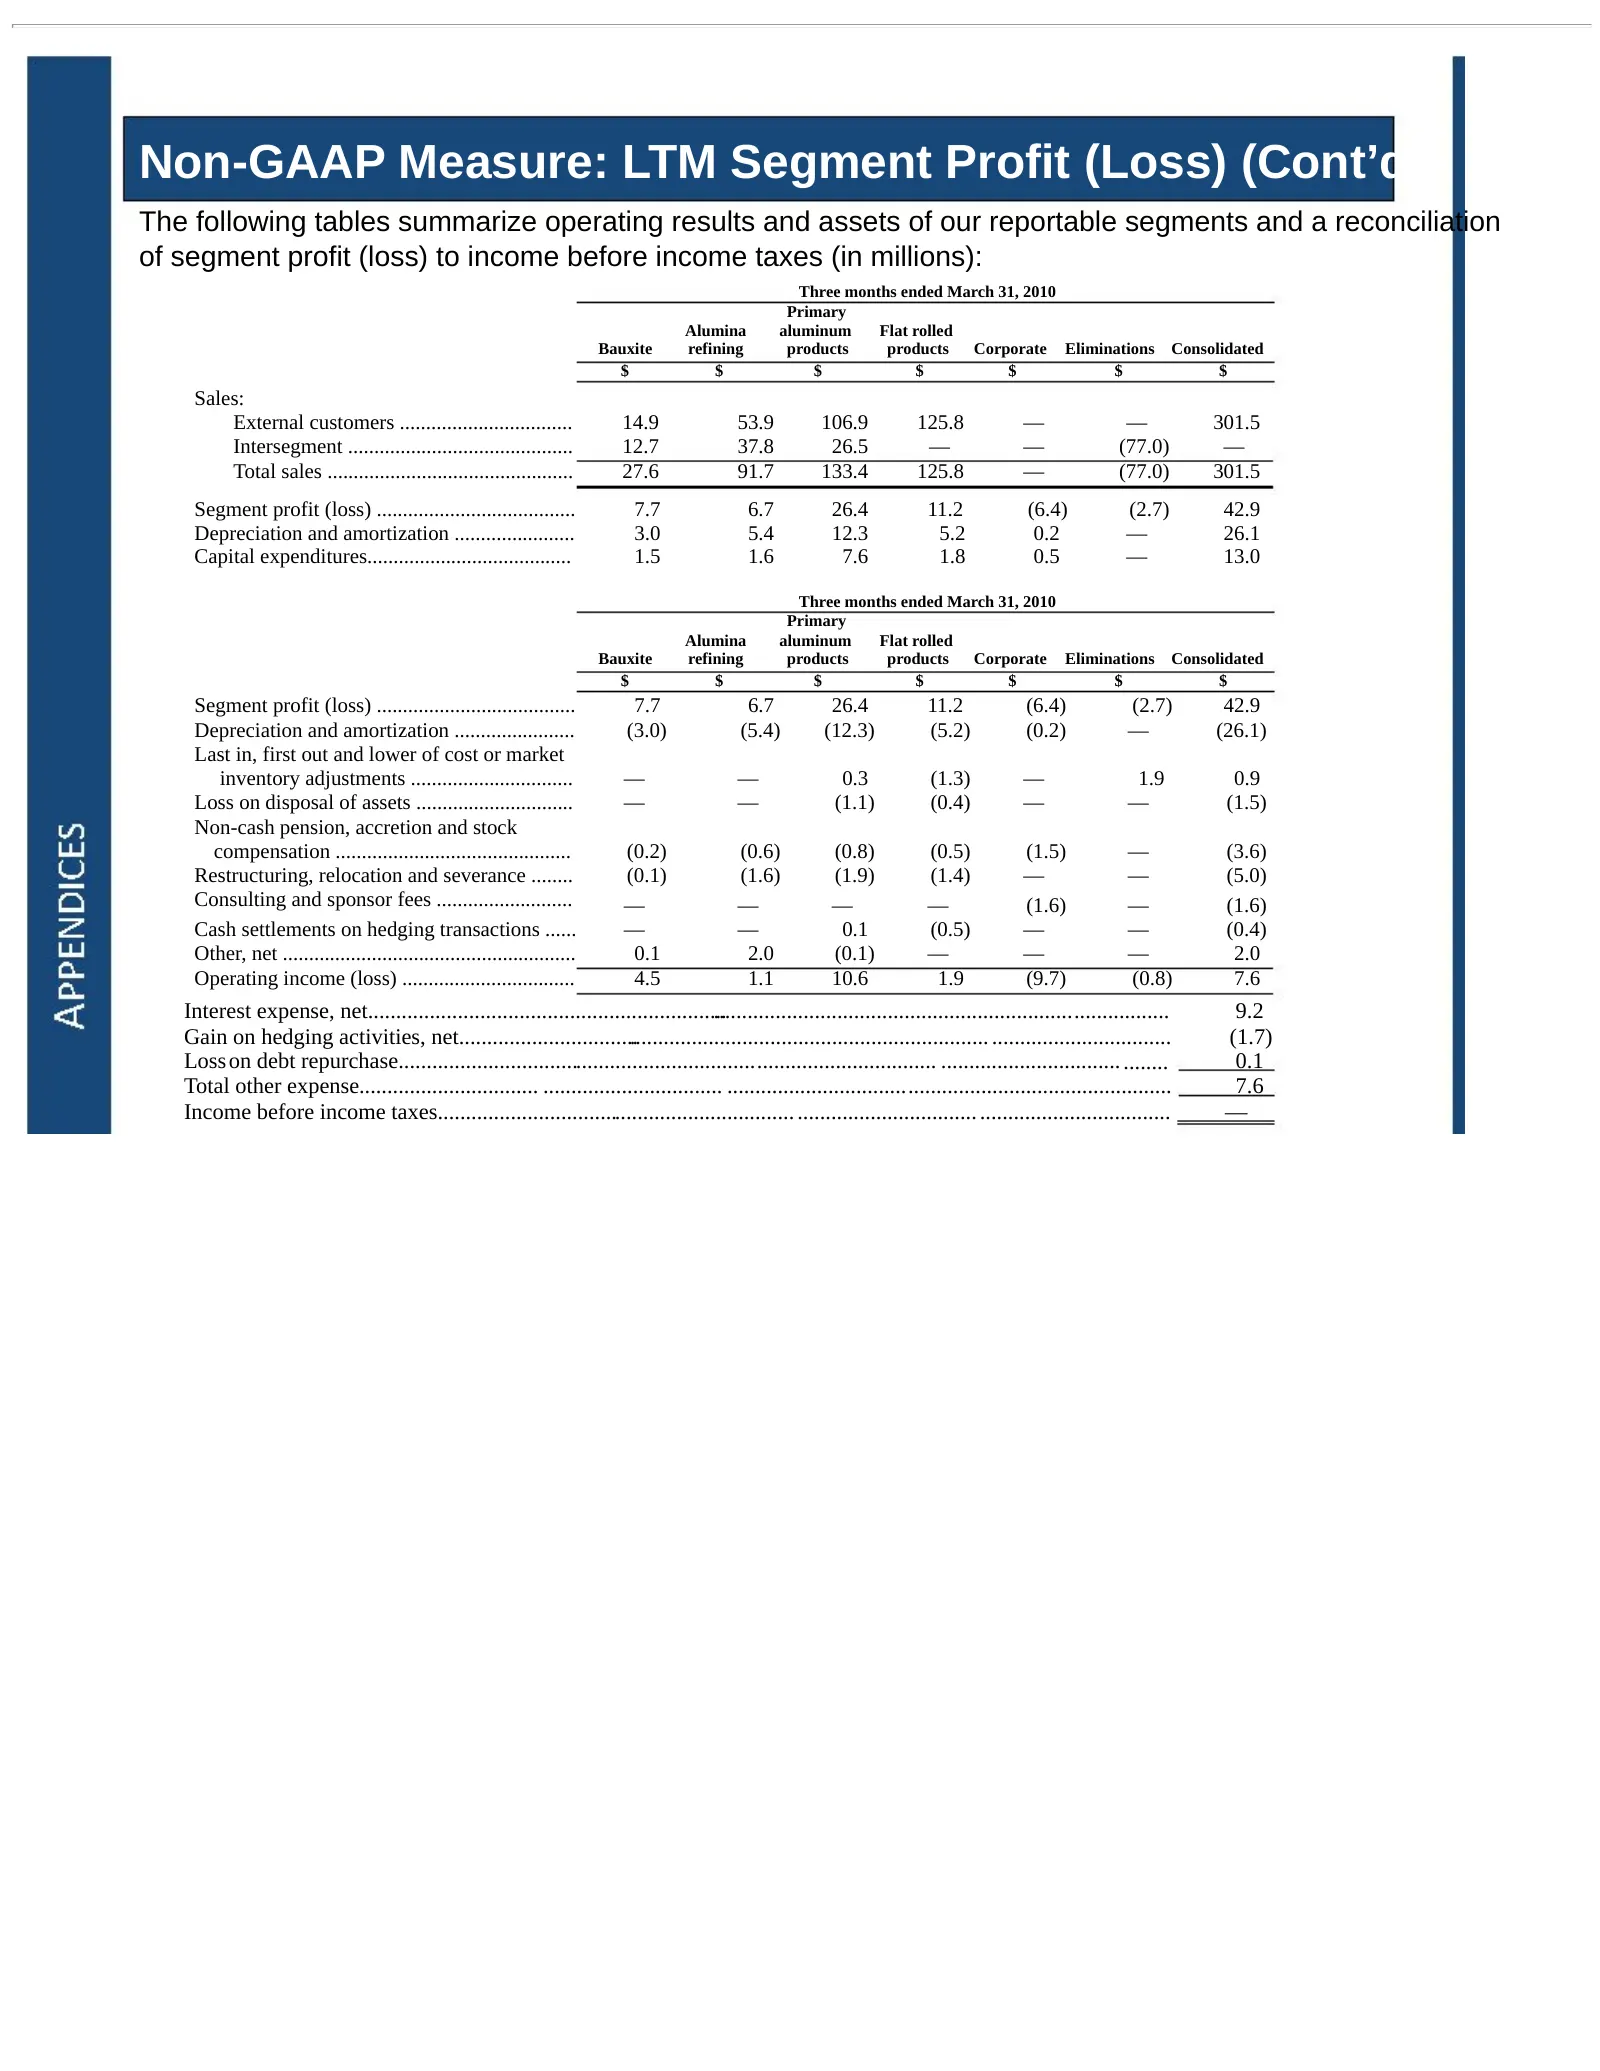
Non-GAAP Measure: LTM Segment Profit (Loss) (Cont’d) The following tables summarize operating results and assets of our reportable segments and a reconciliation of segment profit (loss) to income before income taxes (in millions): Three months ended March 31, 2010 Primary Alumina aluminum Flat rolle
Slide 27: Non-GAAP Measure: LTM Segment Profit (Loss) (Cont'd)
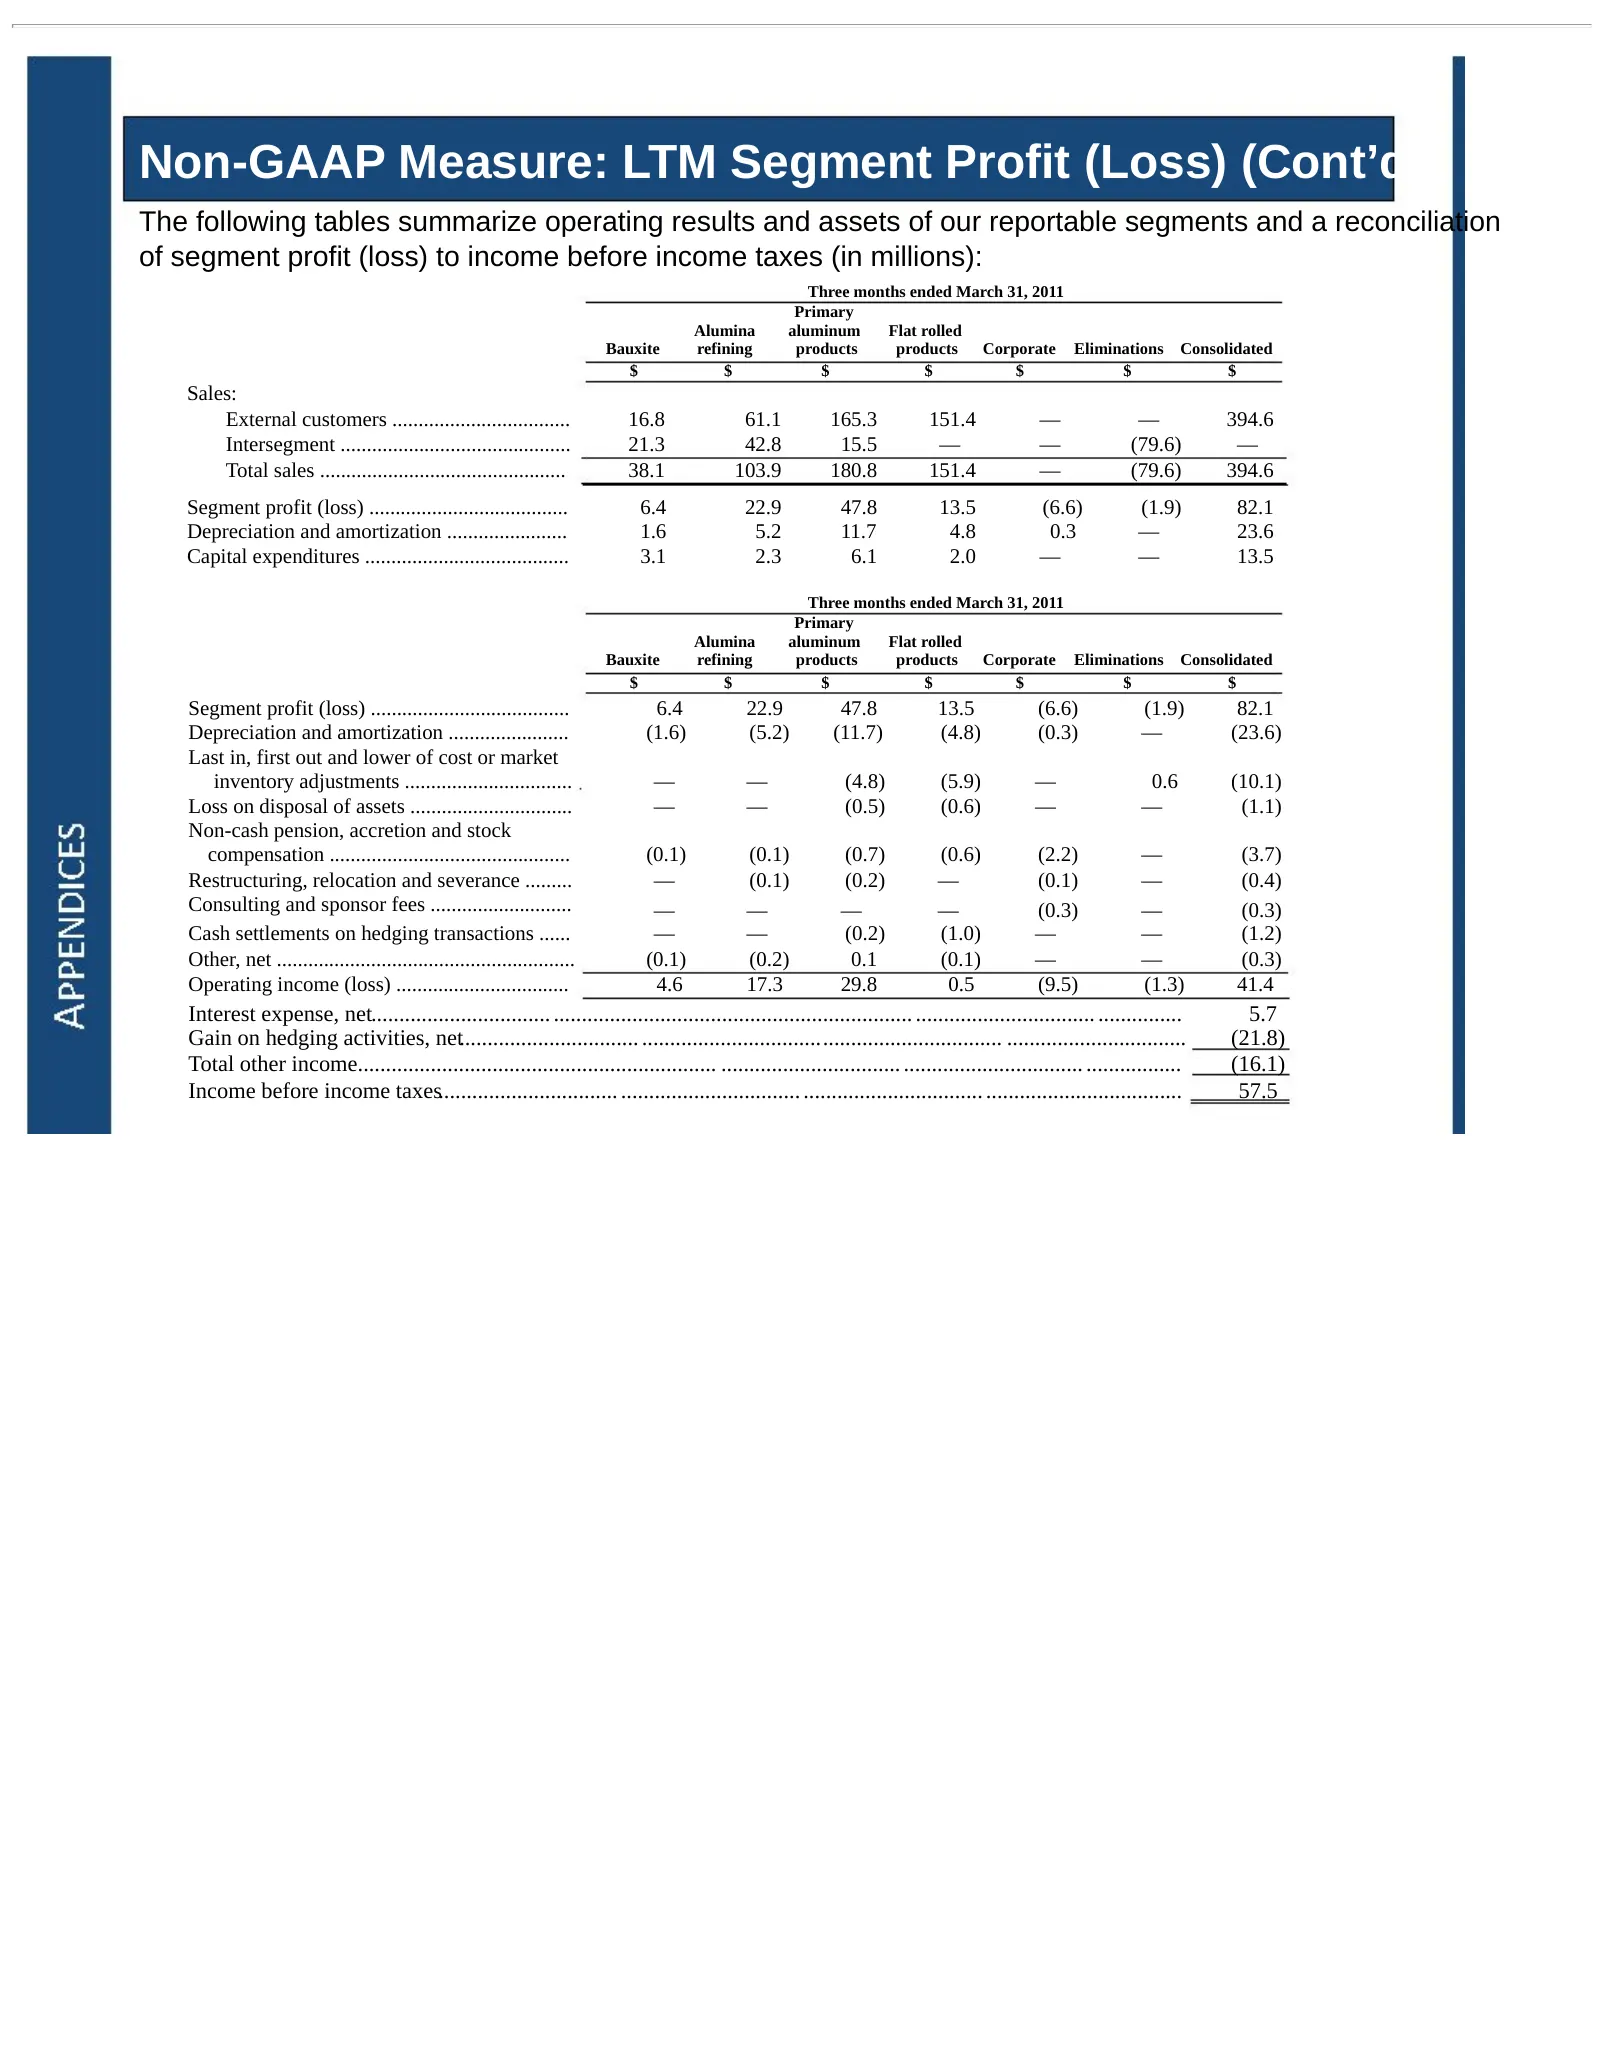
Non-GAAP Measure: LTM Segment Profit (Loss) (Cont’d) The following tables summarize operating results and assets of our reportable segments and a reconciliation of segment profit (loss) to income before income taxes (in millions): Three months ended March 31, 2011 Primary Alumina aluminum Flat rolle
Slide 28: Non-GAAP Measure: Adjusted EBITDA
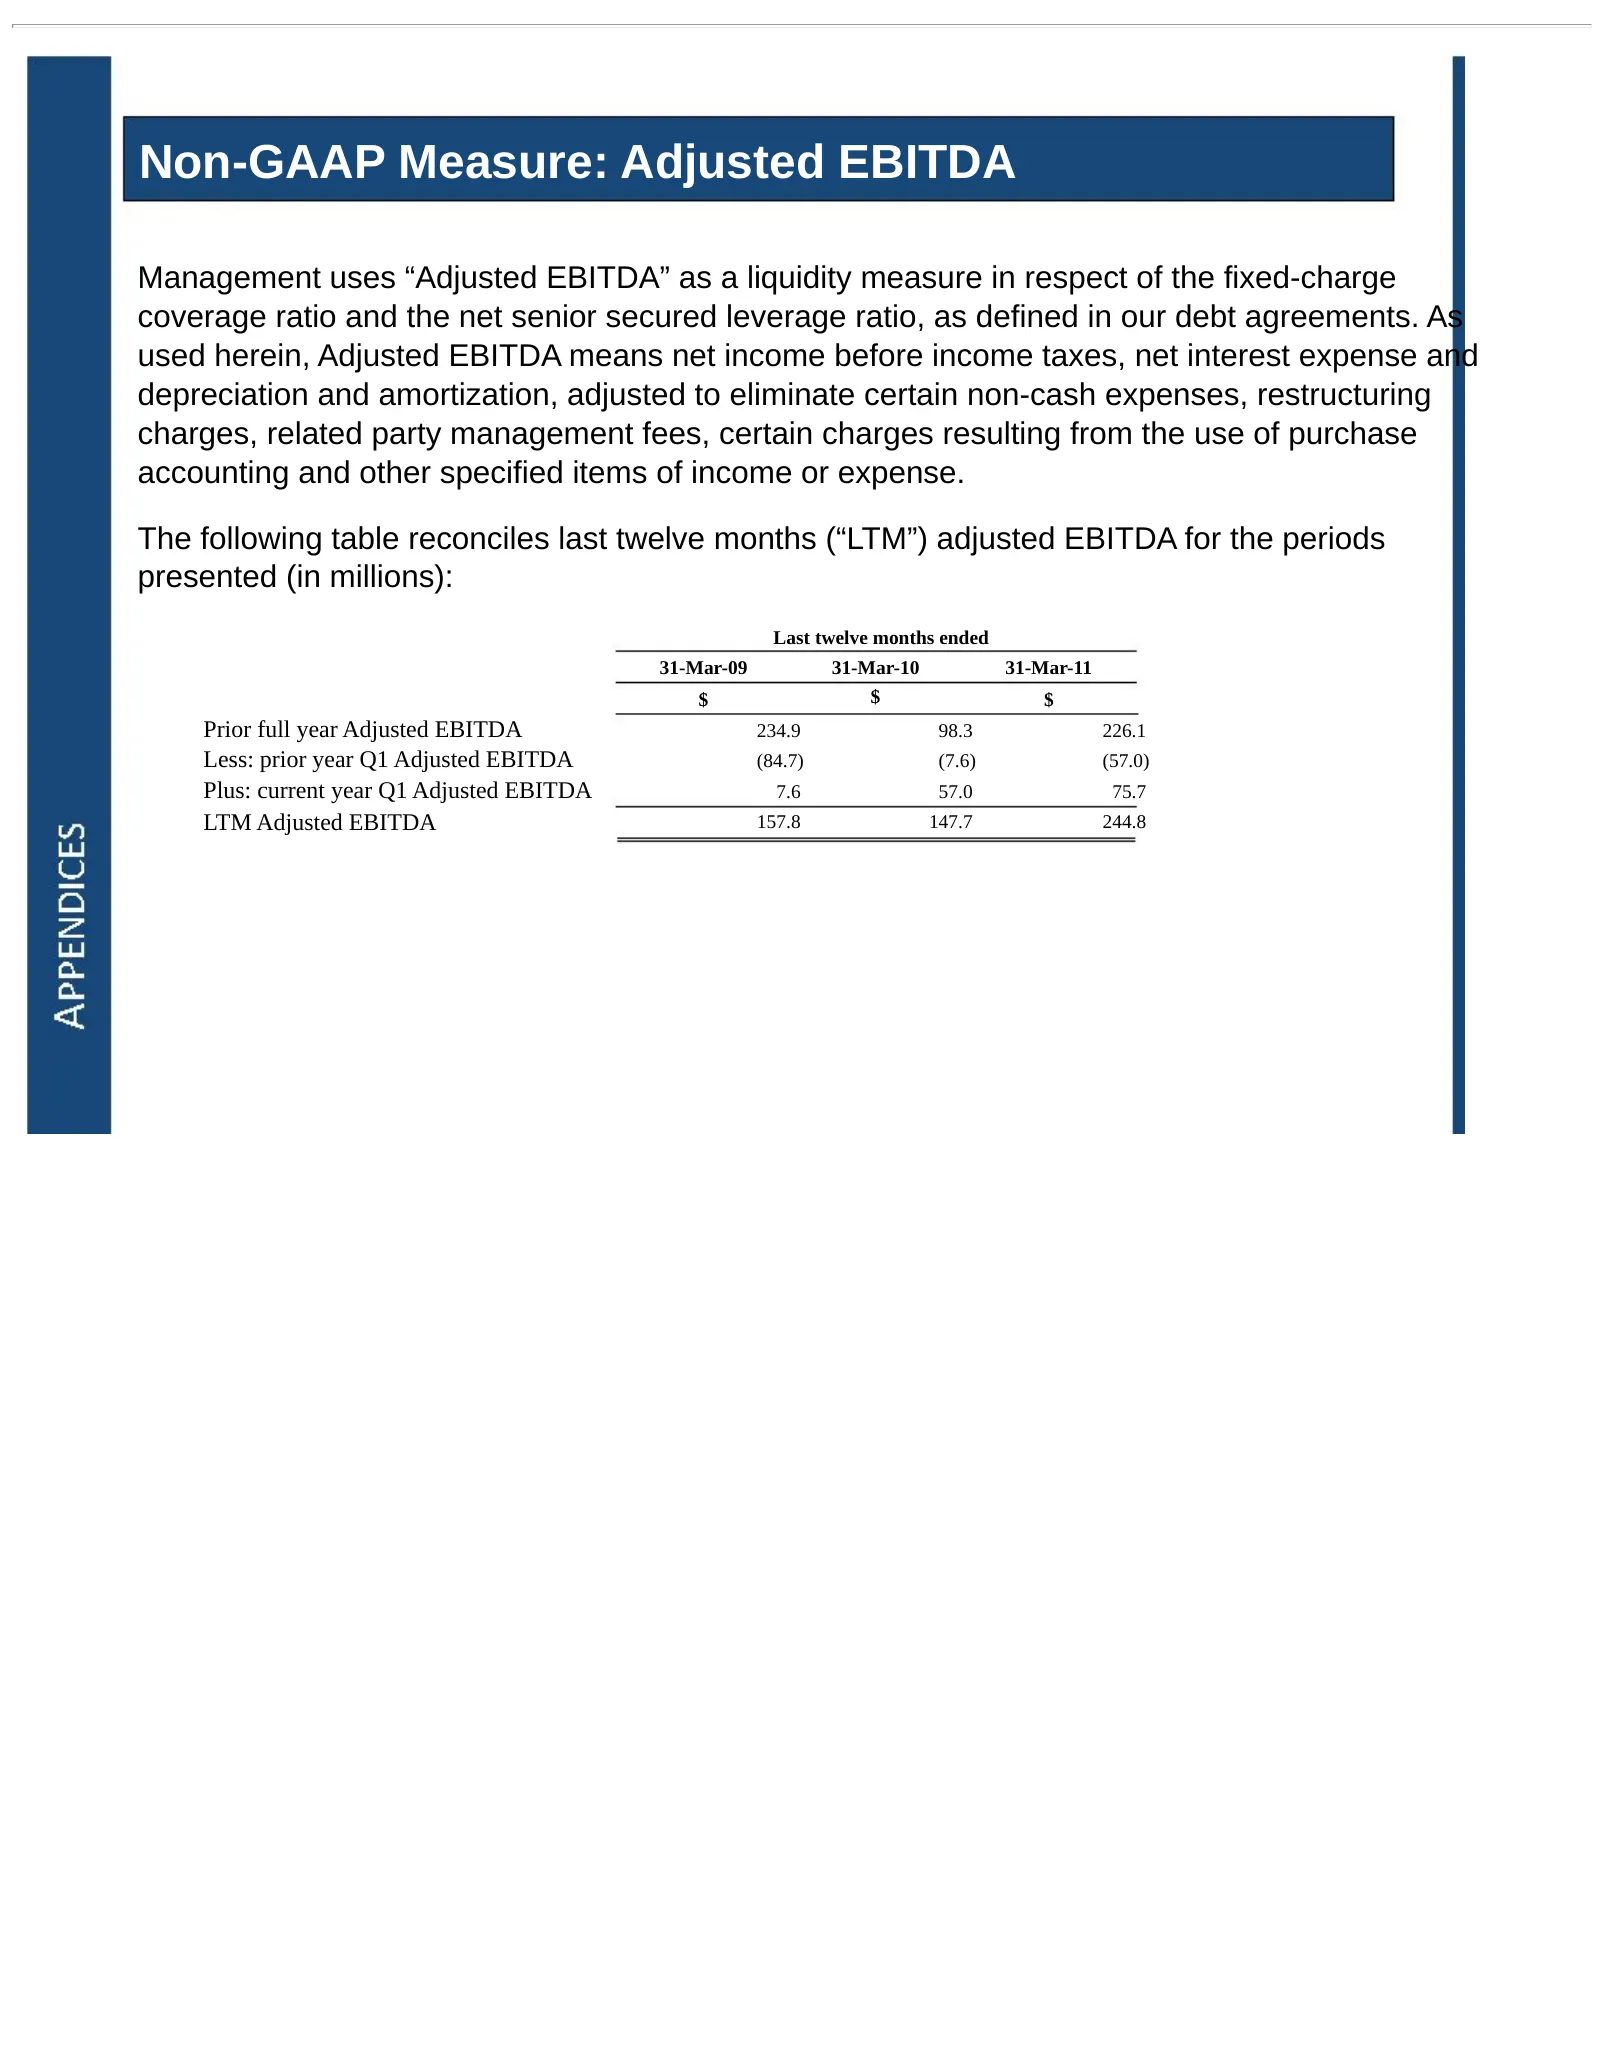
Non-GAAP Measure: Adjusted EBITDA Management uses “Adjusted EBITDA” as a liquidity measure in respect of the fixed-charge coverage ratio and the net senior secured leverage ratio, as defined in our debt agreements. As used herein, Adjusted EBITDA means net income before income taxes, net interest ex
Slide 29: Non-GAAP Measure: Adjusted EBITDA (Cont'd)
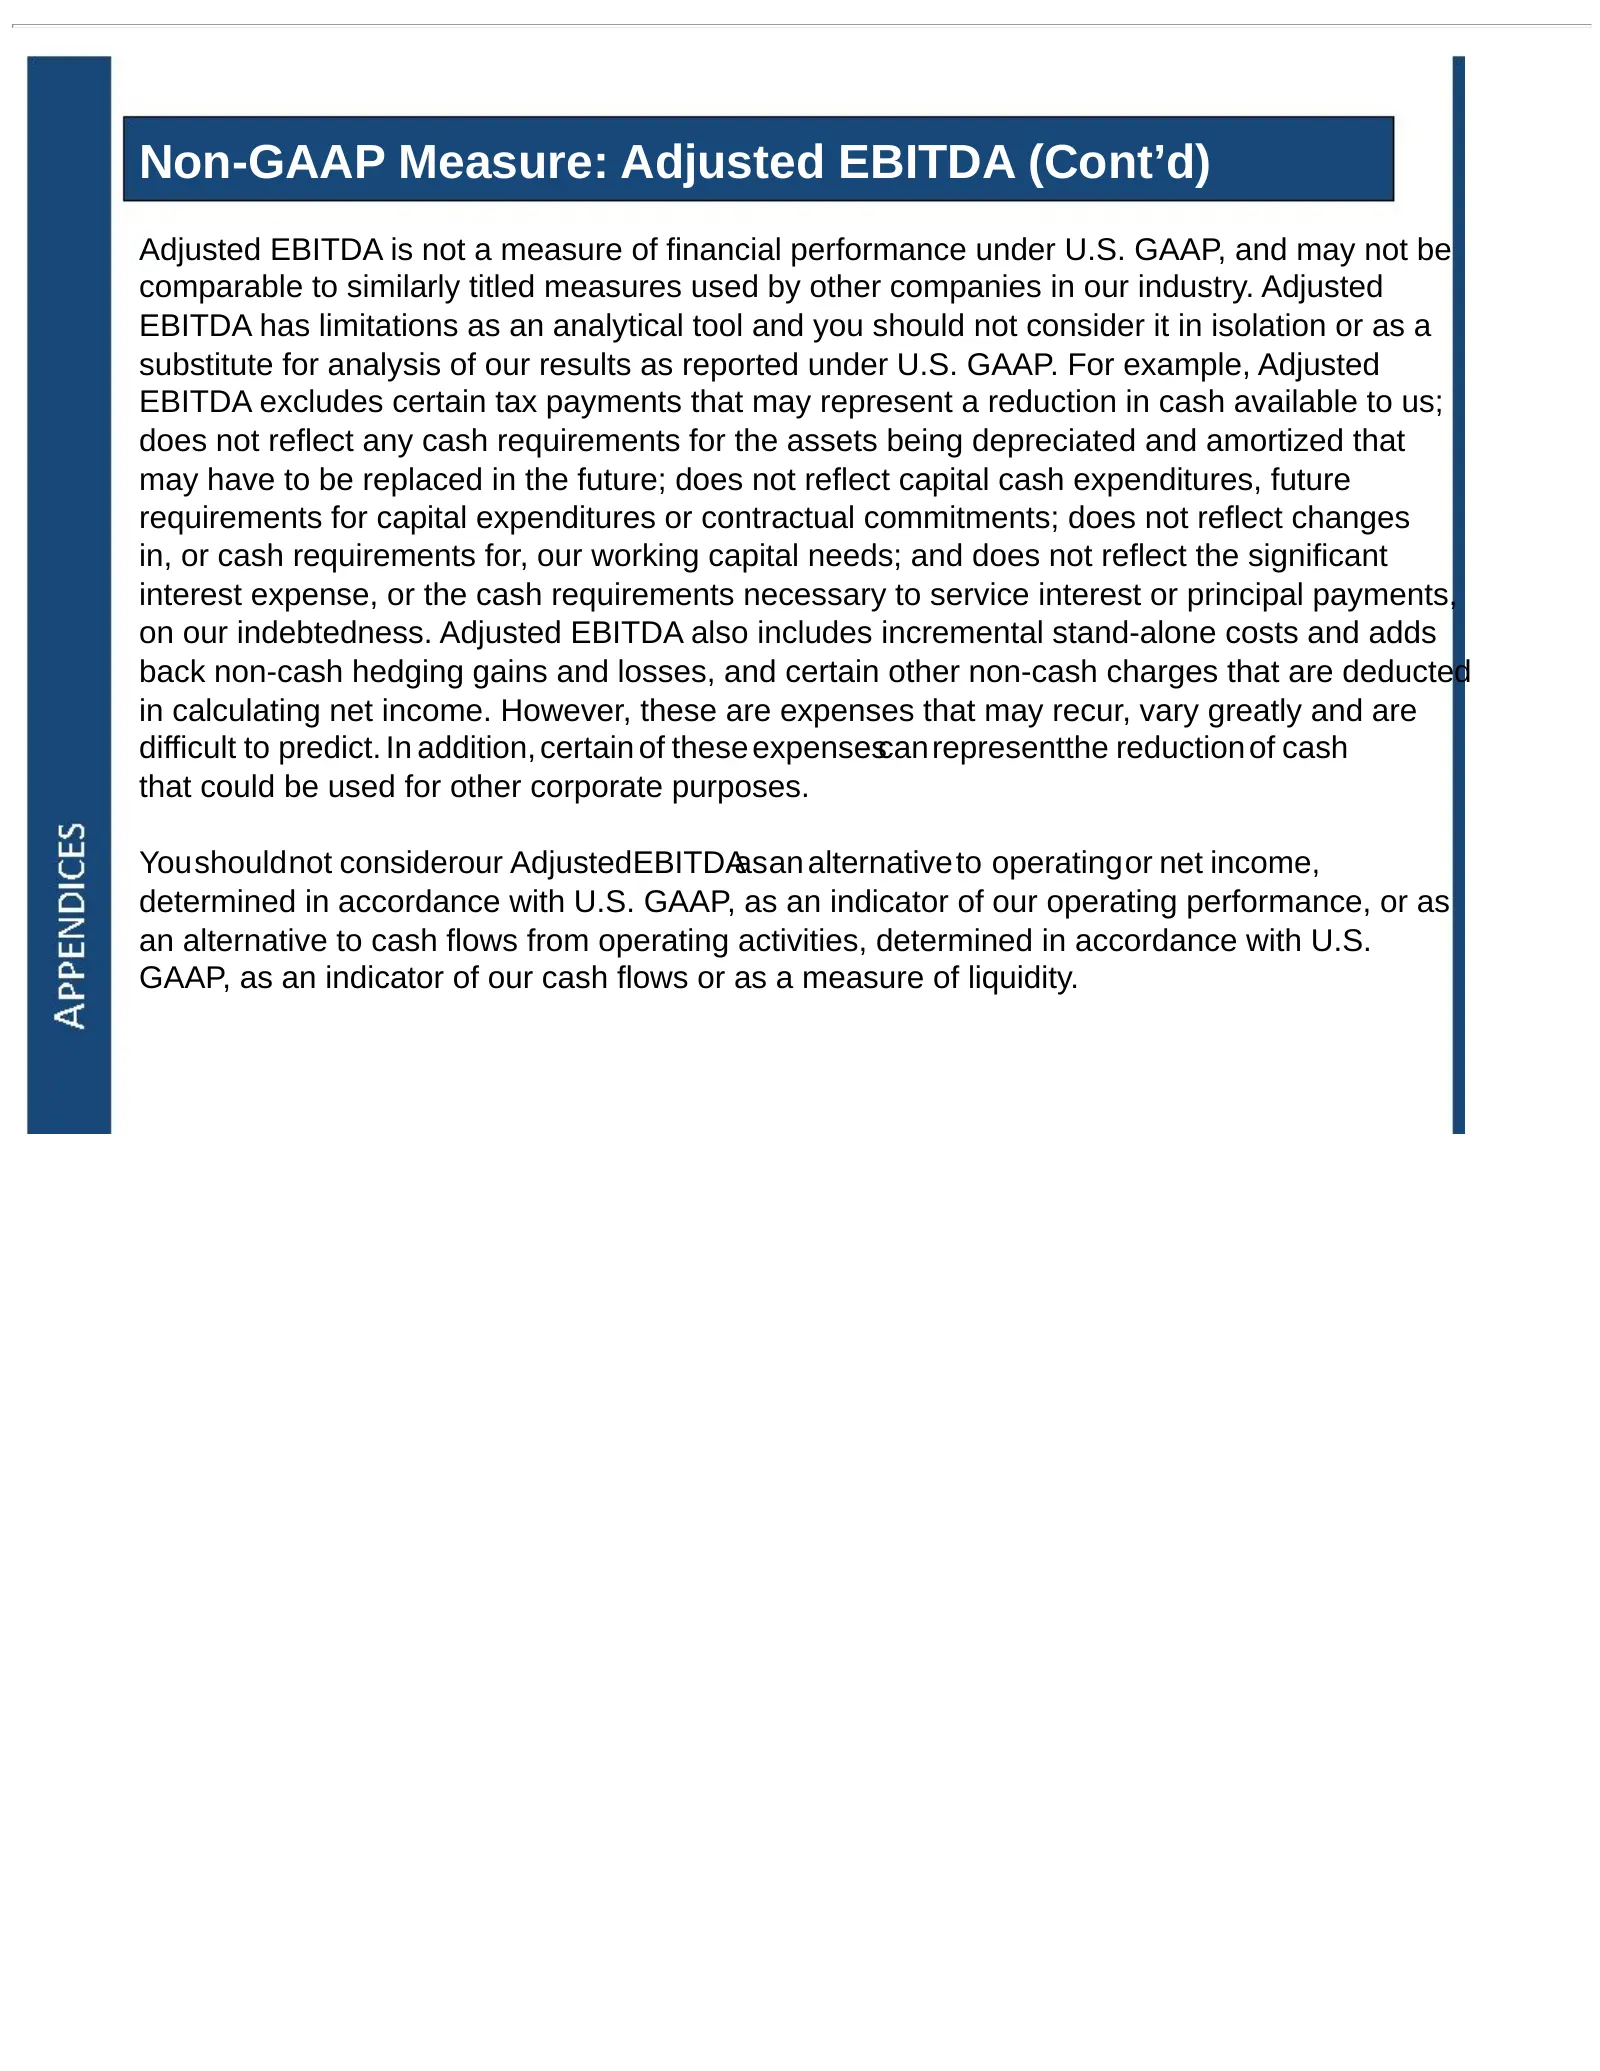
Non-GAAP Measure: Adjusted EBITDA (Cont’d) Adjusted EBITDA is not a measure of financial performance under U.S. GAAP, and may not be comparable to similarly titled measures used by other companies in our industry. Adjusted EBITDA has limitations as an analytical tool and you should not consider it i
Slide 30: Non-GAAP Measure: Adjusted EBITDA (Cont'd)
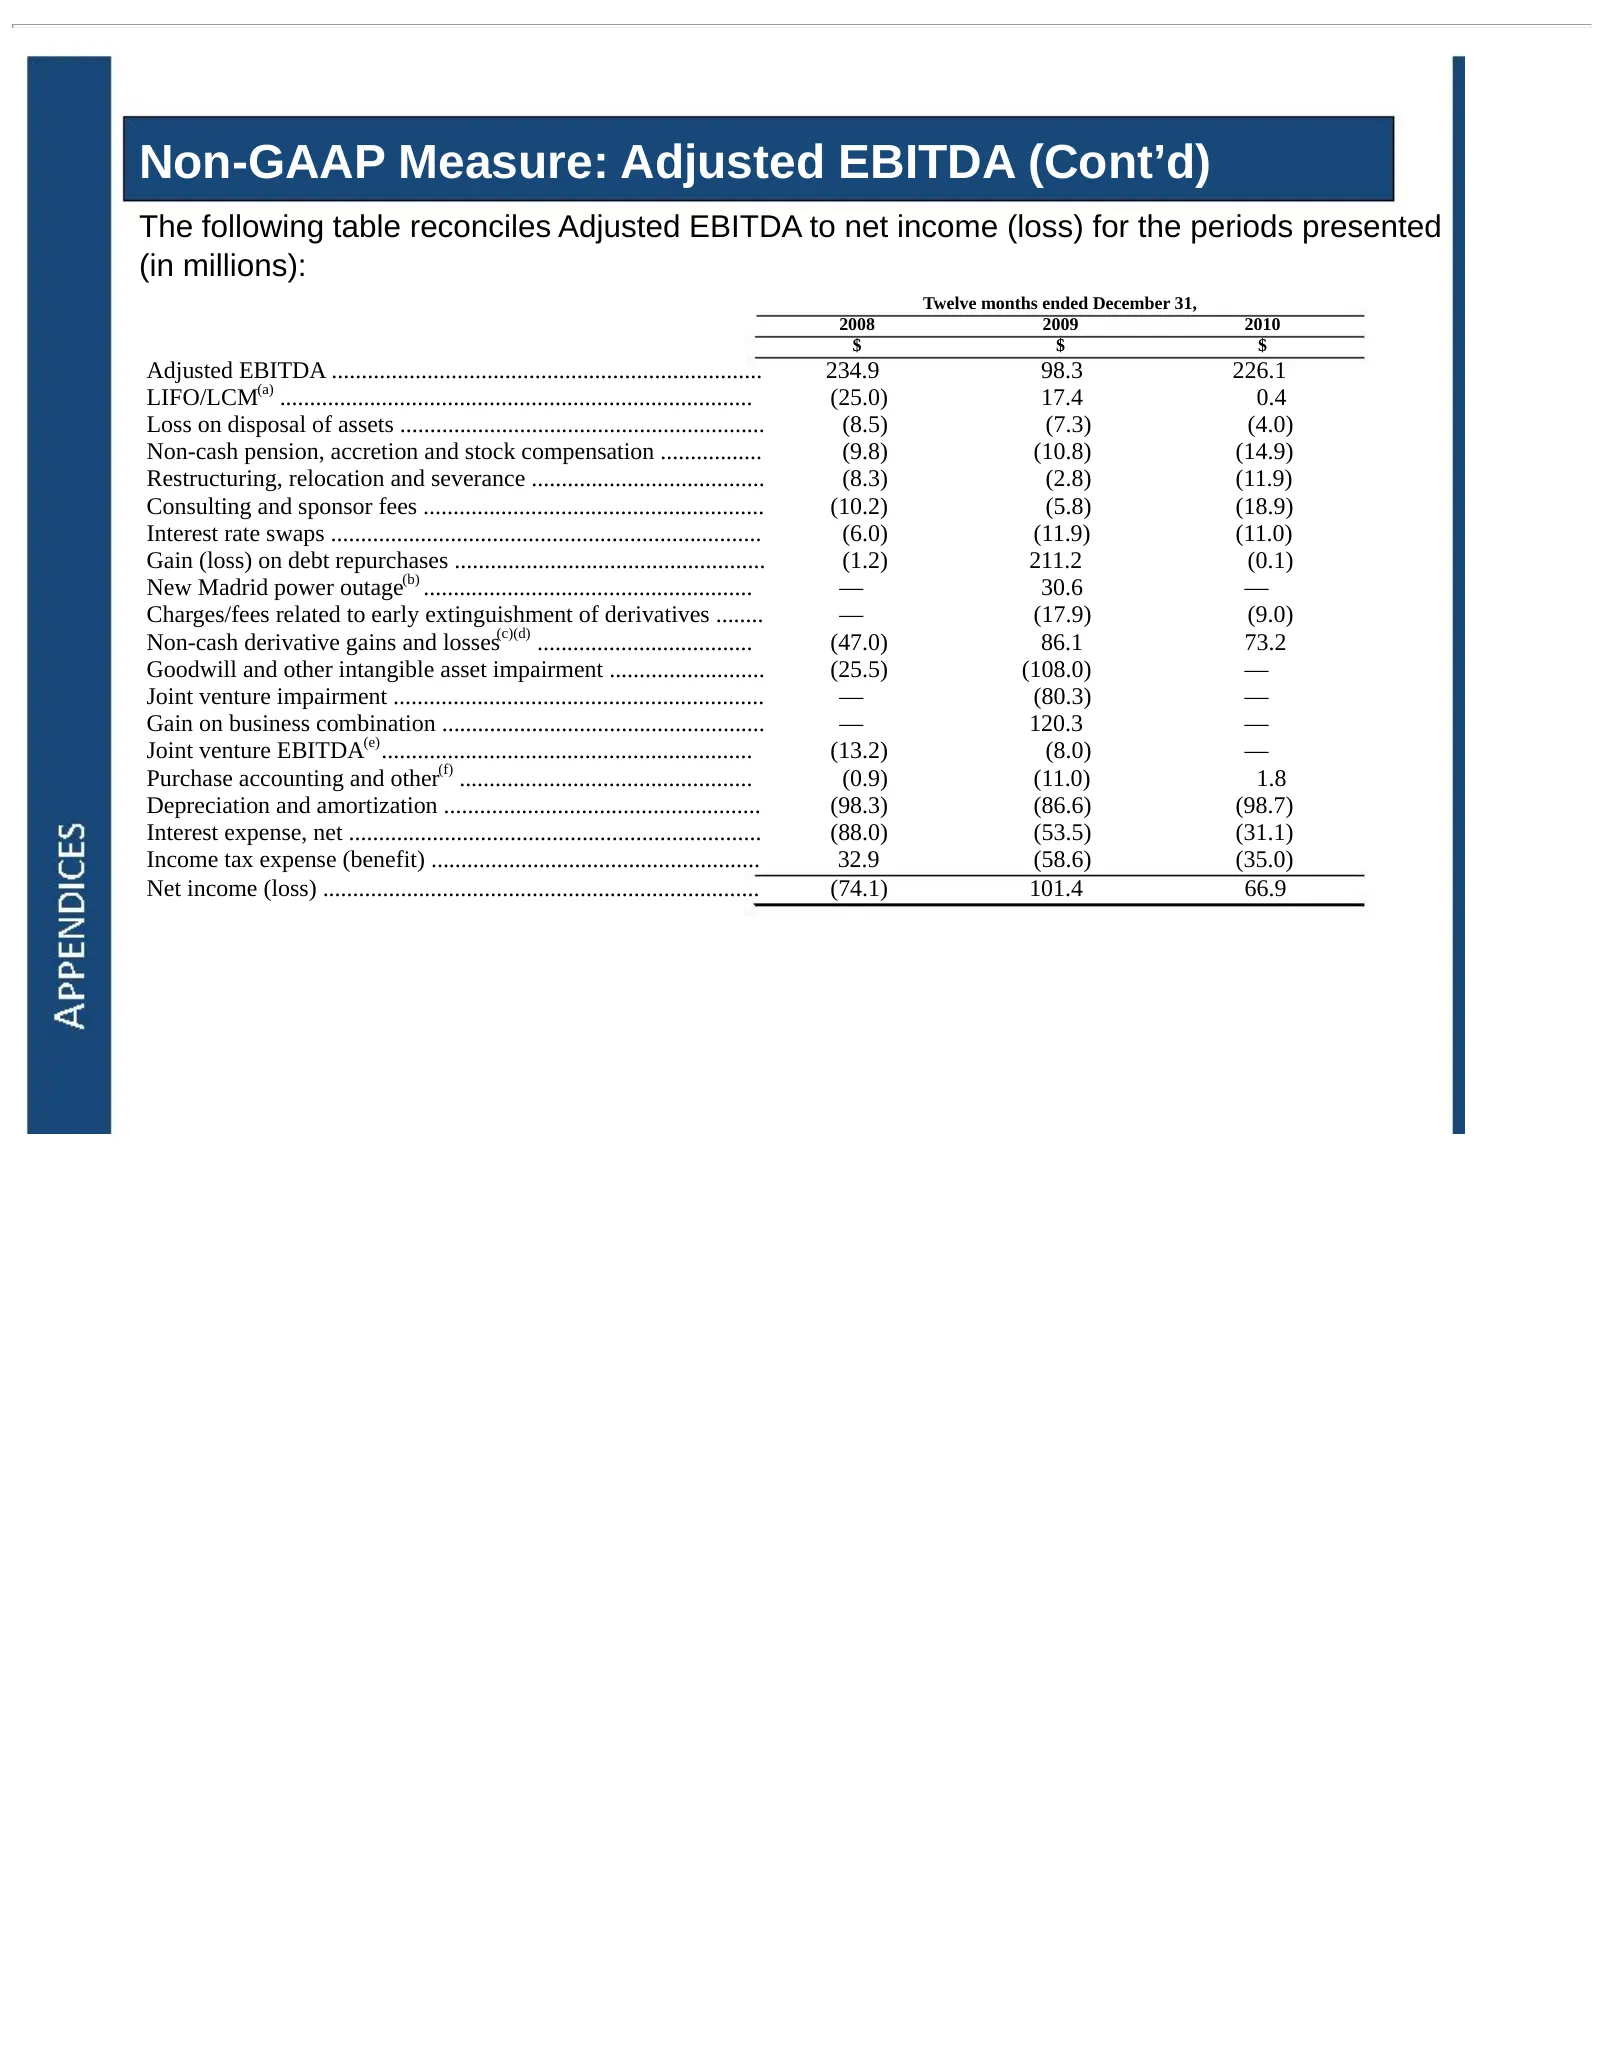
Non-GAAP Measure: Adjusted EBITDA (Cont’d) The following table reconciles Adjusted EBITDA to net income (loss) for the periods presented (in millions): Twelve months ended December 31, 2008 2009 2010 $ $ $ Adjusted EBITDA ........................................................................ 234.9
Slide 31: Non-GAAP Measure: Adjusted EBITDA (Cont'd)
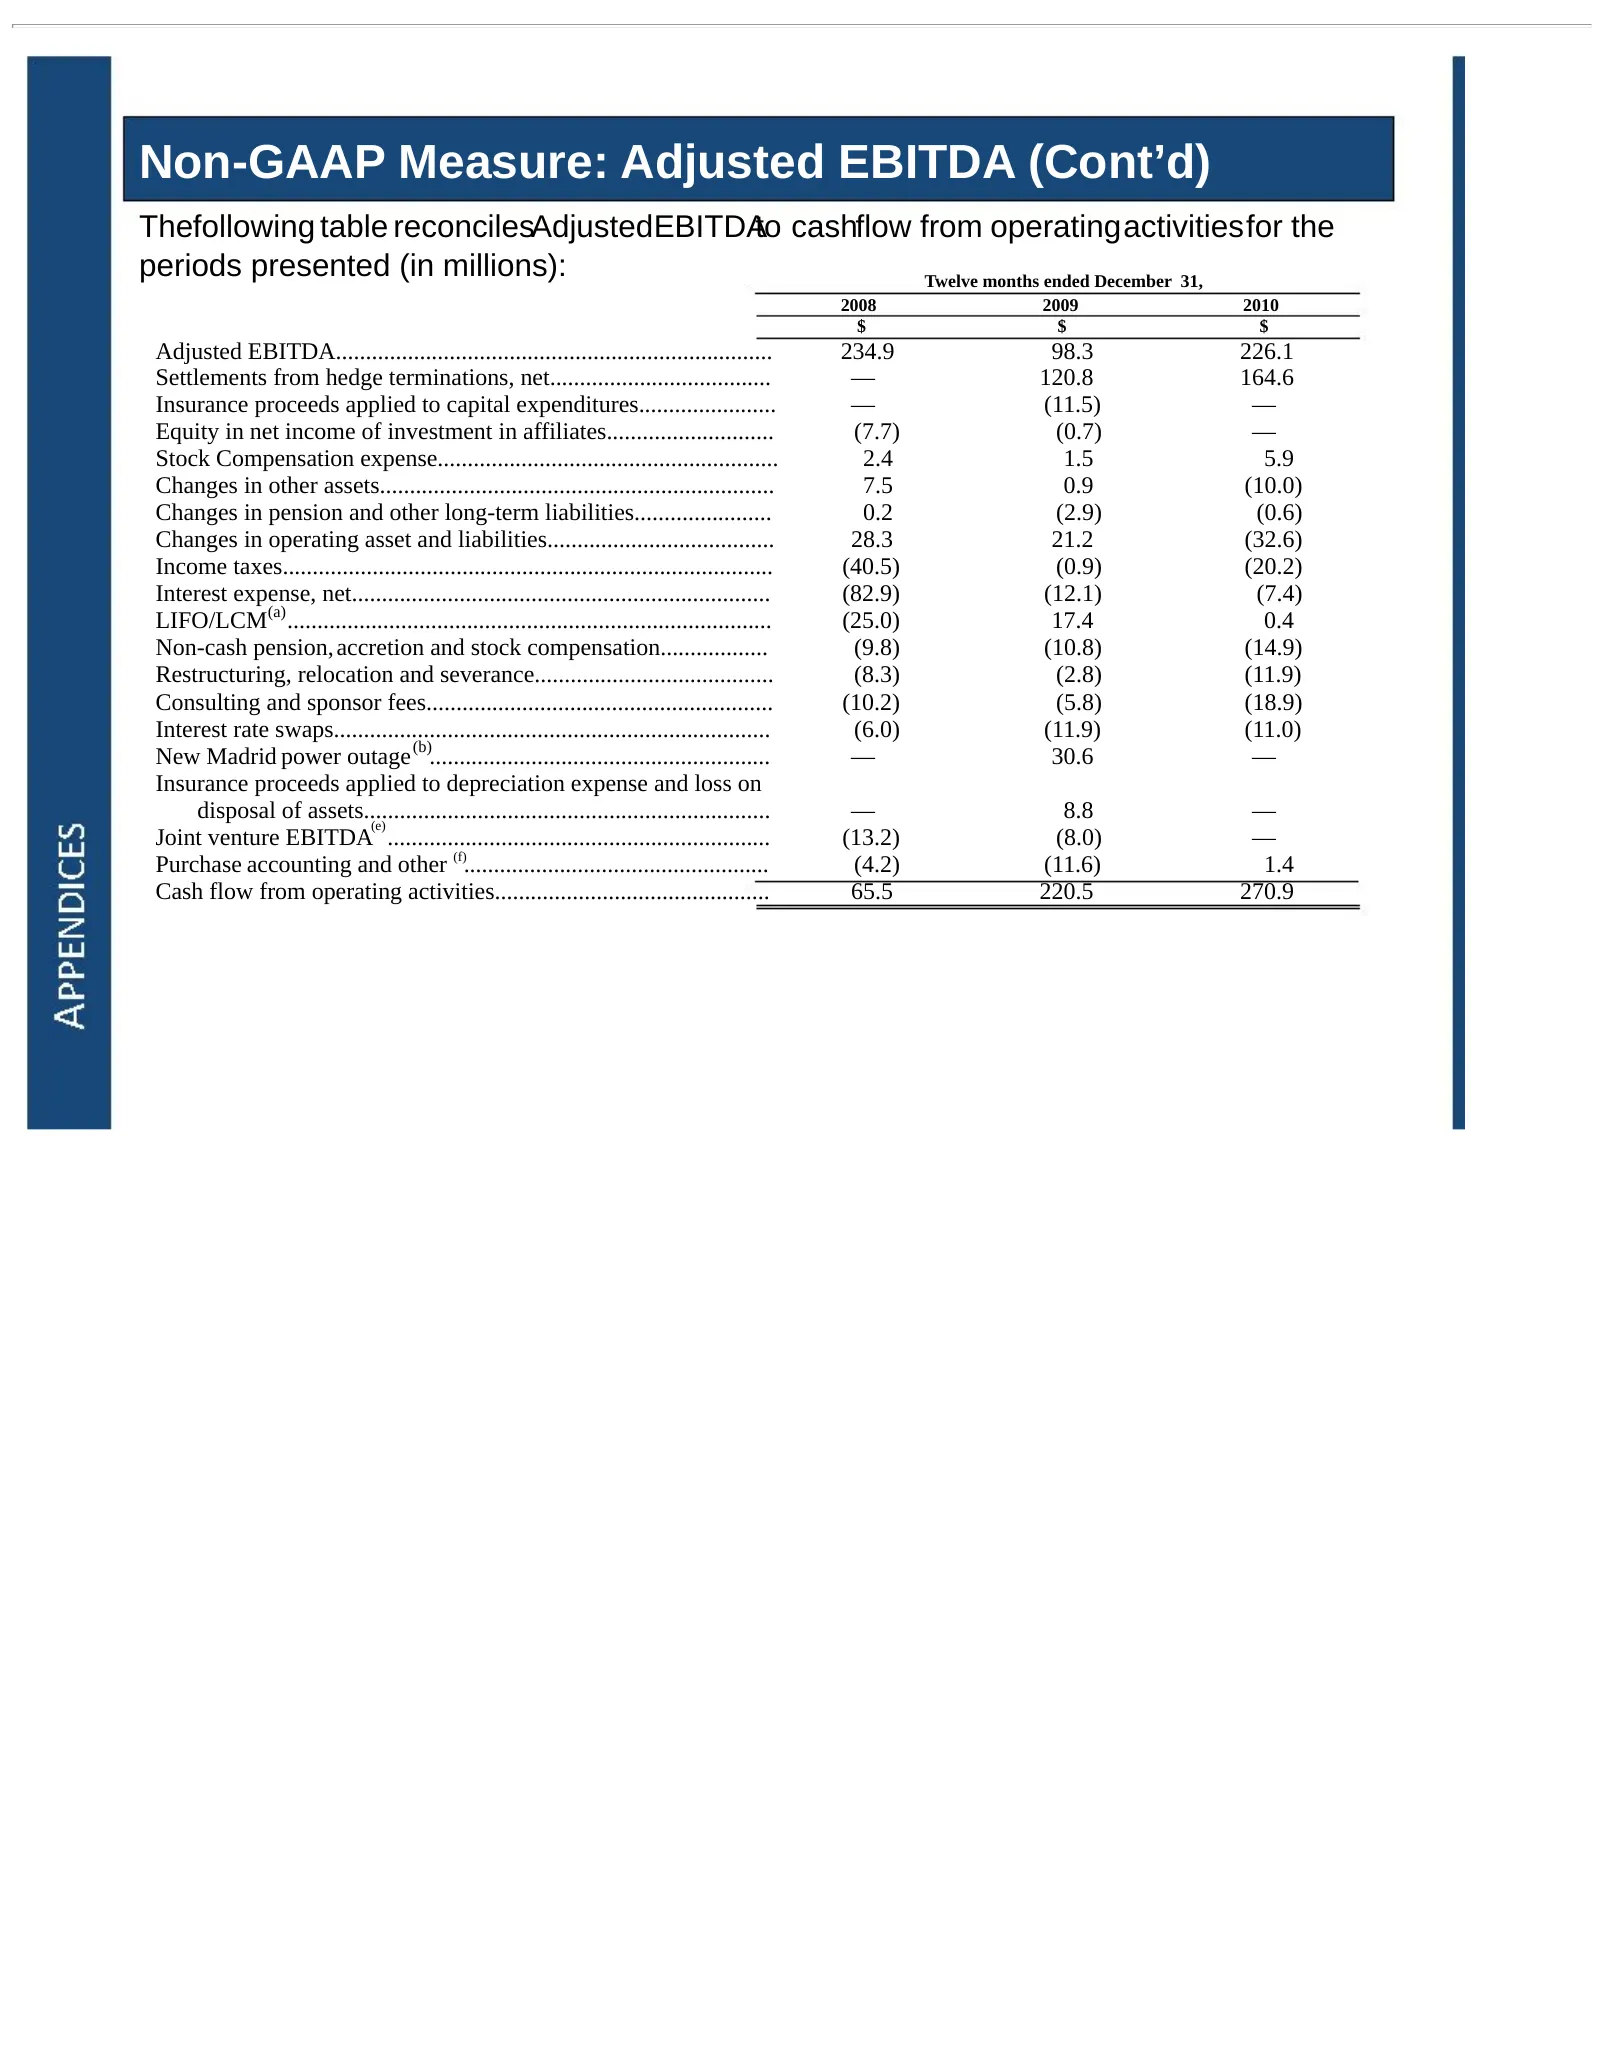
Non-GAAP Measure: Adjusted EBITDA (Cont’d) Thefollowing table reconcilesAdjustedEBITDAto cashflow from operatingactivitiesfor the periods presented (in millions): Twelve months ended December 31, 2008 2009 2010 $ $ $ Adjusted EBITDA....................................................................
Slide 32: Non-GAAP Measure: Adjusted EBITDA (Cont'd)
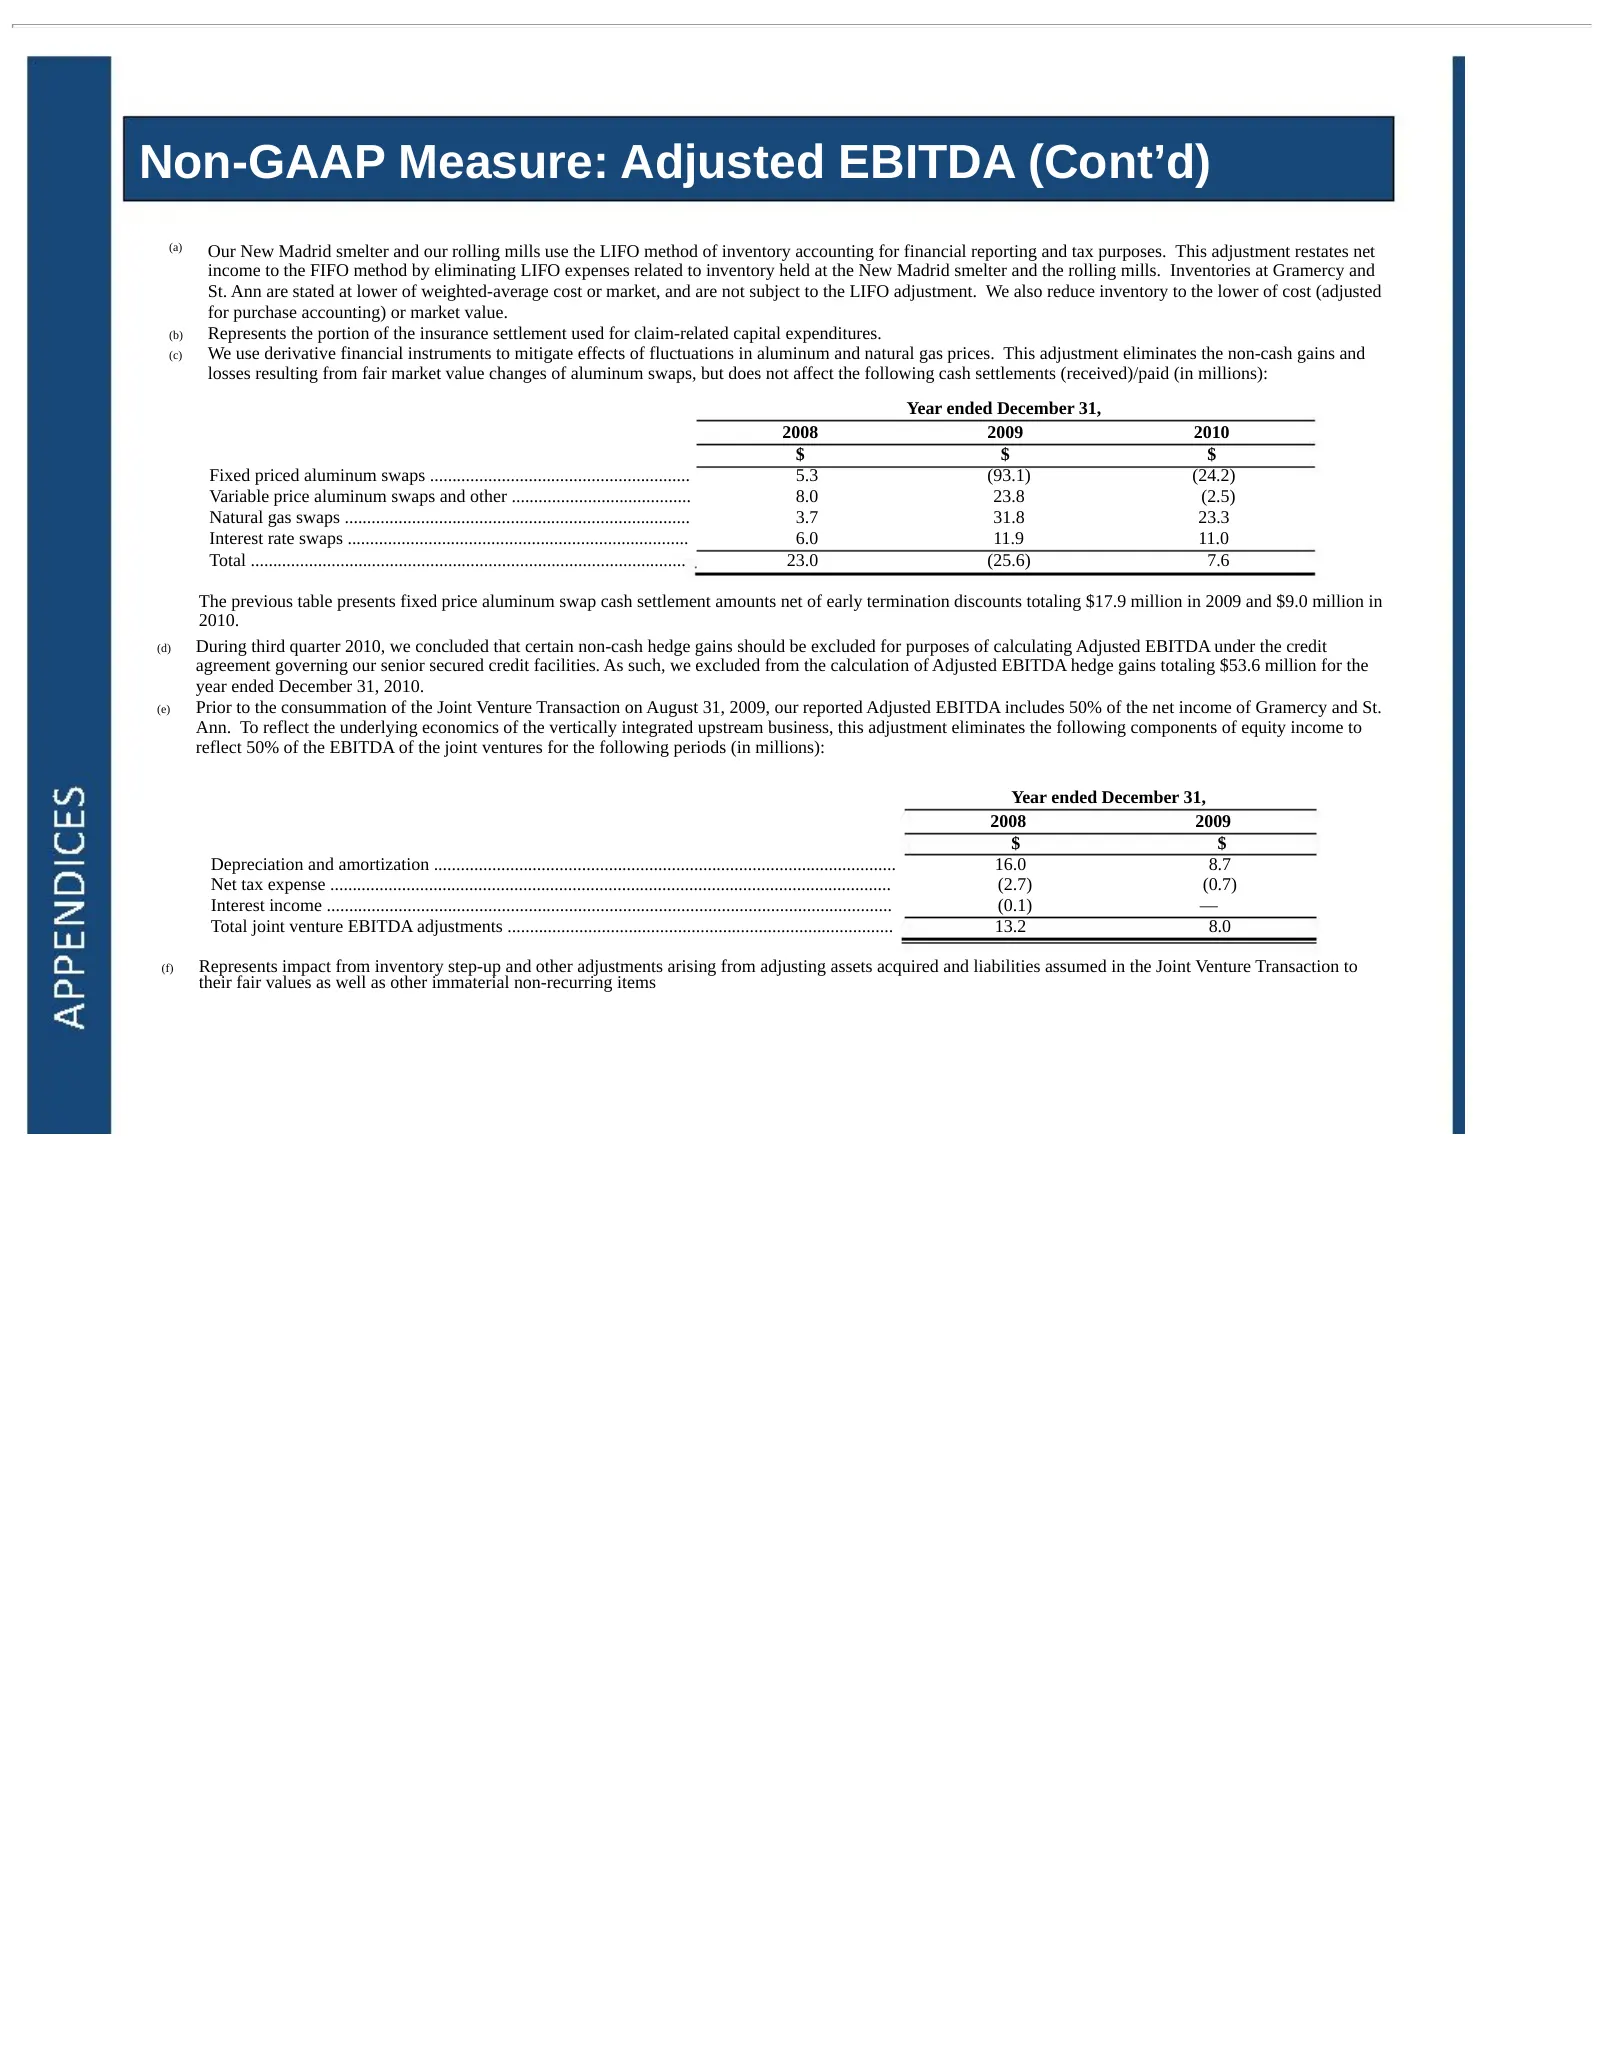
Non-GAAP Measure: Adjusted EBITDA (Cont’d) (a) Our New Madrid smelter and our rolling mills use the LIFO method of inventory accounting for financial reporting and tax purposes. This adjustment restates net income to the FIFO method by eliminating LIFO expenses related to inventory held at the New M
Slide 33: Non-GAAP Measure: Adjusted EBITDA (Cont'd)
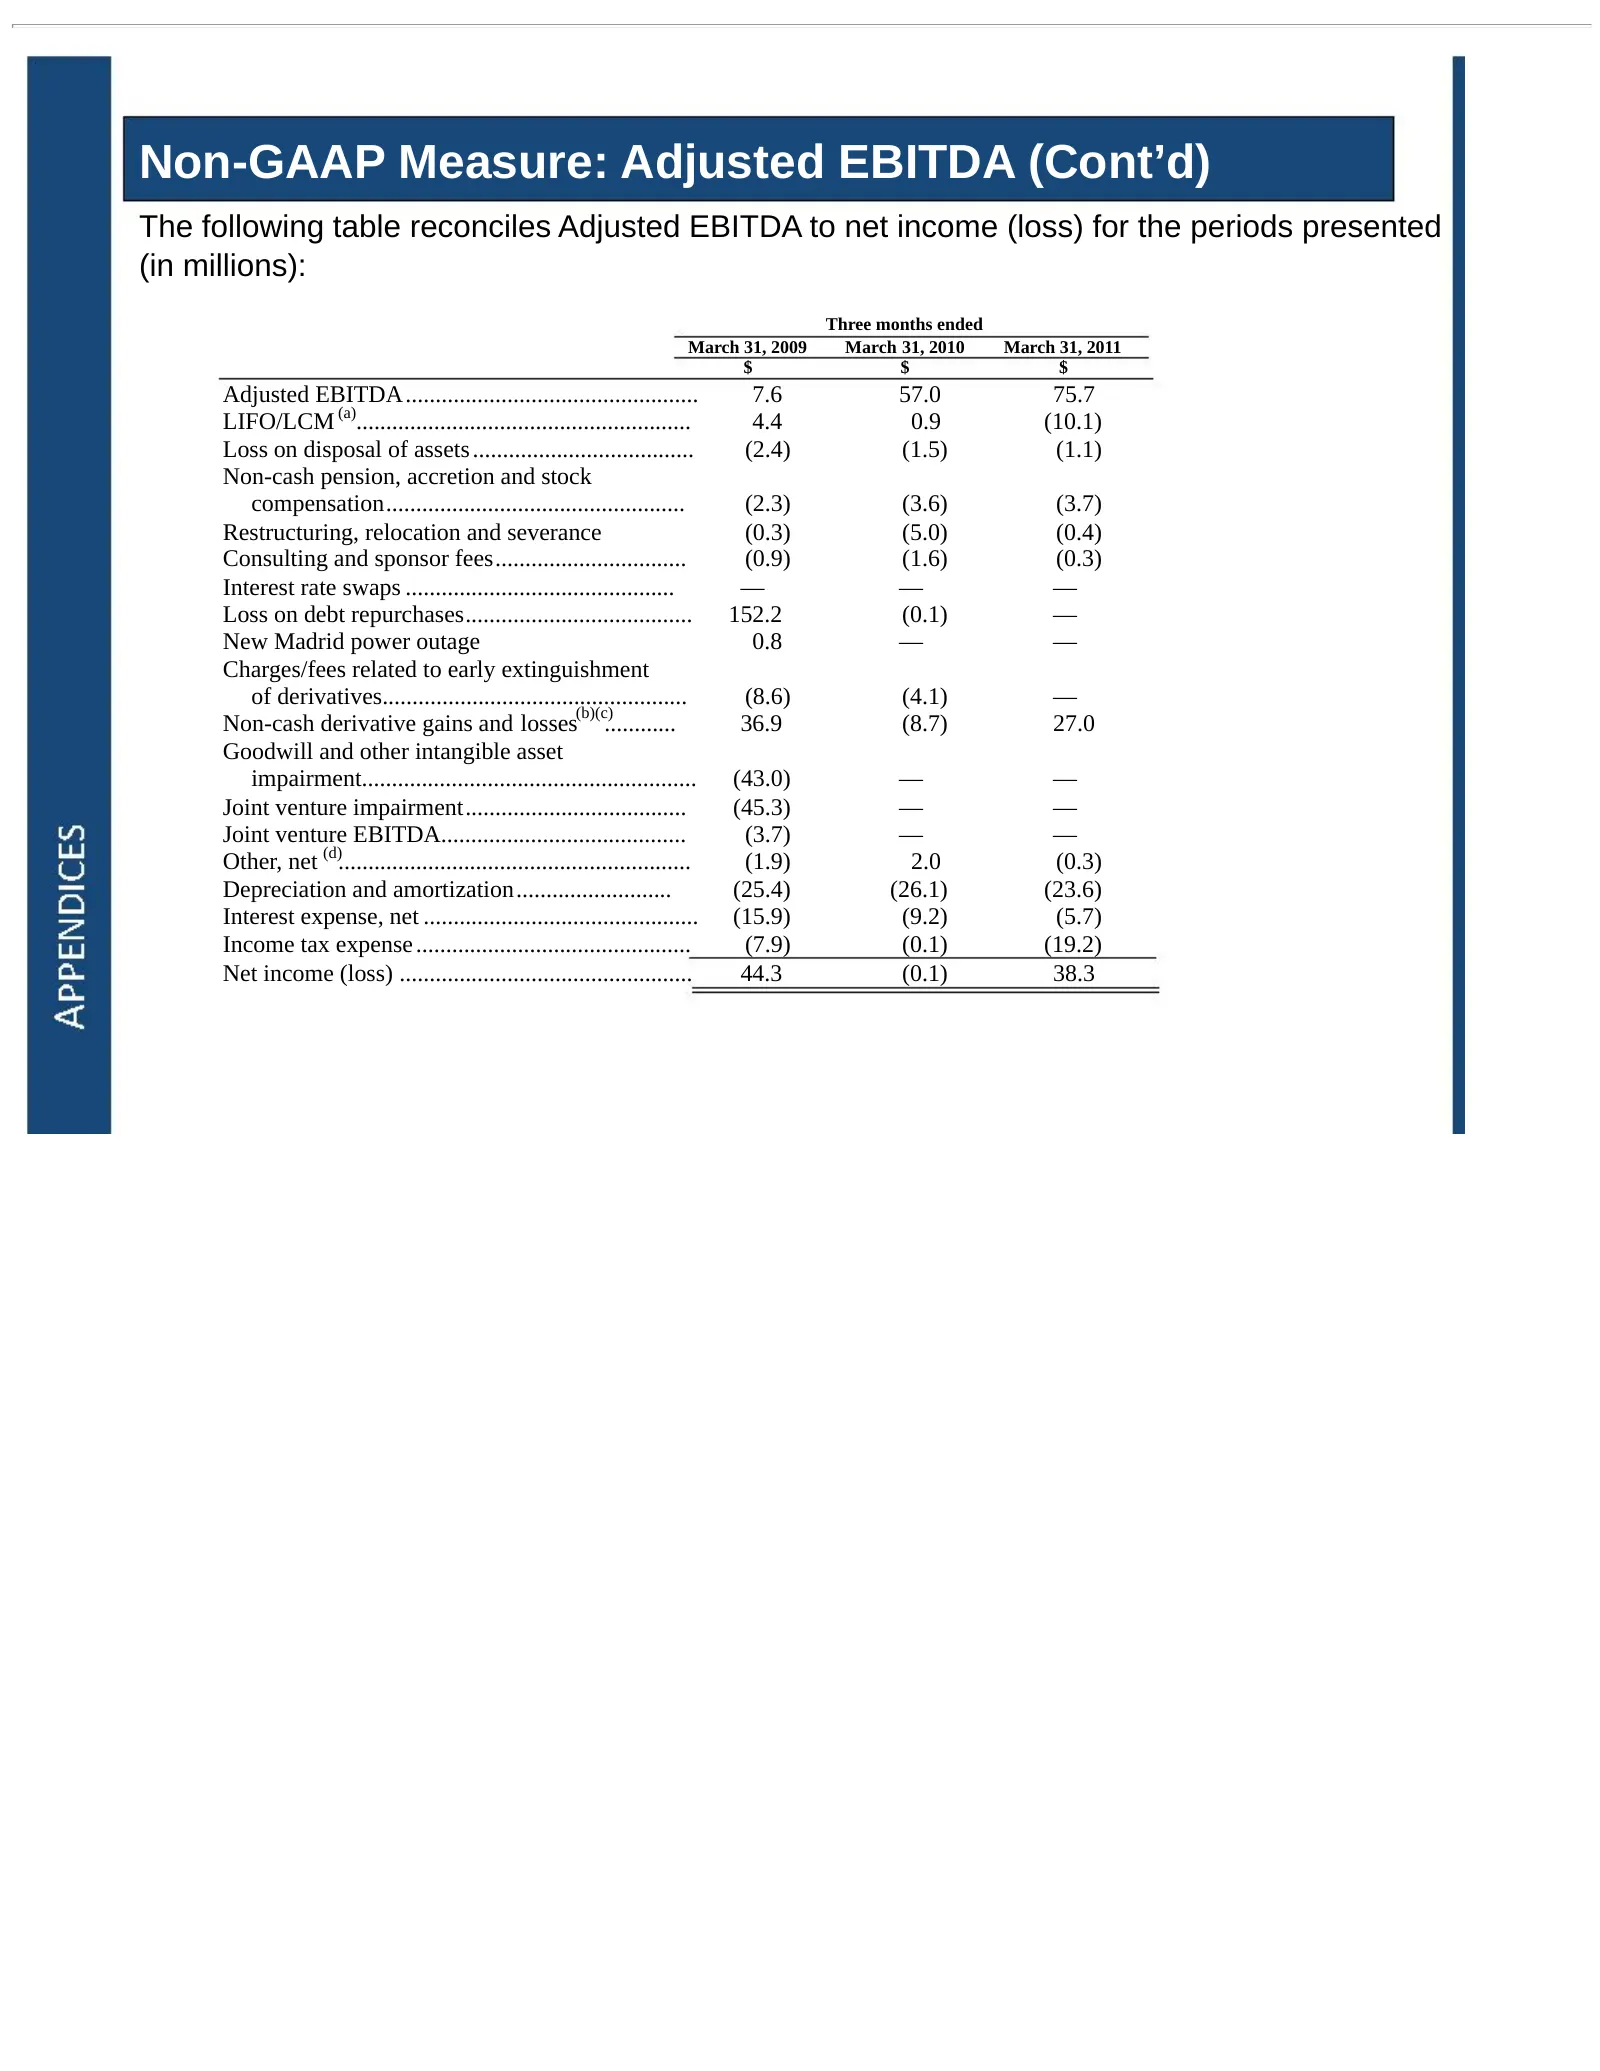
Non-GAAP Measure: Adjusted EBITDA (Cont’d) The following table reconciles Adjusted EBITDA to net income (loss) for the periods presented (in millions): Three months ended March 31, 2009 March 31, 2010 March 31, 2011 $ $ $ Adjusted EBITDA................................................. 7.6 57.0 75.7
Slide 34: Non-GAAP Measure: Adjusted EBITDA (Cont'd)
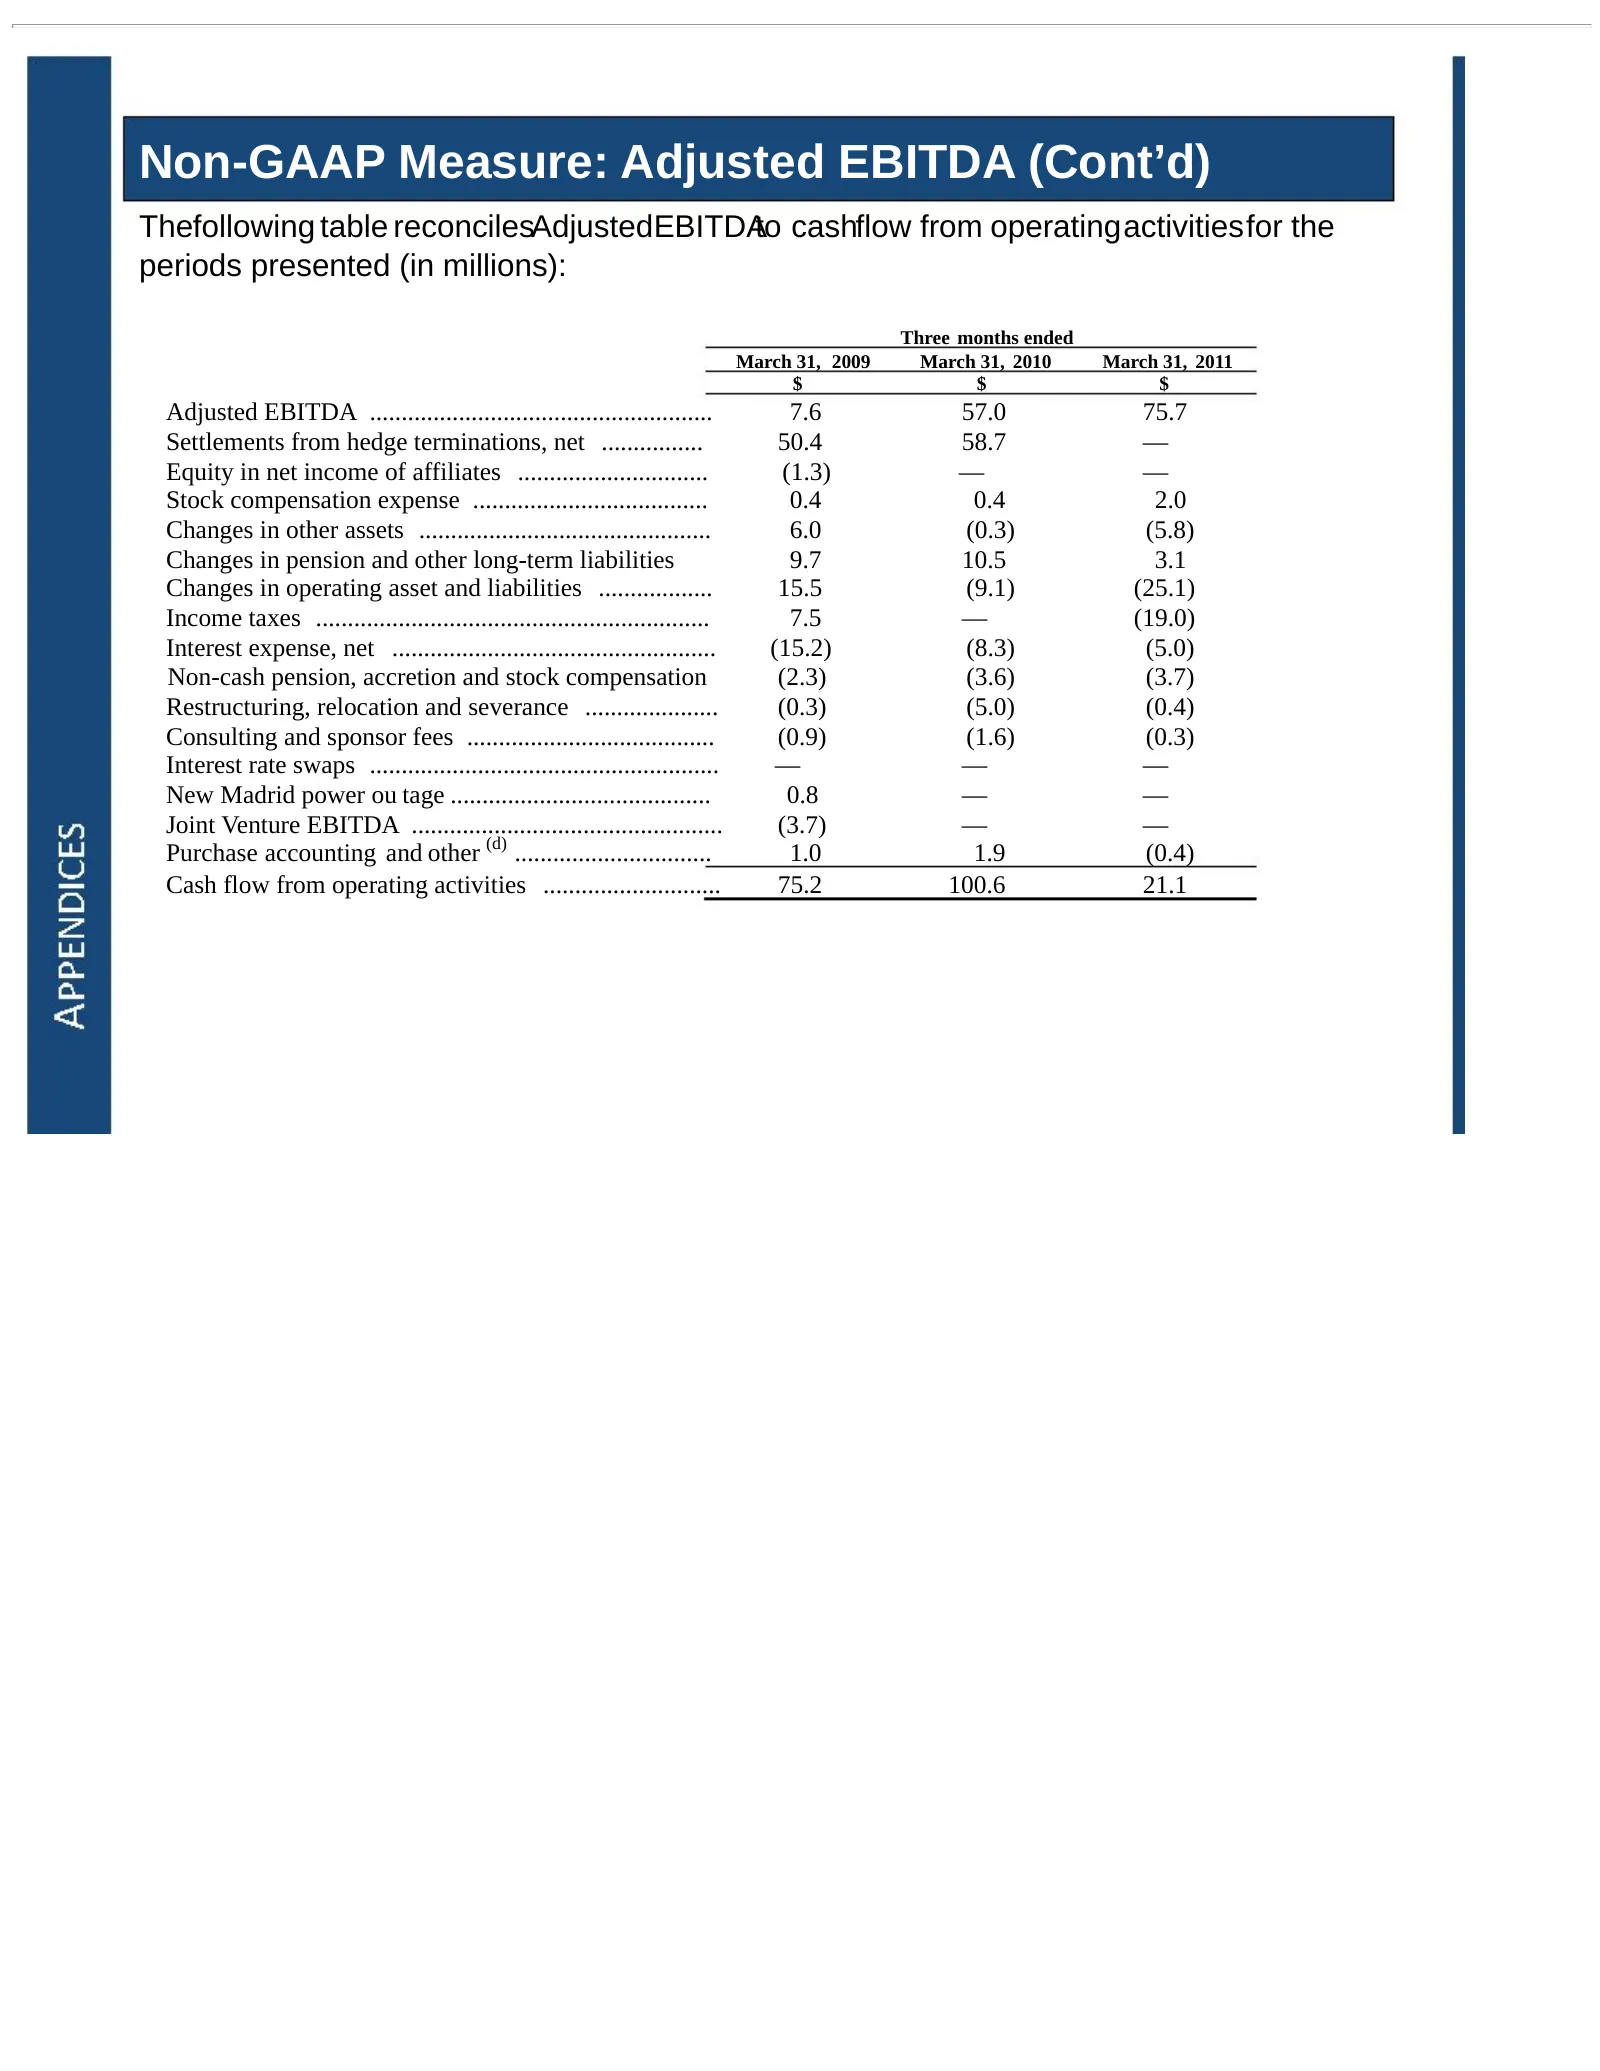
Non-GAAP Measure: Adjusted EBITDA (Cont’d) Thefollowing table reconcilesAdjustedEBITDAto cashflow from operatingactivitiesfor the periods presented (in millions): Three months ended March 31, 2009 March 31, 2010 March 31, 2011 $ $ $ Adjusted EBITDA ...................................................
Slide 35: Non-GAAP Measure: Adjusted EBITDA (Cont'd)
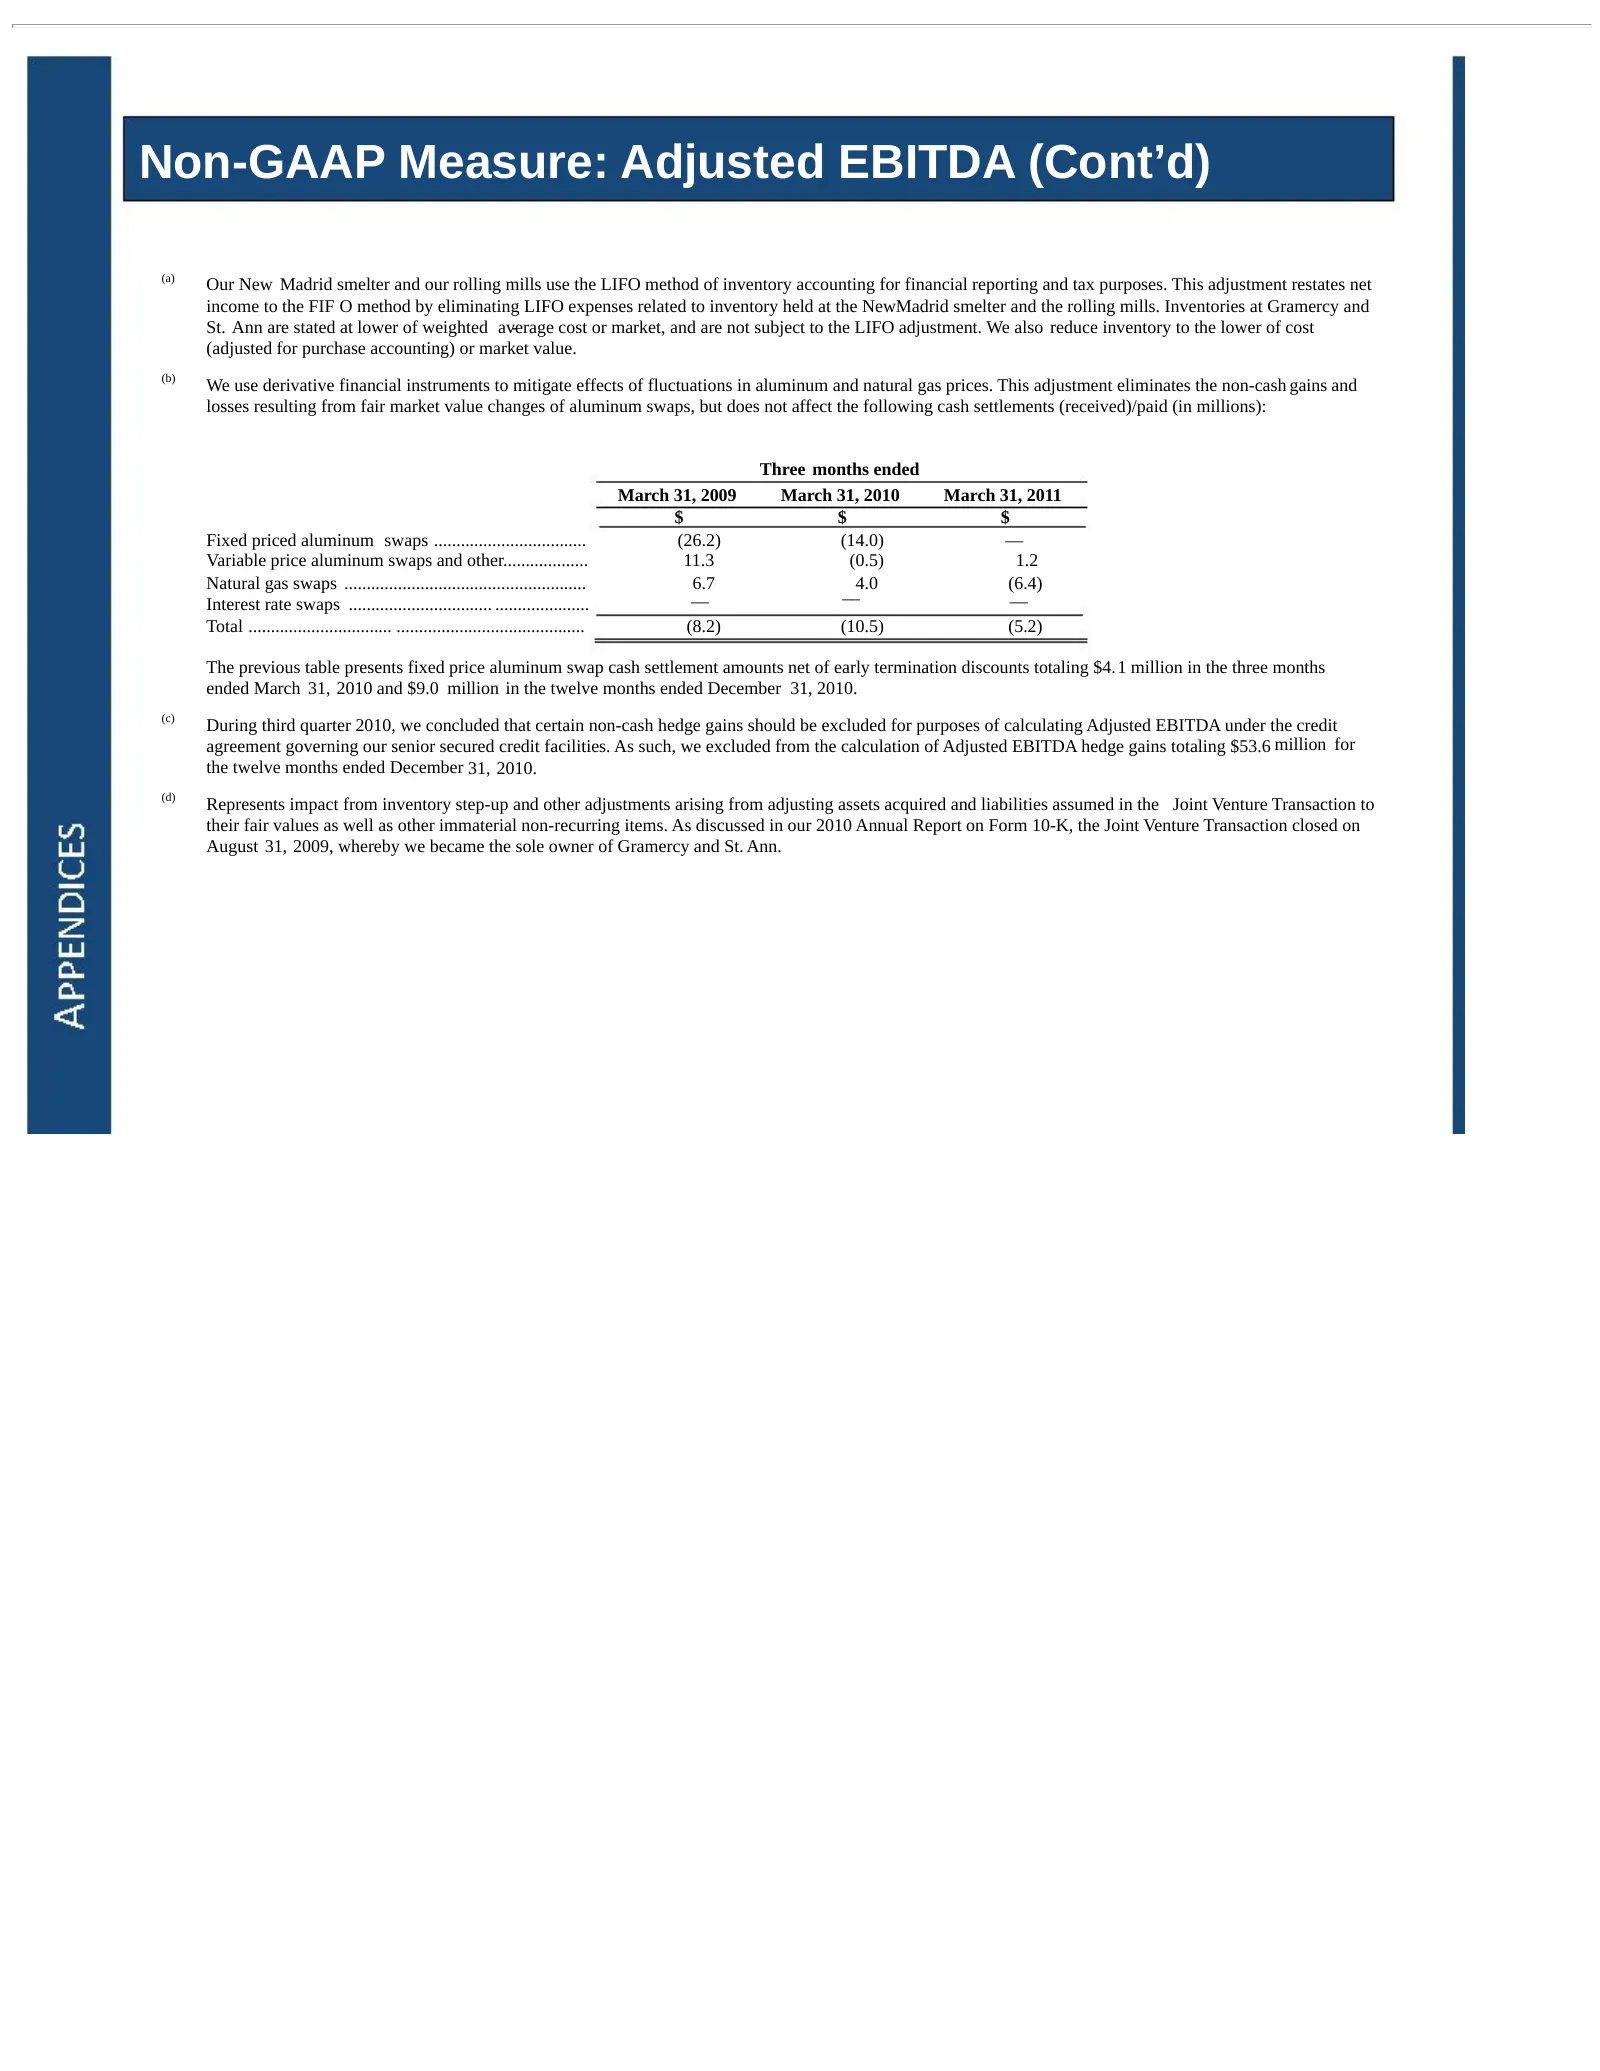
Non-GAAP Measure: Adjusted EBITDA (Cont’d) (a) Our New Madrid smelter and our rolling mills use the LIFO method of inventory accounting for financial reporting and tax purposes. This adjustment restates net income to the FIF O method by eliminating LIFO expenses related to inventory held at the NewM
Slide 36: Non-GAAP Measure: Net Cash Cost of Primary Aluminum
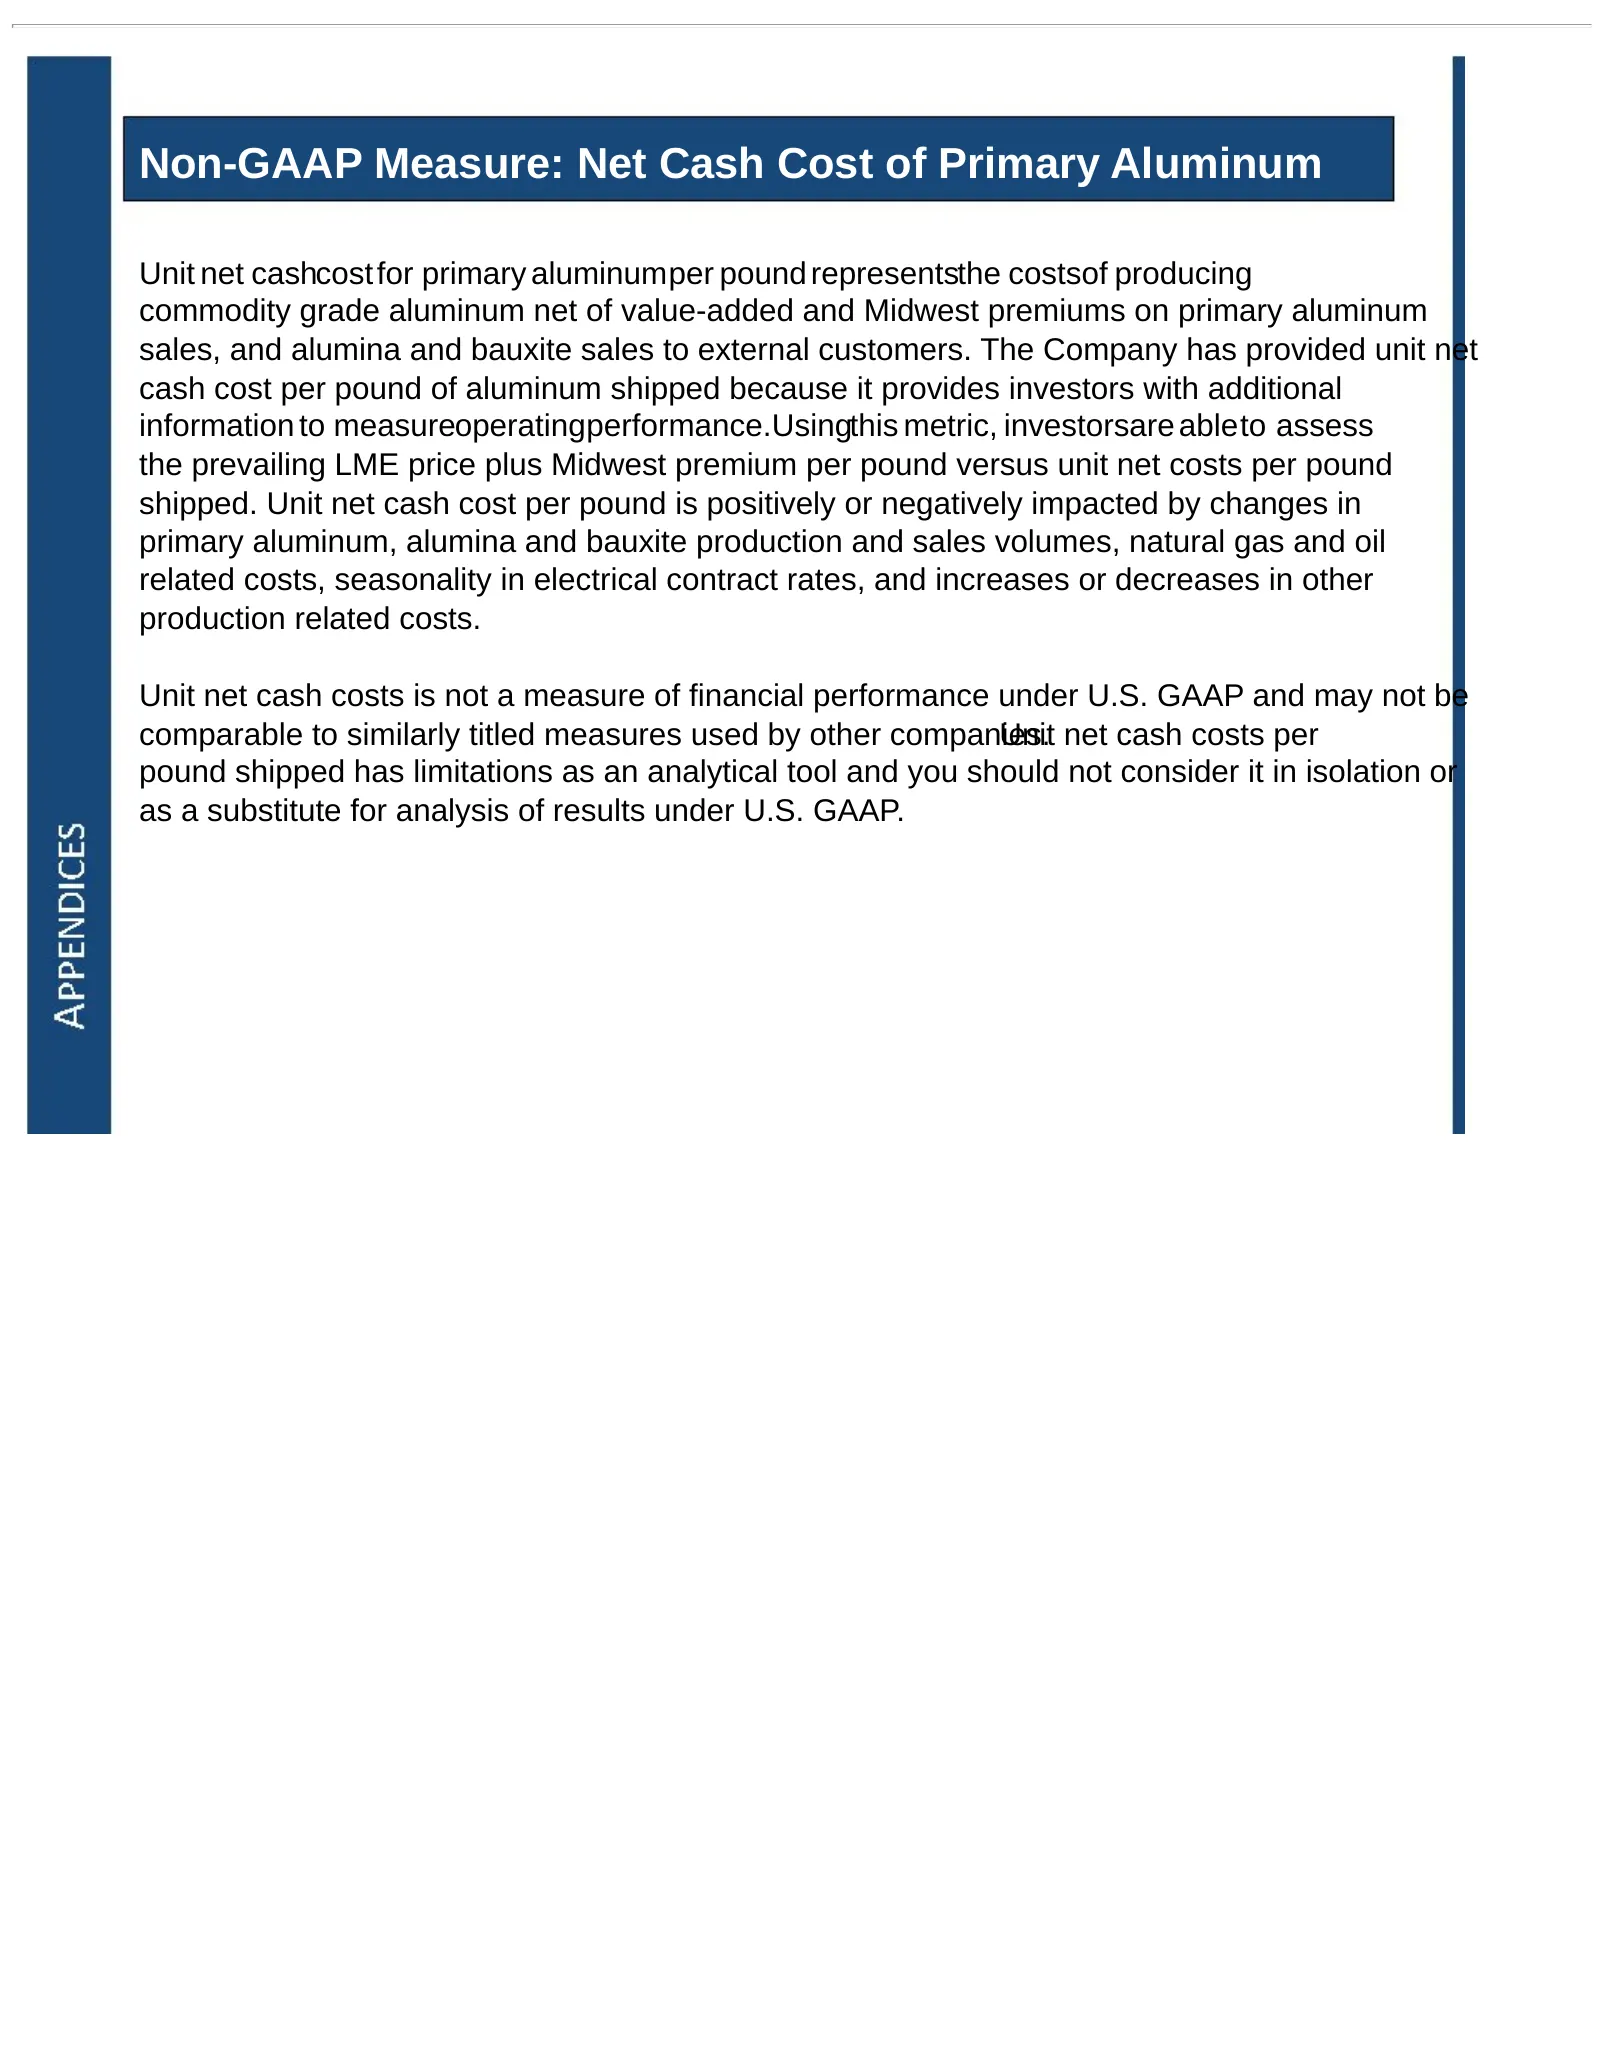
Non-GAAP Measure: Net Cash Cost of Primary Aluminum Unit net cashcost for primary aluminumper pound representsthe costsof producing commodity grade aluminum net of value-added and Midwest premiums on primary aluminum sales, and alumina and bauxite sales to external customers. The Company has provide
Slide 37: Non-GAAP Measure: Net Cash Cost of Primary Aluminum (Cont'd)
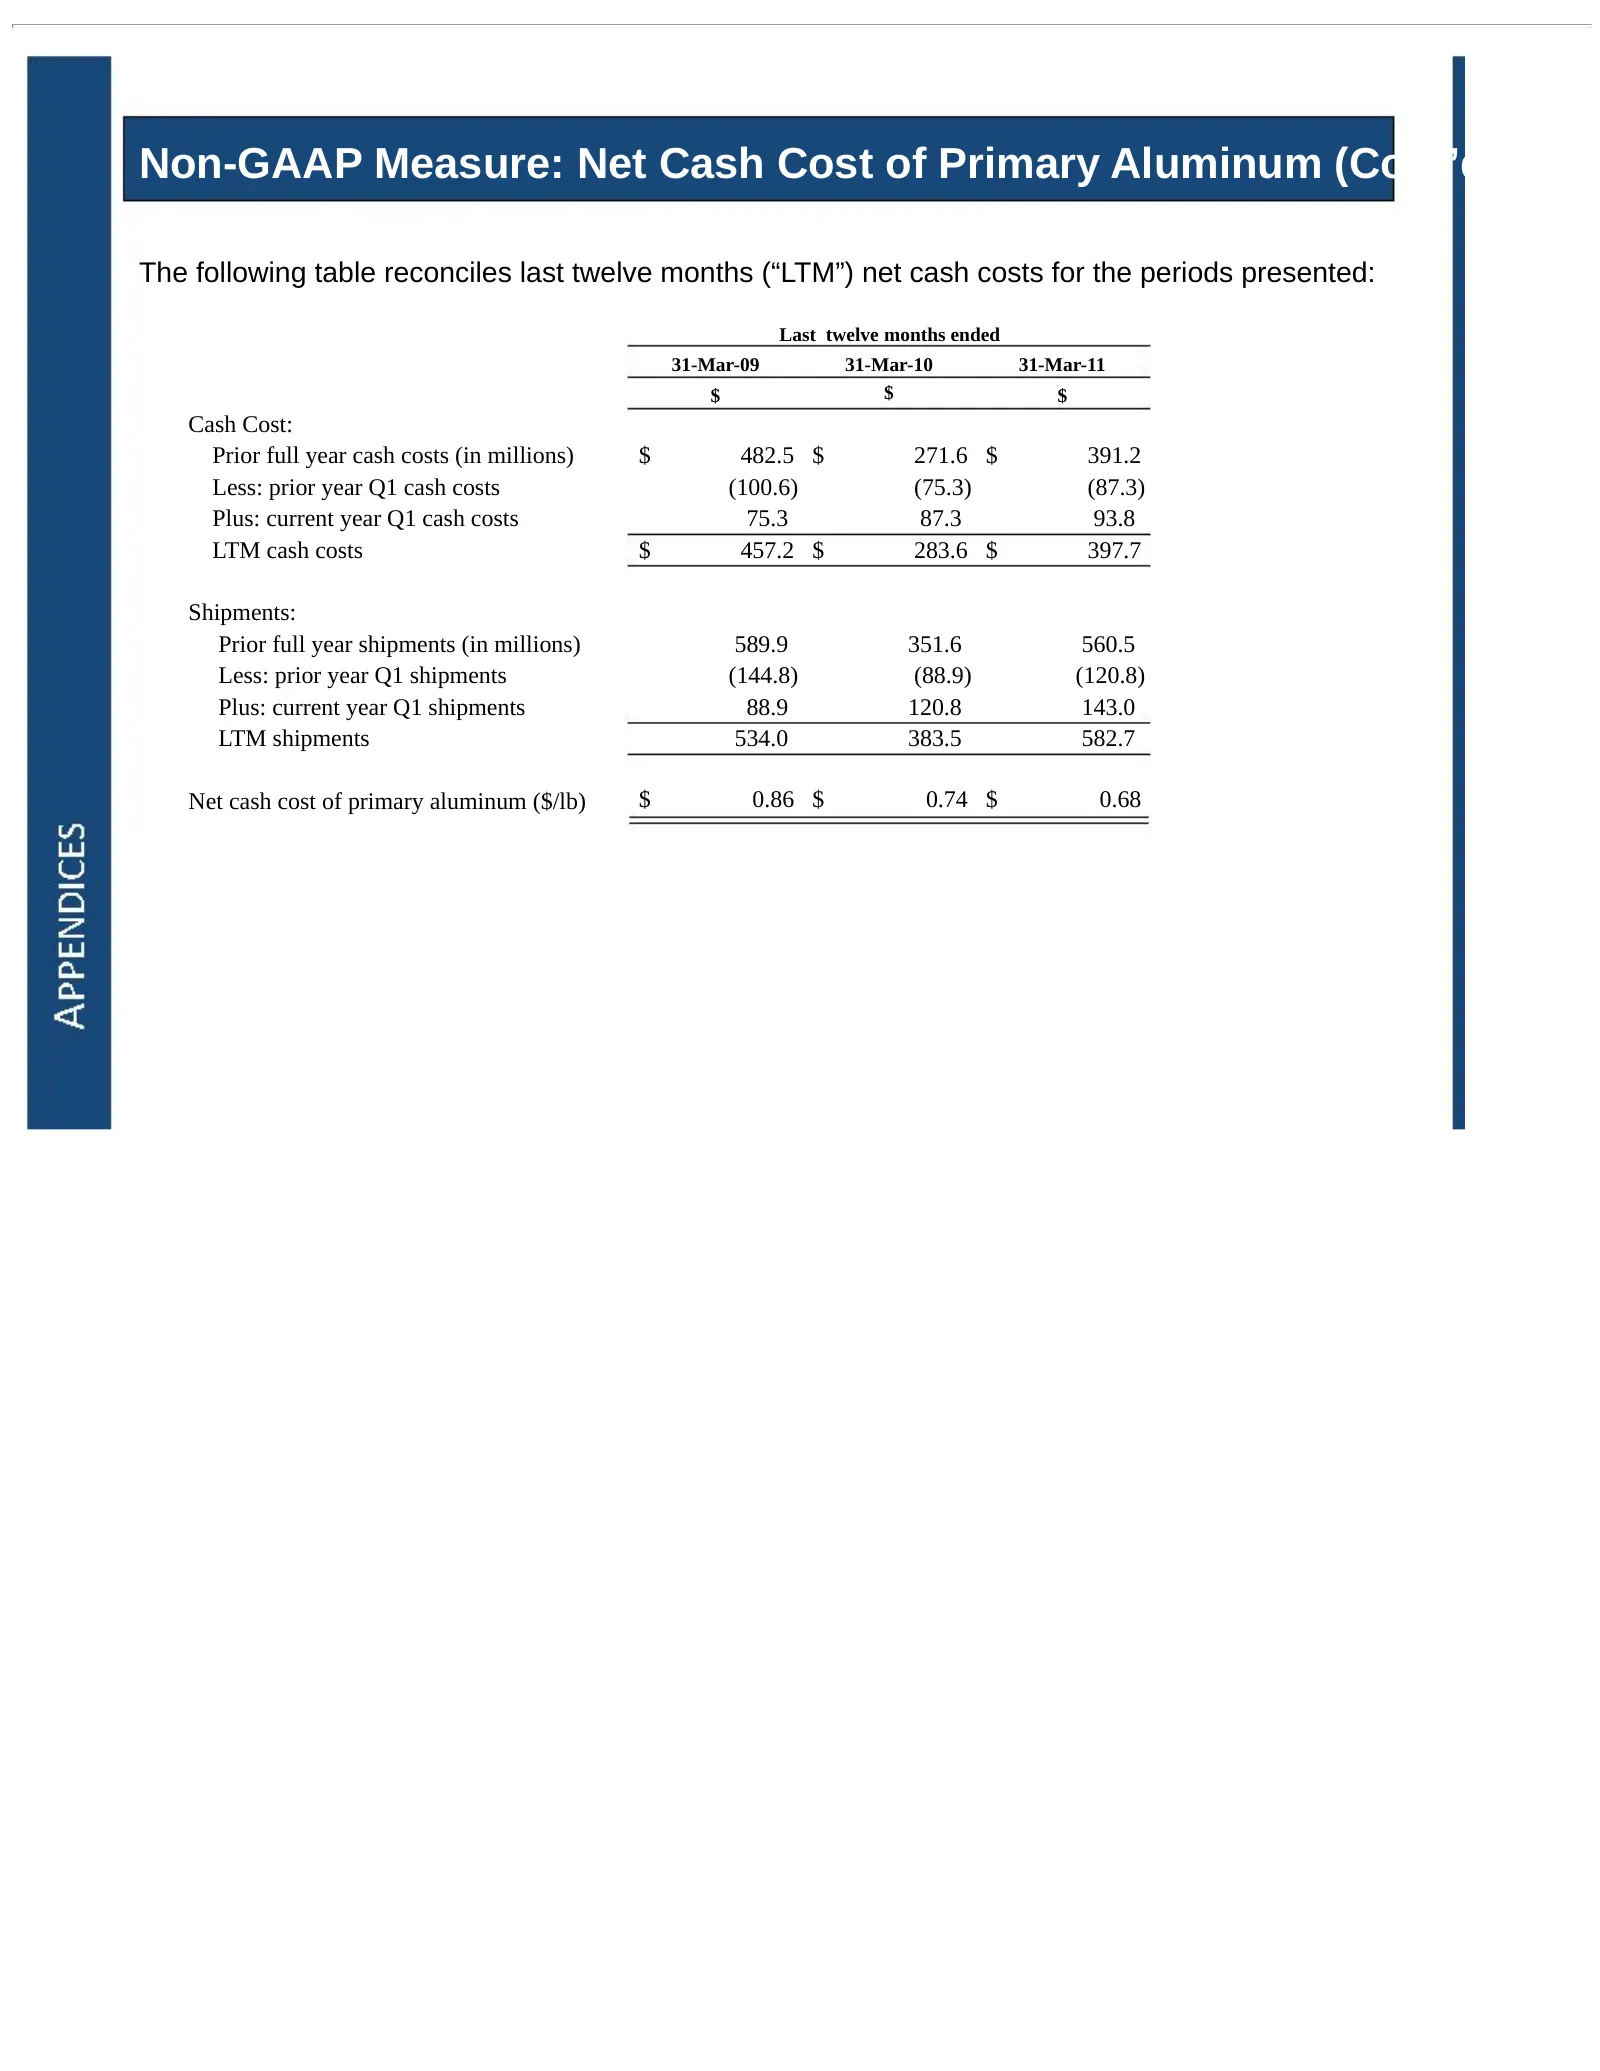
Non-GAAP Measure: Net Cash Cost of Primary Aluminum (Cont’d) The following table reconciles last twelve months (“LTM”) net cash costs for the periods presented: Last twelve months ended 31-Mar-09 31-Mar-10 31-Mar-11 $ $ $ Cash Cost: Prior full year cash costs (in millions) $ 482.5 $ 271.6 $ 391.2 Le
Slide 38: Non-GAAP Measure: Net Cash Cost of Primary Aluminum (Cont'd)
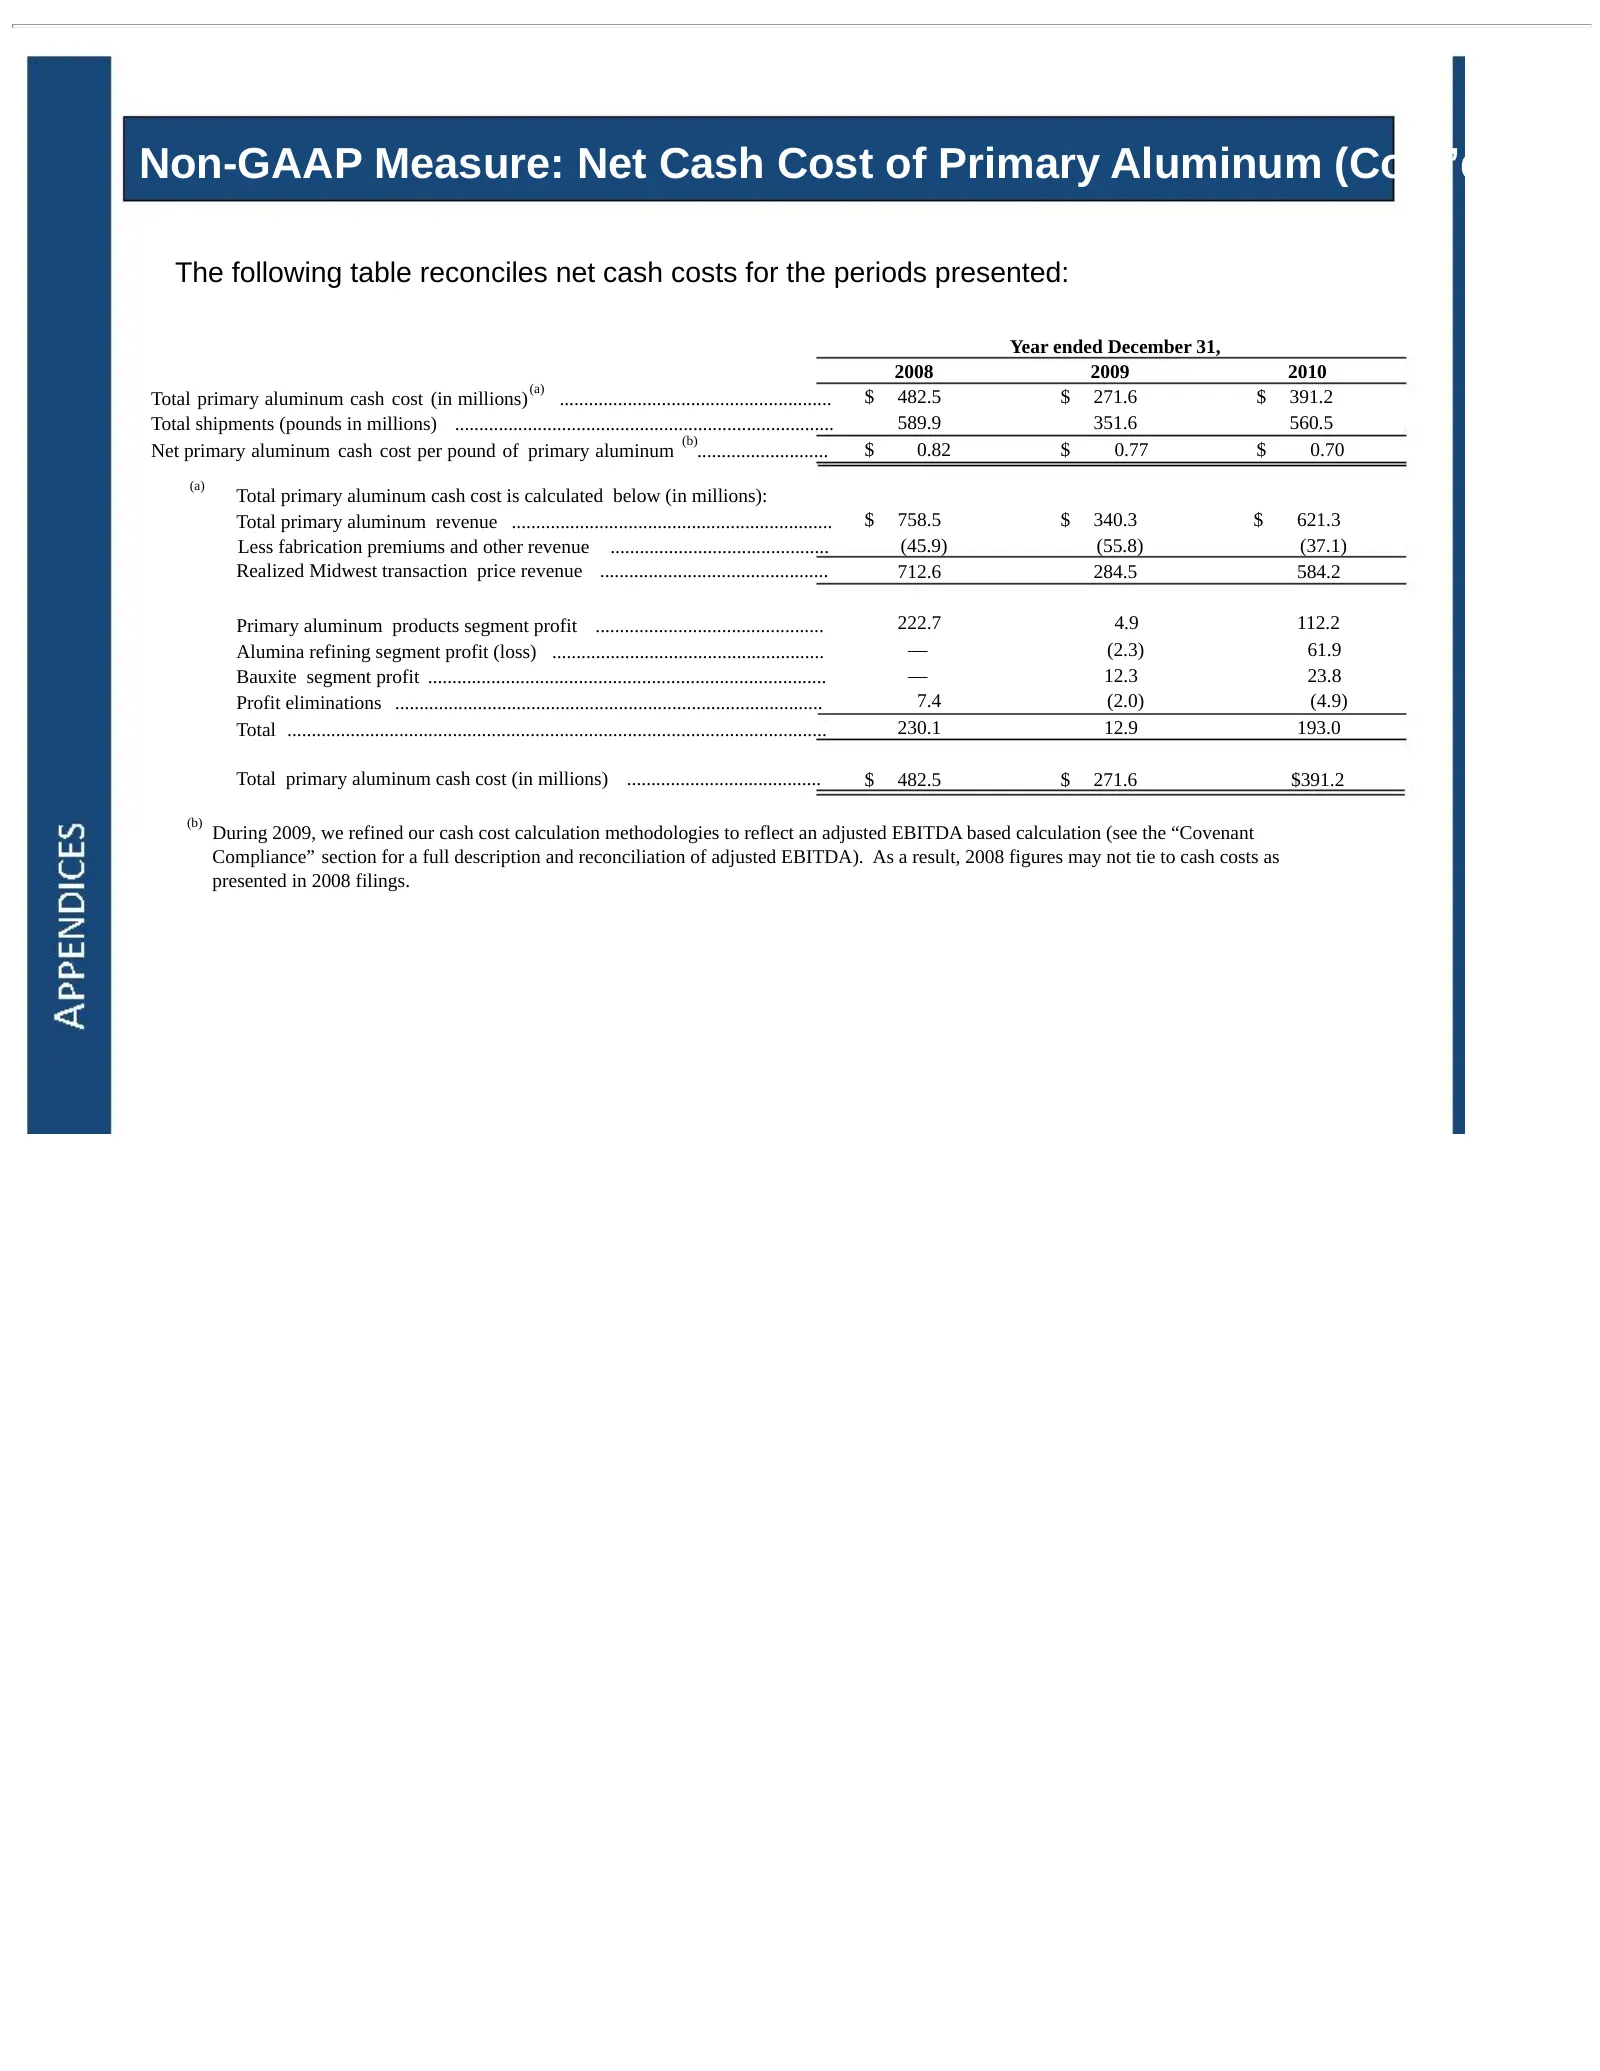
Non-GAAP Measure: Net Cash Cost of Primary Aluminum (Cont’d) The following table reconciles net cash costs for the periods presented: Year ended December 31, 2008 2009 2010 (a) Total primary aluminum cash cost (in millions) ........................................................ $ 482.5 $ 271.6 $ 3
Slide 39: Non-GAAP Measure: Net Cash Cost of Primary Aluminum (Cont'd)
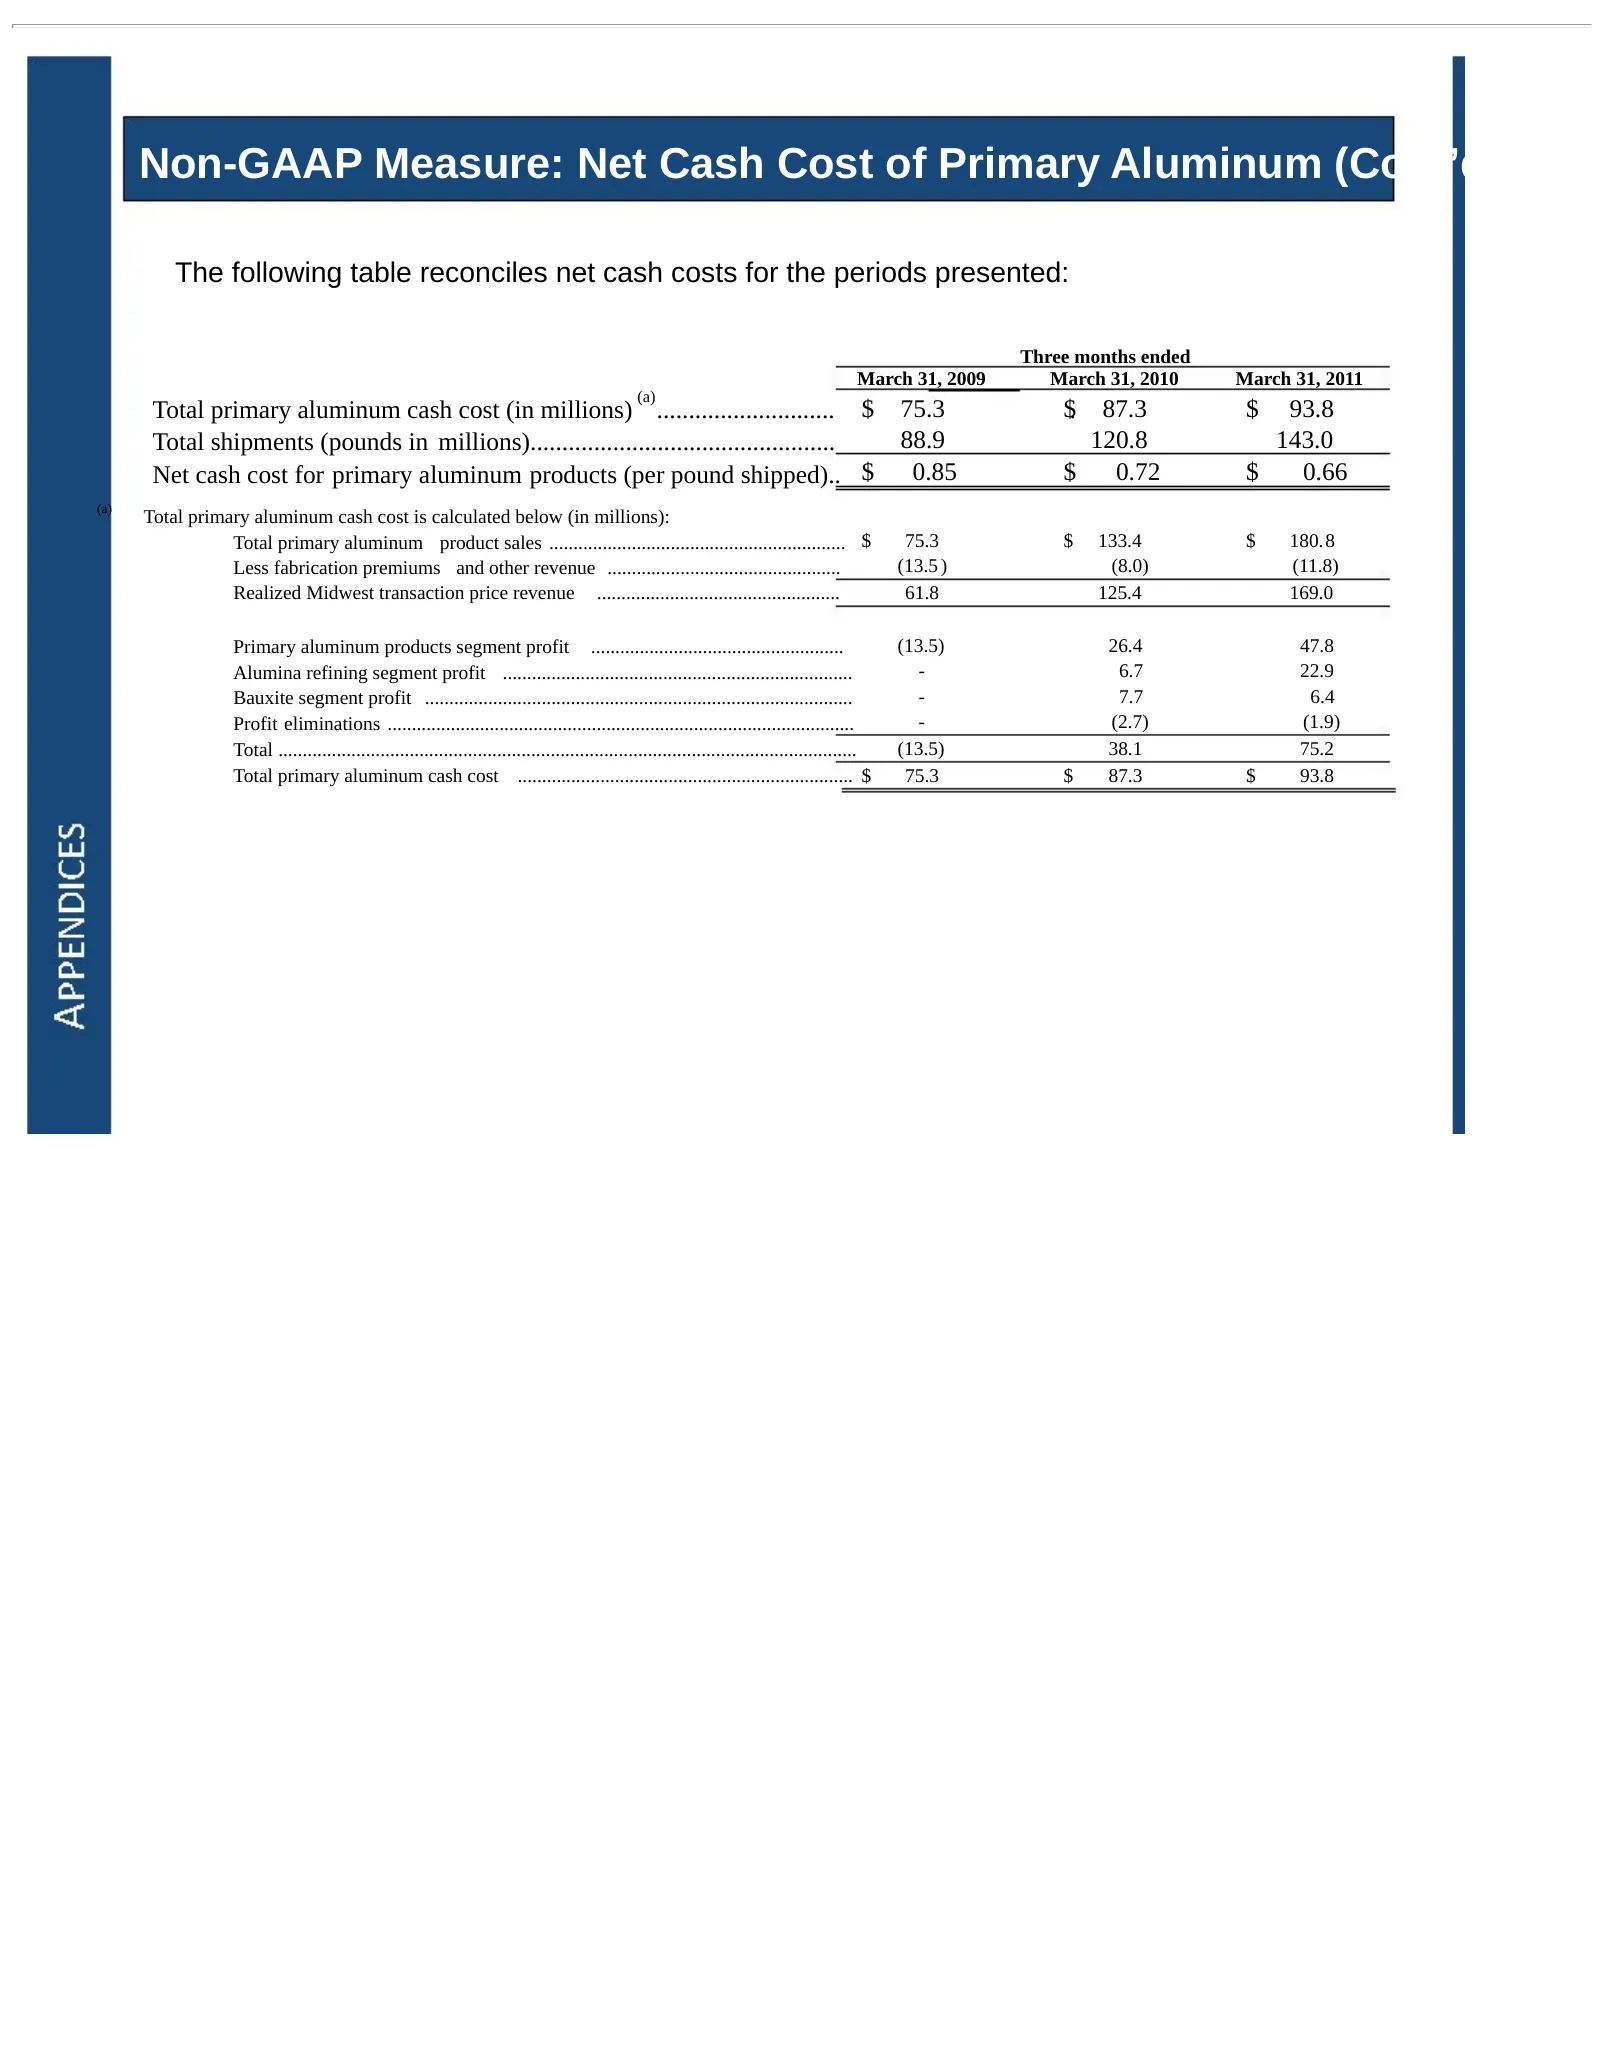
Non-GAAP Measure: Net Cash Cost of Primary Aluminum (Cont’d) The following table reconciles net cash costs for the periods presented: Three months ended March 31, 2009 March 31, 2010 March 31, 2011 (a) Total primary aluminum cash cost (in millions) ............................ $ 75.3 $. 87.3 $ 93.8
Slide 40: Non-GAAP Measure: Net Income (Loss), Excluding Special Items
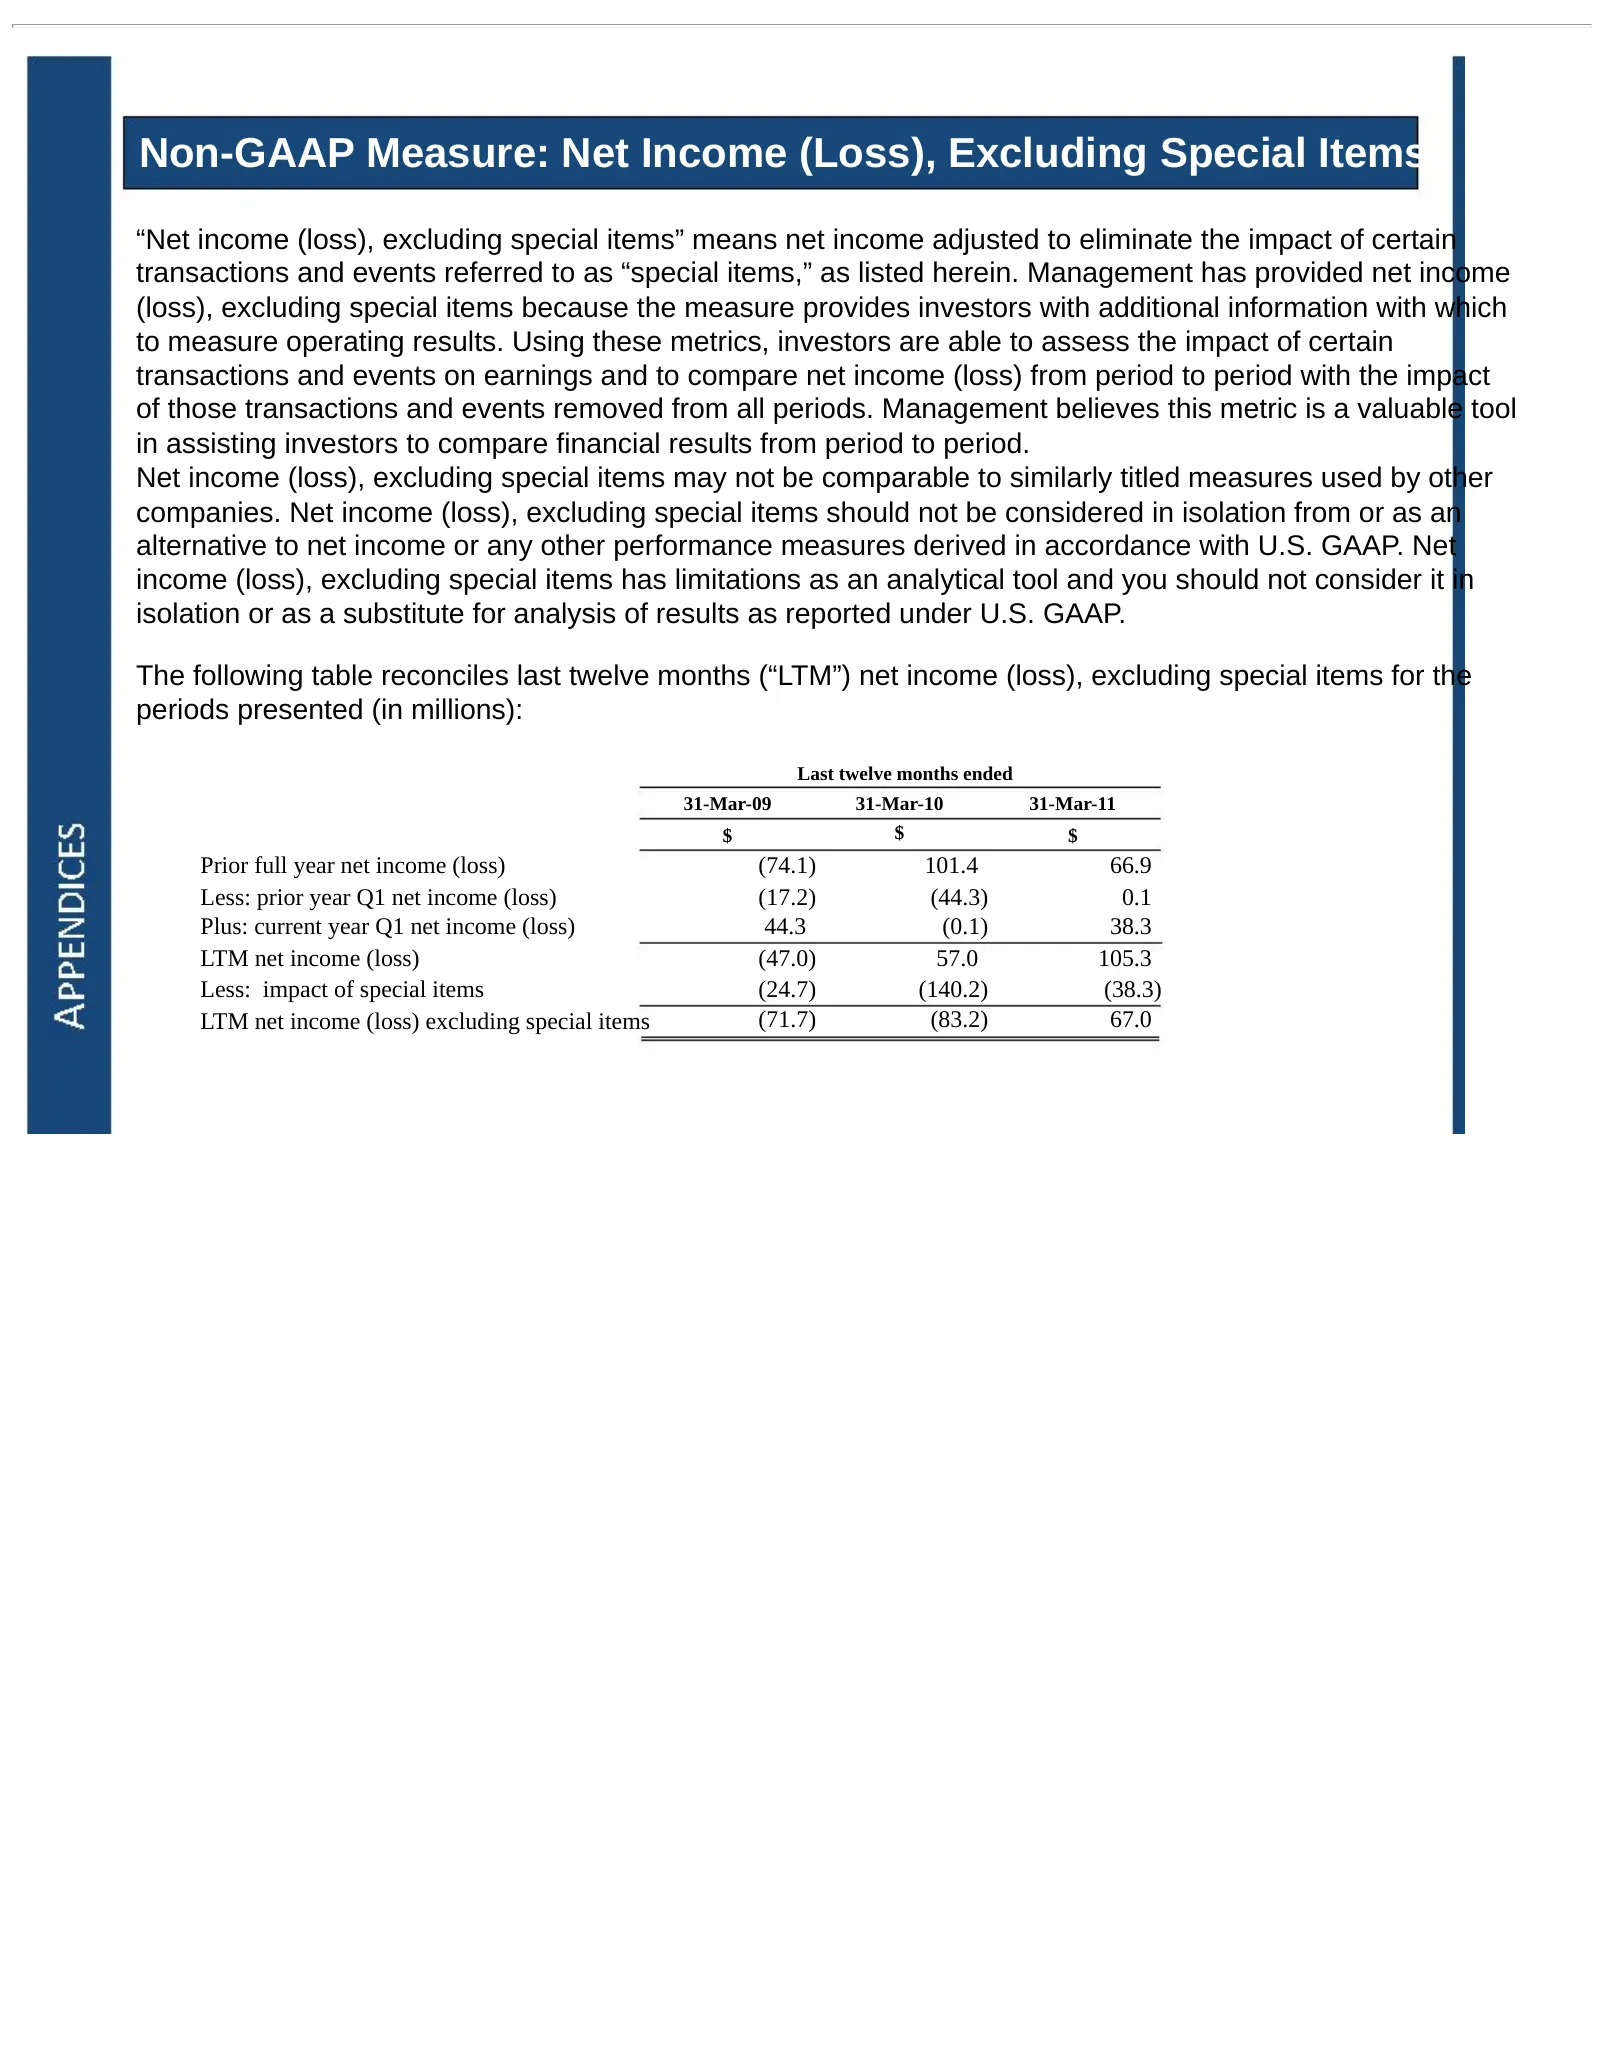
Non-GAAP Measure: Net Income (Loss), Excluding Special Items “Net income (loss), excluding special items” means net income adjusted to eliminate the impact of certain transactions and events referred to as “special items,” as listed herein. Management has provided net income (loss), excluding specia
Slide 41: Non-GAAP Measure: Net Income (Loss), Excluding Special Items (Cont'd)
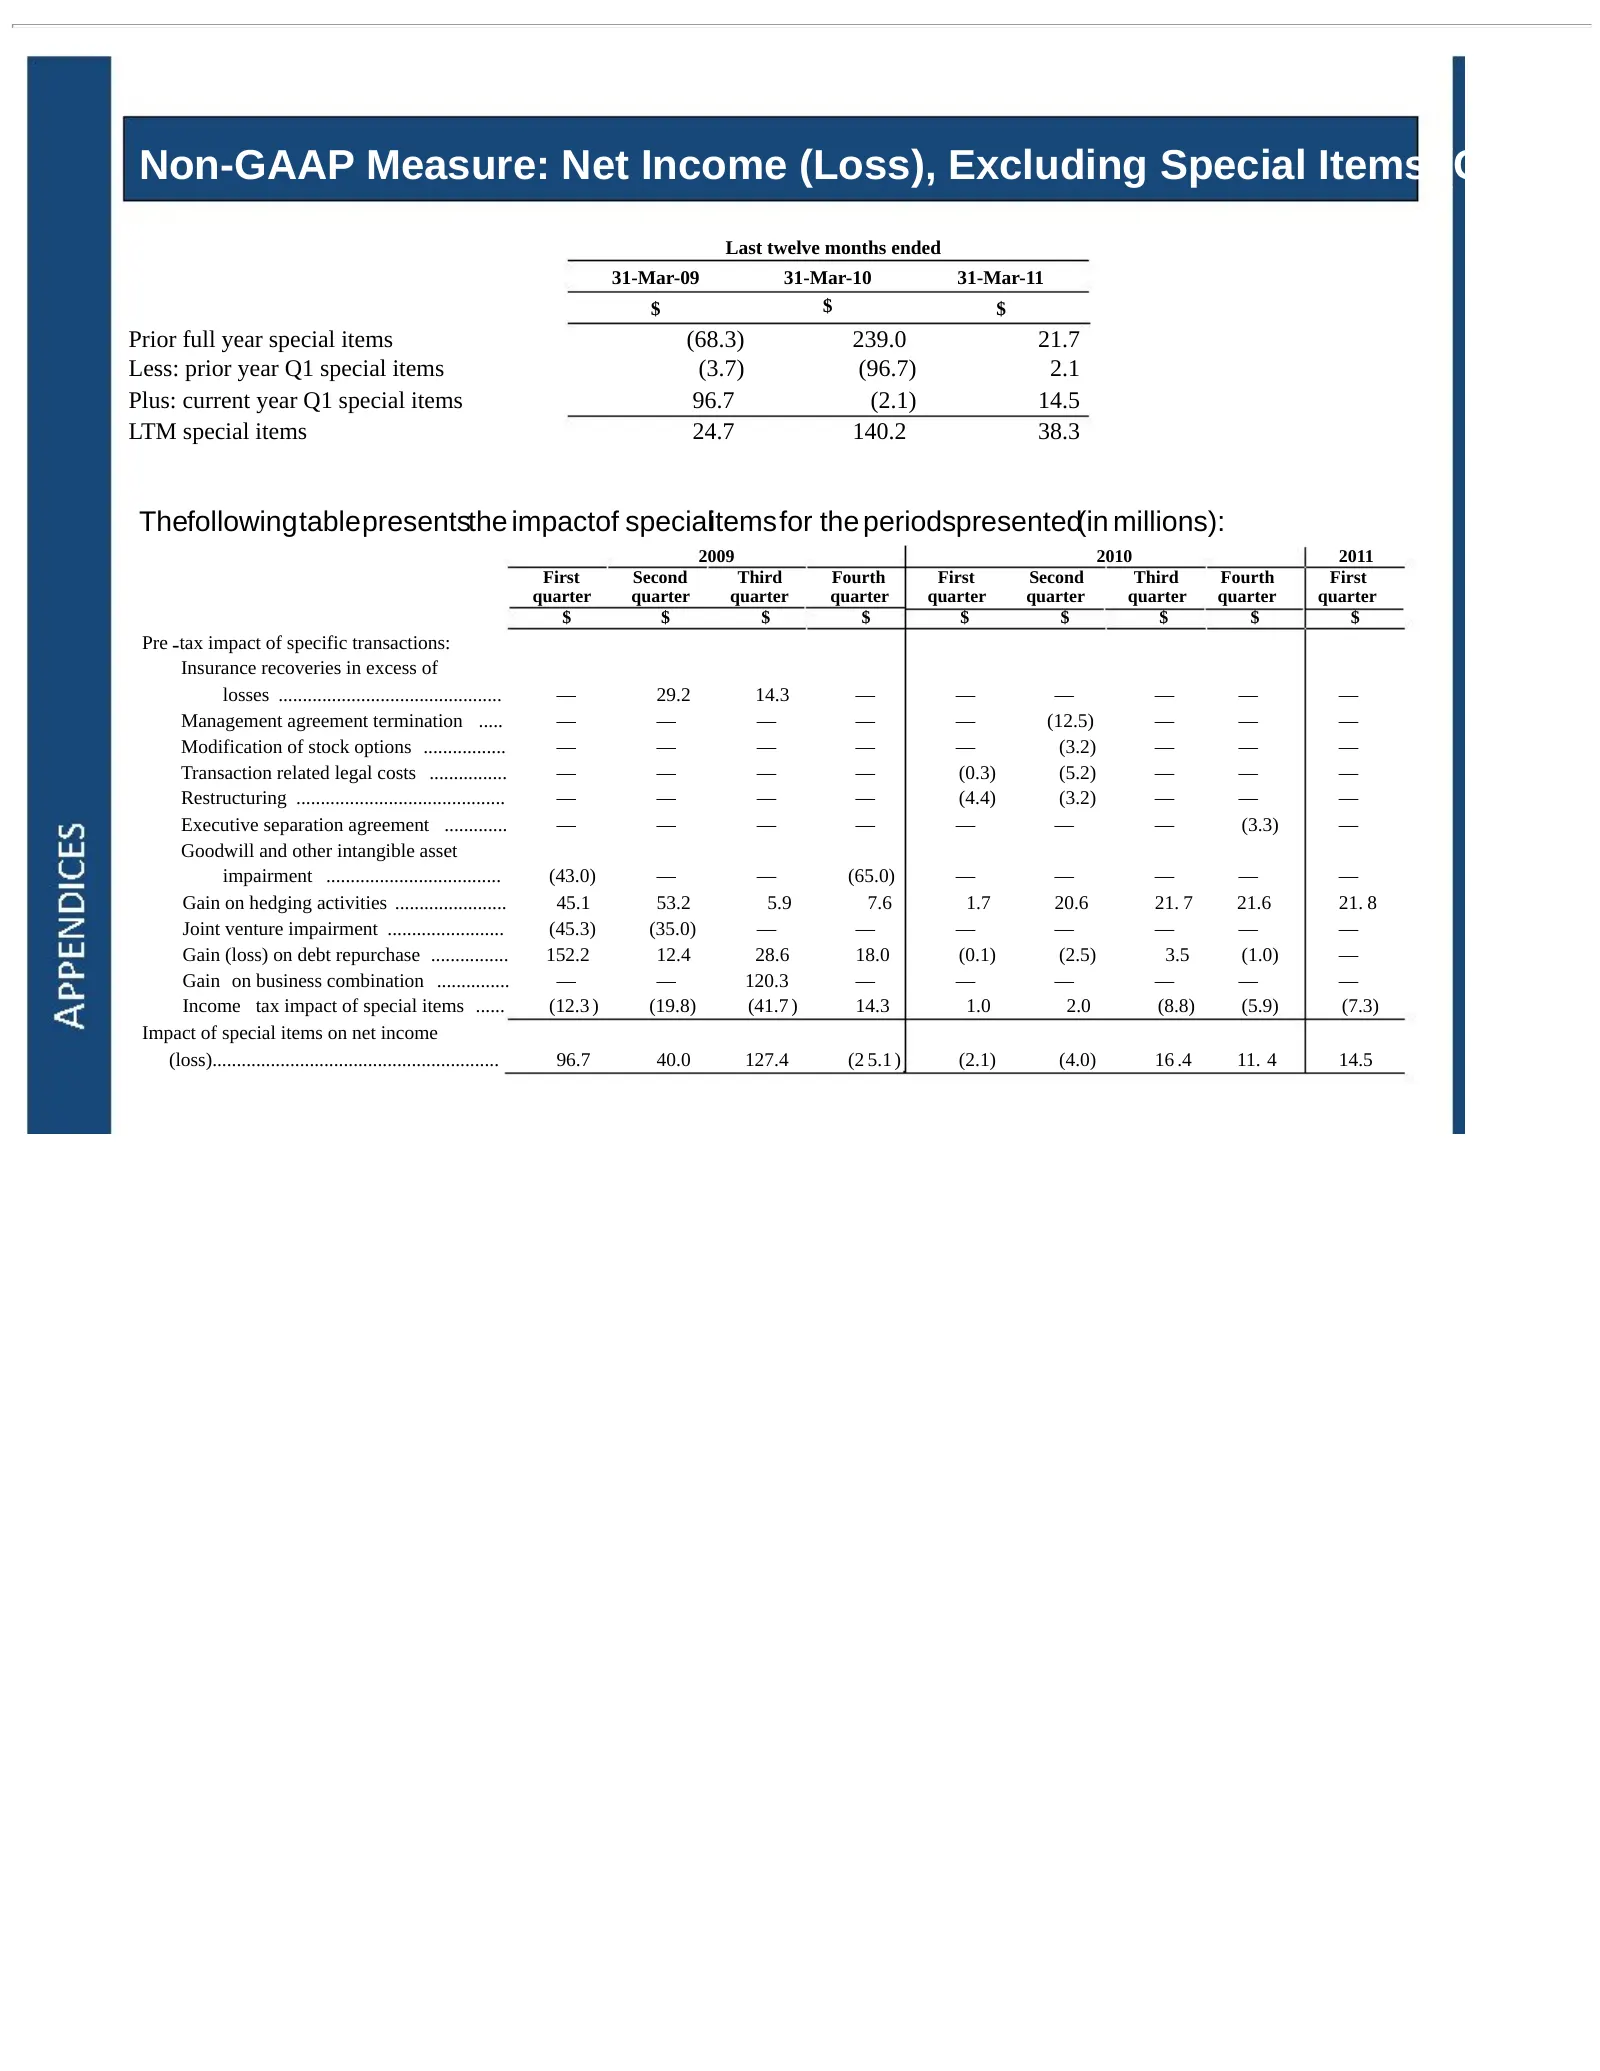
Non-GAAP Measure: Net Income (Loss), Excluding Special Items (Cont’d) Last twelve months ended 31-Mar-09 31-Mar-10 31-Mar-11 $ $ $ Prior full year special items (68.3) 239.0 21.7 Less: prior year Q1 special items (3.7) (96.7) 2.1 Plus: current year Q1 special items 96.7 (2.1) 14.5 LTM special items
Slide 42: Non-GAAP Measure: Operating Cash Flow, Excluding Aluminum Hedges
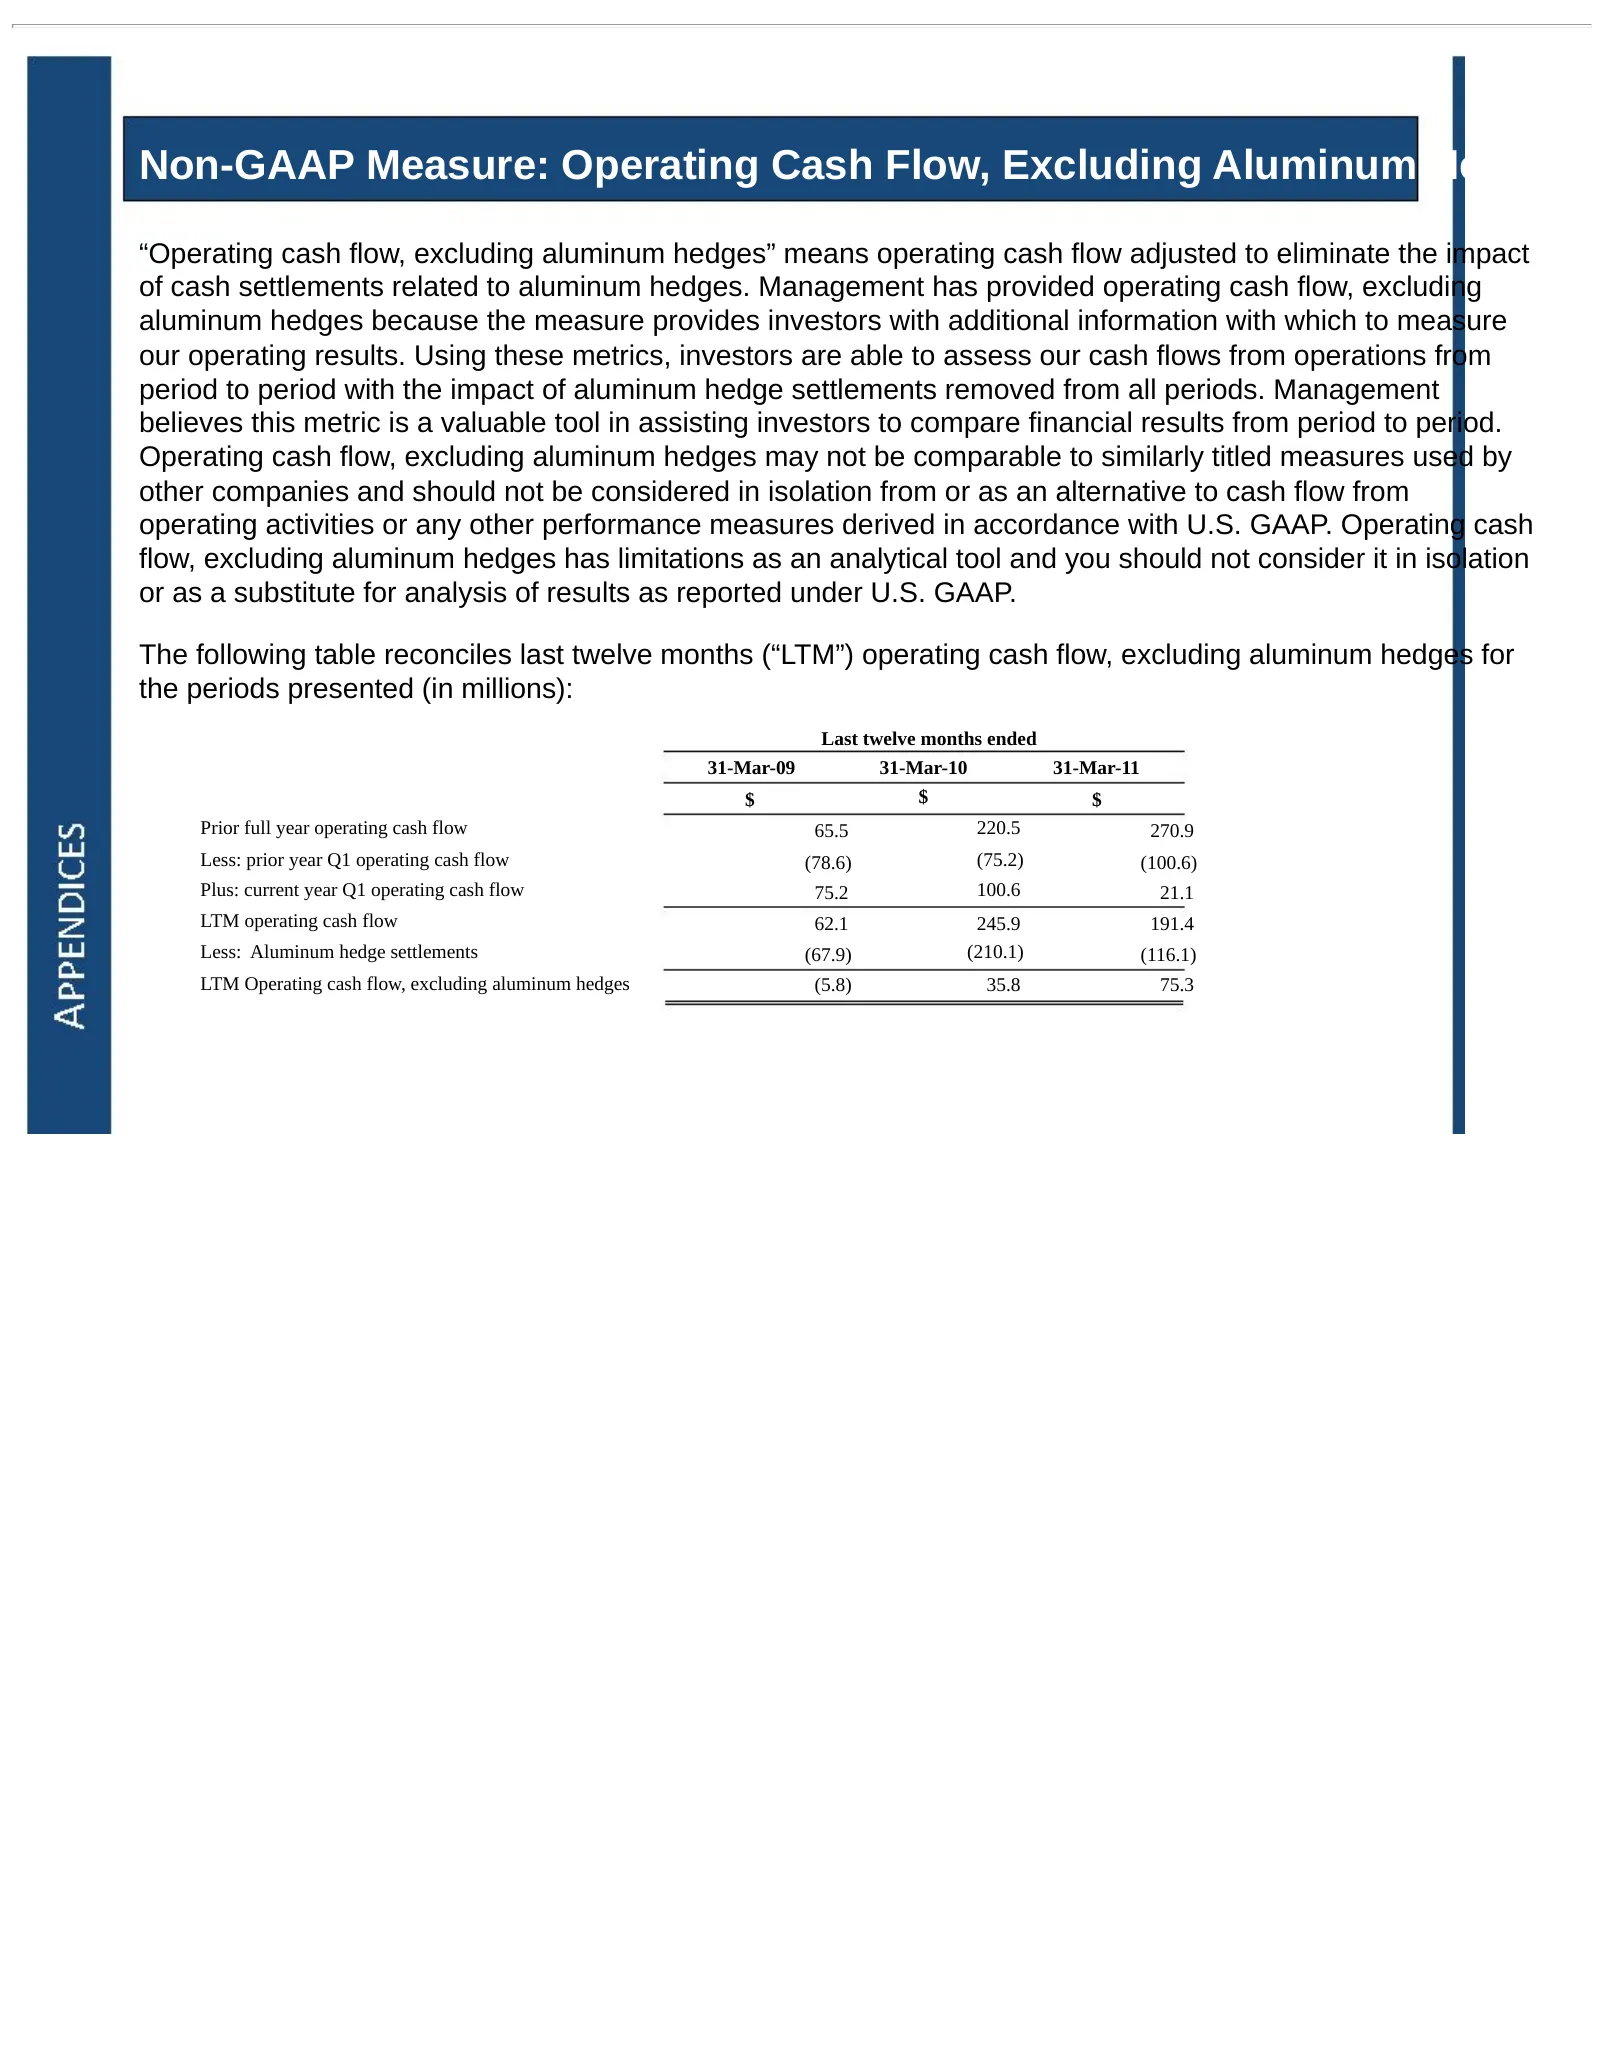
Non-GAAP Measure: Operating Cash Flow, Excluding Aluminum Hedges “Operating cash flow, excluding aluminum hedges” means operating cash flow adjusted to eliminate the impact of cash settlements related to aluminum hedges. Management has provided operating cash flow, excluding aluminum hedges because
Slide 43: NOLLVYOdYOD ONIGIOH WIANIAINTY VONVYON
NOLLVYOdYOD ONIGIOH WIANIAINTY VONVYON
Source: SEC EDGAR · 8-K filed May 25, 2011
More decks from Noranda Aluminum Holding Corp
 Q3 2015 Earnings Presentation10 slides · Nov 9, 2015
 Q2 2015 Earnings Presentation11 slides · Jul 22, 2015
 Q1 2015 Earnings Presentation15 slides · May 6, 2015
 Q4 2014 Earnings Presentation15 slides · Feb 18, 2015
 Q3 2014 Earnings Presentation15 slides · Nov 3, 2014
 Q2 2014 Earnings Presentation16 slides · Aug 11, 2014