Plains Exploration & Production Company
Plains Exploration & Production — Investor Presentation (July 2008)
35 slides from Plains Exploration & Production's investor presentation, Jul 8, 2008
Slide 1: Investor Presentation July 2008
Exhibit 99.1 July 2008 Investor Presentation July 2008 Investor Presentation

Slide 2

Slide 3

Slide 4

Slide 5: PXP is an independent oil and gas company
PXP is an independent oil and gas company primarily engaged in the activities of acquiring, developing, exploring and producing oil and gas in its core areas of operation: California, Rockies, Gulf Coast, Gulf of Mexico, Texas Panhandle, South Texas and the Permian Basin of the United States. PXP is

Slide 6: Forward-looking statements
2 Except for the historical information contained herein, the matters discussed in this presentation are “forward-looking statements” as defined by the Securities and Exchange Commission. These statements involve certain assumptions PXP made based on its experience and perception of historical trend

Slide 7: PXP Today: Strategic Enhancement of Asset Portfolio
3 Increased diversification into high quality basins Large inventory of cash producing and growth opportunities Improving unit economics and cost structure Lower risk more balanced asset base (1) Represents year end 2007 proved reserves adjusted for asset sales closed in February 2008 and the South
Slide 8: Accelerating Value
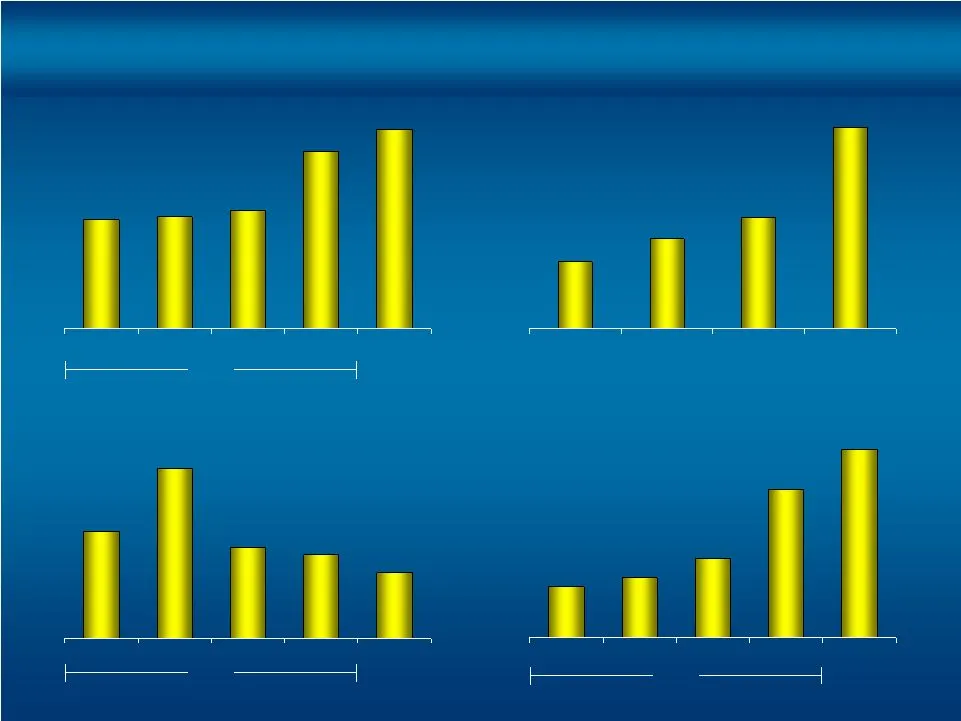
4 51.9 53.5 57.1 85.1 95.7 Q1 Q2 Q3 Q4 Q1 Production Thousand BOEPD $18.25 $19.26 $17.98 $17.85 $17.57 Q1 Q2 Q3 Q4 Q1 Production Costs $/BOE 2007 2008 2007 2008 83% 84% 85% 89% 2005 2006 2007 Q1 Oil Price Realization % NYMEX 2008 $94.6 $111.0 $146.0 $275.4 $350.2 Q1 Q2 Q3 Q4 Q1 Operating Cash Flow N
Slide 9: Valuation – Pre Haynesville
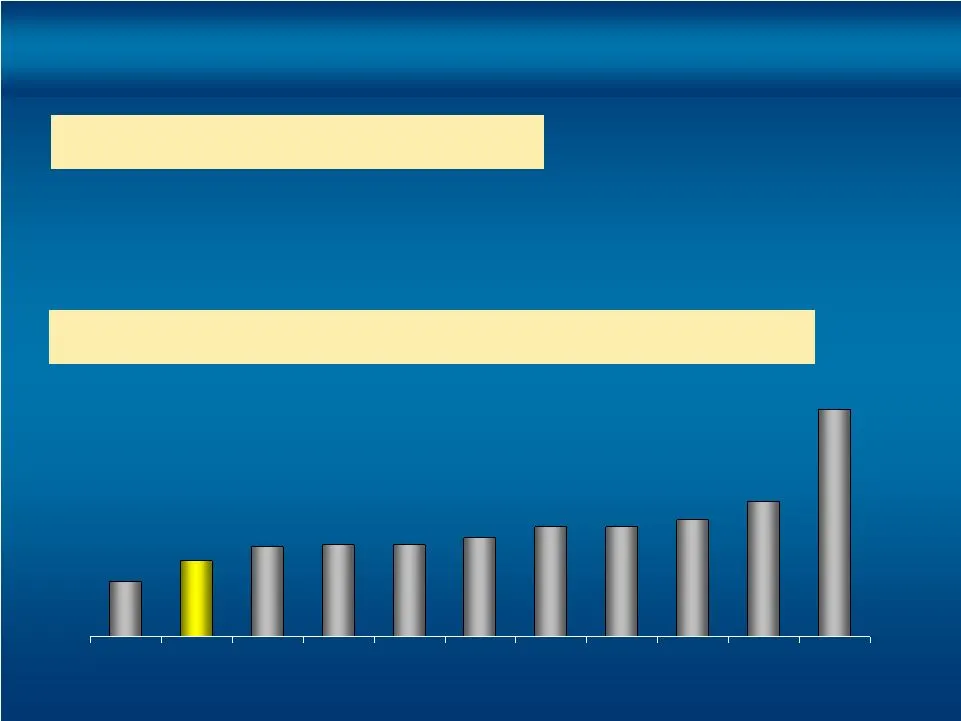
5 Sell-Side Consensus NAV = $97.29 / share $12.50 $17.37 $20.39 $20.87 $20.94 $22.51 $25.04 $25.09 $26.58 $30.94 $51.75 PXD PXP APC APA NBL XTO NFX COG EOG CHK HK (1) Source: Credit Suisse as of 6/20/08; PXP share price $75.71 Valuation – Pre Haynesville Enterprise Value/per BOE Proved Reserves Net
Slide 10: Capital Allocation Analysis
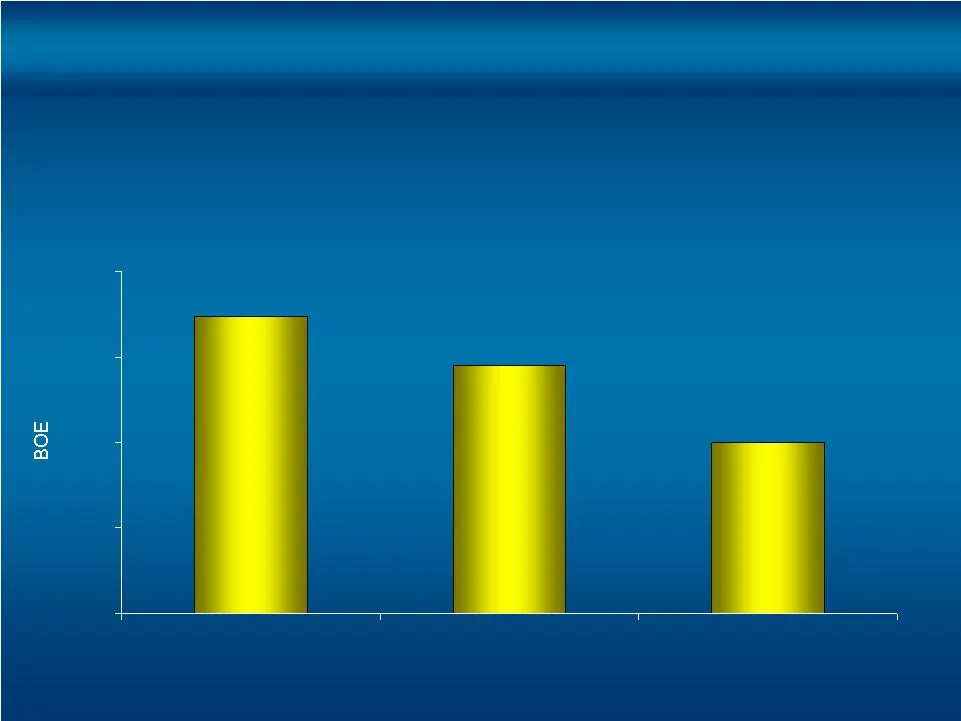
6 $0 $5 $10 $15 $20 PXP F&D PXP H’ville F&D EV/BOE PXP Portfolio Operations PXP H’ville Operation (1) Source: Credit Suisse as of 6/20/08; PXP share price $75.71 Capital Allocation Analysis ± $15.00 BOE $17.37 BOE (1) ~$11.00 BOE
Slide 11
Slide 12
Slide 13: Haynesville Shale: Partnering with Chesapeake
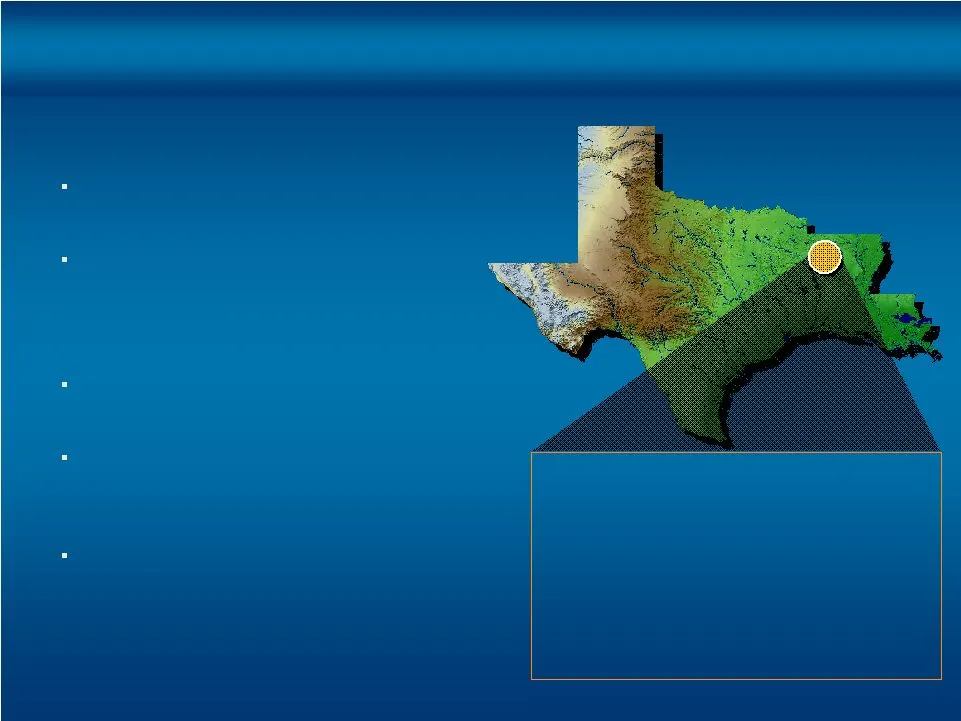
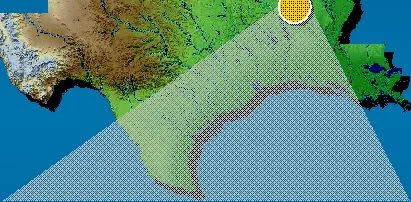
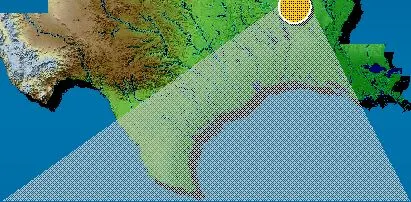
7 Accelerates PXP’s production and reserve growth Acquire 20% of Chesapeake’s dominant 550,000 acre leasehold position in the Haynesville shale, the premier emerging shale resource play Chesapeake as operator and PXP have 6,875 potential well locations Currently drilling with 5 rigs, planning up to

Slide 14: Haynesville Economics
8 PXP Interest: 20% WI / 15% NRI Gross Acreage: 550,000 Potential Locations: 6,875 Est. Gross Resource Potential: 40 Tcfe Est. Median Gross Well Cost: $6.5mm (1) Est. Median Gross EUR per Well: 6.5 Bcfe (1) Assumed D&C costs for first 3 years = $6.5 mm per well, after 3 years = $5.5 mm per well. Hay
Slide 15
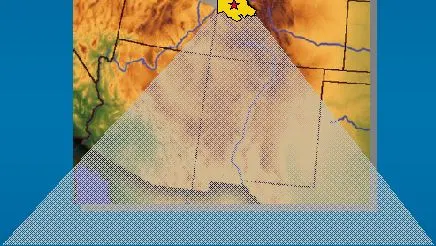
Slide 16
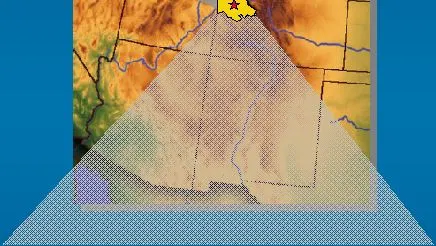
Slide 17: Piceance Basin: Partnership with OXY
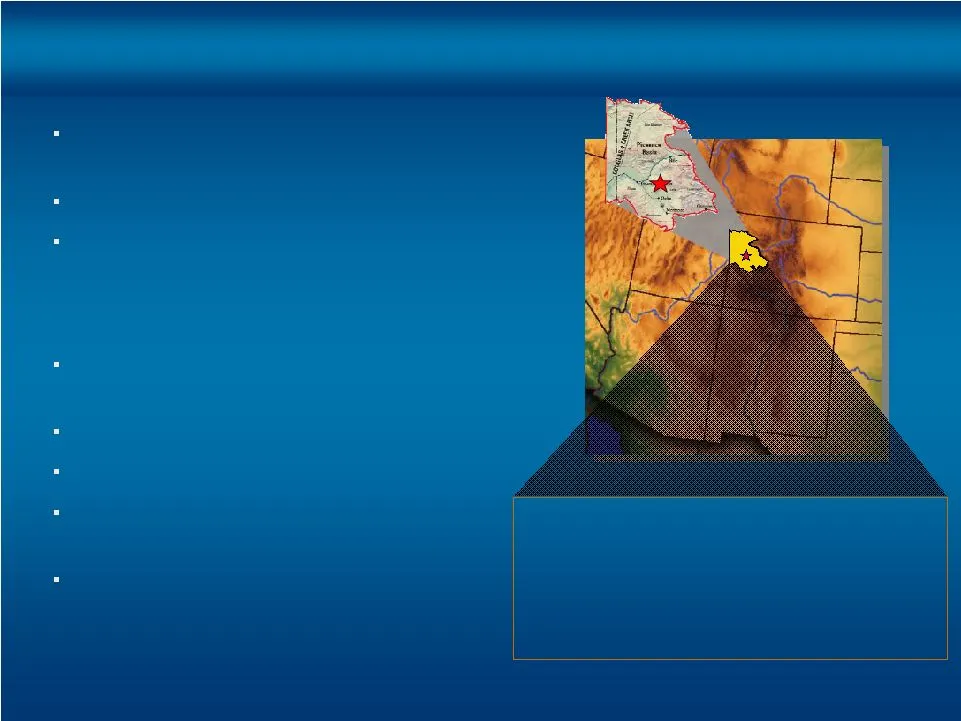
9 Basin covers 1+ million acres Resource potential estimated over 200-300 TCFE of natural gas in place IP = 500 to 1,000 Mcf/d Reserves = 0.6 to 1.0 Bcf One of the largest gas accumulations in North America Estimated 200-300 Tcf of gas in place PXP and OXY each have a 50 percent working interest in

Slide 18: Piceance Basin Economics
10 PXP Interest: 50% WI / 40% NRI Gross Acreage: ~72,000 Potential Locations: ~3,600 Est. Gross Resource Potential: ~3.0 Tcfe Est. Gross Well Cost: $1.5mm Est. Gross EUR per Well: .8 Bcfe Piceance Basin Economics $2.34 Mcfe or $14.06/BOE PXP Net Piceance F&D Cost:
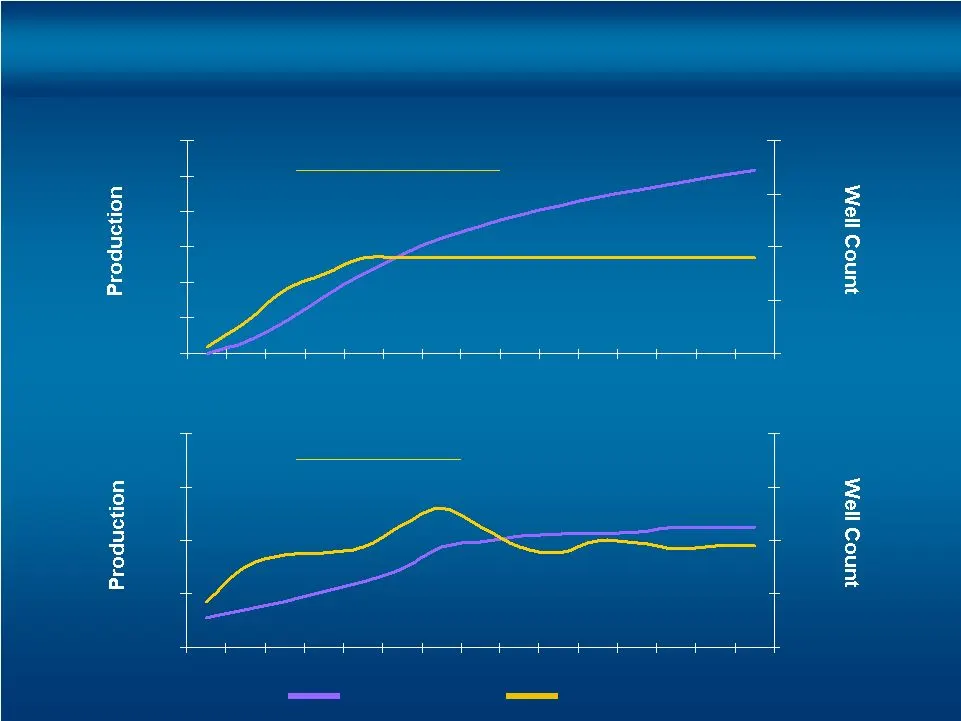
Slide 19: Haynesville & Piceance Well Count/PXP Net Production
11 0 20 40 60 80 100 120 2008 2010 2012 2014 2016 2018 2020 2022 0 200 400 600 800 MBOEPD Number Annual Well Count Production 0 10 20 30 40 2008 2010 2012 2014 2016 2018 2020 2022 0 100 200 300 400 MBOEPD Number Haynesville & Piceance Gross Well Count/PXP Net Production Haynesville Project Piceance
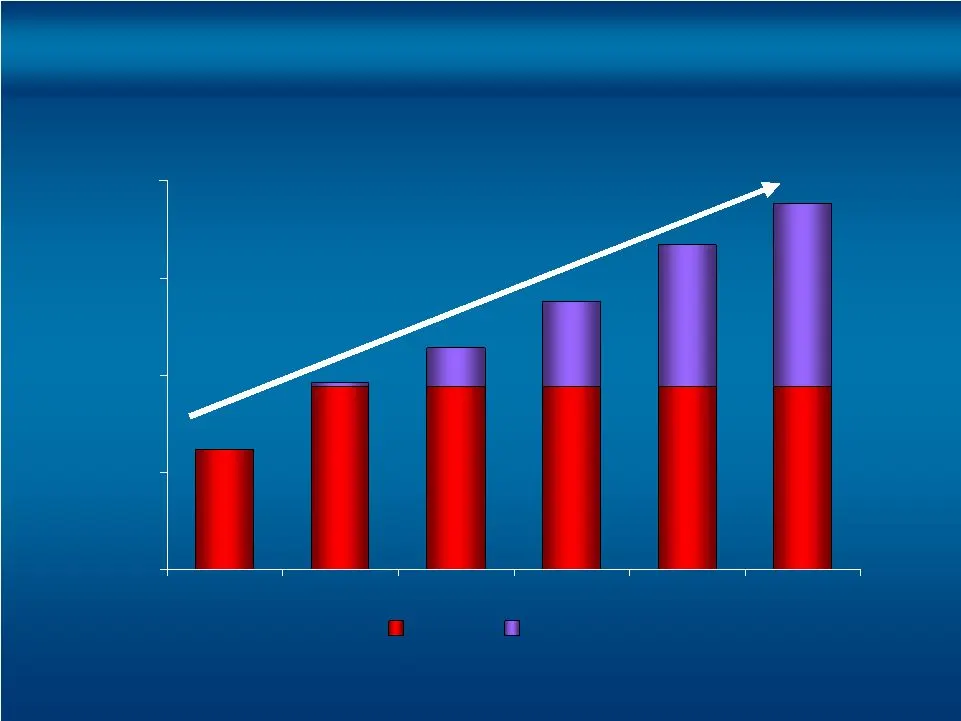
Slide 20: Value Generator – Production Growth
12 0 50 100 150 200 2007 2008e 2009e 2010e 2011e 2012e Base Drillbit Growth 2008e production represents guidance mid-point. 2009 through 2012 represents corporate targets. Drillbit growth includes Haynesville, California Offshore, Gulf of Mexico, Thousand BOEPD Value Generator - Production Growth Pr
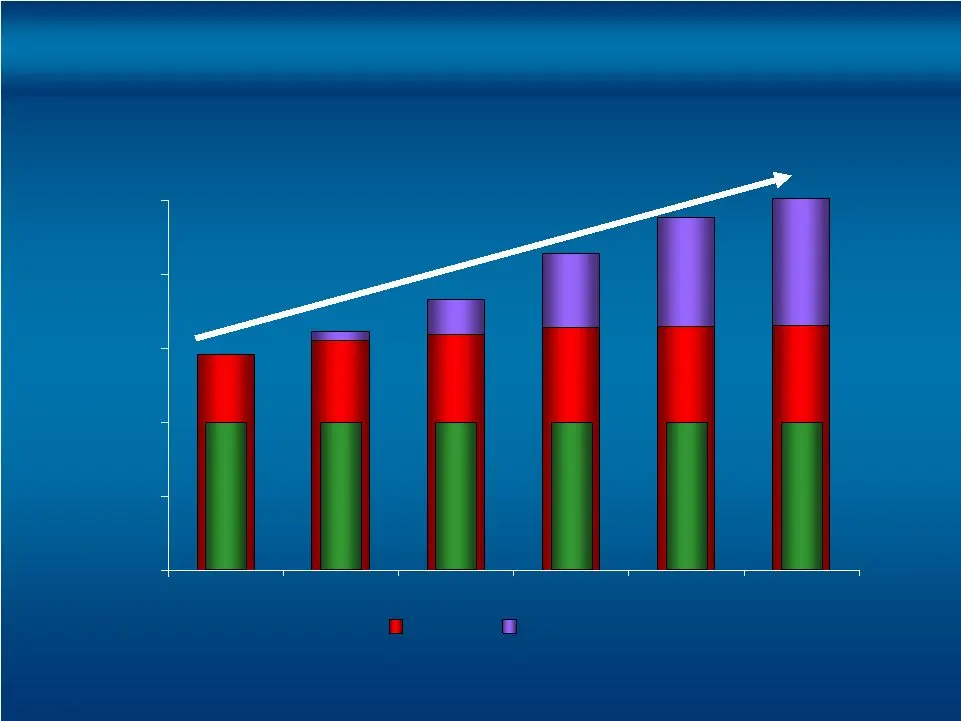
Slide 21: Value Generator – Proved Reserves Growth
13 0 200 400 600 800 1,000 2007 2008e 2009e 2010e 2011e 2012e Base Drillbit Growth Million BOE 63% Oil 65% Oil 59% Oil 53% Oil 47% Oil 18yr R/P 17yr R/P 17yr R/P 17yr R/P 16yr R/P 2008e through 2012e represents corporate targets. Drillbit growth includes Haynesville, California Offshore, Gulf of Mex

Slide 22: 2+ Billion BOE Resource Potential
14 950 MMBOE 230 MMBOE 175 MMBOE 153 MMBOE 36 MMBOE Haynesville California Rockies Permian/Panhandle Gulf of Mexico 100 MMBOE 400 MMBOE 75 MMBOE Rockies - Eagle Gulf of Mexico Vietnam 2+ Billion BOE Resource Potential Potential Reserves ~1.5 Billion BOE Development Resource Potential Region ~575 Mil
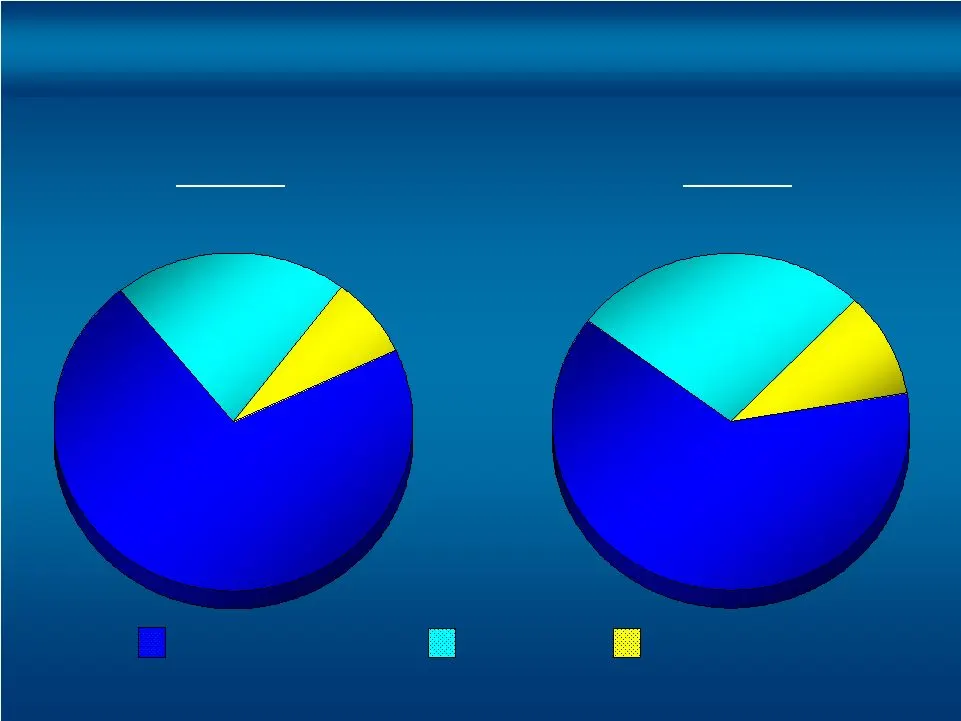
Slide 23: Lower Risk Capital Allocation
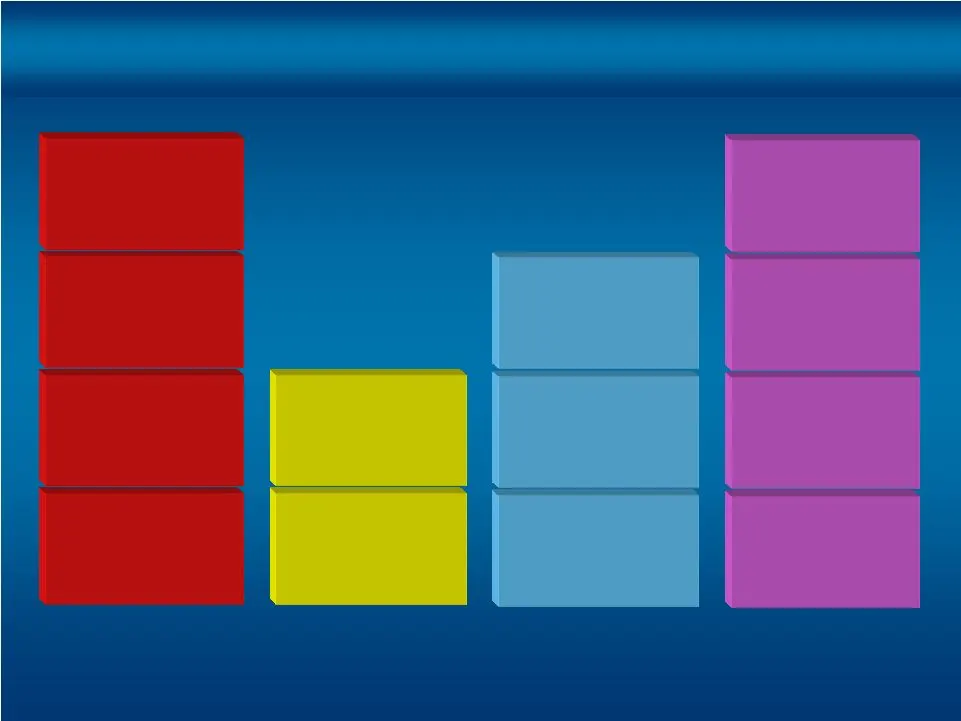
15 71% 2008E $1.5 billion 2009E $1.75 billion 63% Development Capital Haynesville Capital Program Excludes acquisition capital. Development capital includes exploitation, capitalized interest and G&A costs. Exploration Capital Lower Risk Capital Allocation 21% 8% 10% 27%
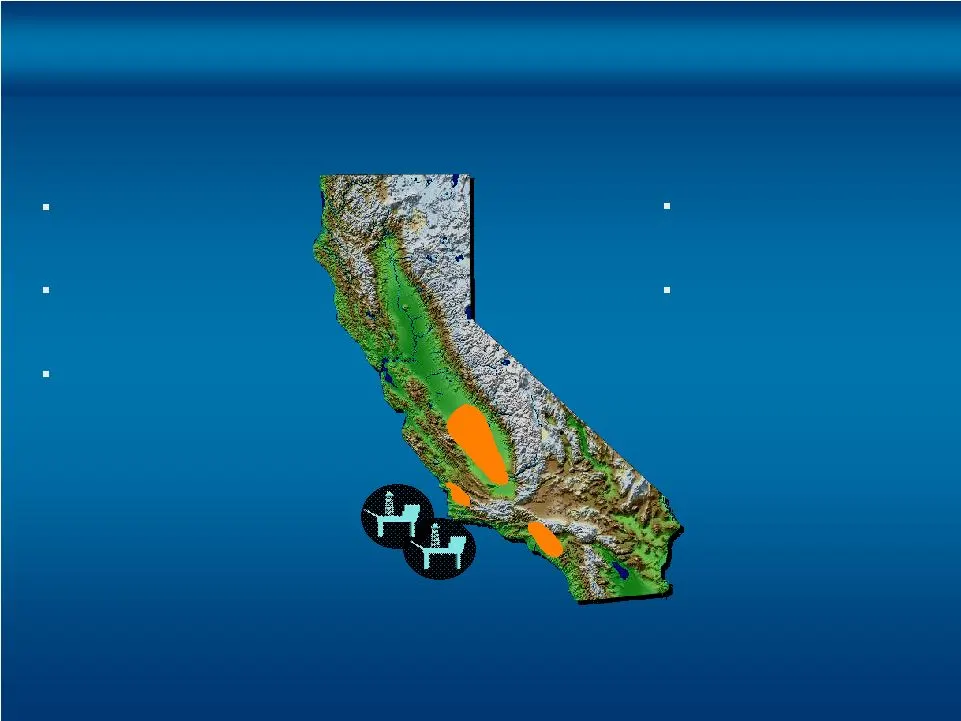
Slide 24
Slide 25: Rockies
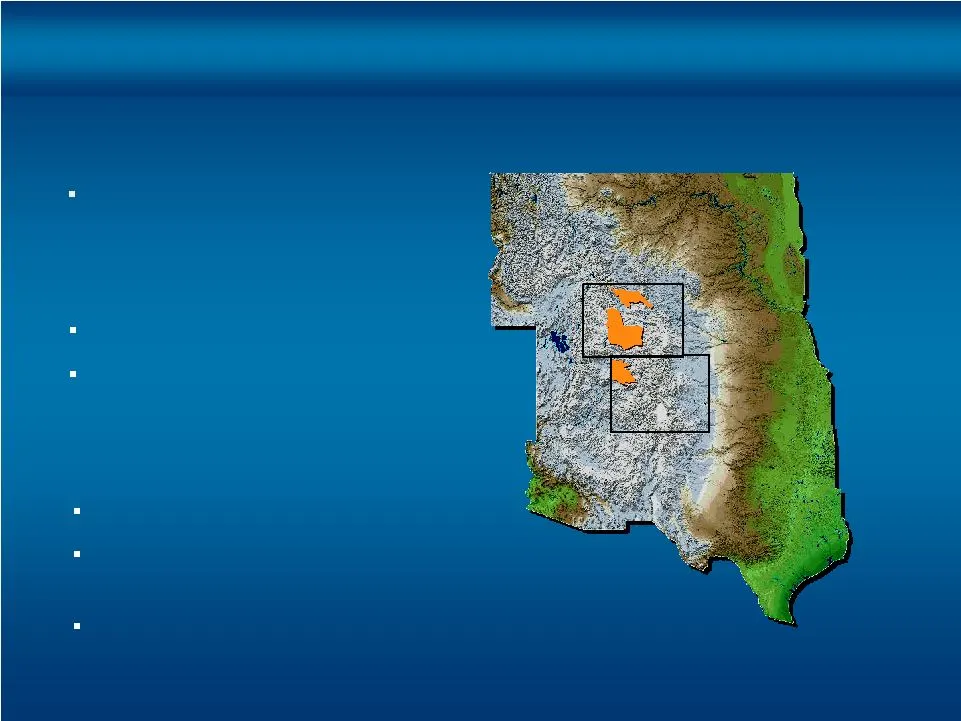
17 39 MMBOE net proved reserves 72,000 acres 44 MMBOE net proved reserves 3,600 potential well locations Reserves: As of 12/31/07. Piceance production and reserves pro forma for OXY sale. The shaded area is for illustrative purposes only and does not reflect actual lease acreage. 60,000 acres Eagle
Slide 26: Permian/Panhandle/South Texas
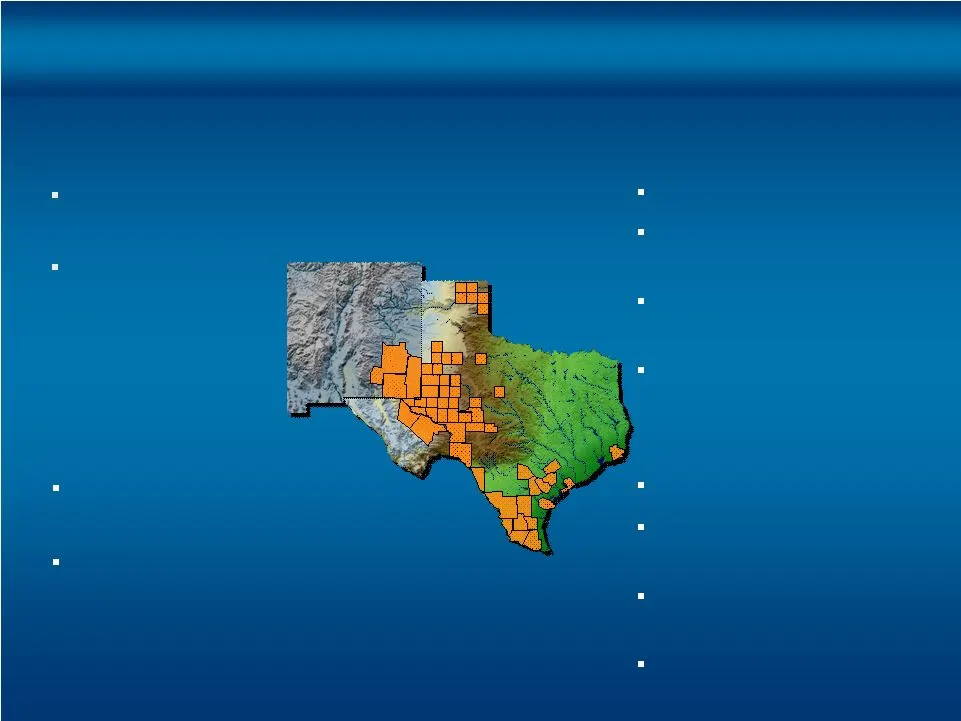
18 48 MMBOE net proved reserves CO 2 enhanced recovery potential 495,000 acres 715 square miles of 3D seismic 41 MMBOE net proved reserves 20 to 30 wells planned in 2008 Reserves: As of 12/31/07. Permian reserves pro forma for OXY sale. The shaded area is for illustrative purposes only and does not
Slide 27: Gulf of Mexico: Success Continues
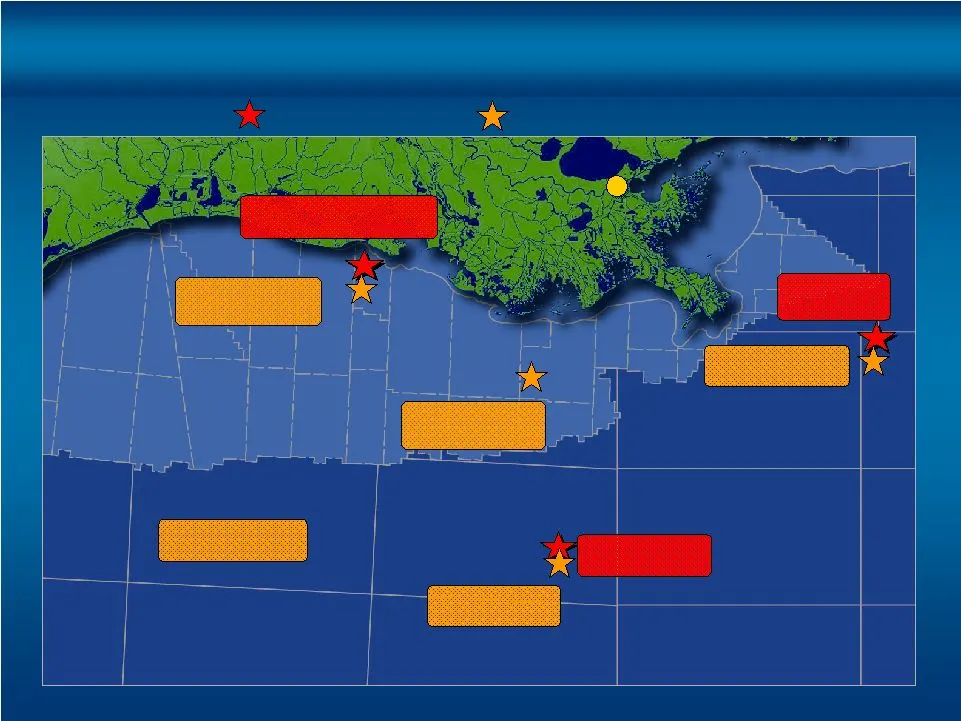
19 Discoveries New Orleans 2008+ Drilling Gulf of Mexico Success Continues Discoveries Friesian Vicksburg Flatrock Field #1,2,3 2008+ Drilling Friesian # 2 Fredricksburg Flatrock 4 wells planned South Timbalier 168 Salida
Slide 28: Upside Growth Drilling Catalysts
20 Salida Eagle Vietnam # 1 2009 Flatrock # 6, # 7 T-Ridge 4Q08 Flatrock # 5 Friesian # 2 2Q08 3Q08 Flatrock # 3, # 4 Mound Point East # 1 South Timbalier 168 # 1 Fredricksburg Haynesville Haynesville Upside Growth Drilling Catalysts Near-Term Project Inventory

Slide 29: 2009 Outlook – Compelling Investment
21 20+% CAGR production growth 2007-2012e 10+% CAGR reserve growth 2007-2012e Per unit LOE lower Per unit F&D lower Commodity price upside with downside protection utilizing attractive floors and collars for a significant percentage of 2008, 2009 and 2010 oil and gas production 2009 Outlook – Compel

Slide 30: Valuation – Pre Haynesville
22 $80 Oil/$8 Natural Gas $100 Oil/$10 Natural Gas NYMEX Strip $90 Oil/$9 Natural Gas Source: JP Morgan Securities Inc. 6/13/2008 Valuation – Pre Haynesville $85/share $126/share $178/share $106/share PXP Net Asset Value PXP Current Share Price - $75.85 +Haynesville ???

Slide 31: Addendum
23 Addendum

Slide 32: Hedging Overview
24 $55.00 Strike Price 32,500 Bbls Crude Oil Put Options 2009 $8.00 Floor $12.11 Ceiling 15,000 MMBtu Natural Gas Collars $10.00 Floor $20.00 Ceiling 150,000 MMBtu Natural Gas Collars $106.16 Strike Price 40,000 Bbls Crude Oil Put Options $55.00 Strike Price 42,000 Bbls Crude Oil Put Options 2008 $6

Slide 33: Income Statement Summary
25 $ 0.28 $ 1.43 EPS (diluted) $ 20.6 $ 163.5 Net Income 36.7 270.2 Income Before Income Tax 62.0 286.0 Income From Operations 54.9 144.2 DD&A & Accretion Expense 22.5 39.9 General Administrative Expense 85.3 153.0 Production Expense $ 224.7 $ 623.1 Revenues March 2007 March 2008 ($000s) $ 4.81 $ 4.

Slide 34: Balance Sheet Summary
26 - 280.4 Cash Held in Escrow 104.4 95.3 Other $9,693.3 $8,297.0 3,338.2 3,245.8 Stockholders’ Equity 1,959.4 1,959.8 Deferred Income Tax 272.6 275.9 Other Long-term Liabilities 3,305.0 2,160.0 Long-term Debt $ 818.1 $ 655.5 Current Liabilities $9,693.3 $8,297.0 536.8 533.4 Goodwill 8,377.2 6,827.9

Slide 35: Operating Cash Flow Reconciliation
27 7 0 0 2 Q 1 Q 2 Q 3 Q 4 Q1 ) s r a l l o d f o s n o i l l i m n i ( 284.8 $ 302.3 $ 144.5 $ 121.3 $ 20.0 $ 87.2 1.9 27.1 15.3 98.1 (21.8) (28.8) (25.6) (25.6) (23.5) 350.2 $ 275.4 $ 146.0 $ 111.0 $ 94.6 $ 2008 The following chart reconciles Net Cash Provided by Operating Activities (GAAP) to Ope
Source: SEC EDGAR · 8-K filed Jul 8, 2008
More decks from Plains Exploration & Production Company
 Global Metals, Mining & Steel Conference 201333 slides · May 14, 2013
 Q1 2013 Earnings Presentation46 slides · Apr 19, 2013
 Merger or Acquisition (February 2013)35 slides · Feb 25, 2013
 2013 Credit Suisse Energy Summit10 slides · Feb 5, 2013
 Merger or Acquisition (January 2013)30 slides · Jan 17, 2013
 Credit Suisse 2012 Energy Summit32 slides · Feb 7, 2012