Enventis — Hickory Tech — Q1 2008 Earnings Presentation
16 slides from Enventis's earnings presentation, May 2, 2008
Slide 1: Investor Update: Q1 2008 Earnings Conference Call
1 Investor Update Investor Update Q1 2008 Earnings Conference Call Q1 2008 Earnings Conference Call May 1, 2008
Slide 2: Forward Looking Statement
2 Information set forth in this presentation contains financial estimates and other forward-looking statements that are subject to risks and uncertainties; therefore, actual results might differ materially from such statements, whether as a result of new information, future events or otherwise. You
Slide 3: Agenda
3 Agenda Agenda John Finke President and Chief Executive Officer David Christensen Senior Vice President and Chief Financial Officer Q1-2008 Earnings | 05.01.08 | HTCO
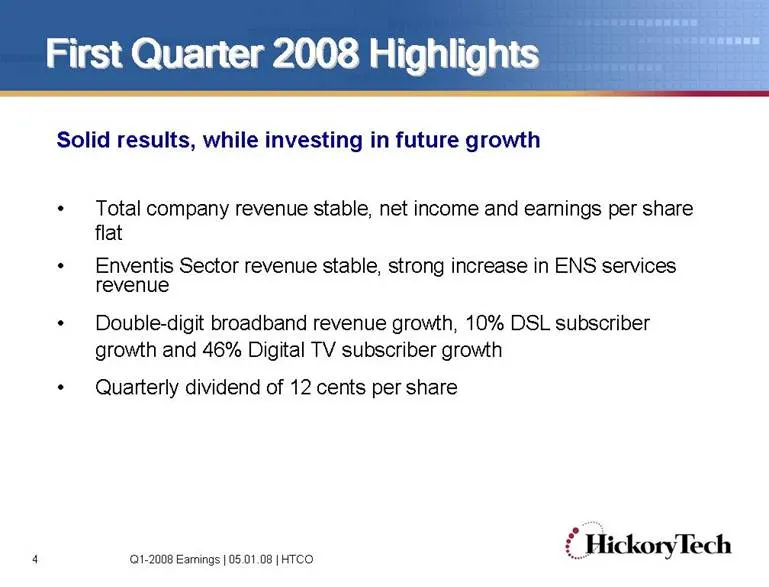
Slide 4: First Quarter 2008 Highlights
4 First Quarter 2008 Highlights First Quarter 2008 Highlights Solid results, while investing in future growth • Total company revenue stable, net income and earnings per share flat • Enventis Sector revenue stable, strong increase in ENS services revenue • Double-digit broadband revenue growth, 10%
Slide 5: Total Company Results
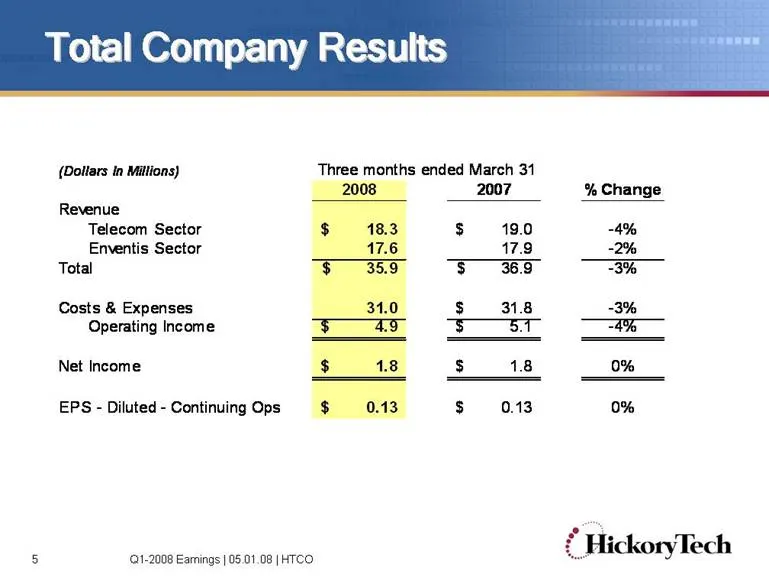
5 Total Company Results Total Company Results Q1-2008 Earnings | 05.01.08 | HTCO 2008 2007 % Change Revenue Telecom Sector 18.3 $ 19.0 $ -4% Enventis Sector 17.6 17.9 -2% Total 35.9 $ 36.9 $ -3% Costs & Expenses 31.0 31.8 $ -3% Operating Income 4.9 $ 5.1 $ -4% Net Income 1.8 $ 1.8 $ 0% EPS - Diluted
Slide 6: Telecom Sector Results
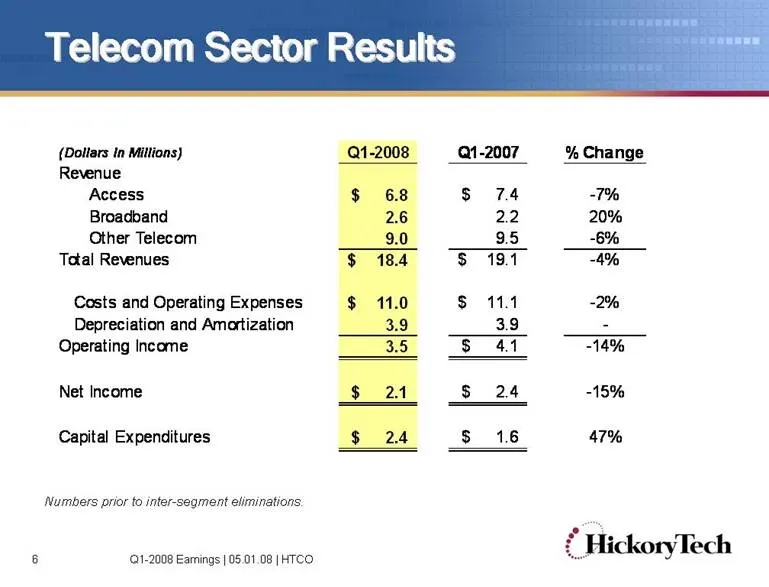
6 Telecom Sector Results Telecom Sector Results Numbers prior to inter-segment eliminations. Q1-2008 Earnings | 05.01.08 | HTCO (Dollars In Millions) Q1-2008 Q1-2007 % Change Revenue Access 6.8 $ 7.4 $ -7% Broadband 2.6 2.2 20% Other Telecom 9.0 9.5 -6% Total Revenues 18.4 $ 19.1 $ -4% Costs and Ope
Slide 7: Network Access Revenue
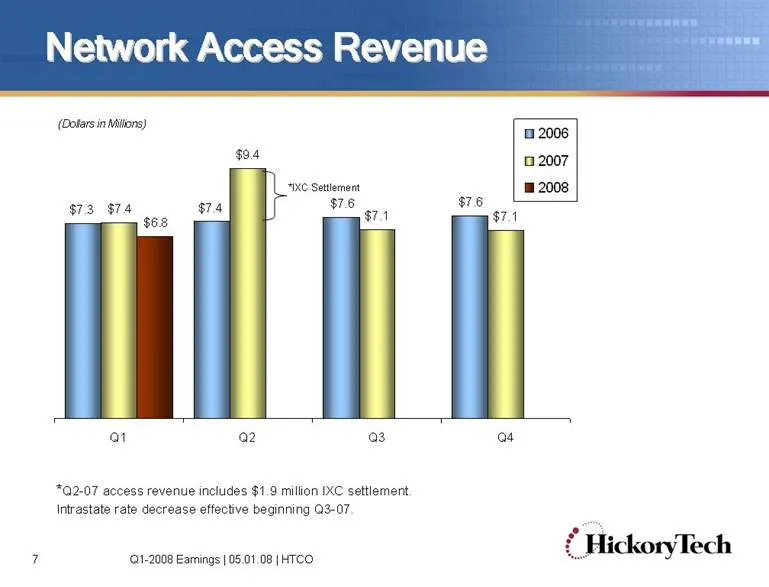
7 Access RevSettlementTotal $7.3 $7.4 $7.6 $7.6 $7.4 $9.4 $7.1 $7.1 $6.8 Q1 Q2 Q3 Q4 (Dollars in Millions) 2006 2007 2008 Network Access Revenue Network Access Revenue *Q2-07 access revenue includes $1.9 million IXC settlement. Intrastate rate decrease effective beginning Q3-07. *IXC Settlement Q1-2
Slide 8: Enventis Sector Results
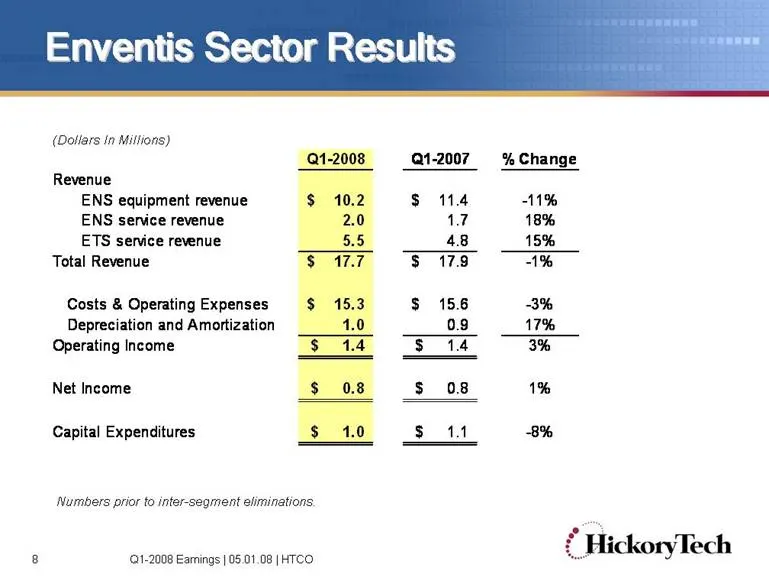
8 Enventis Sector Results Enventis Sector Results Numbers prior to inter-segment eliminations. Q1-2008 Earnings | 05.01.08 | HTCO Q1-2008 Q1-2007 % Change Revenue ENS equipment revenue 10.2 $ 11.4 $ -11% ENS service revenue 2.0 1.7 18% ETS service revenue 5.5 4.8 15% Total Revenue 17.7 $ 17.9 $ -1%
Slide 9: Enventis Product Line Results
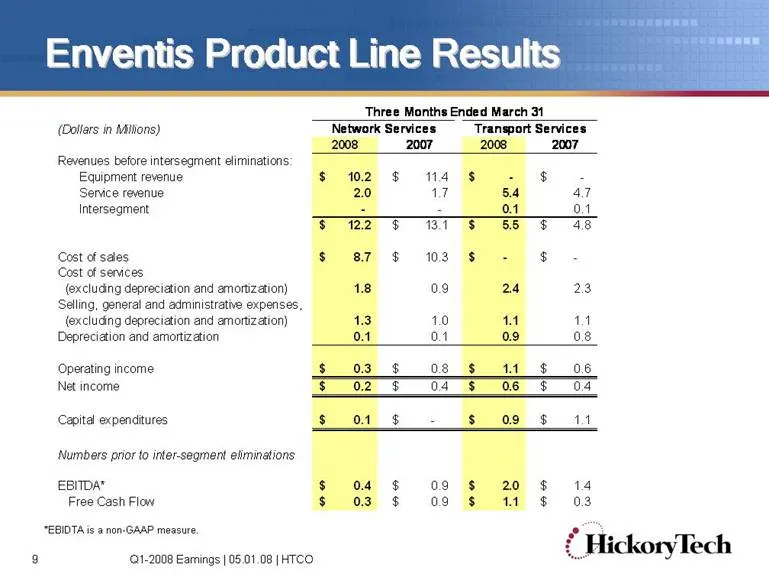
9 Enventis Product Line Results Enventis Product Line Results *EBIDTA is a non-GAAP measure. Q1-2008 Earnings | 05.01.08 | HTCO (Dollars in Millions) 2008 2007 2008 2007 Revenues before intersegment eliminations: Equipment revenue 10.2 $ 11.4 $ - $ - $ Service revenue 2.0 1.7 5.4 4.7 Intersegment -
Slide 10: Enventis Revenue
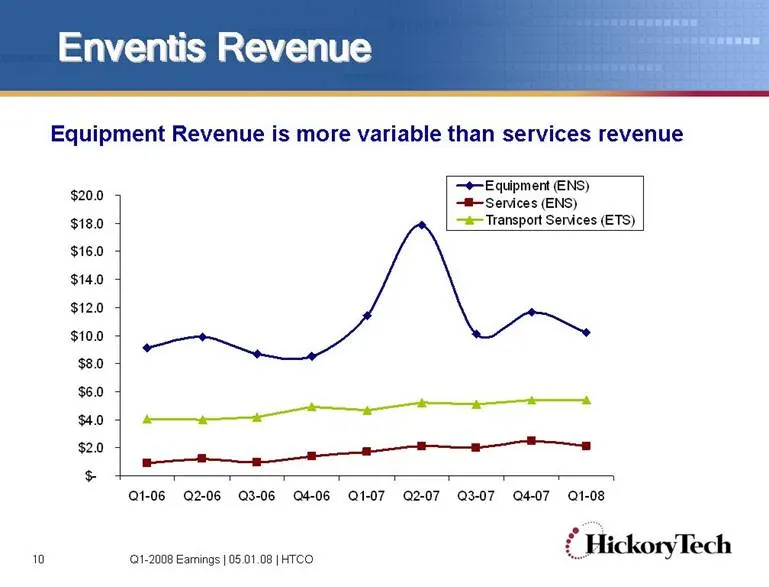
10 Enventis Revenue Enventis Revenue Equipment Revenue is more variable than services revenue Q1-2008 Earnings | 05.01.08 | HTCO $- $2.0 $4.0 $6.0 $8.0 $10.0 $12.0 $14.0 $16.0 $18.0 $20.0 Q1-06 Q2-06 Q3-06 Q4-06 Q1-07 Q2-07 Q3-07 Q4-07 Q1-08 Equipment (ENS) Services (ENS) Transport Services (ETS)
Slide 11: Costs and Expenses
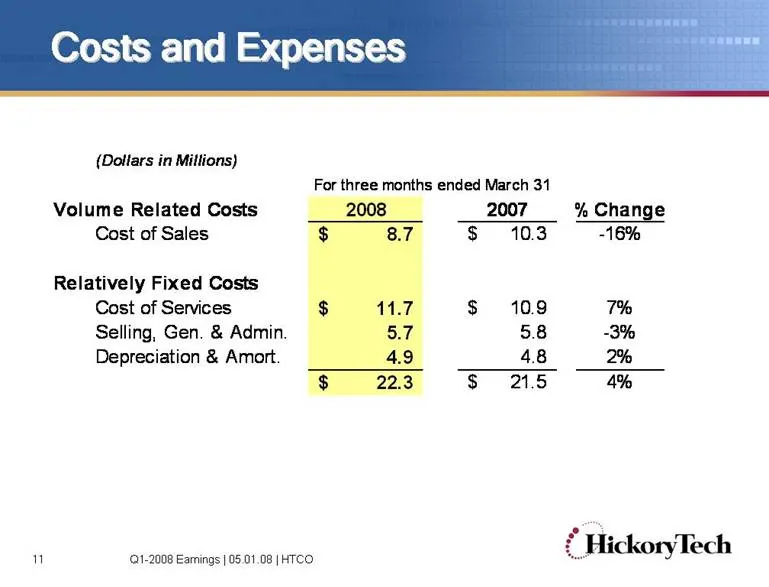
11 Costs and Expenses Costs and Expenses Q1-2008 Earnings | 05.01.08 | HTCO (Dollars in Millions) Volume Related Costs 2008 2007 % Change Cost of Sales 8.7 $ 10.3 $ -16% Relatively Fixed Costs Cost of Services 11.7 $ 10.9 $ 7% Selling, Gen. & Admin. 5.7 5.8 -3% Depreciation & Amort. 4.9 4.8 2% 22.3
Slide 12: Debt Level
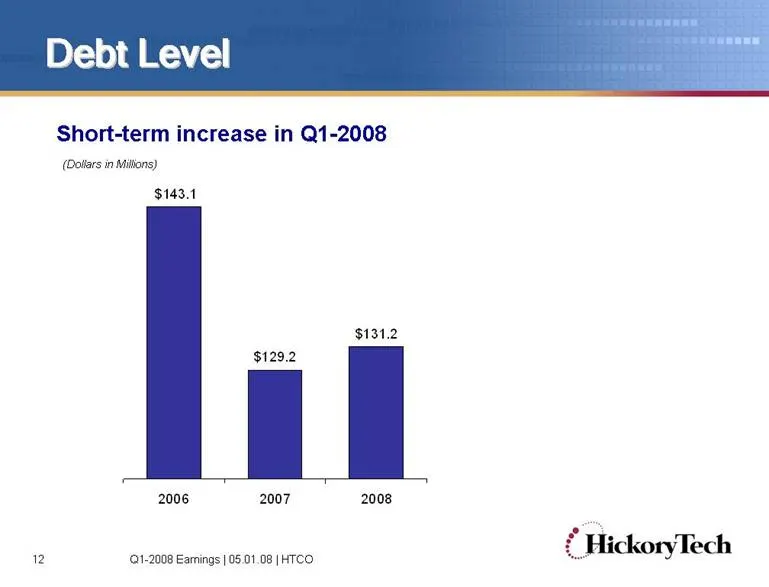
12 Debt Level Debt Level Short-term increase in Q1-2008 Q1-2008 Earnings | 05.01.08 | HTCO (Dollars in Millions) $129.2 $131.2 $143.1 2006 2007 2008
Slide 13: Free Cash Flow
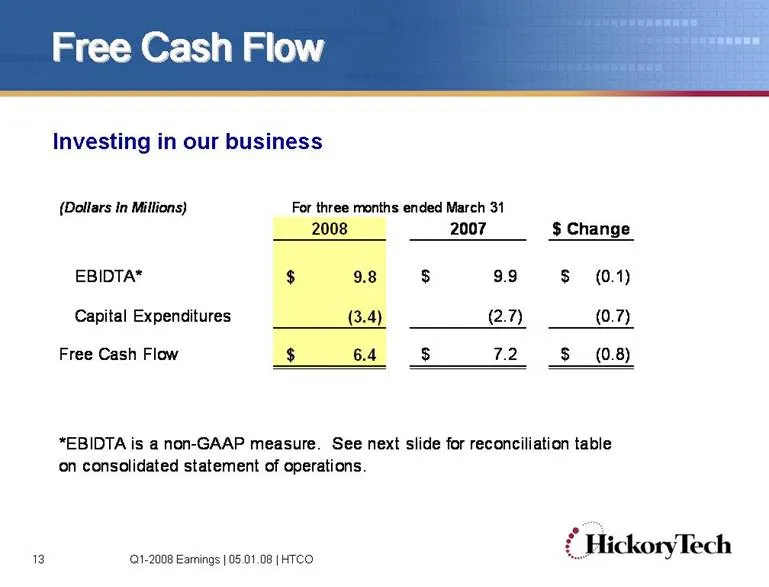
13 Free Cash Flow Free Cash Flow Investing in our business Q1-2008 Earnings | 05.01.08 | HTCO 2008 2007 $ Change EBIDTA* 9.8 $ 9.9 $ (0.1) $ (3.4) (2.7) (0.7) Free Cash Flow 6.4 $ 7.2 $ (0.8) $ (Dollars In Millions) For three months ended March 31 Capital Expenditures *EBIDTA is a non-GAAP measure.
Slide 14: Reconciliation of Operating Income to EBITDA
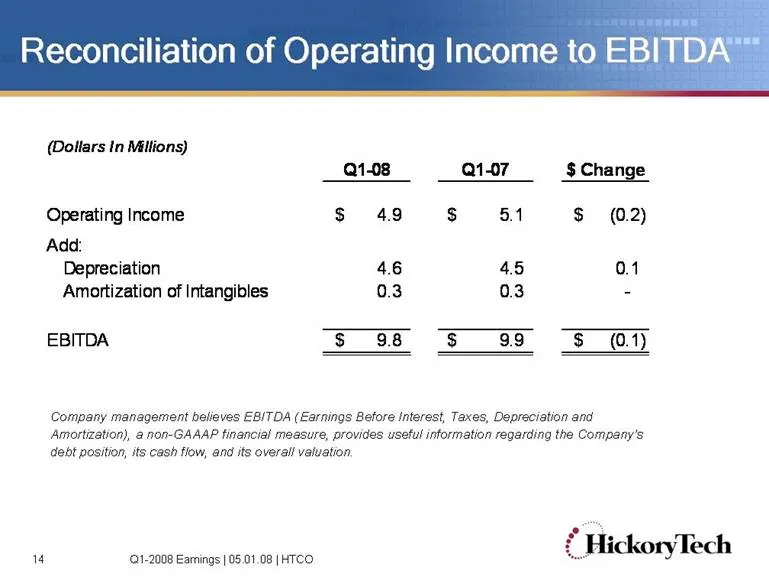
14 Reconciliation of Operating Income to EBITDA Reconciliation of Operating Income to EBITDA Q1-2008 Earnings | 05.01.08 | HTCO Company management believes EBITDA (Earnings Before Interest, Taxes, Depreciation and Amortization), a non-GAAAP financial measure, provides useful information regarding th
Slide 15: Summary
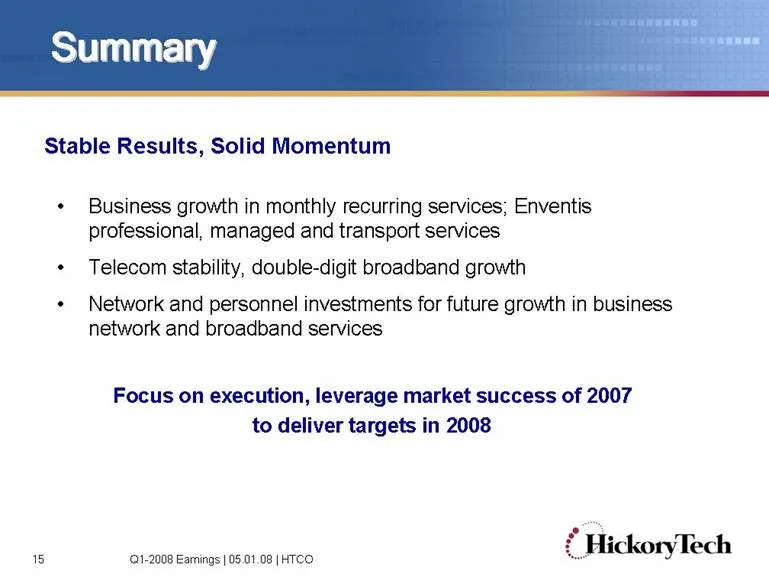
15 Summary Summary Q1-2008 Earnings | 05.01.08 | HTCO Stable Results, Solid Momentum • Business growth in monthly recurring services; Enventis professional, managed and transport services • Telecom stability, double-digit broadband growth • Network and personnel investments for future growth in busi
Slide 16: HickoryTech Service Area
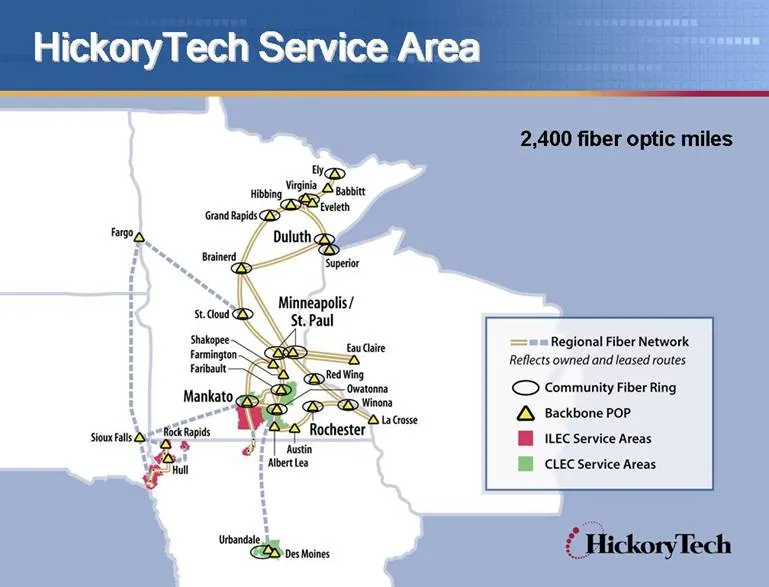
16 Q4-2007 Earnings | 02.28.08 | HTCO HickoryTech Service Area HickoryTech Service Area 2,400 fiber optic miles
Source: SEC EDGAR · 8-K filed May 2, 2008
More decks from Enventis Corp
 Merger or Acquisition (June 2014)12 slides · Jun 30, 2014
 Hickory Tech — Shareholder Meeting (May 2014)36 slides · May 7, 2014
 Hickory Tech — Q1 2014 Earnings Presentation16 slides · May 2, 2014
 Hickory Tech — Deutsche Bank Media, Internet and Telecom Conference 201431 slides · Mar 11, 2014
 Hickory Tech — Q4 2013 Earnings Presentation21 slides · Mar 4, 2014
 Hickory Tech — Q3 2013 Earnings Presentation16 slides · Nov 7, 2013