Verasun Energy — Merger or Acquisition (November 2007)
20 slides from Verasun Energy's merger presentation, Nov 30, 2007
Slide 1: Creating the leading biofuels company
@ ww VeraSun ENERGY - ___Creating the leading i biofuels company
Slide 2: Transaction Overview
Transaction Overview Gordon Ommen Chairman of the Board
Slide 3: The New VeraSun: A Global Leader in Biofuels
The New VeraSun Ethanol Production Capacity (current) (mmgy) LTM 9/30/07 EBITDA ($mm) ¹ LTM 9/30/07 Revenue ($mm) Ethanol Production Capacity (expected) (mmgy) Market Capitalization ($mm) ³ Adjusted Enterprise Value ($mm) 3,4 Tangible Assets ($mm) ² A Global Leader in Biofuels 1,578 2,408 2,597 1,18
Slide 4: Key Transaction Terms
Key Transaction Terms Required for both parties Shareholders representing approximately 33% of US BioEnergy and approximately 20% of VeraSun have signed voting agreements in favor of the transaction Shareholder Vote Customary for transactions of this size and structure, including Hart-Scott-Rodino c
Slide 5: Key Highlights: Proven Leadership
Key Highlights Proven Leadership - Over 100 combined years of industry experience spanning all facets of the business - Significant bench strength for long-term success in business - Retention program in place for key team members 25 years of successful entrepreneurship Founded US BioEnergy in 2004
Slide 6: Strategic Rationale
Strategic Rationale Don Endres Chief Executive Officer
Slide 7: Accelerated Growth
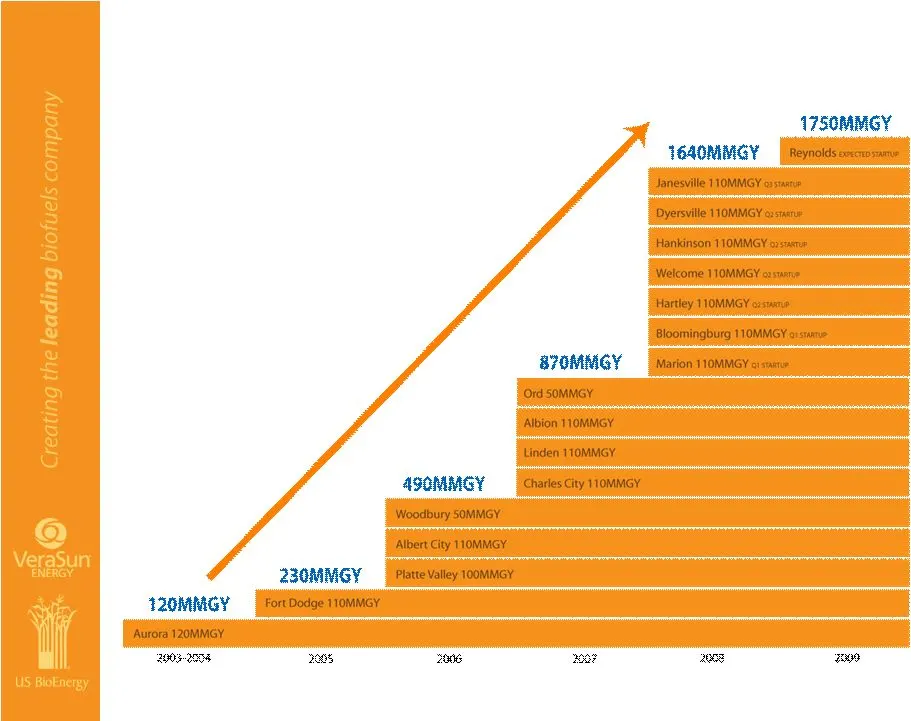
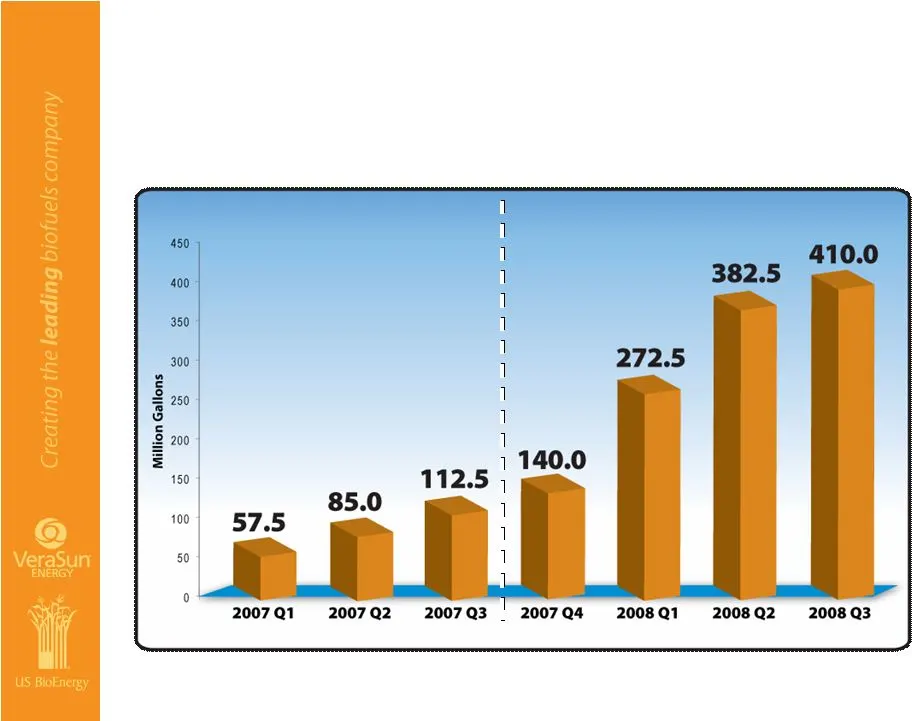
Accelerated Growth More than 1.6 BGY by end of 2008
Slide 8: Combined Quarterly Capacity Growth
Combined Quarterly Capacity Growth
Slide 9: How Do We Compare?
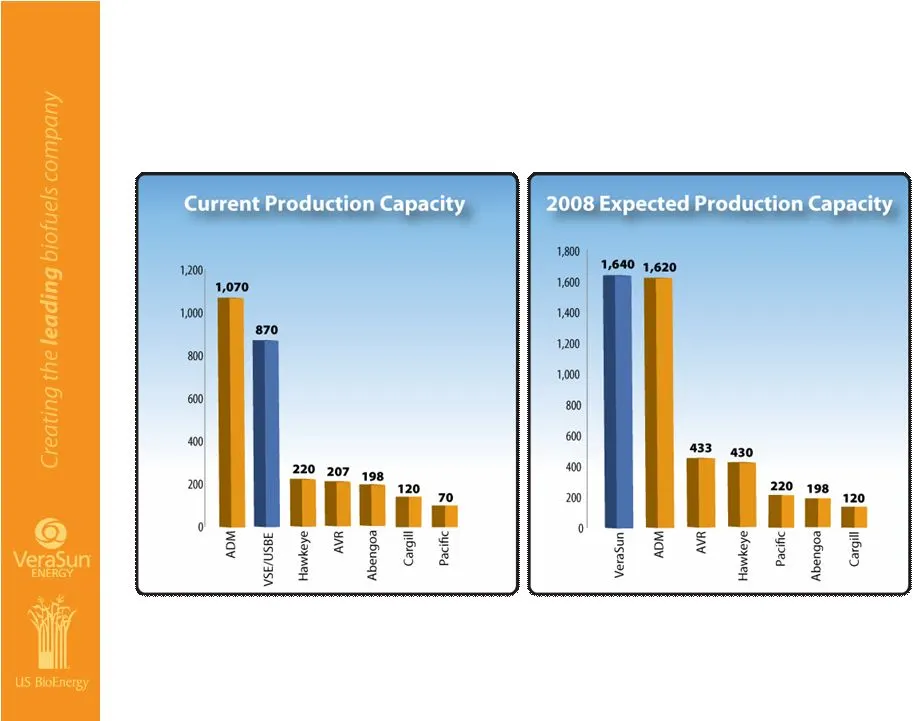
How Do We Compare? Source: Renewable Fuels Association as of November 27, 2007.
Slide 10: Complementary Geographic Footprint
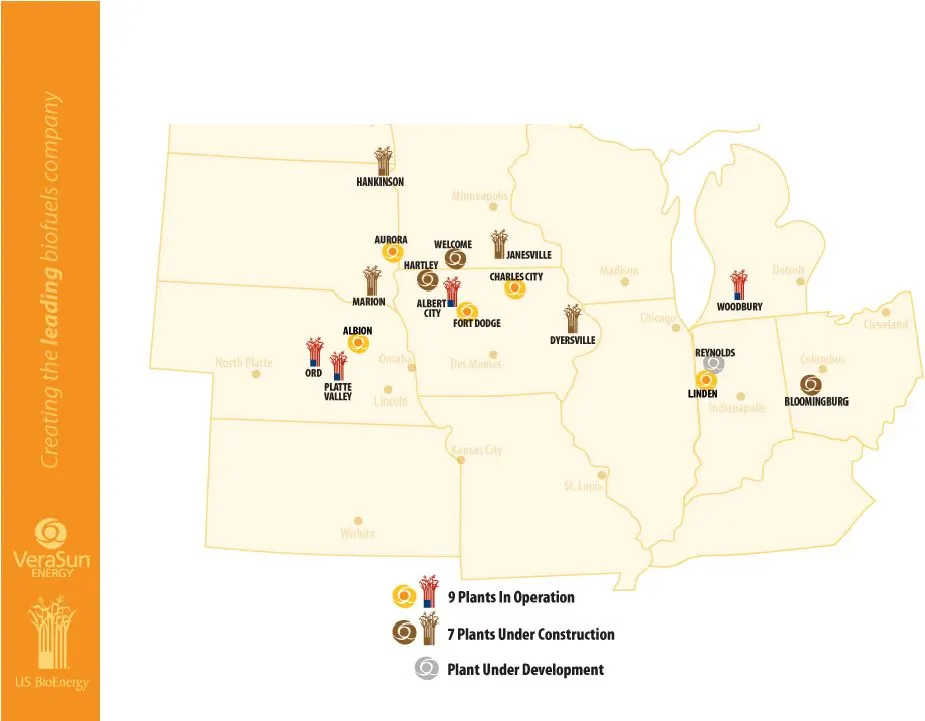
Complementary Geographic Footprint
Slide 11: Large, Low-Cost Production Facilities
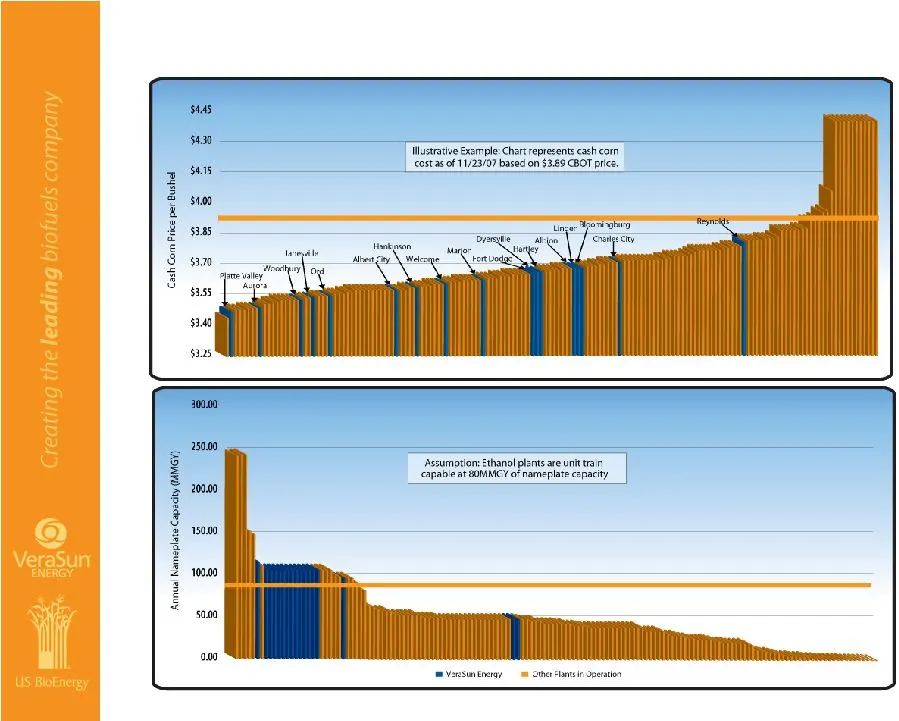
Large, Low-Cost Production Facilities Source: Renewable Fuels Association Website and DTN Database
Slide 12: Complementary Strategic Contributions
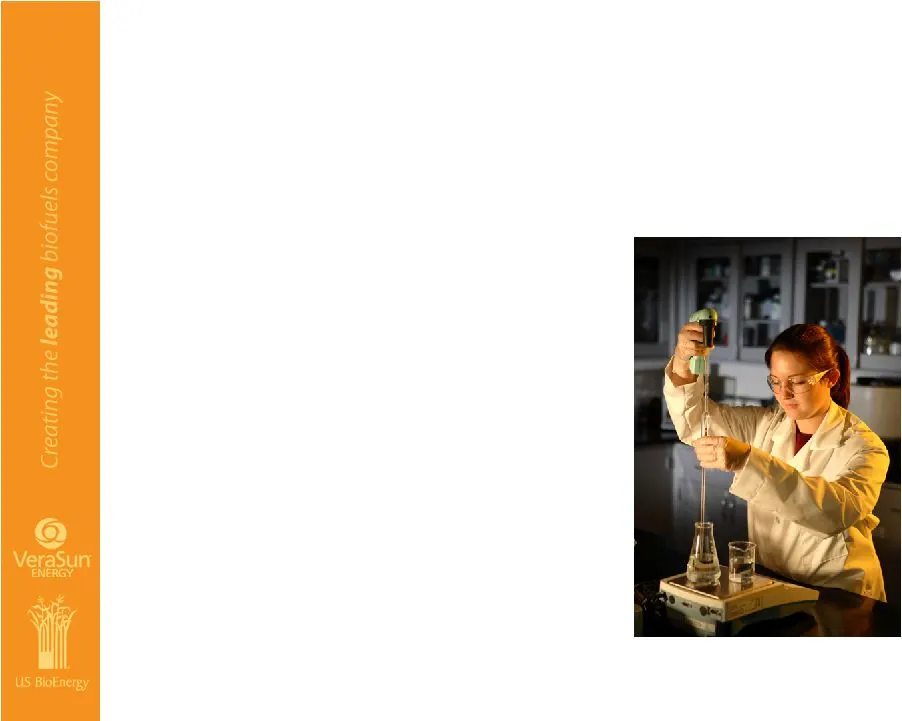
Complementary Strategic Contributions Opportunity to roll out technology across combined plant fleet US Bio Process Technology TM – In development for five years – Consistent and stable plant operation – More gallons per bushel – Higher production rates – Consistent DDGS – Includes Lean Six Sigma Pr
Slide 13: Corn Oil Extraction
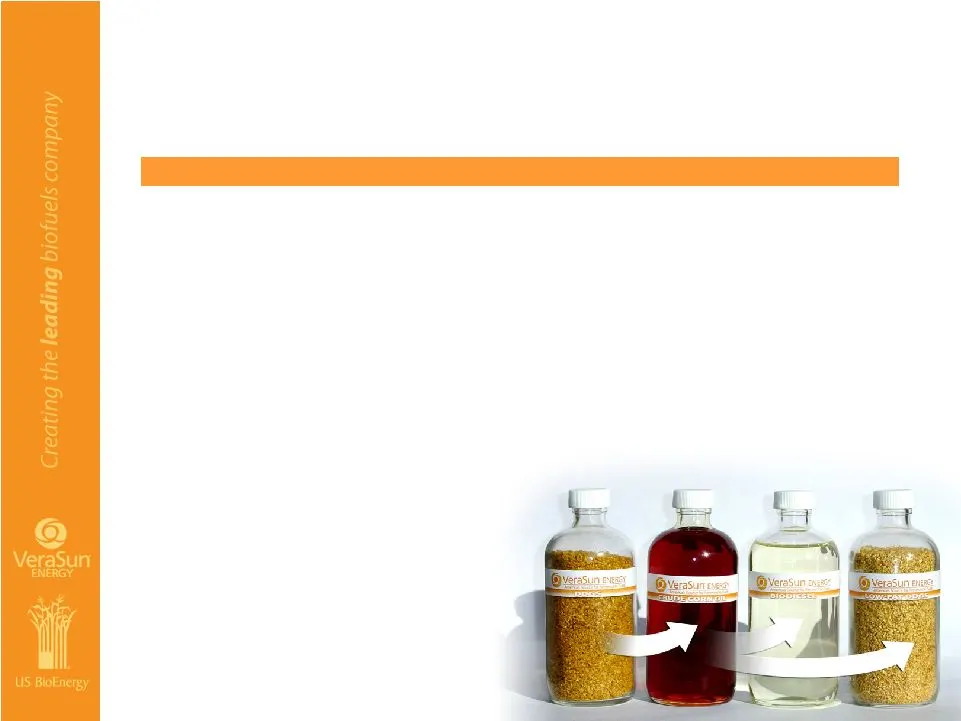
Corn Oil Extraction Complementary Strategic Contributions Opportunity to roll out technology across combined plant fleet • Innovative process extracts corn oil from DDGS • Extracting 150–175 lbs of oil from each ton • Improved economics: At today’s prices, incremental EBITDA of approximately $0.15 p
Slide 14: Solomon Brand Distillers Dried Grains
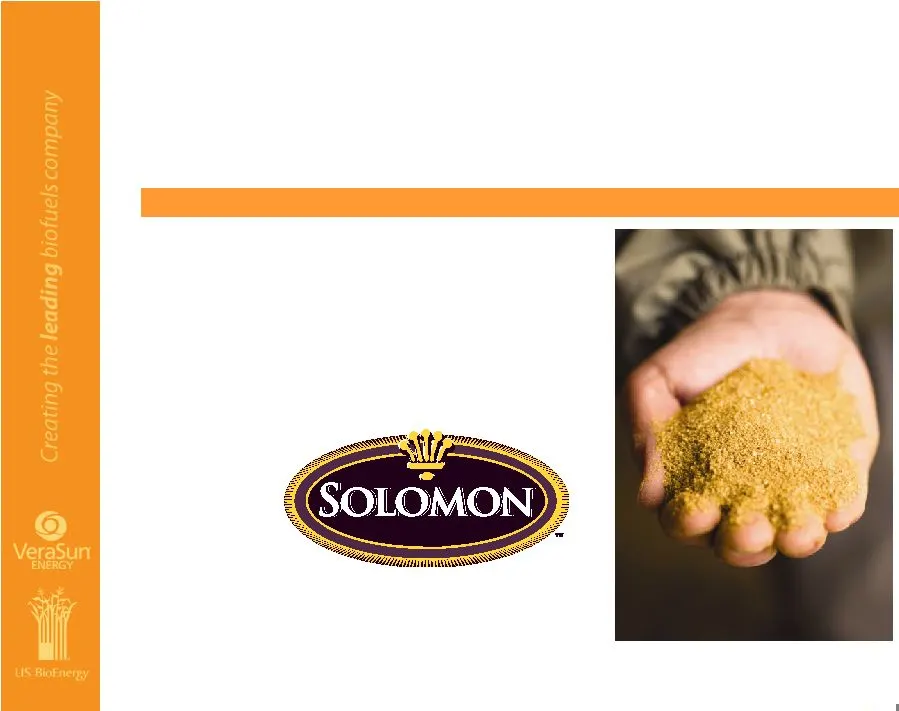
Solomon Brand Distillers Dried Grains Complementary Strategic Contributions • Solomon brand distillers dried grains with solubles (DDGS) are produced to a strict quality standard, which are third-party tested to ensure safe, nutritional DDGS.
Slide 15: The US BioEnergy Partnership Network
Complementary Strategic Contributions • Fortune 500 Company • The third largest grain marketer and largest member-owned energy company in the US • Fagen, Inc. has constructed more than 70 percent of the ethanol capacity built in the United States since 2000 • 50/50 joint venture with CHS • Currently
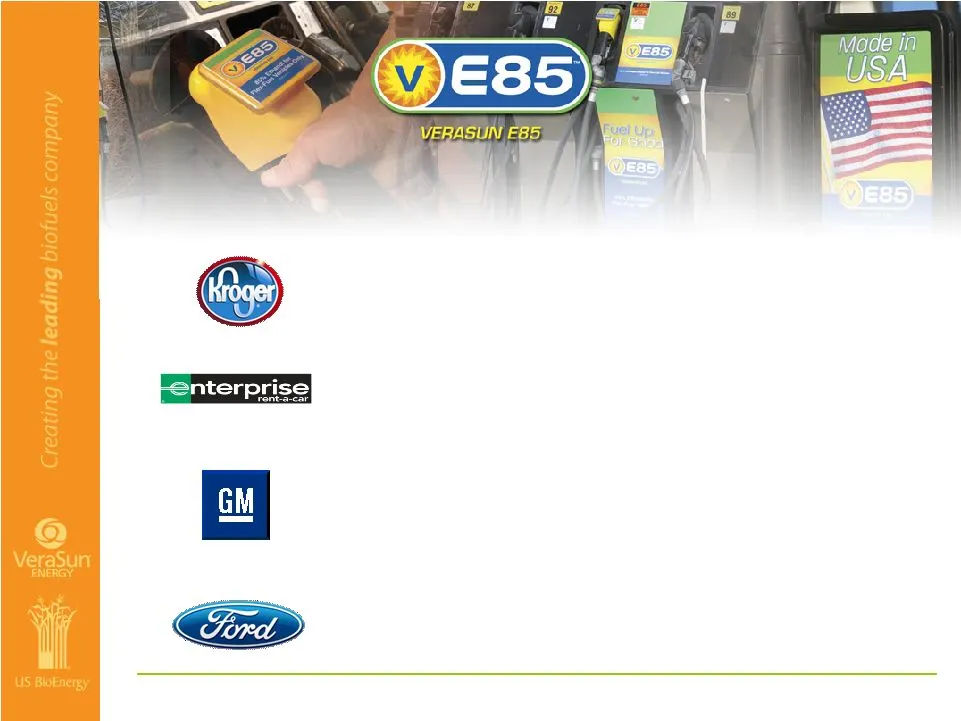
Slide 16: Complementary Strategic Contributions: VE85 Footprint
Complementary Strategic Contributions Opportunity to significantly expand VE85 TM footprint VeraSun, Ford Open Industry-First Ethanol Corridor In America's Heartland © 2006 Ford Motor Company © 2006 General Motors Corporation August 2007 Kroger Becomes First National Retailer to Sell VeraSun’s Brand
Slide 17: Significant Potential For Synergies
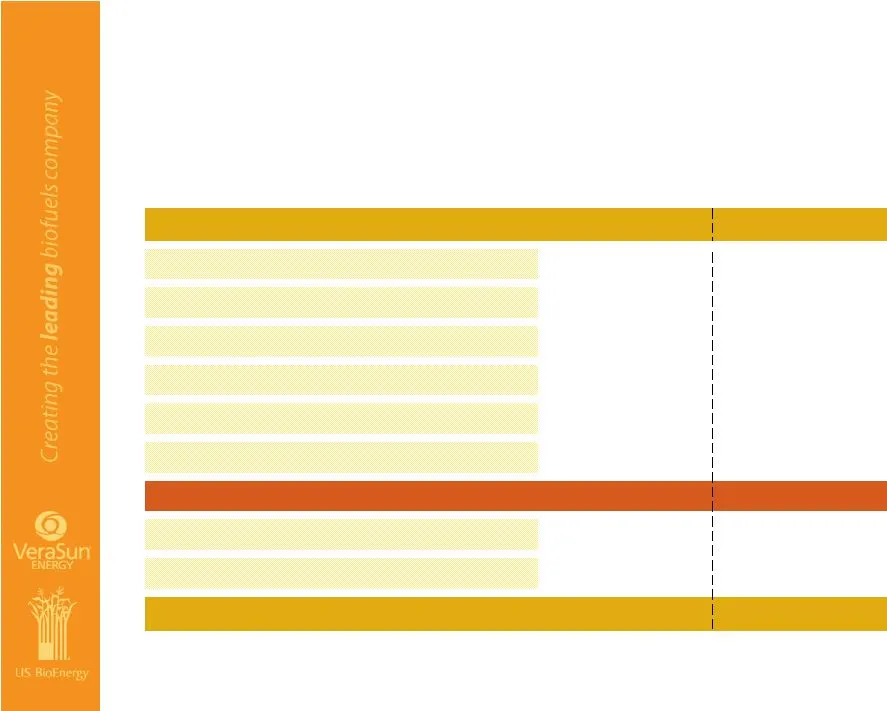
$/gallon $mm Opportunity $80-$160 $50-$100 $0.05-$0.10 $0.03-$0.06 Cost synergies Total synergies Significant Potential For Synergies $0.05 - $0.10 or $80 - $160 million per year in synergy opportunities may be achievable in 18 months after combination $15-$30 $15-$30 $10-$20 $10-$20 $5-$10 $5-$10 $
Slide 18: Creating the leading biofuels company
@ ww VeraSun ENERGY - ___Creating the leading i biofuels company
Slide 19: Appendix
Appendix
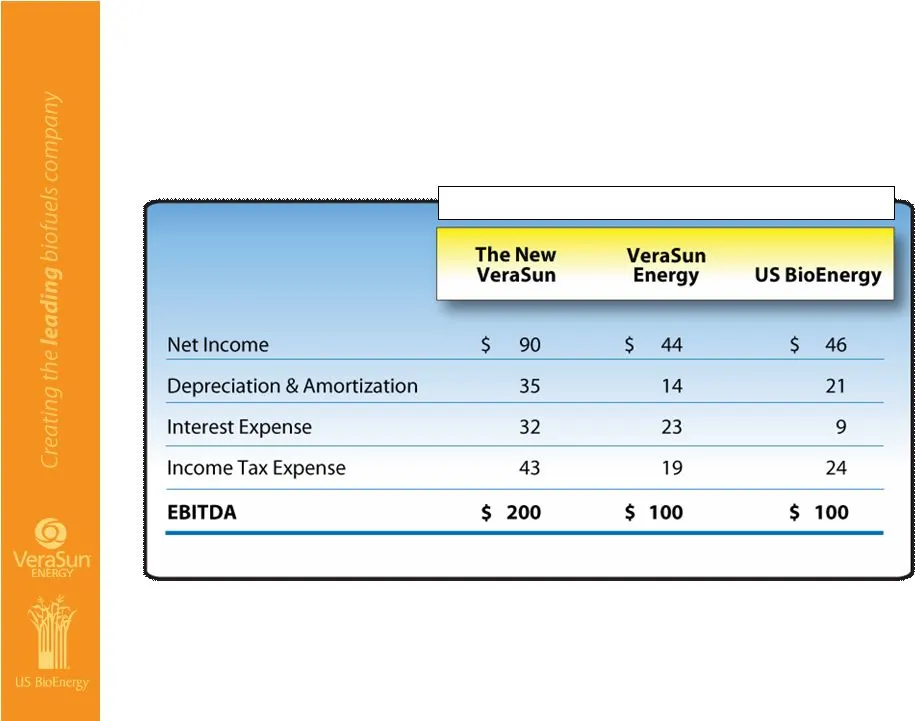
Slide 20: Net Income to EBITDA Reconciliation
Net Income to EBITDA Reconciliation ($ in Millions) Twelve Months Ended 9/30/07
Source: SEC EDGAR · 425 filed Nov 30, 2007