Questcor Pharmaceuticals — JP Morgan Healthcare Conference 2011
32 slides from Questcor Pharmaceuticals's conference presentation, Jan 10, 2011
Slide 1: Exhibit 99.2
Exhibit 99.2
Slide 2: JP Morgan Healthcare Conference, January 2011
JANUARY 2011 JP Morgan Healthcare NASDAQ: QCOR C O N F E R E N C E JANUARY 2011 JP Morgan Healthcare NASDAQ: QCOR C O N F E R E N C E
Slide 3: Safe Harbor Statement
3 Safe Harbor Statement Note: Except for the historical information contained herein, this presentation contains forward-looking statements that are based on management's current expectations and beliefs and are subject to a number of risks, uncertainties and assumptions that could cause actual resu
Slide 4: Questcor Overview
4 Questcor Overview A biopharmaceutical company whose product helps patients with serious, difficult-to-treat medical conditions A biopharmaceutical company whose product helps patients with serious, difficult-to-treat medical conditions
Slide 5: Questcor Overview
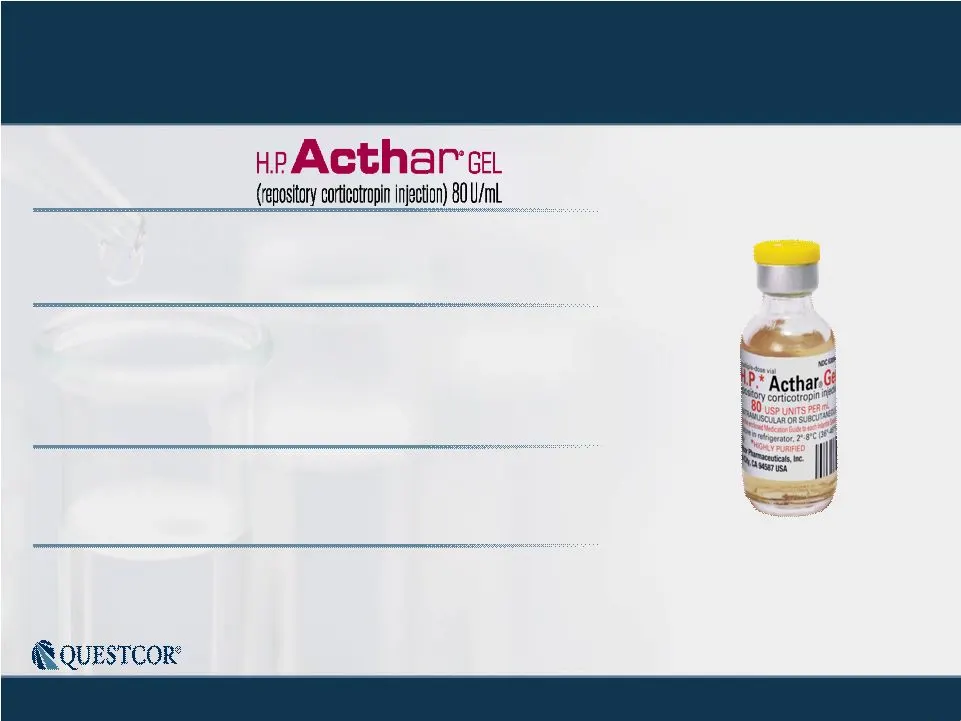
5 Questcor Overview Flagship Product: • Profitable, cash flow positive, $115M in cash, debt-free • 19 approved indications Key Markets: • Multiple Sclerosis, Infantile Spasms, Nephrotic Syndrome • Combined markets opportunity exceeds $1.5 billion Strategy: • Grow Acthar sales in each key market Fina
Slide 6: History of Acthar
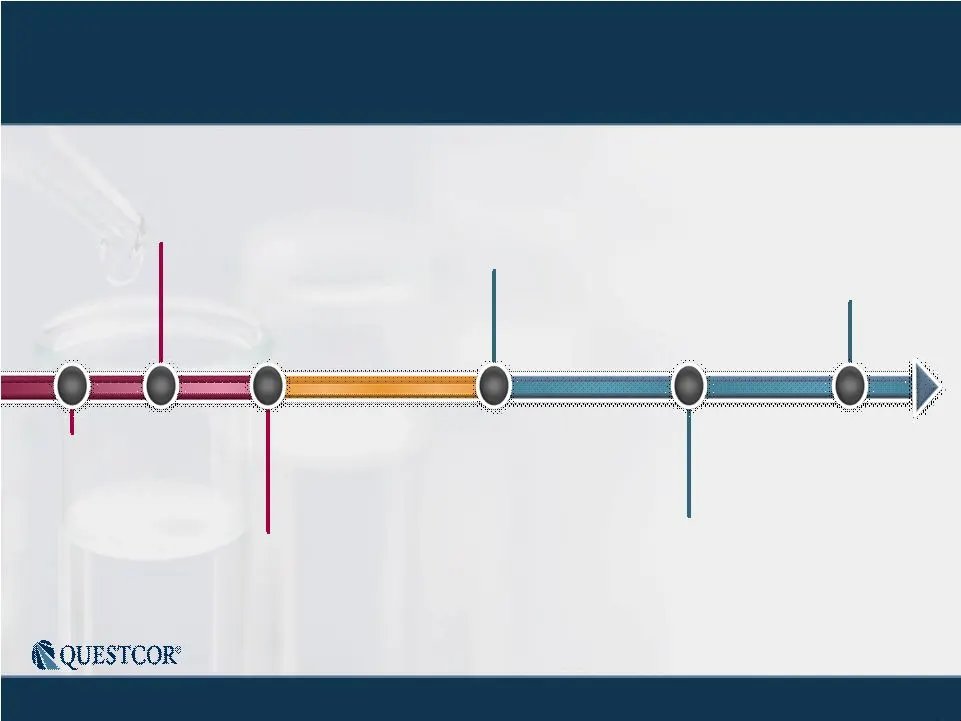
6 History of Acthar 1950 2000 2010 1952 First Approved 1968-1973 DESI Review Label Expands 1950 1978 MS Indication Added 2000 2001 Questcor Acquires Acthar 2010 Label Modernized 19 Indications 2007 Questcor Changes Strategy 2010
Slide 7: Significant Barriers to Entry
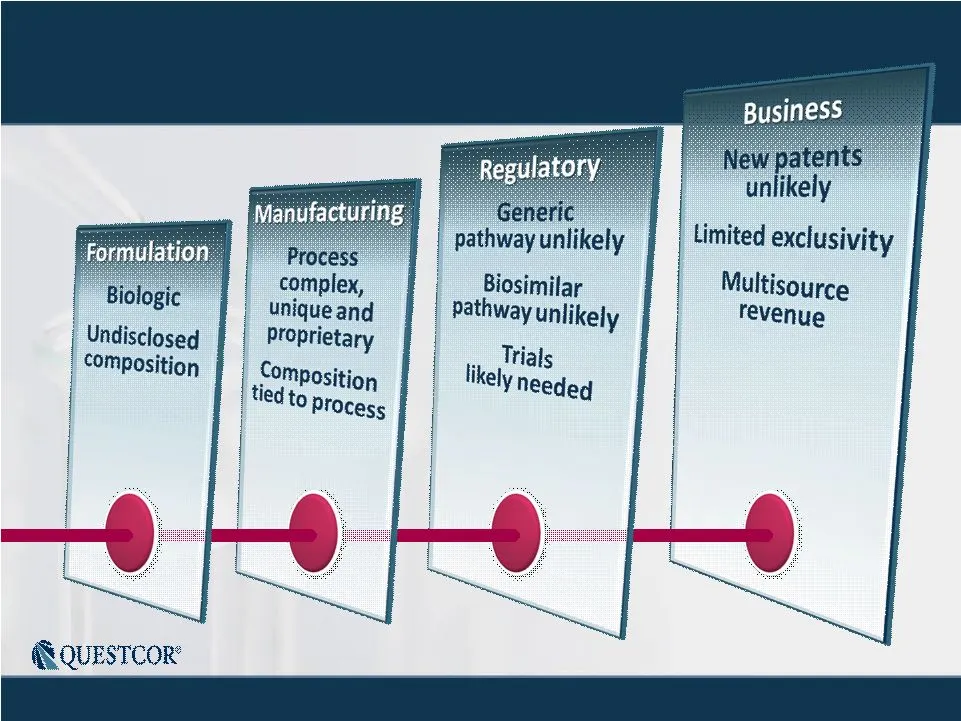
7 Significant Barriers to Entry
Slide 8: Questcor Growth Engine
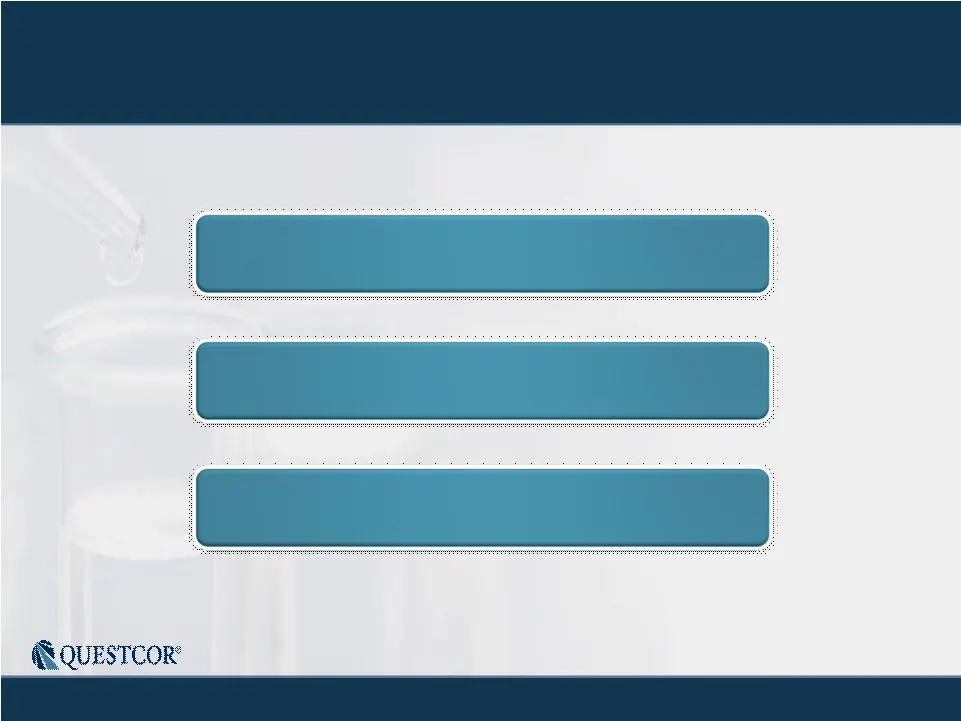
8 Questcor Growth Engine Multiple Sclerosis Infantile Spasms Nephrotic Syndrome Multiple Sclerosis Infantile Spasms Nephrotic Syndrome
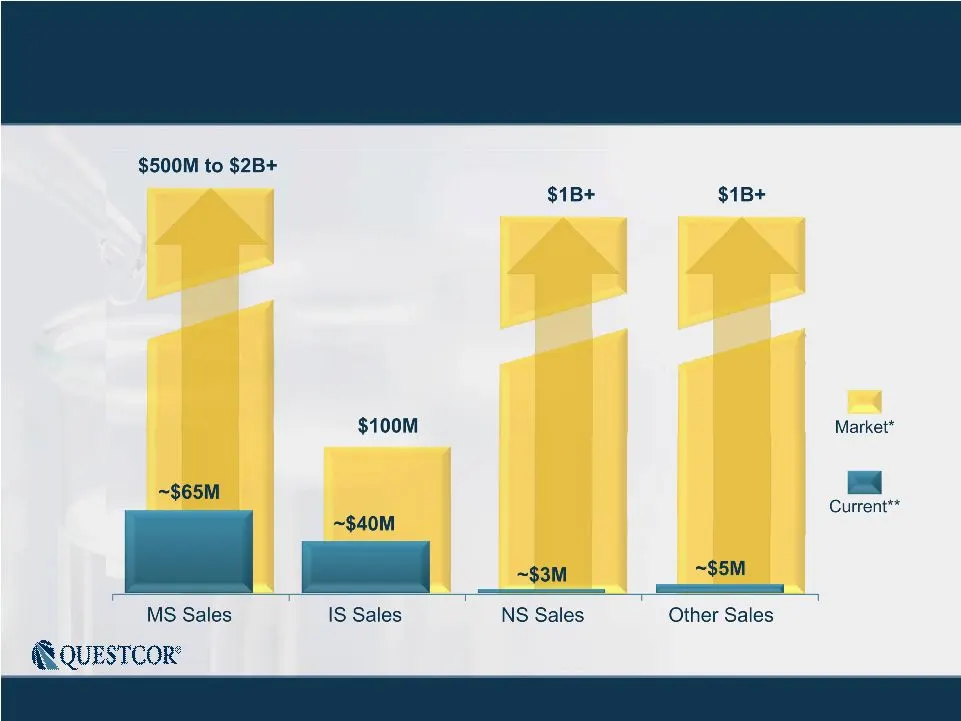
Slide 9: Large Market Opportunity
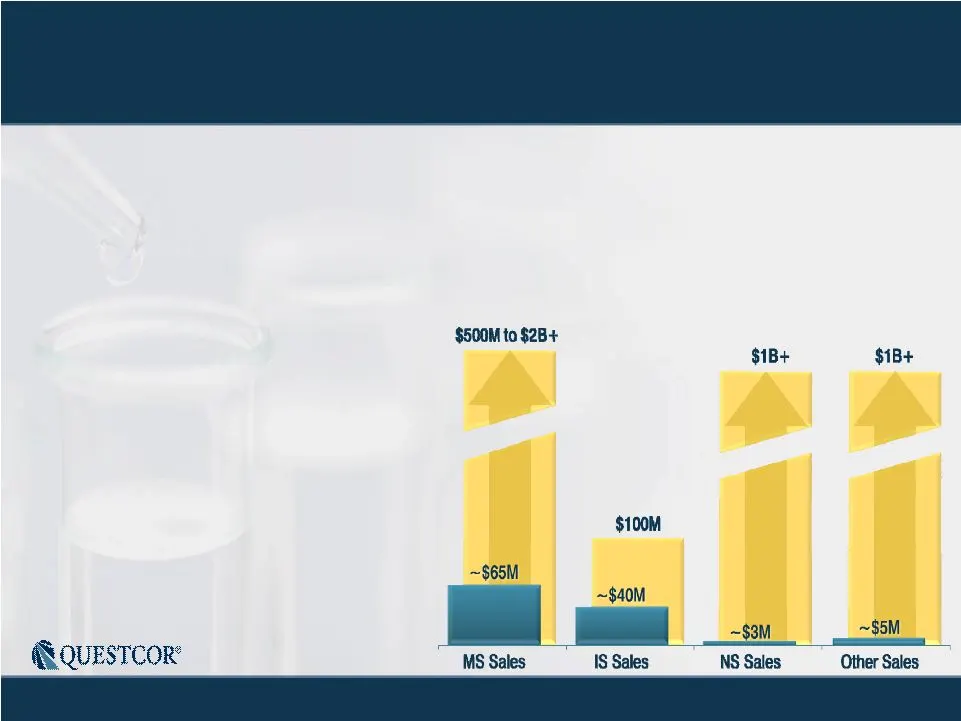
9 Large Market Opportunity *Represents estimated net sales market opportunity based on internal company estimates ** Represents approximate current net sales annualized run rate based on internal company estimates
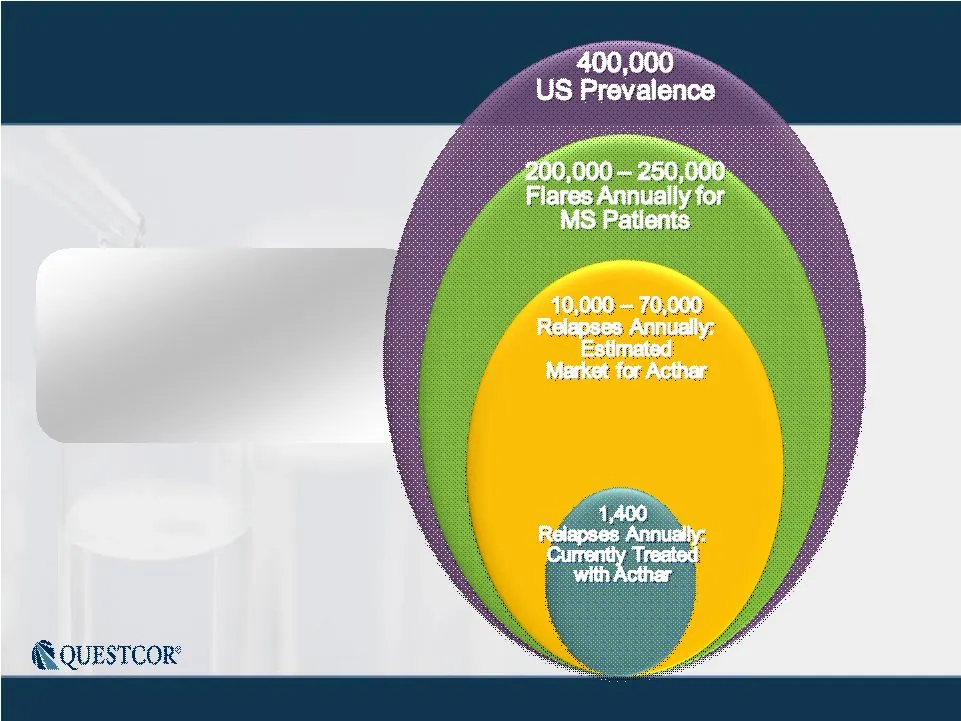
Slide 10: Multiple Sclerosis: $500M to $2B+ Potential Market
10 Multiple Sclerosis $500M to $2B+ Potential Market *Data on this slide is based on US only. Based on internal company estimates. $500M to $2B+ $500M to $2B+ Potential Market Potential Market
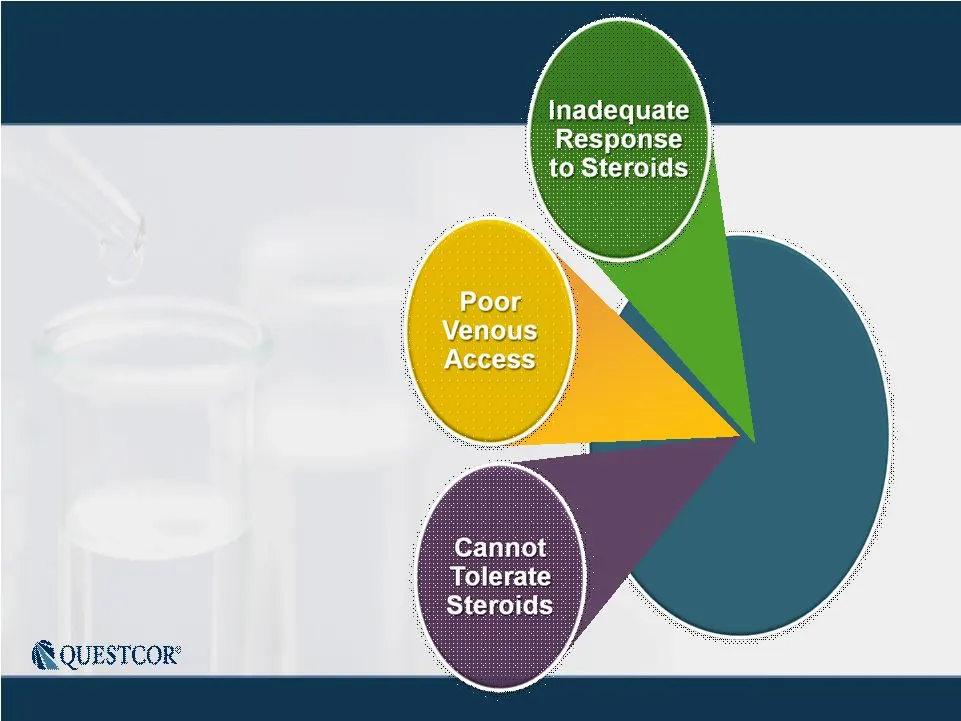
Slide 11: Acthar and MS
11 Acthar and MS Acthar when “Steroids are not suitable” • Acute treatment • Treatment for 1-2 weeks (based on prescription data) • $40K-$50K/Rx Acthar when “Steroids are not suitable”
Slide 12: MS Trends
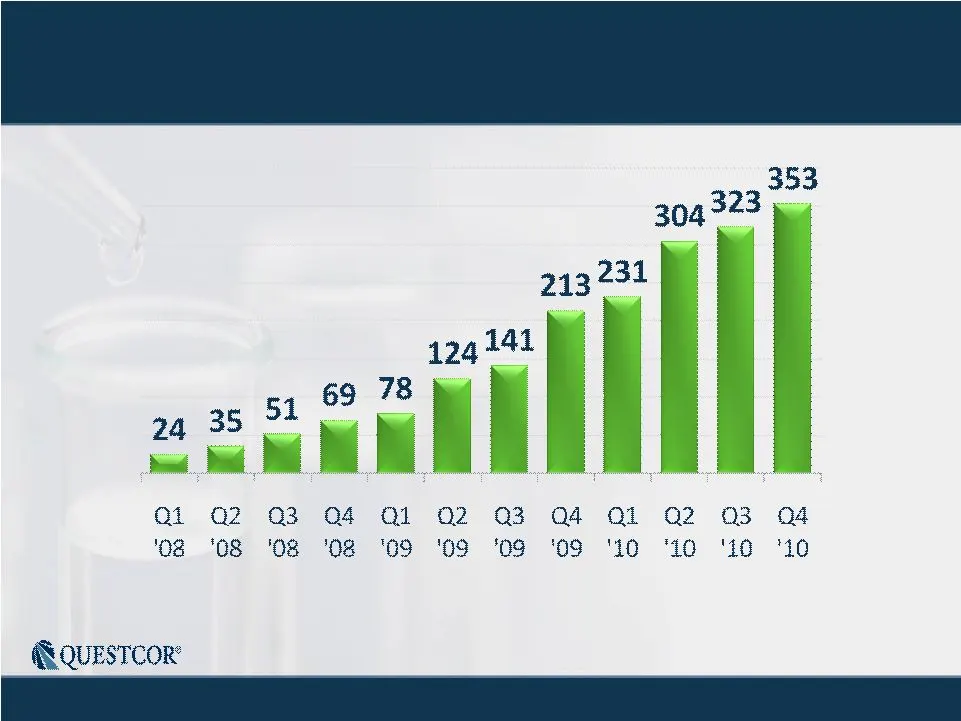
12 • Q4-2010 results – Q4-10 new paid Rxs up 66% vs. Q409 – MS sales over 50% of QCOR sales – Over $65M annualized run rate – Approximately one in six Rxs is a repeat patient • Growing number of Acthar prescribers – But only <400 out of 8,000 neurologists • Speakers bureau growing MS Trends • Q4-201
Slide 13: MS Sales - Record of Consistent Growth
13 MS Sales - Record of Consistent Growth New Paid Rxs Notes: Historical trend information is not necessarily indicative of future results. Chart includes "Related Conditions" - diagnoses that are either alternative descriptions of the condition or are closely related to the medical condition which
Slide 14: MS Sales Calls vs. New Paid Rxs
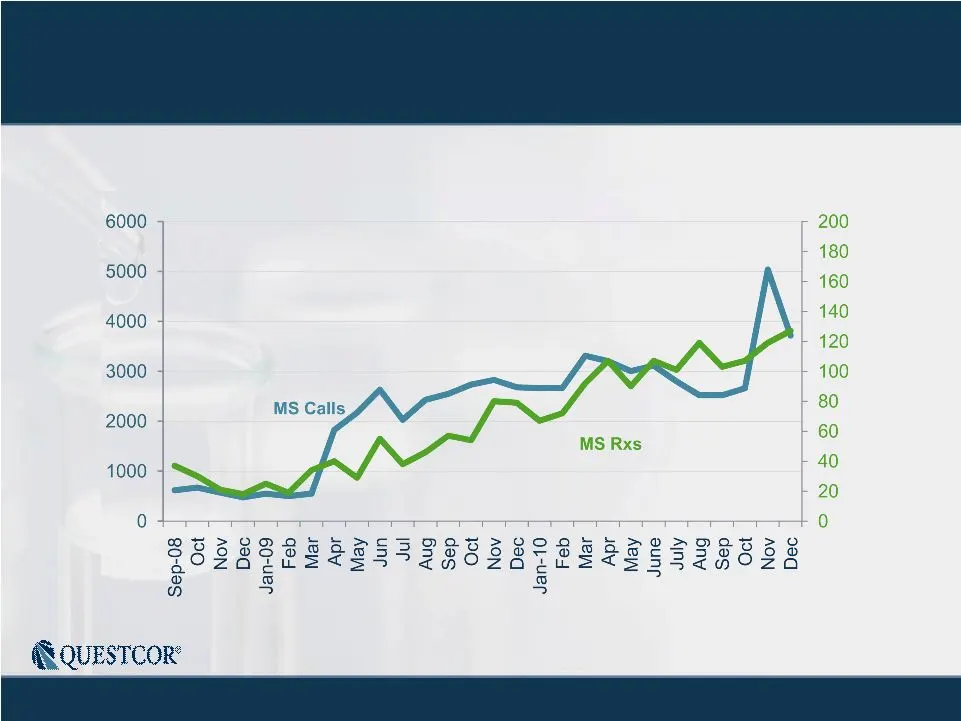
14 MS Sales Calls vs. New Paid Rxs *MS call data approximate
Slide 15: Sales Force Expansion
15 • Doubled sales force: hiring/training Aug-Oct 2010 (38 to 77 sales reps) • Newly expanded sales force began call activity Nov 1 – Significant increase in MS-treating neurologists targeted for sales calls – Now also targeting child neurologists for sales calls Sales Force Expansion • Doubled sale
Slide 16: Infantile Spasms
16 • Devastating, refractory form of childhood epilepsy – Very poor developmental outcome if inadequately treated • Not responsive to standard anti-epileptic drugs • Ultra-rare orphan disorder – 1,500 to 2,000 patients annually • Typically occurs in children less than 2 years old • Characterized by
Slide 17: Acthar and IS
17 • Used by over half of child neurologists • FDA approval 10/15/10 – 7 year orphan exclusivity for IS indication • Crisis therapy • Treatment for 2-4 weeks (based on prescription data) – In a randomized, single-blinded, controlled study, 87% of patients achieved overall response (no spasms and no
Slide 18: IS Sales Plan
18 • Significant quarterly variability • Q4-2010 sales within historic range • Promotion effort began 11/1/10 • Potential to increase IS revenue – Acthar currently used to treat 30-50% of IS patients IS Sales Plan • Significant quarterly variability • Q4-2010 sales within historic range • Promotion
Slide 19: Nephrotic Syndrome
19 • Characterized by excessive spilling of protein from the kidney into the urine (proteinuria) • Can result in end-stage renal disease (ESRD), dialysis, transplant • Significant unmet need – Few treatment options Nephrotic Syndrome • Characterized by excessive spilling of protein from the kidney i
Slide 20: Acthar and NS
20 • Single application treatment for reduction of proteinuria in: – Membranous nephropathy (on-label) – Lupus nephritis (on-label) – Focal segmental glomerular sclerosis (FSGS) (on-label) – Diabetic nephropathy (not on-label) • Treatment for 4-6 months (based on prescription data) • $150K-250K/Rx A
Slide 21: Proof of Concept Data
21 • Available November 2010 • Case series showed response from Acthar for refractory idiopathic membranous nephropathy (on-label) – 9 of 11 patients met response criteria • Positive signal received in diabetic nephropathy trial (not on-label) – 9 of 15 patients on Acthar met response criteria and n
Slide 22: R&D Effort in NS
22 • Dose ranging trial for idiopathic membranous nephropathy – $5-7M multi-center trial, n=100 – Reduction of proteinuria is endpoint • Presently designing a study in collaboration with FDA for diabetic nephropathy – Dose ranging trial – If successful, Phase III trial would follow R&D Effort in NS
Slide 23: NS Business Plan
23 • Nov 2010 ASN meeting – First meeting with commercial team presence – Data presented via podium/posters – 30+ doctor advisory board meeting • Hired/hiring 5 reps to sell Acthar to nephrologists – Develop selling process and generate sales – Expand sales force if sales increase NS Business Plan •
Slide 24: Immediate Acthar Growth Opportunities
24 • MS - Build on sales momentum, lots of market headroom • IS - Incremental market share growth • NS - Establish Acthar as a therapeutic alternative in this sizeable market Immediate Acthar Growth Opportunities *Represents estimated net sales market opportunity based on internal company estimates
Slide 25: Financials
25 Financials Profitable Debt Free Cash Flow Positive Profitable Debt Free Cash Flow Positive
Slide 26: Quarterly Results - Q3 2010
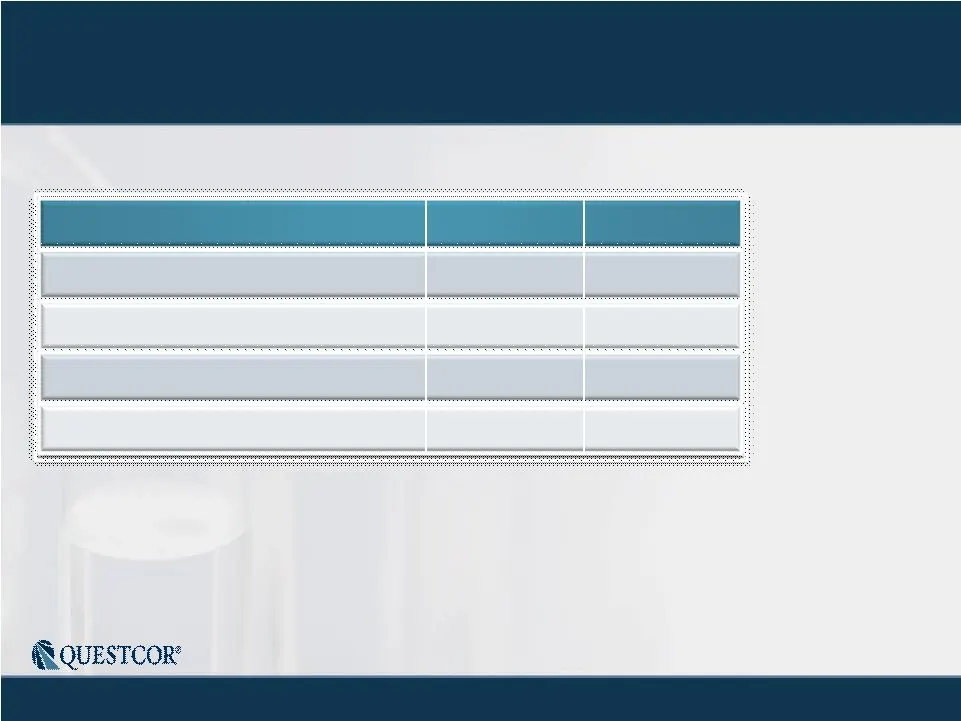
26 Quarterly Results - Q3 2010 Net Sales ($M) Gross Margin Operating Inc ($M) EPS $31.3 93% $16.8 $0.18 $13.9 86% $1.8 $0.02 Q3 - 2010 Q3 - 2009 Record Sales and Solid Earnings Net Sales ($M) Gross Margin Operating Inc ($M) EPS $31.3 93% $16.8 $0.18 $13.9 86% $1.8 $0.02 Q3 - 2010 Q3 - 2009 Record Sa
Slide 27: Preliminary Q4 Information
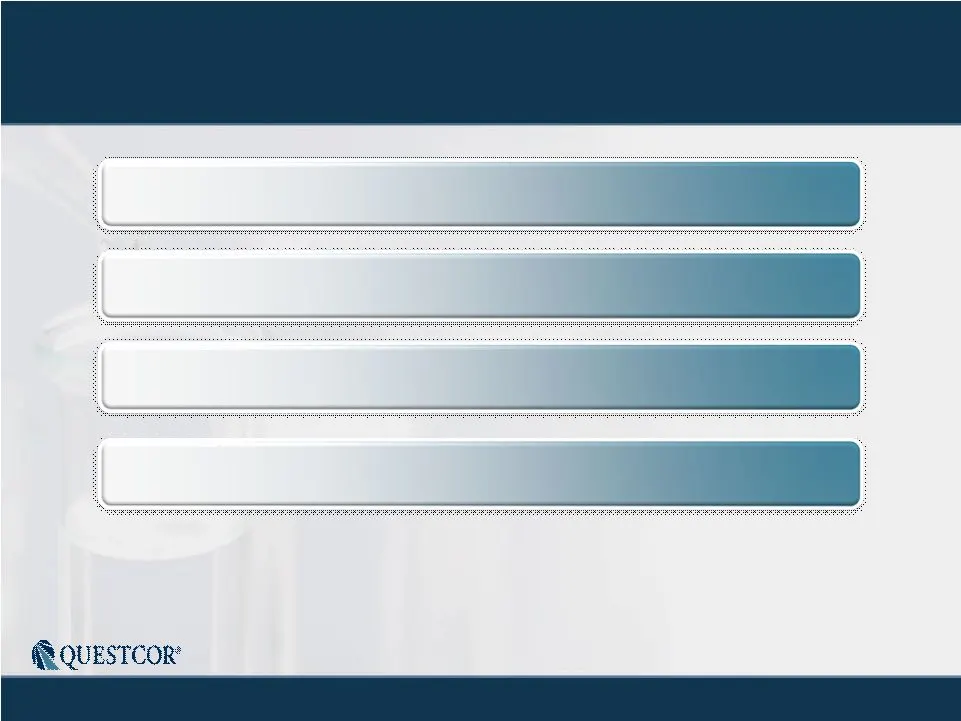
27 Up several million $ vs Q3-10 Up 66% vs Q409 Within historic range Promotion effort starting now 91 new/paid IS Rxs Preliminary Q4 Information 353 new/paid MS Rxs 7 new/paid NS Rxs Expenses Up several million $ vs Q3-10 Up 66% vs Q409 Within historic range Promotion effort starting now 91 new/pai
Slide 28: Questcor is Cash Flow Positive
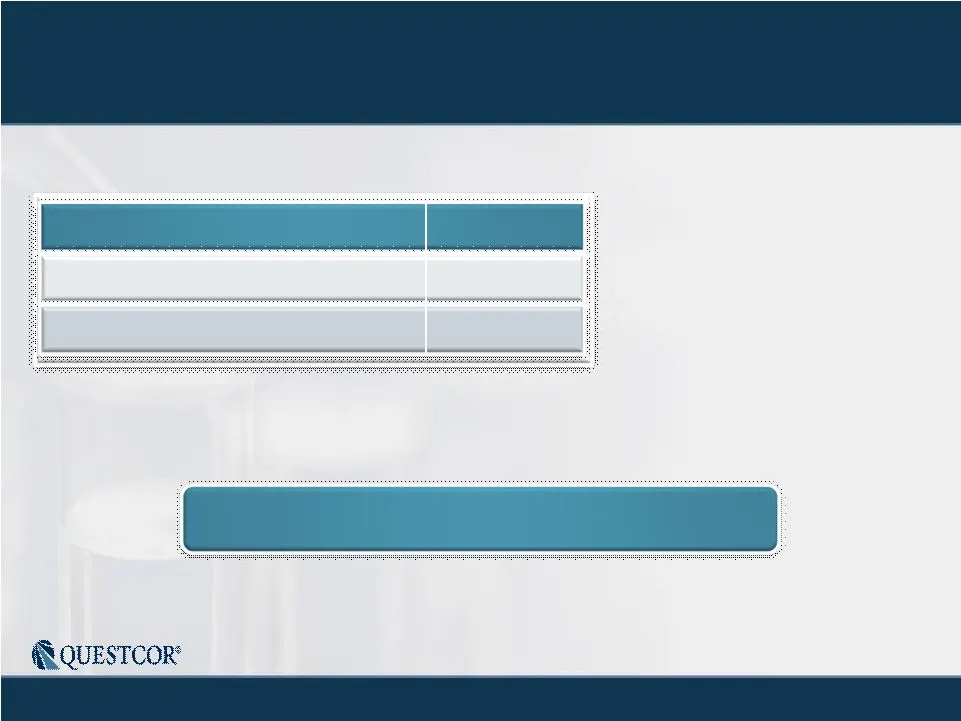
28 Questcor is Cash Flow Positive Debt-free balance sheet Cash / ST Investment Accounts Receivable $115m* $11m 12/31/10 Debt-free balance sheet *After return of $67 million of cash to shareholders through share repurchases. Cash / ST Investment Accounts Receivable $115m* $11m 12/31/10
Slide 29: Go Forward Plan - Sell More Acthar
29 • Expanded sales force to pursue MS/IS • Dedicated pilot NS sales team starting January 2010 • Develop other markets for Acthar – Acthar is its own pipeline with 15 other on-label and many possible other therapeutic uses – Further defining and developing the unique characteristics of Acthar • No
Slide 30: Investment Highlights
30 • Questcor is streamlined, focused & profitable • Acthar has sustainable competitive advantages • Focus on substantial growth in MS sales • Recent IS approval/label modernization • Significant upside with NS • Market sizes have good growth potential • Cash flow positive/no debt Investment Highlig
Slide 31: January
NASDAQ: QCOR J A N U A R Y 2 0 1 1 NASDAQ: QCOR J A N U A R Y 2 0 1 1
Slide 32: Questcor
(§ QUESTCOR
Source: SEC EDGAR · 8-K filed Jan 10, 2011
More decks from Questcor Pharmaceuticals Inc
 FY2013 Earnings Presentation19 slides · Mar 3, 2014
 J.P. Morgan Healthcare Conference 201444 slides · Jan 13, 2014
 Oppenheimer Healthcare Conference 201337 slides · Dec 11, 2013
 Q3 2013 Earnings Presentation17 slides · Nov 4, 2013
 Q2 2013 Earnings Presentation14 slides · Aug 6, 2013
 Investor Presentation (August 2013)29 slides · Aug 6, 2013