Bridge Capital — Sandler O'Neill 2009 West Coast Financial Services Conference
15 slides from Bridge Capital's conference presentation, Mar 3, 2009

Slide 1: Sandler O'Neill 2009 West Coast Financial Services Conference
Sandler O’Neill 2009 West Coast Financial Services Conference Thomas A. Sa Executive Vice President Chief Financial Officer March 3, 2009

Slide 2: Forward-Looking Statements
Forward-Looking Statements Certain matters discussed herein constitute forward-looking statements within the meaning of the Private Securities Litigation Reform Act of 1995, and are subject to the safe harbors created by that Act. Forward-looking statements describe future plans, strategies, and exp
Slide 3: Why Are We Different?
Why Are We Different? Business banking focus True business line diversification commercial technology structured finance cash management i nternational trade services construction Positioned to endure economic cycle Solid core business despite significant headwinds Proactive risk recognition and man

Slide 4: Bridge Bank Franchise
Bridge Bank Franchise Funding-driven approach to building the business Experienced, disciplined board and management Disciplined execution of our business plan No direct subprime exposure Limited exposure to construction and land Full range of corporate banking products delivered through experienced
Slide 5: Markets
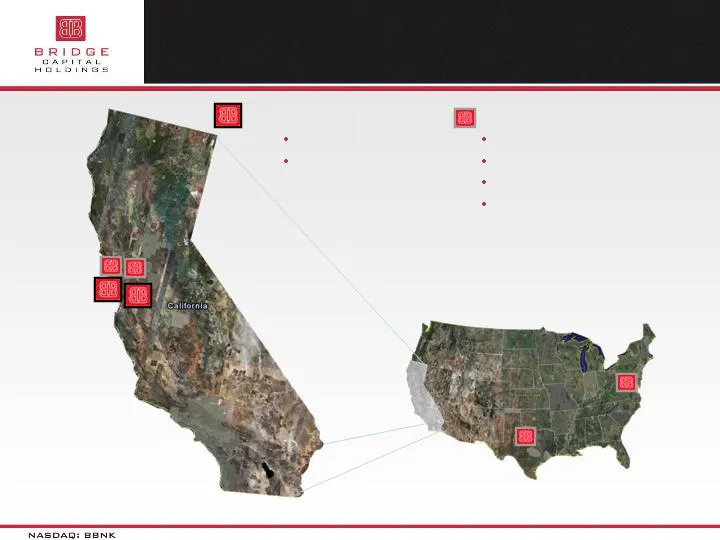
Markets REGIONAL OFFICES San Jose (Main) Palo Alto BUSINESS OFFICES East Bay (C&I) Dallas, TX (tech) Reston, VA (tech) San Francisco (tech)
Slide 6: Market Conditions
Market Conditions Geographic Population 3.9 million 1 (+1.9% since ’00) San Jose 10 th largest US city Among highest median family and per capita incomes in US 3 Unemployment 6.9% 4 Santa Clara County housing market (-33.6%) 5 Business $99b deposit market 6 Largest concentration of technology expert
Slide 7: Balance Sheet Growth
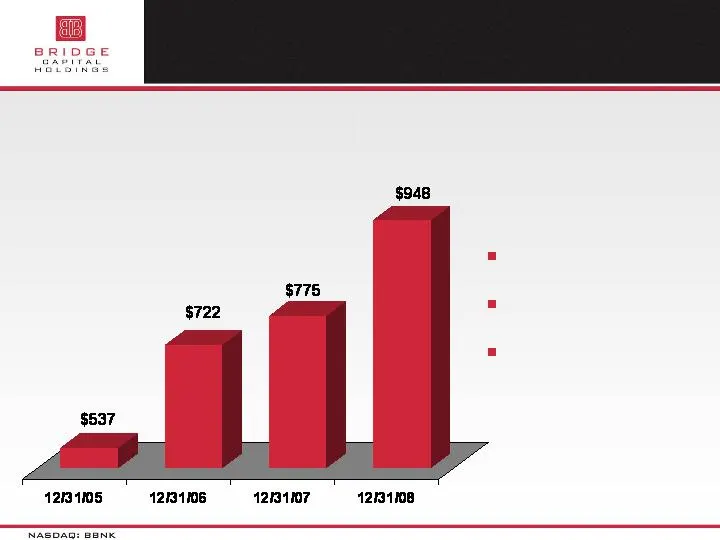
Balance Sheet Growth Total Assets in Millions (EOP) 20.9% CAGR (3 Years) Purely organic growth Consistent leverage
Slide 8: Focus on Core Funding Sources
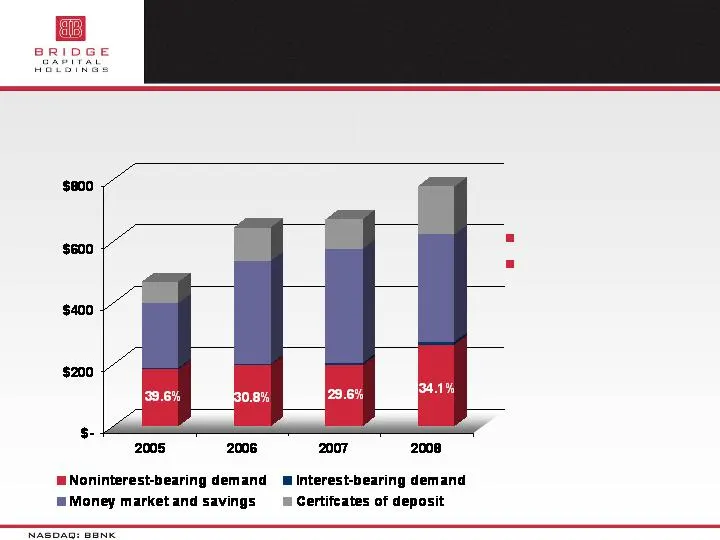
Focus on Core Funding Sources $ millions Deposit Mix 80%+ Core Deposits 18.4% CAGR (3 Years)
Slide 9: Diversification of Lending Activity
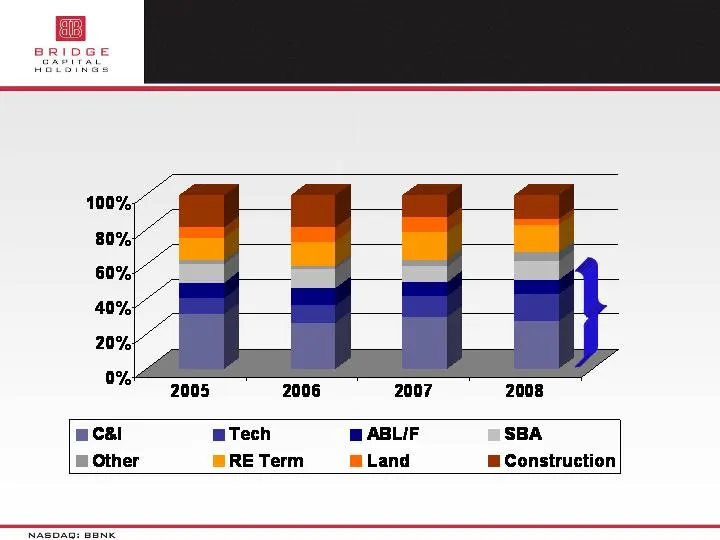
Diversification of Lending Activity Loan Mix Approximately 50% non- real estate
Slide 10: Strategic Positioning
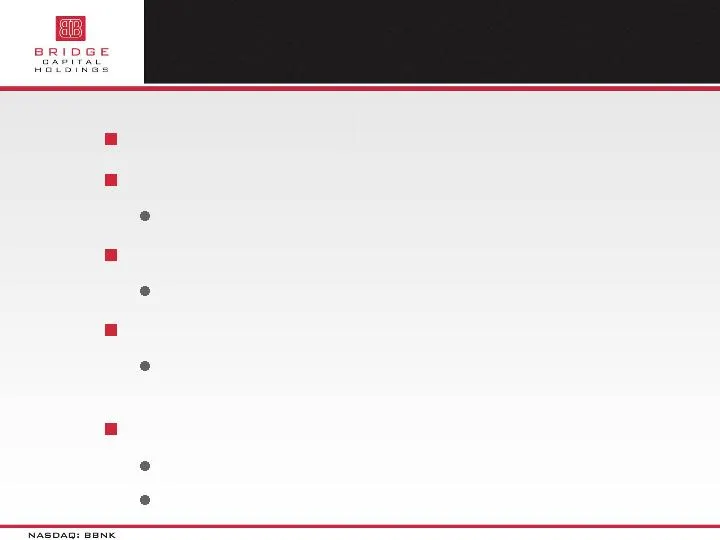
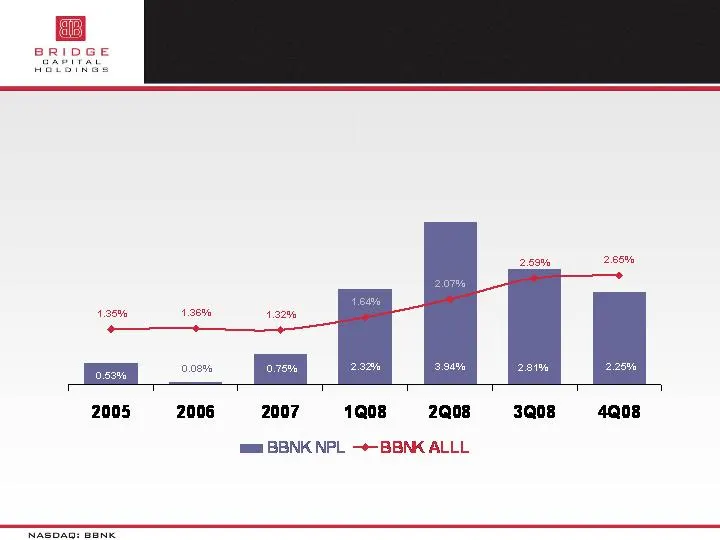
Strategic Positioning Reduction of CRE Exposure Significant Reserve Build More than doubled to 2.65% of loans $30 Million Capital Raise Carpenter Community BancFund $24 Million TARP Investment U.S. Department of Treasury's Capital Purchase Program Well-Capitalized Institution Risk-based capital rati
Slide 11: Proactive Credit Risk Management
Proactive Credit Risk Management Percentage of Total Loans
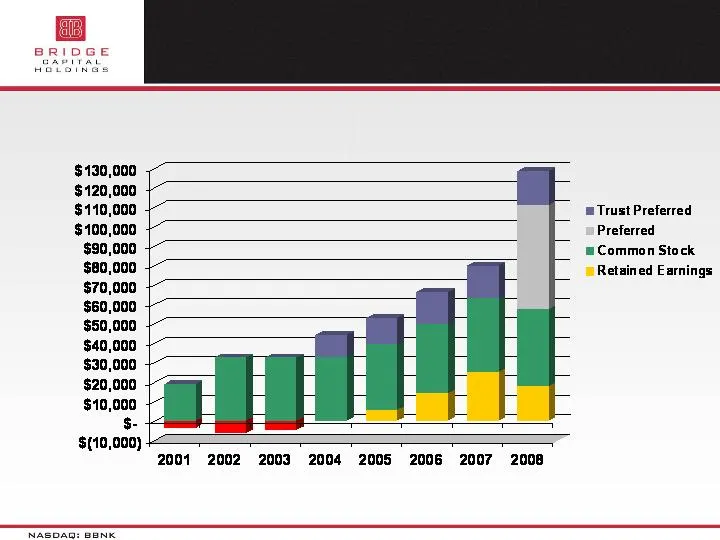
Slide 12: Capital Sources to Fund Growth
Capital Sources to Fund Growth 12-31-08

Slide 13: Compelling Capital Position
Compelling Capital Position 10.54% 11.67% 10.66% 8.40% $88,632 $80,024 12-31-07 ($000’s) 12-31-08 ($000’s) Tier 1 capital $109,221 Total capital $138,725 Tier 1 capital ratio Total risk based capital Leverage ratio Equity / Assets 13.31% 16.90% 12.36% 11.87% *Includes $30 million private and $23.8 m

Slide 14: Comparative Strength
Comparative Strength True loan portfolio diversification No direct subprime mortgage programs Proactive and aggressive risk management Limited exposure ... … and positioned to endure economic cycle. Strong commitment to reserves @ 2.65% of gross loans Compelling capital position Strong core deposit
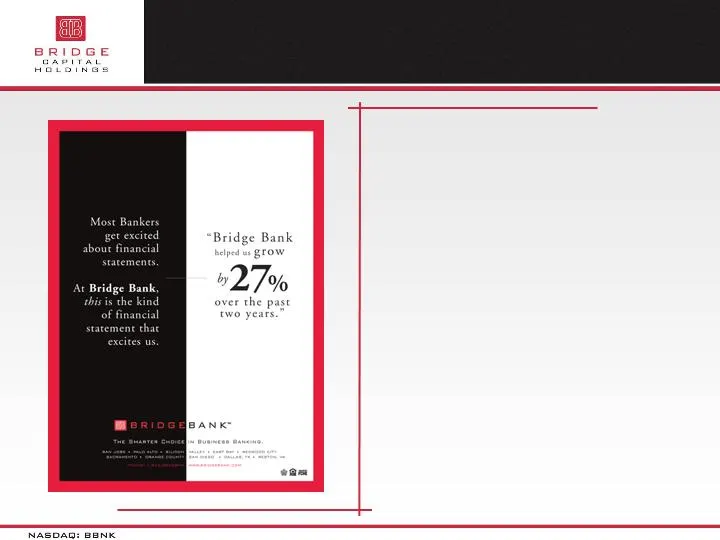
Slide 15: Thank You
Thank You Questions & Answers
Source: SEC EDGAR · 8-K filed Mar 3, 2009
More decks from Bridge Capital Holdings
 Merger or Acquisition (March 2015)11 slides · Mar 9, 2015
 Q4 2014 Earnings Presentation22 slides · Feb 4, 2015
 Q2 2014 Earnings Presentation23 slides · Jul 29, 2014
 Shareholder Meeting (May 2014)19 slides · May 28, 2014
 Q1 2014 Earnings Presentation23 slides · May 13, 2014
 Q4 2013 Earnings Presentation24 slides · Feb 5, 2014